
3
The Cancer Burden in Low- and Middle-Income Countries and How It Is Measured
Each year, 5 million people in low- and middle-income countries (LMCs) die from cancer, about 10 percent of the 50 million deaths in those countries. This proportion, and the total burden of cancer,1 will continue to grow as the tobacco-induced cancer epidemic accelerates, and as the world population ages. Looked at another way today, of the 7 million cancer deaths in the world, 5 million are in LMCs. Despite this fact, cancer is not recognized as a high-priority health problem in most of these countries. Where children are dying from malaria and other infectious diseases and suffering the many consequences of malnutrition, where women die in childbirth, and where young adults are dying of AIDS, people with cancer—many dying slowly in their homes—attract less attention. However, the latter half of the 20th century witnessed major reductions in infant and childhood deaths even in the poorest countries, making cancer and the major noncommunicable diseases more prominent in the burden of disease. They now co-exist with the still heavy burden of common infectious diseases and are destined to continue growing in relative importance.
This chapter briefly reviews the major shifts in mortality during the latter half of the 20th century, and then describes what is known of the current cancer burden in LMCs. The final section describes the sources of
data on the global cancer burden and discusses priorities for improving the information base. Cancer mortality, incidence, survival, and risk factor surveillance for cancer and other chronic diseases are highlighted (see Box 3-1 for definitions).
WORLDWIDE CHANGES IN MORTALITY PATTERNS
The decline of childhood mortality in developing countries is one of the most significant public health achievements of the 20th century. In 1950, nearly one-quarter of all children born died before their fifth birthday, most in infancy (Table 3-1). Today, about 8 percent will die before age 5. Much of the improvement is due to vaccinations against childhood infections, antibiotics against a wide range of bacterial infections, oral rehydration therapy for diarrhea, and in some places, generally improved living conditions. The upshot is that many more people are surviving to adulthood and old age—even in developing countries. This means more will eventually die from cancer, cardiovascular disease, chronic respiratory disease, diabetes, or another chronic condition of adulthood.
Today’s infants—about 130 million born each year—will experience a much different pattern of deaths than those born in the past century (Table 3-2)—assuming current patterns in risk factors. More than half will live to age 70 and older. Nearly one-third (40 million of each year’s birth cohort), however, will die in middle age, between ages 35 and 69. Most of these deaths will be from chronic, noncommunicable diseases. As many as half of these “premature” deaths could be prevented if patterns in major risk factors were modified, allowing people to live longer and die in old age. Specifically for cancer, the most practicable measures involve reversing the increases in smoking prevalence; preventing liver cancer through infant vaccination against hepatitis B virus (HBV); and preventing cervical cancer through a combination of vaccination against the cancer-causing human papillomaviruses, or HPVs, (as vaccines become available and affordable) and screening for precancerous or early stages.
The importance of cancer as a cause of illness and death will continue to grow, even with effective preventive measures. Appropriate cancer management—diagnosis and treatment—can extend the lives of many, particularly if diagnosed early. For those eventually dying from cancer (and other causes of death that involve chronic pain and other symptoms), at whatever age, palliative care with good pain control can vastly improve the quality of life of the patient and his or her family.
|
BOX 3-1 Basic Cancer Population Statistics Defined Cancer Incidence Cancer incidence is the number of new cases occurring in a population, expressed either as an absolute number or as a rate. The incidence rate per 100,000 people per year approximates the average risk of developing cancer in a given year and is often used to compare rates over time or across populations. Measurement of incidence rates requires the identification of all new cases of cancer in a defined population, usually in a defined geographic region. The most basic cancer incidence reporting includes information about the person (age, sex, ethnicity) and about the cancer (the date of detection, anatomic site, histology, and the most valid diagnostic method used). The stage of disease at diagnosis (i.e., the extent of disease according to standard definitions) is also a valuable piece of information. Cancer Mortality Cancer mortality refers to the number of deaths attributed to cancer in the population, and the cancer mortality rate is the number of deaths per 100,000 people per year. These statistics are usually reported as rates, relating the number of deaths to the underlying population (i.e., the census population). As with incidence, reports can be more and less detailed, but information about the person (age, sex, ethnicity) and the cancer (anatomic site) is very useful. Mortality is the product of the incidence and fatality from cancer. Fatality is the proportion of people with cancer who die in a given time period, usually a year. It conveys the risk that an individual with cancer will die, while the mortality rate describes the average risk of dying from cancer in the population. Mortality rates are often used as proxies for cancer incidence, especially where incidence data are not available. For cancers with a poor prognosis everywhere, mortality may, indeed, mirror incidence, and comparisons made across time and place may be valid. In places where people are unlikely to receive curative treatment, even for cancers otherwise considered “curable,” mortality may also be a surrogate for incidence, but comparing across areas may not be straightforward. A statistic derived from cancer mortality is person-years of life lost (PYLL), which weights deaths at different ages: Death at a young age results in more PYLLs than death in old age. PYLL can be modified further by adding aspects of quality of life, such as a year spent in extreme pain would result in loss at a fraction of a “quality-adjusted life-year” or QALY. |
|
Cancer Survival Cancer survival describes the proportion of individuals with cancer who are still living for defined periods after diagnosis, often aggregated by type of cancer, age group, sex, and place of residence. This statistic is often referred to as the “survival rate,” although it actually describes an individual’s probability of being alive, and not actually a rate. Cancer survival statistics are derived by calculating the proportion of people originally diagnosed with a type of cancer who are still alive at specified points after diagnosis, such as 1-year survival. For many cancers, 5-year survival is synonymous with “cure,” because relatively few of those surviving 5 years go on to die from the cancer (breast cancer is the most important exception). Survival is influenced strongly by the stage of disease at diagnosis and the availability of effective treatment. If no adjustment for stage at diagnosis is made in calculating survival, people diagnosed at earlier stages will appear to have better survival than those diagnosed with later stage disease, regardless of treatment, but this is simply a statistical artifact. But for cancers for which effective treatments exist, early detection and treatment means a real survival advantage. If existing treatments are not very effective (e.g., for pancreatic cancer, lung cancer, and stomach cancer) or if the person does not have access to medical services, the stage of disease makes little difference in survival. Survival is, therefore, a crude measure of the effectiveness and/or availability of cancer treatment. Cancer Prevalence Cancer prevalence indicates the number of people alive with cancer in a population. Unlike incidence and mortality, there is no standard definition of a prevalent cancer case. The most appropriate definition may depend on how the information is going to be used. One approach is to count people with cancer who are in active treatment or follow-up, which has strong economic effects. As a practical matter, this has been interpreted by some as cases within 5 years of diagnosis. However, many cancer survivors live with long-term effects of the disease itself and the treatments, some of which require further management, so an argument could also be made for a more inclusive definition. Cancer prevalence can be calculated from cancer registries with good long-term follow-up, or the more usual, estimated from incidence and survival data. |
TABLE 3-1 Worldwide Childhood Mortality, 1950–2000
|
Year of Birth |
Percentage Dying Before Age 5 |
|
1950–1954 |
23 |
|
1970–1974 |
14 |
|
1990–1994 |
9 |
|
2000–2004 |
8 (about 10 million of 130 million born each year) |
TABLE 3-2 Approximate Distribution of Deaths by Age Group of Those Dying in the Early 21st Century and Anticipated for Those Born in the Early 21st Century
|
Age Range |
Deaths Each Year in Early 21st Century |
Future Deaths of Those Born in Early 21st Century |
|
0–34 (children and young adults) |
20 milliona (33%) |
20 million (15%) |
|
35–69 (middle age) |
20 million (33%) |
40 millionb (30%) |
|
70+ (old age) |
20 million (33%) |
70 million (54%) |
|
TOTAL |
60 million |
130 million |
|
aIn 2001, there were 7 million deaths (out of 56 million), but this number is increasing because of deaths from AIDS. bDeaths at ages 35–69 (in 2035–2069) will be mainly from noncommunicable disease: cardiovascular diseases, cancer, chronic respiratory diseases, etc. SOURCE: Personal Communication, R. Peto, University of Oxford, June 2006. |
||
BASIC CANCER STATISTICS
In 2002, about 11 million new cases of cancer occurred and about 7 million people died of cancer worldwide. LMCs account for more than 80 percent of the world’s population, 72 percent of the world’s cancer deaths, 78 percent of years of life lost (YLL), and 77 percent of disability-adjusted life-years (DALYs) (Table 3-3).
Cancer becomes relatively more important as other causes of premature death decline. This leads to substantial variation in the proportion of deaths attributable to cancer in different parts of the world and at different income levels. In 2002, cancer accounted for 12.5 percent of deaths worldwide, but just over 25 percent of all deaths in the low-mortality countries of Europe. In contrast, among the highest mortality countries of Africa, 3.6 percent of deaths were from cancer, and in the highest mortality countries of Southeast Asia, 7.1 percent (World Health Organization, 2003). Deaths from
TABLE 3-3 Deaths, Years of Life Lost (YLL), and Disability-Adjusted Life Years (DALYs), All Causes and Cancers by Country Income Level, 2002 (all figures in millions)
|
|
All Causes of Death |
Cancer |
|||||
|
|
Deaths |
YLLa |
DALYsb |
Deaths |
YLLa |
DALYsb |
Population |
|
Country Income Level |
|||||||
|
Low |
28.5 |
606.4 |
877.7 |
1.8 |
20.8 |
21.4 |
2,560,762 |
|
Lower middle |
17.2 |
221.0 |
402.6 |
2.7 |
29.4 |
30.3 |
2,214,697 |
|
Upper middle |
3.4 |
42.2 |
90.4 |
0.6 |
5.9 |
6.3 |
513,406 |
|
High |
7.9 |
52.4 |
118.7 |
2.1 |
15.4 |
17.4 |
933,917 |
|
All LMCs |
49.1 |
869.6 |
1,370.7 |
5.1 |
56.1 |
58.0 |
5,288,865 |
|
World |
57 |
922.5 |
1,490.1 |
7.1 |
71.6 |
75.5 |
6,224,985 |
|
LMC share of global burden |
86% |
94% |
92% |
72% |
78% |
77% |
85% |
|
aThe component of the DALY that measures years of life lost by a population due to premature mortality. b A measure of the gap in healthy years of life lived by a population as compared with a normative standard. SOURCE: Data from World Health Organization (2006). |
|||||||
communicable diseases, maternal and perinatal conditions, and nutritional deficiencies are of greater importance as the income level is lower, but cancer still occupies a prominent place in the overall statistics (Table 3-4).
Clearly, cancer is not rare anywhere, even where other health problems are more pressing, but significant variations exist (Figure 3-1). For men, cancer incidence is highest in North America, with an age-standardized rate of about 400 per 100,000, or an 18 percent risk of developing cancer by age 65. The risk of dying from cancer is highest for men in Eastern Europe, at about 200 per 100,000, and the cumulative risk of dying before age 65 is about 10 percent. For women, incidence is also highest in North America, at about 300 per 100,000, while cancer mortality is highest in East Africa, at about 120 per 100,000. As with all age-standardized international comparisons, the data are adjusted for differences in population age distribution—which is heavily influenced by birth rates and mortality from other diseases—by applying age-specific rates from the country in question to a “standard” population in order to focus on comparable cancer risks and rates for individuals within a population.
Patterns of Cancer in LMCs
Knowing approximately how many cancers are occurring in a population, the distribution of types, and who is being affected are essential for
TABLE 3-4 Deaths by Cause, Sex, and Age, 2001 (thousands)
|
|
Low- and Middle-Income Countries |
World |
||||||||
|
|
Males |
Females |
M + F |
M + F |
Males |
Females |
||||
|
Cause |
0–29 |
30–69 |
0–29 |
30–69 |
Total |
Total |
0–29 |
30–69 |
0–29 |
30–69 |
|
All causes |
7,975 |
10,853 |
7,437 |
7,312 |
48,351 |
56,242 |
8,117 |
12,263 |
7,515 |
8,088 |
|
Communicable, maternal, perinatal, and nutritional conditions |
5,797 |
2,532 |
5,956 |
1,829 |
17,613 |
18,166 |
5,822 |
2,598 |
5,977 |
1,862 |
|
Noncommunicable diseases |
871 |
6,699 |
827 |
4,810 |
26,023 |
32,891 |
915 |
7,871 |
859 |
5,495 |
|
Malignant neoplasms |
111 |
1,691 |
95 |
1,255 |
4,955 |
7,021 |
121 |
2,186 |
101 |
1,597 |
|
Injuries |
1,307 |
1,623 |
654 |
673 |
4,715 |
5,186 |
1,379 |
1,792 |
678 |
730 |
|
Percentage of deaths from cancer |
1.4 |
15.6 |
1.3 |
17.2 |
10.2 |
12.5 |
1.5 |
17.8 |
1.3 |
19.7 |
|
SOURCE: Lopez et al. (2006). |
||||||||||
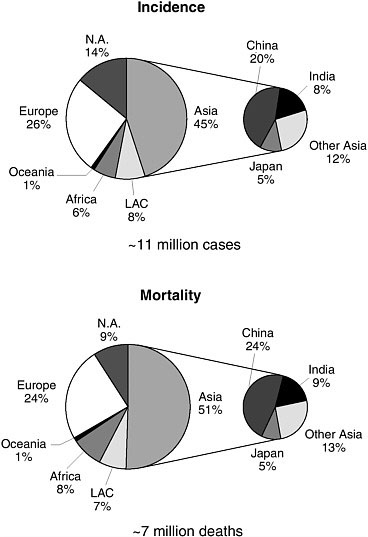
FIGURE 3-1 Cancer incidence and mortality by geographic area, 2002.
LAC = Latin America and the Caribbean.
SOURCE: Reprinted, with permission, from Parkin et al. (2005). Copyright 2005 by Lippincott Williams & Wilkins.
understanding the burden that cancer imposes on society. Any attempt to assess needs and priorities in health logically starts with an examination of the extent of the problem, and cancer is no exception. How important is cancer? Who in the population is most affected? Is the burden of disease from cancer increasing or decreasing? How does it compare with other health problems along these dimensions? Unfortunately, health statistics are poor where health problems are most severe.
More so than for other health conditions, however, enormous effort goes into constructing best estimates for cancer incidence and mortality for every country on the globe. The International Agency for Research on Cancer (IARC, an agency of the World Health Organization, or WHO) is the source of the most widely respected global cancer database, GLOBOCAN. WHO compiles vital and health statistics for all countries and all causes of death. The statistics presented in this chapter come from these two sources. They are considered broadly accurate and indicate the magnitude of the cancer burden in LMCs, though they are mainly estimates, made in the absence of directly collected data, particularly in the lowest income countries. The status of direct data collection in LMCs is reviewed later in this chapter.
The mix of common cancers varies between high-income and low- and middle-income countries (Figure 3-2 and Tables 3-5 and 3-6), and among LMCs in different parts of the world. The patterns vary by geography and economic status, which correlate roughly with the causes of cancer in the “environment” in its broadest sense. Genetic variation plays a lesser role overall. The majority of cancers in more developed countries are those associated with more affluent lifestyles—cancers of the lung, colon and rectum, breast, and prostate. All except lung cancer have a reasonably good prognosis where comprehensive cancer management is available. In contrast, cancers of the liver, stomach, esophagus, and cervix—all related to infectious agents—are relatively more common in developing countries. Where treatment is largely unavailable, all cancers have a poor prognosis, but in this group, all but cervical cancer have poor outcomes everywhere (Parkin et al., 2005).
Differences in rankings between developed and developing countries in both incidence and mortality are broadly explicable by differences in exposures, both to infectious and environmental agents, and the availability of medical care.
Stage Distribution of Cancers at Diagnosis
Most cancers in LMCs are detected at later stages than in high-income countries. Although this is the common wisdom and too logical to dispute, the actual evidence on which to judge this is sparse. Population-based data are not available, but a number of hospital-based studies have been published that report the cancer stage distribution of patients at those hospitals. Table 3-7 is a compilation of these studies for breast cancer. The percentage of advanced cancers ranges from 30 to 98 percent.
CANCER TRENDS AND CURRENT STATUS OF COMMON CANCERS
Over time—mostly over fairly long periods of years and decades—certain cancers become more or less common. This is known largely from
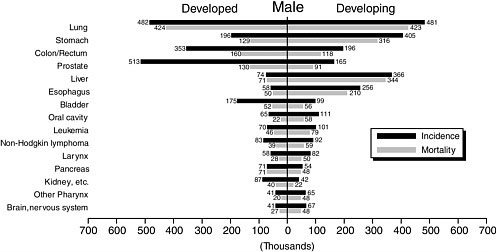
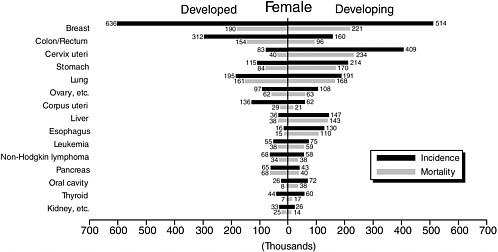
TABLE 3-5 Leading Cancers (Incidence) in Developing and Developed Countries, Males and Females, 2002 (thousands of cases)
|
|
Males |
Females |
||
|
Rank |
Developing |
Developed |
Developing |
Developed |
|
1 |
Lung (481) |
Prostate (513) |
Breast (514) |
Breast (636) |
|
2 |
Stomach (405) |
Lung (482) |
Uterine cervix (409) |
Colon/rectum (312) |
|
3 |
Liver (366) |
Colon/rectum (353) |
Stomach (214) |
Lung (195) |
|
4 |
Esophagus (256) |
Stomach (196) |
Lung (191) |
Uterine corpus (136) |
|
5 |
Colon/rectum (196) |
Bladder (175) |
Colon/rectum (160) |
Stomach (115) |
|
SOURCE: Parkin et al. (2005). |
||||
TABLE 3-6 Leading Cancers (Mortality) in Developing and Developed Countries, Males and Females, 2002 (thousands of deaths)
|
|
Males |
Females |
||
|
Rank |
Developing |
Developed |
Developing |
Developed |
|
1 |
Lung (423) |
Lung (424) |
Cervix uteri (234) |
Breast (190) |
|
2 |
Liver (344) |
Colon/rectum (160) |
Breast (221) |
Lung (161) |
|
3 |
Stomach (316) |
Prostate (130) |
Stomach (170) |
Colon/rectum (154) |
|
4 |
Esophagus (210) |
Stomach (129) |
Lung (168) |
Stomach (84) |
|
5 |
Colon/rectum (118) |
Liver (71) |
Liver (143) |
Pancreas (68) |
|
SOURCE: Parkin et al. (2005). |
||||
high-income countries and inferred for low- and middle-income countries. An exception is the relatively rapid rise in the incidence of Kaposi’s sarcoma associated with AIDS, most notably in Africa. Over longer periods, the most obvious trend is the steep climb in lung cancers that, with a decade or more delay, parallels the increases in manufactured cigarette smoking. The incidence of stomach cancer, on the other hand, has declined over at least the past 50 years in most high-income countries for reasons that are only partially understood. The current global toll in incidence and mortality for the common cancers is depicted in Figure 3-2. The recent global patterns of the common cancers (arranged by numbers of deaths in developing countries)2 are described below (based on Parkin et al., 2005).
TABLE 3-7 Proportion of Breast Cancer by Stage at Diagnosis in Selected LMCs
|
Region |
Country |
Number of Cases |
Stages Reported |
Stage I |
Stage II |
Stage III |
Stage IV |
Reference |
|
% |
% |
% |
% |
|||||
|
Asia |
Mumbai–India |
|
I–IV |
8 |
57 |
29 |
6 |
(Chopra, 2001) |
|
Trivandrum–India |
|
I–IV |
4 |
42 |
41 |
13 |
(Chopra, 2001) |
|
|
Pakistan |
566 |
I–IV |
17 |
33 |
33 |
17 |
(Malik, 2002) |
|
|
Hospital Kuala Lumpur–Malaysia |
774 |
I & II, III & IV combined |
40–50 |
|
50–60 |
|
(Hisham and Yip, 2004) |
|
|
University Malaya Medical Centre–Malaysia |
752 |
I & II, III & IV combined |
60–70 |
|
30–40 |
|
(Hisham and Yip, 2004) |
|
|
Africa |
South Africa–Black |
2,194 |
I–IV |
5 |
17 |
42 |
36 |
(Vorobiof et al., 2001) |
|
Tanzania |
50 |
|
0 |
2 |
88 |
10 |
(Amir et al., 1997) |
|
|
Nigeria |
124 |
I & II, III & IV combined |
44 |
|
56 |
|
(Anyanwu, 2000) |
|
|
Egypt |
400 |
I–III |
4 |
26 |
70 |
|
(Omar et al., 2003) |
|
|
Latin America |
Sao Paolo–Brazil |
1,796 |
I–IV |
10 |
22 |
53 |
14 |
(Schwartsmann, 2001) |
|
Porto Alegre–Brazil |
1,783 |
I–IV |
16 |
54 |
19 |
11 |
(Schwartsmann, 2001) |
|
|
Lima–Peru |
9,003 |
I–IV |
9 |
42 |
33 |
16 |
(Schwartsmann, 2001) |
|
|
Range (%) |
|
|
|
2–70% |
|
30–98% |
|
|
|
SOURCE: Barton et al. (2005). |
||||||||
Lung Cancer
Lung cancer tops the list for cancer incidence and mortality in the world population and among men. It has been the most common cancer since 1985, with 1.35 million cases in 2002, representing 12.4 percent of all new cancers. The 1.18 million lung cancer deaths comprise 17.6 percent of all cancer deaths in that year. Lung cancer is about three times more common among men than women (35.5/100,000 versus 12.2/100,000, age-standardized rates). Half (49.9 percent) of the cases now occur in developing countries; just 20 years ago, the corresponding figure was 31 percent. The explanation for the current distribution of lung cancer around the world and the differences between men and women is no mystery. Nearly all cases are caused by cigarettes and other tobacco smoking although there are localized exceptions, such as smoke from indoor cooking fires as a significant risk for lung cancer among women in parts of China.
The 44 percent increase in lung cancer cases among men is due to population growth and aging. The age-standardized incidence rate has actually declined slightly since 1985. The 76 percent increase in cases among women, however, is due to those factors and to higher smoking rates, leading to a 22 percent increase in the age-standardized rate.
Lung cancer is at once one of the most deadly common cancers—average 5-year survival in Europe is 10 percent, barely better than the 8 to 9 percent in developing countries—and the most preventable.
Stomach Cancer
Stomach cancer ranks fourth in incidence worldwide, but because of its lethality, second among causes of cancer death. The distribution is highly specific geographically. China has the highest rates and 42 percent of worldwide cases. Other high-risk areas are East Asia (including Japan and Korea), Eastern Europe, parts of Central and South America, and Central Africa. Rates are low in South Asia, North and East Africa, North America, and Australia and New Zealand.
Survival from stomach cancer is very low in developing countries (6 percent 5-year survival in sub-Saharan Africa). Japan has the highest survival rate by a wide margin, at 52 percent, a result of mass screening and early detection since the 1960s. The most significant risk factor for stomach cancer is infection with the bacterium Helicobacter pylori (which is the cause of most duodenal ulcers). Co-factors, probably diet related, must also be important, however. Some salt-preserved and pickled traditional foods and low intake of fresh fruits and vegetables, seem to be important. Tobacco smoking also increases the risk of stomach cancer.
For reasons that are poorly understood, stomach cancer rates have been declining steadily for more than 50 years in the United States and other
high-income countries. Worldwide, incidence rates have declined by about 15 percent since 1985 and continue downward, at least in higher income countries. Possible reasons are lower rates of H. pylori infection over time (possibly a result of better living conditions), better food storage and preservation, and greater availability of fresh fruits and vegetables. Even if the current secular trends continue, however, there will be more than 1 million cases of stomach cancer in 2010.
Breast Cancer
Nearly one-quarter (23 percent) of all cancers among women are breast cancers, with an estimated 1.15 million cases in 2002, making it by far the most common cancer among women, and the second most common cancer in the overall population. Incidence is much higher in industrialized countries, where more than half of all cases are diagnosed. Some fraction of the difference is due to widespread breast cancer screening in industrialized countries, which identifies cancers that would never become clinically apparent. The exception is Japan, where, despite screening, the incidence of breast cancer is about one-third that in North America. Although the rates are much lower in most of Africa, Western Asia, South America, and Eastern Europe, breast cancer is still the most common cancer among women. Among regions, the age-standardized incidence rate is lowest in Central Africa (16.5/100,000) and highest in North America (99.4/100,000).
Survival from breast cancer is better than for many cancers. The 5-year survival is about 73 percent in industrialized countries, and 57 percent overall in developing countries. In the poorest countries, however, the prognosis is much worse. Of the estimated 411,000 women who died of breast cancer worldwide in 2002, 221,000 were in developing countries and 190,000 were in industrialized countries. Worldwide, there are more survivors of breast cancer than of any other cancer type (excluding the common and relatively harmless skin cancers).
Breast cancer is increasing in incidence everywhere, but more so where rates historically have been low. Between 1990 and 2002, the global increase was about 0.5 percent per year. In China, annual increases of 3 to 4 percent are reported. If these rates are representative, 1.5 million cases of breast cancer are expected in 2010.
The large differentials in breast cancer incidence around the world and many epidemiologic studies over the past decades implicte the environment in its broadest meaning (including patterns of childbearing and obesity) in breast cancer causation. The evidence has not, however, led to strategies for breast cancer prevention.
Liver Cancer
Liver cancer is among the most lethal cancers. Although it is sixth in incidence worldwide, it is third in mortality, after lung and stomach cancers. With 5-year survival at 5 percent or less even in developed countries, the yearly death toll (598,000) and number of new cases (626,000) are not far apart. More than 80 percent of liver cancers occur in developing countries, and the incidence is substantially higher among men than women (overall, a ratio of 2.4). High-risk areas include East and Southeast Asia, sub-Saharan Africa, and Melanesia. Risk is low in most developed countries, Latin America, and South Central Asia.
Chronic infection with hepatitis B virus (HBV) is the main risk factor for liver cancer worldwide, and hepatitis C virus is also a factor. The best known co-factor is aflatoxin, a food contaminant produced by a common fungus of grains.
Most liver cancers—those caused by HBV—are preventable by childhood vaccination. This is discussed in detail in Chapter 5.
Cervical Cancer
After breast cancer, cervical cancer is the next most common cancer among women worldwide. It is much more important in developing countries. There cervical cancer accounts for some 15 percent of cancers among women, compared with less than 4 percent in developed countries. A large proportion of these cancers and deaths appear in younger women, well before age 65. The highest incidence rates are in sub-Saharan Africa, Latin America and the Caribbean, Melanesia, and South Central and Southeast Asia. Rates are low in China and Western Asia.
Nearly every case of cervical cancer is now known to be caused by one of a few strains of oncogenic HPV. This knowledge has opened a new avenue for prevention through vaccines. But even before the discoveries that contributed to that understanding, a dramatic decline in rates of cervical cancer incidence and death in developed countries was under way, representing one of the greatest successes of public health in the 20th century. Although rates already had begun falling in developed countries, it was the widespread adoption of the Pap smear to screen for precancerous lesions that brought levels down to their current lows. This and other developments are discussed in more detail in Chapter 6.
Treatment for cervical cancer can be very effective, even at somewhat advanced stages. As a result, survival rates are higher than for most other cancers, even in developing countries, where 5-year survival is estimated at about 40 percent.
Esophageal Cancer
Cancer of the esophagus is another cancer that is more common in developing countries, but extremely variable even among those countries. Rates are 20 times higher in China than in West Africa. Survival from esophageal cancer is poor, so it ranks higher in the frequency of cancer deaths (sixth) than in incidence (eighth).
The specific causes of esophageal cancer are not all known, but a large proportion of cases can be attributed (at least in part) to direct exposure of the esophageal surface to various ingested items. In the United States and Europe, most cases are attributable to a combination of tobacco smoking and alcohol. In the Indian subcontinent, chewing tobacco and betel nuts are important. In the Middle East and parts of South America, drinking very hot beverages poses a risk. Certain foods, in particular pickled and moldy foods common in Asia, are thought to play a role, and some micronutrient deficiencies have also been implicated. In some developed countries, a recent increase in certain types of esophageal cancer suggests increasing obesity as a factor, which is associated with esophageal reflux, another known risk factor.
Colon and Rectal Cancer
About 1 million new cases of cancer of the colon and rectum occurred in 2002, with 529,000 deaths. Unlike most cancers, these cancers occur with similar frequency in men and women (although with a slightly higher incidence in men). Survival at 5 years is much better in North America (65 percent) and Western Europe (54 percent) than in LMCs where data are available: 34 percent in Eastern Europe and 30 percent in India.
The incidence of colon and rectal cancers varies about 25-fold from the high-income and high incidence areas (North America, Australia and New Zealand, Western Europe, and Japan) to Africa and Asia, where incidence is lowest. Although detailed explanations are elusive, the variation is assumed to be environmental, with the leading factors related to major dietary components. International correlations (i.e., “ecologic correlations”) with the level of animal fat intake (positive correlation) and fiber (negative correlation) and the risk of large bowel cancer are well accepted, as are findings from epidemiologic studies implicating obesity and a lack of physical activity. In countries where rates are already high, incidence rates are more or less stable, but mortality rates are falling. Where rates historically have been low (particularly in Asia), they seem to be rising.
Prostate Cancer
Prostate cancer is relatively common, more so in developed than developing countries (19 versus 5.3 percent). Three-quarters of all cases are in men age 65 and older. Recorded incidence rates are influenced strongly in developed countries by widespread screening, which not only detects earlier stage disease, in general, but cases that would never progress to clinical attention at all. As a result of screening and better treatment, the reported 5-year relative survival in the United States is 99 percent. The picture is somewhat different for mortality, which may be a better indicator of the risk of invasive or metastatic prostate cancer. Rates are high not only in North America, Northern and Western Europe, and Australia/New Zealand, but also in the Caribbean, Southern and Central Africa, and South America. Rates are low in Asia and North Africa. The U.S. prostate cancer mortality rate is 16 times higher than China’s.
The impact of screening on prostate cancer statistics makes it difficult to interpret trends, but incidence and mortality appear to be increasing worldwide. The exception is the developed countries with high initial rates, where mortality has been decreasing, attributed mainly to early detection through screening. The causes of prostate cancer are not well understood. Geographic differences are mirrored by racial and ethnic differences documented not only in the United States, but in Brazil, where black populations have higher rates than whites, and whites have higher rates than those of Asian origin.
HOW THE CANCER BURDEN IN LMCS IS ESTIMATED
The most basic cancer statistics in populations are incidence, mortality, and survival. Incidence and survival data are collected in cancer-specific registries, while mortality from cancer is derived from national mortality statistics. Together, these can tell us about the magnitude of the current cancer burden in terms of the need (and unmet need) for medical care, the loss of life (in life-years), the DALYs lived while people are surviving with cancer, and something about the quality of cancer care (from survival, assuming a usable benchmark). Over time, trends emerge that reflect changes in the population, the environment, health, or other risk conditions (e.g., the appearance and increase in Kaposi’s sarcoma in conjunction with the AIDS epidemic). More recently data are being collected on major risk factors for cancer and other chronic diseases through population surveys; concentrating on smoking habits, diet, and physical activity; and physiological and biochemical measurements (e.g., blood pressure and cholesterol).
These statistics are important for two reasons. The first is understanding the burden of cancer and thus, the most important opportunities for cancer control in a given population. Comparison to other populations can also
be very useful. Second, the statistics are important for tracking progress, to determine whether control measures are having the intended effect. Therefore, consideration of the available data and the need for additional efforts should be part of national cancer control efforts. At the same time, it is unrealistic to propose that comprehensive data collection systems be established where, in fact, very little exists today in LMCs. The current status of relevant cancer data collection is reviewed next, ending with GLOBOCAN, the main international cancer data resource. The final part of this chapter discusses approaches to data collection useful for cancer control that are appropriate in resource-constrained countries.
Cancer Data Collection in LMCs
The amount and quality of vital and health statistics correlate generally with the economic status of countries. About 18 percent of low-income countries have recorded mortality data any time since 1950, and about 35 percent have published some population-based incidence data, although fewer than half of them are represented in the most recent edition of IARC’s Cancer Incidence in Five Continents. Population-based cancer registries that are IARC members cover about 21 percent of the world population, with large disparities among areas (Figure 3-3).
Most (77 percent) lower middle-income countries do record mortality, and about 65 percent have reported some population-based incidence data, but again, far fewer are currently active (Table 3-8). Upper middle-income countries have a similar level of mortality reporting (72 percent) and about 60 percent have reported some population-based incidence data, but again, with fewer currently active. The quality of mortality data (as rated by WHO, discussed below) also improves with economic status. Of countries that collect mortality data, the data of 7 of 26 upper middle-income countries were rated as high quality, as were 2 of 40 lower middle-income countries, and none of 12 low-income countries.
Cancer Mortality Data
Most countries have established legal requirements for vital registration systems to count births and deaths, and censuses to enumerate the population. In reality, these systems are fully operational in a minority of countries. The countries with the least resources also tend to have the poorest vital information. Mortality—how many people are dying, at what ages, and from what underlying causes—is the most important information for cancer control planning. The population at risk, by age and gender (from census information), is also essential for calculating age- and sex-specific mortality rates by cause. Vital statistics have broad value, not limited to cancer or any
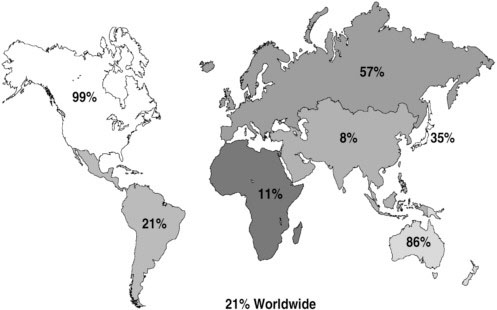
FIGURE 3-3 Population coverage by membership of the International Association of Cancer Registries, 2006.
SOURCE: Reprinted, with permission, from Parkin (2006). Copyright 2006 by Macmillan Publishers Ltd.
other single disease. Accordingly, decisions to invest in new or upgraded vital statistics systems, which entail long-term, sustained support, will not be made on the narrow basis of benefits to cancer control alone. The status of national mortality data globally is reviewed here.
All countries report their death registration data to WHO, which encourages and supports better reporting. A recent assessment of global cause of death reporting provides the first detailed examination of coverage (Mathers et al., 2005). In 1970, about 65 countries reported data; in 1990, 90 countries; and in 2003, 115 countries were reporting some usable cause of death data. Progress has not been uniform, however: For 75 countries, either no cause of death data are available at all or the latest information is from before 1990. Coverage by region ranges from nearly 100 percent of the countries in Europe reporting usable, recent information, to less than 10 percent in Africa.
Of the 115 countries reporting, coverage is considered to be essentially complete in 64. China and India do not have complete registration, but each has a defined sample registration system that provides reasonably represen-
TABLE 3-8 Mortality and Incidence Data Collected in Low- and Middle-Income Countries
|
World Bank Economic Level |
Number of Countries |
Some Mortality Any Time Since 1950 |
Quality of Mortality Data |
Incidence in CA5C, Vol. 8: Number of Countries (%) |
Any Incidence Data Since 1950 |
|
Low |
66 |
12 (18%) |
L: 3 M: 6 Representative but <50% coverage: 1 Not rated: 2 (<50% coverage, not representative) |
6 (9%) |
23 (35) |
|
Lower middle |
52 |
40 (77%) |
L: 14 M: 13 H: 2 Representative but <50% coverage: 1 Not rated (various reasons): 10 |
9 (17%) |
34 (65) |
|
Upper middle |
36 |
26 (72%) |
L: 2 M: 17 H: 7 |
13 (36%) |
22 (60) |
|
CA5C = Cancer Incidence in Five Continents; L = low quality; M = medium quality; H = high quality. SOURCES: Parkin et al. (2002); Mathers et al. (2005). |
|||||
tative information on the whole population (Mathers et al., 2005). Coverage in many countries is incomplete either by design or because of difficulties in collecting the data. In some countries, only the urban areas or certain provinces or states are part of the system. Registration can be less complete in rural areas and areas with poor living conditions and is often worse for infants and children than for adults. Some residents (e.g., guest workers or refugees) may not be registered at all (Lopez et al., 2002). Including the sample systems in China and India, mortality data are available for about 72 percent of the world’s population.
The quality of reported data is not uniform and is rated using generally accepted criteria (e.g., proportion of deaths of unknown cause). For countries that have supplied cause of death information to WHO for 1990 or later (until 2003), 23 are in the “high-quality” category, 55 are in the “medium-quality” category, and 28 are rated “low-quality.” Most, but not
all, of the countries with low-quality data are LMCs; those with medium-quality data are a mixture of countries, including a dozen or so in the high-income category. Data of low quality are unlikely to produce an unbiased picture of the distribution of causes of death (Mathers et al., 2005).
Strategies to Improve Cause of Death Reporting
Complete and ongoing reporting of vital events and periodic censuses are the ideal for all countries, but are unrealistic immediate goals for countries with minimally functioning systems. The sample systems already mentioned (India, China) are models for what has been described as a more cost-effective way to gather useful data on the levels, patterns, and causes of mortality in large populations. If resources become available, such systems can be expanded.
Cancer Incidence Data
Cancer incidence data are collected by specialized cancer registries. Cancer is not the only disease for which such surveillance exists, but it is the most prominent and best organized internationally. Two main types of cancer registries exist: hospital based and population based. Hospitals keep track of the patients with cancer diagnosed and/or treated, with at least some pertinent patient demographic and disease information. A hospital will generally know how many cases of various cancers are seen each year. This is useful information for the hospital and somewhat indicative of the types of cancer occurring in the community, but for a number of reasons may indicate substantially different patterns than are occurring in the population as a whole.
Not everyone has access to hospital care. Many simply die at home with or without a diagnosis, others may travel to another place (e.g., an ancestral area) when they are sick, and a host of other reasons may keep people from being treated at a hospital. Population-based registries, in which attempts are made to determine every case of cancer occurring in a population (e.g., a major metropolitan area, a state, or a country), are the gold standard for cancer incidence reporting. Unlike a hospital-based registry, they involve data collection through outreach to all possible places a patient might go or to which specimens might be sent for diagnosis, such as physicians’ offices, clinics, and laboratories. Obviously, people who die without receiving a diagnosis will not be captured in such a system, but even in very poor countries, in or around major cities, most people come to some attention. From this information and census data on the demographic makeup of the population, age- and sex-specific incidence rates are calculated. Survival data also come from such systems. Attempts are made to track those in the
system to find out whether they are still alive at defined points after diagnosis, and if they have died, to find out the cause.
The world’s population-based cancer incidence has been gathered together by IARC in Cancer Incidence in Five Continents, published in 2002 for the eighth time (Parkin et al., 2002). The aim of this volume is “to present data on cancer incidence for all the populations of the world for which good quality data are available.” Repeating words from the first volume, published in 1966, “The most valuable data are, undoubtedly, the rates obtained by recording the occurrence of every case of cancer over a specified period” in a specified population.
Worldwide, cancer incidence reporting has increased over time. In the early 1960s, 32 registries in 29 countries representing 35 populations were included in Volume 1 of Cancer Incidence in Five Continents. Volume 8, in 2002, included 186 registries in 57 countries representing 214 populations, representing data collected in the mid-1990s. However, only 29 LMCs are included in Volume 8 (Table 3-9). A number of the smaller, mostly upper middle-income, countries collect nationwide incidence data, and most of the rest represent urban areas only.
Cancer Survival
How long an individual survives once cancer develops, and whether death is ultimately related to the cancer or to some other cause, depends on many things. Factors related to the cancer itself—the site, histologic type, and stage at which it is diagnosed—the effectiveness of any treatment, and factors related to that person all affect survival. Across populations, cancer survival assumes specific patterns, and these are of interest mainly for purposes of comparison: How does survival—generally cancer-specific survival—compare across countries and populations, and how has it changed over time?
Population-based cancer survival has been reported for decades from registries in the United States, Europe, and other more developed areas. The first and only comparative analysis of cancer survival from other parts of the world waited until 1998, when IARC published Cancer Survival in Developing Countries (Sankaranarayanan et al., 1998). That report includes data from nine population-based cancer registries in five countries in Asia, and from the National Cancer Registry of Cuba. Countries of Africa and South America have yet to be represented in such a compilation. Had there been any with adequate data, they would have been included (but see Box 3-2, which discusses cancer survival in Kampala, Uganda). The reasons for the lack of data are not hard to fathom: Few cancer registries exist in developing countries and of those operating, some are relatively new. Most effort, with limited resources, is spent on improving the identification of new cases, and
TABLE 3-9 Low- and Middle-Income Countries Represented in Volume 8, Cancer Incidence in Five Continents
|
Continent/Income Level/Country |
Area of Country Covered by Registry |
|
Africa |
|
|
Low Income |
|
|
The Gambia |
Nationwide |
|
Mali |
Bamako |
|
Uganda |
Kayadondo County (Kampala) |
|
Zimbabwe |
Harare |
|
Lower Middle Income |
|
|
Algeria |
Algiers |
|
Asia |
|
|
Low Income |
|
|
India |
Ahmedabad; Bangalore; Chennai; Delhi; Karunagappally; Mumbai; Nagpur; Poona; Trivandrum |
|
Pakistan |
South Karachi |
|
Vietnam |
Hanoi; Ho Chi Minh City |
|
Lower Middle Income |
|
|
China |
Beijing; Changle; Cixian; Jiashan; Qidong County; Shanghai; Tianjin; Wuhan |
|
Philippines |
Manila; Rizal |
|
Thailand |
Bangkok; Chiang Mai; Khon Kaen; Lampang; Songkla |
|
Upper Middle Income |
|
|
Oman |
Omani |
|
Europe |
|
|
Lower Middle Income |
|
|
Belarus |
Nationwide |
|
Yugoslavia (Serbia and Montenegro) |
Vojvodina |
|
Upper Middle Income |
|
|
Croatia |
Nationwide |
|
Czech Republic |
Nationwide |
|
Estonia |
Nationwide |
|
Latvia |
Nationwide |
|
Lithuania |
Nationwide |
|
Malta |
Nationwide |
|
Poland |
Cracow; Kielce; Lower Silesia; Warsaw City |
|
Slovak Republic |
Nationwide |
|
South and Central America/Caribbean |
|
|
Lower Middle Income |
|
|
Colombia |
Cali |
|
Cuba |
Villa Clara |
|
Ecuador |
Quito |
|
Upper Middle Income |
|
|
Argentina |
Bahia Blanca; Concordia |
|
Brazil |
Campinas; Goiania |
|
Costa Rica |
Nationwide |
|
Uruguay |
Montevideo |
|
SOURCE: Parkin et al. (2002). |
|
|
BOX 3-2 Cancer Survival in Kampala, Uganda The Kampala Cancer Registry has demonstrated the potential to collect informative cancer incidence data in a low-income country at very low cost. Most recently, data from the registry were used to describe cancer survival in the mid-1990s (Gondos et al., 2005). These data provide a much clearer picture than is possible from the estimates of incidence and mortality that are used as surrogates for most of sub-Saharan Africa. The only other set of information on cancer survival in Africa comes from a registry in Harare, Zimbabwe (Gondos et al., 2004). The Kampala Cancer Registry was established in 1951, making it one of the longest running registries in Africa. The registry ceased functioning entirely during the most severe political upheavals in the country, from 1980 until 1989, but since resuming, it has operated continuously. The area covered includes Kampala, the Ugandan capital, and neighboring urban and semiurban areas with a total estimated population of 1.2 million. Changes in cancer incidence from the 1960s through the 1990s have been tracked, documenting, for example, the appearance and rise in AIDS-related cancers in the 1990s. These include large increases in Kaposi’s sarcoma, squamous cell carcinoma of the conjunctiva (part of the eye), and non-Hodgkin’s lymphoma. Case Finding Even in the poorest countries, most people with cancer contact the health care system sometime before they die. Where people have access to urban hospitals, they may be even more likely to seek treatment. Cancer cases are identified for the Kampala registry by actively searching the patient records of six hospitals, three pathology laboratories, and Hospice Uganda, which provides palliative care for people dying from cancer and AIDS. Registration of cancer cases is about 90 percent complete, according to an evaluation carried out in the mid-1990s (Parkin et al., 2001). Survival In the United States and most countries with adequate vital statistics systems, we expect accurate data on the numbers and causes of death. We also expect that, given cancer registries, we can track people until their deaths (or link to death records) and thereby calculate survival rates from different types of cancer, and more narrowly, using data in the patient records on, for example, stage and co-morbidities. This capability is not built into systems in poor countries, where mortality data are not |
|
complete and may be unreliable. This is the case in Uganda, where a survival analysis was undertaken recently. The study reports survival from the 13 most common types of cancer reported between 1993 and 1997 in the Kampala registry. Vital status was recorded up to the end of 1999. If records of the institution that reported on the patient could provide information, it was used. In all other cases, verification of vital status had to be sought through visits to patients’ homes. With few street addresses, and often just the name of the village or area, even after intense efforts, just under three-quarters of the patients could be traced. In the analyses, the data for untraceable patients were included appropriately (recorded as “alive” the last time they were seen, and “censored” thereafter). It is unlikely that the patients lost to follow-up fared better than those with complete information. Study personnel often found out something about these people, including many who neighbors said had gone to their ancestral homes, most likely to die. With no cancer services anywhere outside of Kampala, they would have little chance of further treatment. During the target years, 2,337 patients were reported to the Kampala registry. Of these, 506 did not have sufficient information recorded about their cancers to include them further. Of the 1,831 remaining, 1,205 had complete follow-up data. Histological verification of the tumor was available for just over 60 percent of all those included in the analysis (1,831). Except for those with cancers of the thyroid and prostate, the Ugandan patients were younger than African Americans in the United States with the same cancers (this was taken into account in the analysis). For each type of cancer, both absolute and relative survival were calculated. Absolute survival is simply the proportion of all patients still alive, over time. Relative survival takes into account the probability of dying from other causes during the period of survival, applying estimates of survival for the entire Ugandan population. The relative survival rates were also compared with the corresponding rates for African Americans, using data from the U.S. Surveillance, Epidemiology and End Results (SEER) Program. Results The survival of the Ugandan patients was uniformly poor (Table 1). In comparison with African Americans, survival was similar only for those cancers that were rarely treated successfully anywhere, including esophageal, stomach, liver, and lung cancers. The biggest differences between the two populations were recorded for cancers for which there were effective treatments. The most dramatic difference was for thyroid cancer, which is highly curable. Among African Americans, 95 percent |
|
TABLE 1 Five-Year Relative Survival (in %) of Ugandan Patients with Cancer, Kampala, Uganda, 1993–1997
survived 5 years, compared with only 12 percent of the Ugandans. Large gaps between the two populations also were apparent for nasopharyngeal, colorectal, cervical, ovarian, and prostate cancers. Discussion Cancer patients in Uganda have very poor survival odds—lower than the few other developing countries where survival has been documented (Sankaranarayanan et al., 1998). This is the outcome that must be expected where annual per capita incomes are less than $300 (World Bank, 2003) and health care spending is less than $50 per capita. An estimated 5 percent of the population has access to the meager cancer treatment facilities, all of which are centered in Kampala. Data on cancer stage at presentation are lacking, but the evidence points to the majority being in late stages. Sixty percent of the deaths occurred in the first year after diagnosis, and 80 percent by the end of 2 years. Those presenting at earlier stages would have a better chance of finding life-saving treatment, but with treatment so scarce, earlier diagnosis may make little difference. |
|||||||||||||||||||||||||||||||||||||||||||||||||||
only once that area is sufficiently developed will the task of following up on registered cases commence.
The 10 registries included in Cancer Survival in Developing Countries are likely to include what are among the best survival experiences in the developing world. These countries were among those developing rapidly, with better cancer services than other countries. The existence of the registries also signals an urban catchment area with above-average cancer services.
Findings from Cancer Survival in Developing Countries
The 10 registries and the time periods represented in the volume are listed in Table 3-10. To the extent possible, the data were made comparable (Sankaranarayanan et al., 1998). Even among these developing countries, wide variations in survival from some cancers was reported. The analysis also includes comparisons with registries in the United States (white population) and Europe, so differences were also noted between the higher- and lower income areas. Figure 3-4 broadly summarizes the relationships found. These are not surprising and are, in fact, intuitive, but it is useful to see them drawn on the basis of evidence. Three major patterns are apparent:
-
Cancers with poor prognosis: These cancers have the smallest survival differential between low- and high-income countries, and include cancers of the esophagus, liver, lung, and pancreas. They are often detected at advanced stages in both low- and high-income countries, because no
TABLE 3-10 Registries Included in Cancer Survival in Developing Countries
|
Registry Area |
Cancer Registration Period (diagnosis) |
Closing Date of Follow-Up |
|
China |
|
|
|
Qidong |
1982–1991 |
31 Dec 94 |
|
Shanghai |
1988–1991 |
31 Dec 94 |
|
Cuba |
1988–1989 |
31 Dec 94 |
|
India |
|
|
|
Bangalore |
1982–1989 |
31 Dec 93 |
|
Barshi |
1988–1992 |
31 Dec 95 |
|
Bombay |
1982–1986 |
31 Dec 93 |
|
Madras |
1984–1989 |
31 Dec 93 |
|
Philippines: Rizal |
1987 |
31 Dec 93 |
|
Thailand |
|
|
|
Chiang Mai |
1983–1992 |
30 Jun 94 |
|
Khon Kaen |
1985–1992 |
31 Dec 95 |
|
SOURCE: Sankaranarayanan et al. (1998). |
||
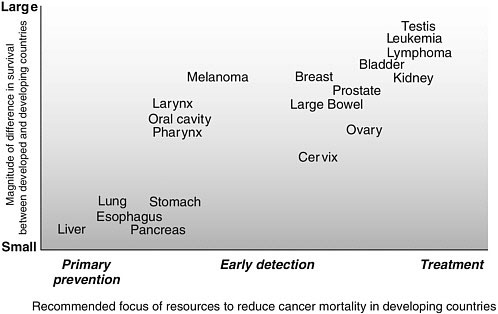
FIGURE 3-4 Cancer survival differences between developed and developing countries and implications or control measures.
SOURCE: Reprinted, with permission, from Sanakaranarayanan et al. (1998). Copyright 2006 by the International Agency for research on Cancer.
-
effective screening or early diagnosis techniques are available. Even with the best available treatment, most people who develop these cancers anywhere in the world do not survive for an extended period of time.
-
Cancers with early detection, diagnosis, and treatment options that are relatively easy to implement: For a second group of cancers, including melanoma and cancers of the head and neck, large bowel, breast, cervix, ovary, urinary bladder, and thyroid, there is greater variation in survival between developing and developed countries, and probably between low-income and middle-income countries, at least in some cases. For these cancers, early detection, diagnosis, and treatment that, in principle, can be delivered through basic health care facilities is effective and improves survival. To the extent they are implemented in low-resource settings, survival will be improved.
-
Cancers with effective diagnostic and treatment interventions that require improved logistics: A third group of cancers, including leukemia, lymphoma, and testicular cancer, are marked by an even greater variability in survival between developing and developed countries. Effective treatments are available for these cancers, but they are multimodal treatments requir-
-
ing a greater degree of medical resources, a good health care infrastructure, and sophisticated knowledge. The cancers in this group are relatively less common in developing countries.
GLOBOCAN: Cancer Incidence, Mortality, and Survival for All Countries
Given that neither mortality nor cancer incidence data are recorded directly in most LMCs, how are we able to include numbers representing global cancer mortality and incidence, such as those at the beginning of this chapter? How do we know there were 11 million cases and 7 million deaths from cancer in 2002? As referenced earlier, these are estimates from GLOBOCAN, a database created by IARC, part of WHO, that includes estimates of the incidence and prevalence of, and mortality from, 27 cancers for all countries in the world, most recently for 2002.
GLOBOCAN data reflect all reliable information from cancer registries and mortality reporting, and where these sources of information are missing or incomplete, estimates of incidence, mortality, population, and prevalence made following explicit rules (see http://www-dep.iarc.fr/). GLOBOCAN is accessible through the IARC CancerMondial webpage (see http://www-dep.iarc.fr/) and on CD-ROM, and is widely cited in the global cancer literature.
Surveillance of Risk Factors
In addition to knowing how many cancers are occurring and how many people are dying from cancer, knowing the distribution of risk factors—in particular, those that are modifiable—can be extremely useful. As noted in a WHO report, “the risk factors of today are the diseases of tomorrow” (Bonita et al., 2001). Cancer shares risk factors with other major causes of death from noncommunicable diseases, and it is surveillance of these major, shared risk factors that are the basis of two approaches described in the next sections. The first is WHO’s approach, cross-sectional sample surveys that can be adapted for use in every country, even in low-resource areas. The second is longitudinal studies that involve following large cohorts of people over decades; these studies are generally more appropriate for middle-income countries.
WHO “STEPwise” Approach
WHO has developed an initial three-step approach to population surveys for surveillance of risk factors in response to a resolution on the prevention and control of noncommunicable diseases, passed by the World Health
Assembly in 2000. The steps provide flexibility in the level of effort that can be made initially, while allowing for expansion when resources permit. The use of standard survey instruments across time and countries allows for more valid comparisons on those dimensions. Countries may also choose to add more detailed questions or tests, depending on their situation. As with all surveys, the sampling frames must be carefully defined and the numbers surveyed sufficient to provide reliable estimates of the actual population rates. (WHO provides step-by-step guidance for all aspects of the survey through a series of documents available at http://www.who.int/chp/steps/en/, and carries out training programs all over the world.)
The major noncommunicable diseases are cardiovascular diseases, cancers, diabetes, and chronic respiratory diseases. The most important common risk factors that are amenable to intervention are identified as smoking, unhealthy alcohol consumption, unhealthy diet (specifically, low intake of fruits and vegetables), physical inactivity, overweight and obesity, raised blood pressure, raised blood glucose, and raised blood lipids. Of these, smoking has the greatest impact on cancer, but all except raised blood pressure are considered by WHO to have some relevance to cancer (Bonita et al., 2001).
The steps are the following:
-
Questionnaire-based assessment: Reports from respondents on socioeconomic data, data on tobacco and alcohol use, and some measurements of nutrient status and physical inactivity.
-
Step 1 plus physical measurements: Simple physical measurements are added to step 1, including at least blood pressure, height, weight, and waist circumference.
-
Step 2 plus biochemical measurements: Measurements on blood samples, including at least fasting blood sugar and total cholesterol.
At each step, a “core” set of data is defined, and an “expanded core” and optional items are suggested. The exact measures should be tailored to specific country needs. Steps 1 and 2 are considered “desirable and appropriate for most countries,” while step 3 is not recommended by WHO in “less well-resourced settings unless low-cost technology is used” (Bonita et al., 2001).
The STEPwise approach is meeting with success in terms of training and initial surveys. WHO has provided training to 82 countries, including every country in Africa, and 23 countries have completed initial reports (Personal communication, J. Lippe, WHO, May 2006). It will be at least a few years before sufficient data are built up from different countries to appreciate the full value, but this tool appears to be a good choice for most countries, regardless of other data collection efforts.
Large Prospective Studies of Risk Factors and Deaths
Surveying for well-known risk factors for cancer and other noncommunicable diseases is of clear benefit for disease control planning and monitoring. In order to extend our understanding of these risk factors in populations not yet studied, and identify and characterize risk factors not yet well studied, a different approach is needed. Large prospective (longitudinal) studies serve this function, as well as providing surveillance for known risk factors. In each such study, hundreds of thousands of adults are interviewed briefly about major risk factors (e.g., smoking, diet) and have basic physical measurements taken (and blood samples stored, in some cases). Households are revisited periodically to record household members’ vital status, and the participants are resurveyed periodically (e.g., every 3 to 5 years) for changes in risk factors. When cohort members die, the cause of death is ascertained. Such studies, involving more than 2 million people, are under way in a handful of countries. A modest number of additional studies should be started periodically to capture unstudied populations, expand the information base on known risk factors, add measures based on new science, and exploit new technologies (e.g., genetic and information) to gather information on large cohorts economically. This is already the case in the current studies, which have an estimated cost of follow-up of $1 per person per year (Personal communication, R. Peto, University of Oxford, June 2006).
A leader in large prospective studies to date has been the Clinical Trial Service Unit and Epidemiological Studies Unit (CTSU) at the University of Oxford, England (Clinical Trial Service Unit, 2006), in collaboration with researchers and governmental and academic organizations in the survey areas. The most mature of the CTSU collaborative studies is a nationally representative study of men only, in China. In 1991, information was recorded on smoking, drinking, weight, height, blood pressure, lung function, medical history, and various social factors in about 225,000 adult men throughout China. Reliable systems of follow-up were put into place, and by 1996 the dates and causes of 12,000 deaths had been recorded. Of these deaths, vascular, neoplastic, respiratory, and all other causes each accounted for about one-quarter. Preliminary analyses were consistent with the conclusion from other studies that, during the 1990s, at least 0.6 million deaths each year in China were directly attributable to smoking (Niu et al., 1998).
Long-term follow-up of the initial Chinese study is continuing, with periodic resurveys of all middle-aged adults living in the study areas. In addition, it is proposed that blood samples be collected at the next resurvey so that nested case-control analyses can be conducted subsequently, as is being done already in some other sites, which include women as well as men. This will allow the age-specific relevance of established risk factors and of newer risk factors (e.g., various details of the lipid profile, coagulation factors, antioxidants, micronutrients, antibodies, genetic variants, etc.) for vascular
and other diseases to be studied reliably in “nested” case-control studies. Additional studies are under way in Mexico City (200,000 adults over age 40); Russia (four regions: 100,000 adults); Egypt (150–200,000 adults); Trivandrum, south India (200,000 adults); Bombay, west India (200,000 adults); Madras, east India (300,000 adults); and Cuba (200,000 adults).
Many of CTSU’s prospective studies have been paired with large retrospective studies that can provide a reliable snapshot of tobacco-attributable deaths at about the time the prospective studies begin. This was done in southern India, where the smoking habits of 43,000 men who had died of various diseases in the late 1990s were compared with the habits of 35,000 living men (the study was restricted to men because few women smoked). About one-quarter of the smokers studied died at ages 25–69, with those dying at these ages losing, on average, 20 years of life. The expected results for cancer and vascular diseases were confirmed, but an unexpected finding also emerged: about half of the deaths from tuberculosis, which causes more than 10 percent of deaths in this population, were attributable to smoking (Gajalakshmi et al., 2003). Had these people not smoked, they would not have died of tuberculosis. This is not a finding about cancer, but it demonstrates that even in a study of smoking—about which quite a lot is known, mainly from wealthy countries—new and surprising (and potentially life saving) information can come to light.
There may be a misperception that little more can be learned from further studies of this kind, particularly for established risk factors (such as smoking and blood lipids). But the effects of such factors can vary enormously from one population to another, and there is still substantial uncertainty as to how important they are in different settings and how their importance is changing with time. CTSU’s studies, for example, have defined the outlines of the future epidemic of deaths due to tobacco in developing countries: If current smoking patterns persist, worldwide deaths from tobacco will increase from about 3 million a year now to about 10 million a year by 2025.
SUMMARY AND RECOMMENDATIONS
There should be no doubt that cancer imposes a substantial burden on all countries, even though the proportion of mortality (and other burden measures) is less in LMCs than in high-income countries. Infectious diseases are still the biggest killers, particularly in low-income countries and some middle-income countries. What lies behind the cancer burden figures, however, is a very thin veneer of data and a great deal of estimation, mainly of cancer incidence and mortality. A small amount of data on survival also exists. Conceptually, burden would also include disability, loss of productivity, caregiving burden, out-of-pocket expenditures, etc., but such information is largely unavailable for these countries.
Few LMCs have accurate recent data about their cancer burden or major risk factors for cancer (or other chronic diseases). The lack of health status information extends well beyond cancer to the entire range of vital and health statistics. The estimates produced by IARC for each country are useful for setting initial priorities, but cannot be used to track progress— positive or negative—or to define more precisely what priorities should be in the medium to long term.
Major improvements in overall vital and health statistics will take time. Over the short term, it is feasible to propose modest improvements in the information base, however. In particular, it is relatively inexpensive to gather information on the major risk factors for cancer and other noncommunicable diseases in periodic cross-sectional surveys. WHO’s STEPwise Approach to Chronic Disease Risk Factor Surveillance is well developed, and training and other assistance is available from WHO. The standardized STEPwise Approach has the advantage of producing comparable information across countries as well as over time.
Measuring causes of death in a population is more ambitious, but nevertheless highly worthwhile. In low-income countries in particular, this is difficult because many people die without medical care, or at least without a diagnosis before death. Systems based on “verbal autopsies” (determinations based on interviews of family members, health care workers, and others with information about the circumstances of a person’s death) can be developed in place of medical certification, as demonstrated in India’s “Million Death Study” in a network of sample registration areas that constitute a nationally representative sample of deaths (Jha et al., 2006).
Prospective (longitudinal) studies of chronic disease risk factors and causes of death involving several million people have been initiated as collaborations between researchers in LMCs and high-income countries. Results are already available from a few LMCs, such as China, India (including the “Million Death Study”), and Mexico. These studies have documented the unique patterns of diseases and their risk factors, such as the strong link between smoking and tuberculosis deaths in India or smoking and lung cancer and chronic lung disease in China. Cohort studies such as these are complex, requiring extensive planning as well as the sustained commitment of human and financial resources for data collection, processing, and analysis. The investment is a significant one on all counts, but the cost need not be prohibitive. Studies now under way cost on average $1 per person/per year to maintain (Personal communication, R. Peto, University of Oxford, April 2006).
Finally, cancer registries that record cancer cases and the outcomes of those cases—at least in specific hospitals, and more usefully, in defined geographic areas—are important for understanding local conditions, at least for those who come to medical attention. Registries require sustained
commitments and trained personnel, which are most feasible in urban areas where diagnosis and treatment are available.
International assistance and collaboration should be available for all of these monitoring and surveillance activities, to take advantage of existing knowledge and experience.
The recommendations from this chapter focus on better characterizing the cancer burden (along with other diseases) in LMCs to support cancer control planning and monitoring. They are based on the usefulness and feasibility (including cost, although we were not able to make specific cost estimates) following from the discussion in the chapter.
RECOMMENDATION 3-1. The following should be considered:
Risk factor surveillance for chronic diseases should be initiated in many countries using standardized questionnaires (e.g., STEPS).
Collection of cause-specific mortality data should be a long-term goal in every country. Where vital statistics systems are weak or nonexistent, initial data collection may be sentinel sites rather than nationwide. Improved mortality reporting at a level appropriate to the country should be supported as a part of cancer control activities.
Longitudinal studies of chronic disease risk factors and mortality should be initiated in a few additional middle-income countries.
Cancer registries should be developed in conjunction with cancer control activities, mainly in urban areas where diagnostic and treatment services exist. Where new or existing cancer centers are developed into centers of excellence, registries in the catchment area should be a part of the development.
REFERENCES
Amir H, Azizi MR, Makwaya CK, Jessani S. 1997. TNM classification and breast cancer in an African population: A descriptive study. Central African Journal of Medicine 43(12):357–359.
Anyanwu SN. 2000. Survival following treatment of primary breast cancer in eastern Nigeria. East African Medical Journal 77(10):539–543.
Barton M, Frommer M, Shafiq J. 2005. The Role of Radiotherapy in Cancer Control in Low-and Middle-Income Countries. Commissioned by the Institute of Medicine. Typescript.
Bonita R, de Courten M, Dwyer T, Jamrozik K, Winkelmann R. 2001. Surveillance of Risk Factors for Noncommunicable Diseases: The WHO STEPwise Approach. Summary. Geneva, Switzerland: World Health Organization.
Bray F, Sankila R, Ferlay J, Parkin DM. 2002. Estimates of cancer incidence and mortality in Europe in 1995. European Journal of Cancer 38(1):99–166.
Chopra R. 2001. The Indian scene. Journal of Clinical Oncology 19(18 Suppl):106S–111S.
Clinical Trial Service Unit, University of Oxford. 2006. Need for Large-Scale Observational Epidemiology. [Online]. Available: http://www.ctsu.ox.ac.uk/projects/observational.shtml#rp [accessed May 31, 2006].
Gajalakshmi V, Peto R, Kanaka TS, Jha P. 2003. Smoking and mortality from tuberculosis and other diseases in India: Retrospective study of 43,000 adult male deaths and 35,000 controls. Lancet 362(9383):507–515.
Gondos A, Brenner H, Wabinga H, Parkin DM. 2005. Cancer survival in Kampala, Uganda. British Journal of Cancer 92(9):1808–1812.
Gondos A, Chokunonga E, Brenner H, Parkin DM, Sankila R, Borok MZ, Chirenje ZM, Nyakabau AM, Bassett MT. 2004. Cancer survival in a southern African urban population. International Journal of Cancer 112(5):860–864.
Jha P, Gajalakshmi V, Gupta PC, Kumar R, Mony P, Dhingra1 N, Peto R, RGI-CGHR Prospective Study Collaborators. 2006. Prospective study of one million deaths in India: Rationale, design and validation results. PLoS 3(2):e18.
Lopez AD, Ahmad O, Guillot M, Ferguson B, Salomon J, Murray CJL, et al. 2002. World Mortality in 2000: Life Tables for 191 Countries. Geneva, Switzerland: World Health Organization.
Lopez AD, Mathers CD, Ezzati M, Jamison DT, Murray CJL. 2006. Global Burden of Disease and Risk Factors. New York: Oxford University Press.
Malik IA. 2002. Clinico-pathological features of breast cancer in Pakistan. Journal of the Pakistan Medical Association 52(3):100–104.
Mathers CD, Ma Fat D, Inoue M, Rao C, Lopez AD. 2005. Counting the dead and what they died from: An assessment of the global status of cause of death data. Bulletin of the World Health Organization 83(3):171–177.
Niu SR, Yang GH, Chen ZM, Wang JL, Wang GH, He XZ, Schoepff H, Boreham J, Pan HC, Peto R. 1998. Emerging tobacco hazards in China: Early mortality results from a prospective study. BMJ 317(7170):1423–1424.
Omar S, Khaled H, Gaafar R, Zekry AR, Eissa S, el-Khatib O. 2003. Breast cancer in Egypt: A review of disease presentation and detection strategies. Eastern Mediterranean Health Journal 9(3):448–463.
Parkin DM. 2006. The evolution of the population-based cancer registry. Nature Reviews Cancer 6:603–612.
Parkin DM, Bray F, Ferlay J, Pisani P. 2005. Global cancer statistics, 2002. Ca: A Cancer Journal for Clinicians 55(2):74–108.
Parkin DM, Wabinga H, Nambooze S. 2001. Completeness in an African cancer registry. Cancer Causes & Control 12(2):147–152.
Parkin DM, Whelan SL, Ferlay J, Teppo L, Thomas DB. 2002. Cancer Incidence in Five Continents, Volume VIII. Lyon, France: International Agency for Research on Cancer.
Sankaranarayanan R, Black RJ, Parkin DM. 1998. Cancer Survival in Developing Countries. Lyon, France: International Agency for Research on Cancer. IARC Scientific Publications No. 145.
Schwartsmann G. 2001. Breast cancer in South America: Challenges to improve early detection and medical management of a public health problem. Journal of Clinical Oncology 19(18 Suppl):118S–124S.
Vorobiof DA, Sitas F, Vorobiof G. 2001. Breast cancer incidence in South Africa. Journal of Clinical Oncology 19(18 Suppl):125S–127S.
World Bank. 2003 World Development Indicators. Washington, DC: World Bank.
World Health Organization. 2003. The World Health Report 2003: Shaping the Future. Geneva: World Health Organization.
World Health Organization. 2006. Revised Global Burden of Disease (GBD) 2002 Estimates. [Online]. Available: http://www.who.int/healthinfo/bodgbd2002revised/en/index.html [accessed January 4, 2006].
World Health Organization. 2006. Core Health Indicators. [Online] Available: http://www3.who.int/whosis/core/core_select.cfm?strISO3_select=MYS&strIndicator_select=MortInfantBoth&intYear_select=latest&language=english [accessed 7/10/06].


