
4
Lessons Learned
Finding 1: The survey was an important first step in collecting respiratory protection data from a probability sample. As such, it was a worthwhile learning experience for both the National Institute for Occupational Safety and Health (NIOSH) and the Bureau of Labor Statistics (BLS).
Some of the lessons learned came early on in the survey process. For example, by November 2001, in the midst of the survey operation, BLS officials reported to the Labor Research Advisory Council (LRAC) Committee on Occupational Safety and Health Statistics that BLS had already learned some important lessons from conducting the respirator survey:
-
Funding was inadequate. It “was originally pegged at $450,000, but this was underestimated by several hundred thousand dollars.”1 For BLS, this survey was a money loser. Undoubtedly, this affected the ability of BLS to perform and complete some labor-intensive tasks, such as preparation of adequate documentation.
-
Things dragged on too long. “There was more ‘lag time’ in reaching consensus on the questionnaire content and wording and in obtaining Office of Management and Budget (OMB) approval than originally anticipated.”2
-
Dealing with a contractor was a learning experience as well. As a result of this survey experience, “BLS had a better idea of what duties can be done ‘in-house’ versus contracted out.”3
The lessons learned by BLS were taken into consideration in critiquing the Survey of Respirator Use and Practices (SRUP). The committee’s task of critiquing the 2001 SRUP was approached with the thought that the analysis and recommendations in this section would be designed to help guide a subsequent survey of this scope and nature, and that this critique would be based on both published documentation and that provided by BLS and NIOSH.
Finding 2: There was insufficient documentation and detail for the committee to reconstruct key aspects of the methodology and to fully understand the survey design and implementation.
The lack of documentation was particularly true for the sample design, sample weighting, content development, and handling of missing data through “hotdeck” imputation. Although a serious deficiency, the lack of documentation on several aspects of survey design and implementation did not preclude an assessment of the adequacy and appropriateness of most aspects of the survey. The specific gaps in documentation are noted below where these topics are discussed.
This critique approximately follows the OMB framework for standards and guidelines for statistical surveys.4 The framework includes translation of concepts and methods into a questionnaire design; collection of data; processing and editing of data; production of estimates; data analysis and review procedures; and data dissemination.
Questionnaire Development
The translation of survey objectives into the design of a questionnaire to obtain the required data was a dual responsibility of NIOSH and BLS. NIOSH participated in the development of the survey questionnaire by providing BLS with direction on technical subjects such as regulations, respirator types and uses, and specific substances that require respirator use. In a departure from the usual BLS arrangements, NIOSH actually developed the initial draft of questions for the survey.5
Finding 3: The survey questionnaire was not adequately related to the initial survey objectives.
The questions that were developed and asked in the survey did not relate to the original objectives for performing the survey. The survey became focused more on items that were measurable from the perspective of the employer respondents, and the questions elicited information focused more on regulatory compliance than on respirator use.
The BLS somewhat modified the NIOSH version of the questionnaire prior to the pretests. The BLS modifications were developed using Dillman’s Total Design Methods,6 as well as other methods emphasizing formal design principles. The pretest version of the survey used during the cognitive interviews looked vastly different from the initial version, although it retained much of the language, item structure, and content. The stated BLS goal was to test the “semantic and linguistic features” during pretesting and obtain respondent reaction to the newly redesigned respirator survey form.
Assessment of instrument testing for this establishment survey was guided by a number of general principles. Unfortunately, there is no consensus set of accepted pretesting best practices. While a number of common procedures are widely used in establishment surveys—including cognitive testing, usability testing, and various types of field tests—there is no generally accepted procedure or combination of procedures for establishment survey instrument testing.7
Pretesting is a required step in the preparation of BLS questionnaires. In the absence of a commonly accepted template, the SRUP pretesting program involved the integration of multiple methods, including expert review, cognitive interviewing, and field testing.
Cognitive Testing
A total of 12 cognitive interviews were conducted with 11 establishments during two rounds of pretesting. Nine establishments participated in the first round of interviews, which focused on the development of a satisfactory field-test instrument. The final three interviews were completed during a second round of testing after the field-test results were analyzed.8
The 11 companies that participated in the cognitive interviews were divided by BLS into three groups:9
-
Five large companies that reported having heavy usage of respirators among their employees: these large companies included a steel firm, a utilities company, a ship repair company, a construction firm, and a paint producing and distribution company (this firm participated in two separate interviews). All five sites had one or two safety coordinators or managers and/or industrial hygienist(s) at the company who participated in the interview.
-
Four midsize companies, two of which reported minimal or occasional respirator use and one that reported moderate respirator usage: these midsize companies included a sheet metal production company, two construction companies, and a scaffolding company. All four sites had a safety coordinator or manager and/or industrial hygienist at the company who participated in the interview. Three respondents participated in the cognitive interview with one of the construction firms.
-
Two small companies, one of which reported minimal use of respirators and a second that reported a significant amount of respirator usage: one of those companies was a scrap metal company, and the other was an auto body repair and paint shop. Neither company had a safety coordinator, manager, or industrial hygienist at the company; as a result the company owner or office manager completed the interview.
All of the interviews were conducted on-site at the establishments, with a BLS occupational health and safety expert accompanying the trained cognitive interviewer. The interviews lasted about 90 minutes and were audiotaped. During these interviews, the respondents were shown a copy of the survey form as iteratively revised from previous interviews. The interviews followed a strict protocol designed to assess respondent comprehension and ease in responding and to identify any response problems ensuing from the form. The protocol queried respondents about the following:
-
Survey title, introduction, routing of survey throughout the establishment; survey completion time; initial respondent reactions; other issues
-
Definition of major terms
-
Relevant documentation at the establishment
-
Air-purifying respirators (APRs) and air-supplied respirators (ASRs)
-
Establishment’s respirator program and administration
-
Respirator fit-testing
BLS reported that the cognitive interview respondents made a number of observations that were useful in refining the survey instrument and designing the data collection. One important finding that emerged was that respondents in large establishments who were most likely to have specialized training in respirator protection programs appeared to understand a large proportion of the terminology used in the survey, so it could be concluded that there was little need to define the terms. However, when the cognitive interviews were extended to small companies where respondents had little or no specialized training, were less familiar with survey terminology, did not maintain records of respirator use, and did not necessarily conduct (or even know about) fit-testing and/or air-sampling procedures, the respondents had greater difficulty understanding the definitions of many technical terms used in the survey.
The cognitive pretesting unearthed other important observations that would be carried into the field-test and final versions of the SRUP including the following:
-
Respondents uniformly agreed that the topic of respirators was an important one and appropriate for a large-scale NIOSH survey.
-
There was some concern that some noncompliant respondents would not complete the survey because they would fear that the survey would trigger a visit by a regulatory body. (BLS sought to allay this concern by adding a disclaimer at the front of the final version of the survey to the effect that data collected in the SRUP would be confidential and that the results would in no way initiate any Occupational Safety and Health Administration [OSHA] inspection.)
-
Many respondents did not know that “dust masks (with two bands)” are a form of respirator—respondents in small establishments particularly exhibited this problem, but two safety professionals were also unaware of this fact.
-
Respondents offered additions to both lists of substances (some of these were added to the final version of the SRUP).
BLS concluded that respondents liked the layout and design of the respirator survey as modified. The design staff moved on to the field-testing phase of questionnaire development.
Field Testing
The field test of questionnaire development was designed to yield more information on the cognitive, linguistic, and measurement issues in the collection of respirator use data. Some 120 establishments were selected on a statistically representative basis from the sampling frame that would be used when SRUP was implemented nationally. According to BLS, the field-test sample was chosen using OSHA and NIOSH estimates of Standard Industrial Classifications (SICs) that have a greater likelihood of respirator use. There is concern that the field test did not cover many establishments that use ASRs. BLS discussed with the Statistical Methodology Group which SICs were chosen to determine if these have a higher probability of air-supplied use.The BLS suggested a telephone follow-up to establishments in the field test that use ASRs in order to gain respondent’s insight into that section of the survey. The BLS stated that six to seven of the establishments that participated in cognitive interviews used ASRs and as a result the air-supplied section has been tested somewhat extensively.
In many ways, the field test served as a dress rehearsal for the eventual survey operation—respondents were mailed a questionnaire; those who failed to respond to the initial mailout (about 58 percent of respondents) received a telephone follow-up call after the 30-day collection period had expired to obtain their data over the phone or by fax. These telephone follow-up procedures increased the collection by an additional 38 percent, so the procedures resulted in a final overall field-test response rate of 80 percent; the final response rate for the actual survey was close—75.5 percent. Unlike the actual survey operation, however, those who responded were contacted to obtain their feedback on the survey, and those who did not initially respond were asked about their opinions and why they initially failed to complete the questionnaire.
Thus, 20 percent of field-test participants refused to participate or failed to comply with mail and telephone requests to do so. Why didn’t they respond? Some were just too busy. Others reported that their companies do not respond to voluntary surveys, that the form was too long, or that it did not pertain to companies in their situations. As far as it went, the field test provided valuable insights that enhanced the survey operations.
Finding 4: The field test paid little attention to exploring validation procedures that might have provided information on the quality of data collected or motivated the need for a formal quality assessment of the data, and thus missed an opportunity to improve understanding of the quality of the SRUP data.
Several issues that might have been targeted for attention in the cognitive interviews and field tests were identified retrospectively. Some examples, not intended to be exhaustive, include the following:
-
Often the respondent is presented with a “check all that apply” format, and there is some evidence in the survey literature that this approach, rather than requiring a yes or no answer to each response option, can lead to underreporting. Such questions are often interspersed with items using identically formatted response options, but with a “check only one” instruction. These features in concert might lead to increased response error.
-
Questions are sometimes preceded by a set of complex instructions or by boxed definitions connected by arrows whose purpose is unclear.
-
Respondents are asked to refer to their answers to previous questions in order to answer a current question.
-
Respondents are asked to volunteer unfamiliarity with “language or terms” in a particular question but without a provision to indicate exactly which words the respondent is not familiar with.
-
The 12-month reporting period, especially for voluntary behaviors (where records may be expected to be less complete than for required use) may have caused significant problems.
-
Unusual response scales are sometimes used. For example, in a five-point agree-disagree scale, the midpoint is rather oddly labeled “uncertain,” rather than the more common “neutral” or “neither agree nor disagree.”
These points are illustrative, not exhaustive, but they give a sense of the types of issues that a future cognitive interview or usability protocol might address. In view of the deficiencies noted above, it is the determination of the committee that much more could have been done to make the survey more user friendly and easier to navigate.
Finding 5: Many features of the survey were not user friendly or optimally designed to aid navigation.
The following are some of the usability and cognitive issues that might have been explored more directly in the pretesting:
-
Usability
-
Actually reading instructions
-
Actually reading definitions
-
Correctly following instructions
-
Correctly using definitions
-
-
Cognition
-
Comprehension of instructions
-
Comprehension of definitions
-
Determining whether the requested information is generally available to the respondents
-
-
Data availability
-
Are records kept about the kinds of information requested in the survey?
-
Will multiple staff be required to provide all the requested information?
-
Finding 6: There were several material weaknesses in the procedures for instrument testing.
Among the issues that deserve further exploration in the event of a follow-on survey are the following:
-
There appears to be insufficient follow-up of the problems, reported in several places, experienced by small businesses. The potential for a concentration of response error among small business could have important implications for the analyses.
-
Any use of a test-retest procedure to verify that revisions were actually improvements seems to have been slight or nonexistent.
-
There is no mention of the ability of respondents to report for the 12-month period requested in many of the questionnaire items (or, more importantly, whether a shorter reporting period might have improved accuracy for some topics).
-
Although it was mentioned that sometimes only training data were available in lieu of actual data, it does not appear that consideration was given to asking for the source of data for relevant items, which may have been useful in providing more informative, detailed descriptions of the nature of the reported data.
-
There is mention of problems with definitions or following skips, but little information is provided about the extent of such difficulties or what was done to address them.
-
Where changes were made, it is sometimes difficult to determine exactly what they were (e.g., “Reducing the number of columns and other strategies were implemented to make the two tasks required in Table 12 more apparent to respondents and to minimize the potential for respondent confusion”).
-
In other cases, it is not obvious how a particular change was responsive to the particular respondent problem; for example, “Both tables for respirator types by hazard types were too complex for respondents to follow—they had difficulty figuring out what their task was. The font size was
-
enlarged and reverse printing was substituted by a light shade of titles.”
-
While it is noted that “there were very few reports of ambiguity or confusion about terms,” without knowing more about the test protocol it is not clear how well this was determined. A reliance on volunteered comments could well produce such a result, possibly missing many such problems.
In general, the documentation about the details of the testing, the resulting instrument revisions, and the efficacy of those revisions was inadequate. Although the testing appears, overall, to have uncovered a large number of problems, it is difficult to determine the effectiveness of the solutions without explicit examples or results of their retesting.
Questionnaire Content
The questionnaire that evolved from the pretesting processes had some fairly unique and innovative characteristics:
-
It collected fairly extensive information on the person who was responsible for completing the questionnaire, including whether he or she was responsible for directing and overseeing the use of respirators and the person’s education, training, and experience.
-
It reduced respondent burden by eliminating those establishments in which employees had not used respirators, or had not used them in the past 12 months, from further participation after just one or two substantive questions.
-
It contained photos of respirator types (including a photo of the two-string dust mask that was not considered a respirator by many of the respondents in the pretests).
-
It contained many text boxes that defined technical terms, as well as bulleted subpoints that elaborated on the meaning of the questions and the proper interpretation of the “yes,” “no,” and “don’t know” answers.
The questionnaire was divided into five major sections: information about the contact person, information about respirator use and general practices, questions pertaining to APRs, questions pertaining to ASRs, and information about fit-testing practices.
Sample Design
To understand the sample design for the SRUP, it is important to first review the sample design of the 1999 Survey of Occupational Injuries and Illnesses (SOII), from which the SRUP sample was taken. According to BLS documentation,10 a two-stage selection process was applied to generate the SOII sample. The first stage was the sample selection of establishments (sample units); then from within those sample units, sample cases were selected, based on days away from work. These sample cases yielded demographics and detailed case characteristic information.
The frame for the SOII was derived almost exclusively from the Quarterly Census of Employment and Wages (QCEW), or ES-202, program. These data include all establishments11 subject to state unemployment insurance (UI) laws and federal agencies subject to the Unemployment Compensation for Federal Employees program. Each quarter, the state agencies edit and process the data and send the information to BLS in Washington, D.C.
In the SOII, an independent sample was selected for each state—an accommodation of the fact that the survey is a federal-state cooperative program and the data must meet the needs of participating state agencies. The sample was selected to represent all private industries in the states and territories. BLS documentation states that the sample size for the SOII was dependent upon (1) the characteristics for which estimates were needed, (2) the industries for which estimates were desired, (3) the characteristics of the population sampled, (4) the target reliability of the estimates, and (5) the survey design employed.12
Establishments in each SOII stratum were selected for the survey based on the reported total number of lost workday cases. A key feature of the sample design is its use of stratified random sampling with a modified Neyman allocation13 of the sample among strata. The establishments were stratified by state, SIC, and employment size class. Because these characteristics are highly correlated with an establishment’s number and rate of recorded injuries and illnesses, stratified
|
10 |
Bureau of Labor Statistics, Occupational Injuries and Illnesses: Counts, Rates, and Characteristics, 1999, Appendix A: Scope and Method of Survey, Bulletin 2551, Washington, D.C., 2002. pp. 422-423. |
|
11 |
The definition of establishment for the SRUP was based on the QCEW, which provided the sampling frame for both the SOII and the SRUP. All employers covered by state UI laws are required to submit monthly employment figures representing the number of people either working during or receiving pay for the payroll period including the twelfth of the month and the total wages paid during the quarter. An establishment is usually a single place of business, which is engaged in a single business activity and operated by a single employer. Business firms operating more than one establishment, in which the sum of employment in secondary locations totals 10 or more persons, are required to submit a separate report for each unit unless the payrolls are not maintained separately. If two or more units of a single employer are in a single physical location, but maintain separate payroll records and engage in distinct or separate business activities, then each unit is treated as a separate reporting unit. These definitions are standard for all BLS and Census establishment-based surveys. The QCEW program conducts ongoing surveys to verify and update the location and type of economic activity occurring at each establishment. |
|
12 |
Ibid., p. 422. |
|
13 |
The Neyman allocation is designed to produce the minimum sample size that will provide an estimate with a fixed sampling variance. For the largest employment size classes, the allocation procedure places all of the establishments of the frame in the sample; as employment decreases, smaller and smaller proportions of establishments are included in the sample. Bureau of Labor Statistics, Handbook of Methods, Chapter 9: Occupational Safety and Health statistics; Available at http://www.bls.gov/opub/hom/homch9_g.htm. |
sampling provides greater precision and, thus, results in the need for a smaller sample size than a comparable simple random sample of establishments.14
According to study documentation, the sample size for SOII varied by state depending on the number of estimates, desired precision, and budgetary constraints. Establishments were selected within the “target estimation industry” (TEI) strata. These strata varied by states, since states set TEIs that they are interested in publishing. The TEIs are equivalent to different-level North American Industry Classification System (NAICS) codes—a state may set some six-digit NAICS, some five-digit NAICS, and some three-digit NAICS as its TEIs. Another state may only set two-digit NAICS as its TEIs. All aggregations from the level of the TEI up are also published if they meet publication criteria. The national office sets TEIs for national estimates. No specification was given as to how this sample was chosen from the frame of eligible businesses. Most likely, stratified simple random sampling (without replacement) was used, but this can only be speculated.
Study documentation suggests that the allocation used in the SOII sample was a modified Neyman allocation that was directly related but not strictly proportional to the amount of variation in key study measurement within strata.15 No rationale for the modification or why the lost workday case (LWDC) ratio was used as the outcome measure for the allocation decision was provided to the committee. If reasonable information on within-stratum variation of the key study measures was available for each stratum, this allocation would be optimum in some sense (i.e., produce minimum variance for fixed sample size or cost) for SOII key measures but not necessarily for key outcome measures for the SRUP.
More specifically, five parameters were considered in determining the sample size for each SOII sampling stratum:
-
Target relative standard error for total lost workday cases
-
LWDC ratios (LWDCs in the set divided by total employment in the set)
-
Coefficient of variation (CV) for LWDC
-
Frame unit counts
-
Frame employment counts
For all strata involving the largest size class, all frame units were selected, and the allocation formula used in each of the remaining strata can be seen in Figure 4.1.
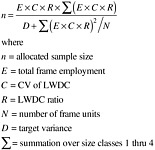
FIGURE 4.1 Neyman allocation equation. SOURCE: Burdette, T., and S. Lang. 2003. Occupational Safety and Health Survey of Occupational Injuries and Illnesses, sample design. Presentation at SOII Sample Design Seminar.
A practical outcome of the Neyman allocation was that the largest employment size classes, with their greater variation in study outcome measurements, were in the sample with certainty (certainty strata), and smaller proportions of medium and small establishments with smaller variation were included in the sample. The certainty strata are usually composed of establishments with 1,000 employees or more.
SRUP Sample Frame
An ideal “target population” 16 for a survey of respirator use in the workplace would have been (1) all establishments (i.e., physical locations at which one or more persons are employed) in the United States and (2) all persons working at these establishments. As quite often happens in survey operations, the sample frame turned out to be something other than the target population, for practical reasons. The frame file that was used to select the respirator survey sample consisted of units that were coded usable for estimation in the 1999 SOII. These frame units were all respondents to the 1999 survey and were familiar with BLS, and contact names from the 1999 survey were also included on the file so that respondents could be recontacted, if needed. Because of these factors, BLS had expected a better-than-usual response rate to this voluntary survey.
The SOII sampling frame exclusively used the QCEW lists. As a result, this SOII sampling frame became somewhat problematical for the SRUP because it restricted the sample coverage of the SRUP to the private sector, but not all of the
private sector. Although the QCEW currently covers approximately 98 percent of all employment, the major exclusions from unemployment insurance coverage—the self-employed and certain nonprofit organizations—tend to represent a significant fraction of the workforce in some sectors in which respirator use may be significant. For example, the self-employed exceed 20 percent of the construction workforce.17 Many of these self-employed construction workers may have the same occupational health and safety issues as regular employees. Some may even be misclassified as self-employed subcontractors. A recent study estimated that more than 14 percent of all construction establishments in Maine misclassified employees as independent contractors (not covered by unemployment insurance).18 Because small-employer-dominated sectors such as construction are associated with high risks, high rates of respirator use, and generally poor compliance, targeted surveillance may be necessary to evaluate the adequacy of such a sampling frame. Other uncovered employee groups—such as temporary employees, employees of very short-lived establishments, and informal sector employees—are also likely to be missed when the unemployment insurance list is used as a frame. Of course, consumers using respirators at home are also missed. (Presumably these are outside the scope of where the National Personal Protective Technology Laboratory [NPPTL] should be directing research).
SRUP Sample Size
The overall sample size for the SRUP was determined as follows. First, note that the supplemented subsampling frame for the SRUP (i.e., the set of SOII respondents) had been reduced to 40,002 private industry establishments for the SRUP by an iterative process in which design considerations were tempered by cost constraints. Considering that few historical data were available, BLS statisticians made some assumptions about needed standard errors of SRUP and thereby determined sample sizes for various sample designs. It was established that a sample of 23,400 establishments would produce industry division estimates with a 5 percent relative standard error (RSE), and that 48,750 sample units would produce estimates at the two-digit SIC level with a 10 percent RSE. The 40,002 figure was a compromise between the two designs and was determined with cost in mind.
Finding 7: NIOSH did not set specific precision objectives for key estimates of population subgroups from the SRUP.
In the absence of clear precision goals it is therefore difficult for the committee to assess the adequacy of sample sizes for the overall population and for various population subgroups (e.g., by region, by type of business), since the only known precision constraint (used in determining the overall sample size) was set by BLS staff.
SRUP Stratification and Sample Allocation
The sample of establishments chosen for the SRUP was stratified in much the same manner as the SOII, and the overall SRUP sample size was strategically allocated among strata. The SRUP sampling strata were constructed by cross-classifying by the following two-digit industry codes and size classes:
-
The following industries, classified based on the 1987 SIC Manual, were included in this survey: agriculture, forestry, and fishing, SIC 01-09; metal mining, SIC 10; coal mining, SIC 12; oil and gas extraction, SIC 13; sulfur mining, part of nonmetal mining, SIC 14; construction, SIC 15-17; manufacturing, SIC 20-39; railroad transportation, SIC 40; transportation and public utilities, SIC 41-42 and 44-49; wholesale and retail trade, SIC 50-59; finance, insurance, and real estate, SIC 60-67; and services, SIC 70-87 and 89.
-
The five size classes were size class 1 = 1-10 employees; size class 2 = 11-49 employees; size class 3 = 50-249 employees; size class 4 = 250-999 employees; and size class 5 = 1,000 and more employees.
This sample was supplemented by sample units for SIC 10, 12, 14, and 40, which were not in scope for the 1999 survey. These sample units were provided to BLS by the Mine Safety and Health Administration and the Federal Railroad Administration.
While the stratum variables for the SOII and SRUP are the same, it should be noted that the strata formed for the SRUP were not precisely the same as those used in choosing the SOII sample. BLS modified the SRUP strata to conform to two-digit SIC codes and size classes.
Sampling stratification is used to improve the precision of overall estimates aimed at the target population; it may also be used to disproportionately increase the sample size of small, but important, population subgroups that can at least be partially isolated by sampling strata.19 While the rationale behind forming the sampling strata for SRUP (i.e., defined by the SIC and the number of employees) was not explicitly indicated, it appears that their main practical utility was to define population subgroups for which estimates (e.g., the number of industries using respirators) would later be produced for the SRUP report of findings. This is an appropriate strategy, for which the BLS sample designers are to be commended.
The sample for the SRUP was allocated to its sampling strata based on OSHA estimates of the percentage of establishments using respirators. The expected number of establishments that used respirators in each stratum was based on the OSHA Personal Protective Equipment Cost Survey, conducted in 1998-1999.20
Finding 8: The choice of stratification variables for the SRUP sample design appears to have been appropriate, since many of the survey’s reported findings by type and size of industry were quite different (e.g., respirator use). The rationale for using the allocation for the SRUP subsample among strata was to maximize the yield of companies with higher rates of respirator usage. This allocation, which made each stratum sample proportional in size to the expected number of establishments in the stratum that use respirators, may not have been optimal to improve the precision either of overall survey estimates or of estimates for population subgroups defined by the strata, but it did serve to increase the proportion of sample companies that reported respirator use.
SRUP Sample Selection
Within each SRUP stratum, the subsample of establishments was selected using an adaptation of the probability-proportional-to-size systematic sampling method. The purpose of the adaptation was to minimize variation in selection probabilities (and thus the sample weights used for analysis) within each stratum. This was accomplished by selecting each member of the sample in each stratum by using its final adjusted SOII sample weight as its “size” measure. Sample selection in this manner was accomplished using a BLS in-house selection software package called the Sample Unit Extract sampling algorithm.21
Implications of the SRUP Two-Phase Sample for Analysis
An advantage of the two-phase or double sampling that was used for the SRUP is that the SRUP sample is a sub-sample of the SOII respondent sample, implying that survey data from the SOII could be linked to each SRUP respondent record. Moreover, these linked data could have been used to produce potentially more precise SRUP estimates.
Finding 9: More could have been done with the characteristic of the SRUP being a subset of the SOII to build strength into the estimates in that a sample that is the second phase of a “two-phase” or “double” sample can gain power from the first-phase sample.
The first phase in a two-phase sample can improve stratification or estimation in the second phase, if utilized appropriately. To do both, the strata must be defined consistently (if not identically) in both phases of sampling, to permit analysis of the SRUP sample as a two-phase sample. It was not clear from the documentation of the SRUP sample if stratum consistency in this way was attempted. Inconsistency between the SOII and SRUP strata limits the ability of the two-phase SRUP sample to be analyzed as such. For instance, it is not clear if the use of ancillary data from the SOII was considered to improve the precision of SRUP estimates through regression or ratio estimation.22
Data Collection
Overall Assessment
Finding 10: The SRUP used a basic collection design that is fairly typical of many establishment mail surveys conducted by federal agencies. However, the SRUP data collection design did not use several state-of-the-art techniques that would likely have produced a higher response rate and enhanced data quality.
Overview of the Data Collection Process
Because BLS lacked a field infrastructure to conduct this survey, it engaged the National Opinion Research Center (NORC) to perform a number of functions for this survey. Most basic survey functions were contracted out, including mail-out, check-in of questionnaire, data entry, nonresponse mailing, and nonresponse callbacks. In turn, NORC subcontracted the survey mail-out, check-in, data entry, and nonresponse mailing functions to Data Service Solutions (DSS) of Plainfield, Illinois.
The survey was mailed to sampled employers in August 2001 by DSS. The subcontractor conducted a nonresponse mailing in October 2001. This nonresponse mailing consisted of resending the original questionnaire to the nonrespondents.
Telephone nonresponse callbacks were performed by NORC from December 2001 through February 2002. At the start of telephone nonresponse callbacks, the response rate was 48 percent. The final response rate for the respirator survey was 75.5 percent. In essence, this means that the collection mode for two-thirds of the survey respondents was mail and for one-third of the respondents was telephone.
Survey Respondent
The questionnaire was addressed to a named individual in each sampled establishment—the person who responded
|
20 |
See Chapter 2. |
|
21 |
This generalized BLS sampling system has subsequently been replaced by a system specific for occupational safety and health. |
|
22 |
Cochran, W.G., Sampling Techniques, 3rd Edition, New York: John Wiley & Sons, 1977. |
to the 1999 SOII survey. Addressing the questionnaire to a specific person in the establishment has been shown to produce higher response rates,23 especially when, as in the case of the SRUP, the contact person has participated in a prior BLS survey. However, while the 1999 SOII respondent may have known whether or not the establishment used respirators, it was often likely that this person was not the desired respondent, defined as “the person most familiar with the use of respirators at the Reporting Site.” Thus, it was necessary to rely on the initial questionnaire recipient to forward the questionnaire to someone else who fit that description, which made follow-up contacts more difficult and less effective. Also, there was a risk that the initial questionnaire recipient would not forward the questionnaire and, instead, would provide an uninformed response to the survey or no response at all.
Identifying the best-qualified respondent in advance of the questionnaire mailing has been shown to be an important contributor to data quality and high response rates.24 This approach would have offered several advantages:
-
It would have removed businesses that had not used respirators in the past 12 months, or had used them only on a voluntary basis, from further involvement, thus allowing the mail survey to focus on the establishments of interest (i.e., those that had required respirator use in the past 12 months). Had this approach been used in the SRUP, it would have eliminated 84 percent of the sample establishments.25
-
It would likely have improved the accuracy of the data collected because the data source would have been prescreened knowledgeable respondents.
-
Response rates to the mail survey would likely have been higher because the advance telephone contact with the respondent would have helped establish rapport, and the short telephone interview followed by the longer mail questionnaire would have benefited from the “foot in the door” phenomenon (i.e., getting respondents to perform a large task by first asking for their help with a smaller task).26
While this approach would have added the cost of a round of telephone calls to all establishments prior to the start of the mail survey, it would have greatly reduced the size of the mail survey and nonresponse telephone follow-up, with attendant savings in labor, postage, telephone, and related costs, and would have likely resulted in a higher response rate and enhanced data quality.
Number and Types of Contacts
The data collection protocol included a questionnaire mailing, a replacement questionnaire mailing to nonrespondents about six weeks later, and a telephone contact to remaining nonrespondents two to four months after that. This is a basic design that is fairly typical of establishment mail surveys conducted by federal agencies. Use of the telephone as the final contact is an effective method for increasing response rate and is particularly appropriate for surveys such as the SRUP that have a high ineligibility rate.27
Although the SRUP approach is typical of federal establishment surveys, research has shown that more contacts generally produce faster response and higher response rates.28 Also, the timing of the replacement questionnaire mailing and the nonresponse follow-up calls was not ideal. Had the SRUP rigorously followed the Tailored Design Method advocated by Dillman,29 generally recognized as the premier authority on mail surveys, the design would have included the following:
-
Sending a brief pre-notice letter a few days in advance of the questionnaire mailing (this could have been omitted if the advance telephone screening call had been made, as described above);
-
Sending a thank-you or reminder postcard a week after the questionnaire mailing;
-
Sending the replacement questionnaire mailing two to four weeks after the initial questionnaire mailing; and
-
Making the nonresponse follow-up calls beginning one week after the replacement questionnaire mailing. (If the advance telephone screening call had been made, the sample size would have been greatly reduced and would have allowed for fairly prompt completion of the nonresponse follow-up calls.)
Response Rate
The final response rate for the survey was reported to be 75.5 percent30—somewhat higher than the 70 percent anticipated response rate that was projected in the OMB clearance documentation for the survey. According to a presentation made by BLS to the committee,31 the response rate was computed as follows:
-
40,002 total sample
-
37,989 viable (eligible)
-
28,682 responses
-
28 unusable
-
28,654 clean
-
75.50 percent response rate.
The committee notes that there are two problems with the computation of the response rate in this manner:
-
Most (84 percent) of the 28,682 responses were from establishments that did not use respirators, or used them only on a voluntary basis. These establishments only completed up to four introductory questions. The focus of an important part of the analysis of SRUP data was on establishments that used respirators on a required basis in the past 12 months. The response rate for this group could have been computed using information on respirator use collected during establishment contacts as part of nonrespondent follow-up, but it was not reported. The response rate for respirator users would have provided another useful indication of the effect of nonresponse on SRUP findings.
-
The calculation that produces the 75.5 percent response rate just includes the SRUP and does not consider nonresponse to the SOII. Since the SRUP is actually a subsurvey of the SOII survey respondents, a more appropriate response rate for the SRUP would be the product of the response rates at each phase.
Finding 11: The reported overall SRUP response rate of 75.5 percent paints an incomplete picture of the impact of nonresponse on all key SRUP findings. In addition to findings on the percentage of respirator use among all companies in the sample, the survey findings also focused heavily on companies with required respirator use, and the response rate among these companies is not reported.
Although the published response rate as computed in the manner described above met the expectation of the survey managers, the response rates might have been better. The SRUP did not use several data collection procedures that have been shown to increase mail survey response rates. According to Dillman’s Tailored Design Method, the SRUP would have benefited from the following:
-
Make an advance telephone screening call to identify the best-qualified respondent and eliminate ineligible establishments (i.e., those that have not required use of respirators in the past 12 months).
-
Send a pre-notice letter (this can be omitted if an advance screening call is made) and a thank-you or reminder postcard, for a total of five contacts.
-
Follow Dillman’s recommendations cited above concerning the timing of the contacts.
-
Personalize all mailings (address the questionnaire recipient by name). Print the transmittal letters on a NIOSH or BLS letterhead. Include a date and a signature. Include a toll-free phone number to call if the respondent has questions (a phone number was included in the initial questionnaire transmittal letter, but it was not toll free). Use a different, stronger appeal in the transmittal letter that accompanies the replacement questionnaire mailing to nonrespondents (the SRUP simply remailed the original letter or questionnaire). Follow Dillman’s guidelines for the format and content of the mailings.
-
Use real stamps instead of “business reply” postage on the return envelopes included in the two questionnaire mailings.
Nonresponse Follow-up
BLS trained NORC telephone nonresponse callback personnel in types of respirators, background of the survey, background of the BLS sample, and an interactive test on respirators (similar to the one NIOSH provided BLS). Because NORC has a great deal of experience in procedures for survey nonresponse callbacks, BLS did not conduct training in this area. During the telephone nonresponse callback, employers who responded that they had not used respirators in the past 12 months had study data collected during the call and keyed into a data set that NORC delivered to BLS. Employers who responded that they had used respirators for required emergency or nonemergency use in the past 12 months were prompted to send in their questionnaire, and the data were keyed into a data set and delivered to BLS. (This prompting was done because the length of the questionnaire made it difficult to collect all items over the telephone.) For employers who did not mail back a questionnaire after responding “yes” during nonresponse callback, data were imputed from usable similar responses in the sampling strata.
Nonresponse callbacks were made by experienced NORC telephone interviewers, following training on the survey content by BLS staff. Case management software was used to schedule calls and control the caseload, and
a computer-assisted telephone interview application was used to guide the telephone contact and capture the data collected.
In reviewing the SRUP protocol, the committee observed that there was no provision for a follow-up contact of refusals; if the person contacted refused to provide the requested information, the case was coded out as a final refusal. This is surprising because a conversion attempt by another telephone interviewer, often a specially trained telephone “converter,” is a fairly standard component of many federally funded telephone surveys. It should have been possible for an experienced converter interviewer to obtain answers to the screening questions regarding respirator use for a significant percentage of refusal cases. This would have resulted in a completed interview for non-respirator-using establishments, thereby increasing the overall response rate. It would also have helped identify additional respirator use establishments among the nonrespondents, which would have helped inform the post-data collection imputation process. This would also have contributed to determining a response rate for the target population of respirator use establishments.
Data Processing Errors
The data processing stage of a survey is another potential source of error. The most common types of processing errors can occur at the data entry and editing stages of the survey. With responsibility for overall data collection, the NORC subcontracted the survey mail-out, check-in, data entry, and nonresponse follow-up functions to DSS. There is no indication that there were any quality issues with the data entry stages of the survey. Indeed, with quality management techniques, key entry is not a very error-prone operation.32 The survey questionnaire data were double-keyed to minimize the potential for data entry keying errors. This is an appropriate quality-enhancing measure.
More substantial errors can arise in data editing, since this step is susceptible to errors in the specification of models for identifying which data should be flagged for editing and in the procedures for dealing with them once they are identified. In this stage, BLS identified 161 levels of potential error and set up protocols for deciding which responses needed a follow-up action. When inconsistent or potentially invalid responses were identified, trained BLS personnel recontacted the respondents for clarifications. Training for BLS personnel responsible for these callbacks was extensive. This training consisted of background information on the survey, identifying respirator types (including an interactive test similar to the one provided to BLS by NIOSH), a complete review of the questionnaire, and training to conduct effective telephone interviews (including role playing).
Although there is evidence that these careful procedures were followed, there was no systematic compilation of the results of the edits and recontacts, so it is not possible to assess the adequacy of these measures. A compilation of the results of the edits and recontacts could have been analyzed to see what could be learned about the reasons for the edit problems. Before conducting a similar survey in the future, it would be informative to analyze the changes made in the SRUP as the result of the editing process (i.e., compare the original keyed data with the final cleaned data set) to identify the frequency and types of edit problems encountered and problems with the questionnaire content or format that may have contributed to the edit problems.
Finding 12: The performance of extensive machine editing and error resolution follow-up contacts showed commendable attention to resolving inconsistent and invalid responses.
The committee is concerned that no assessment was made of response and nonresponse bias. The following are some measures that could have been taken to address data quality, but were not employed in this survey:
-
Select a sample of respondents who said they did not have respirators and call them back. Explain that BLS is conducting a quality check and ask the persons how certain they are that the company does not use respirators. If the person is uncertain, ask to speak to someone who would know this information. This is an example of a “true value re-interview” study to estimate response error33 or a “response analysis survey” toward the same end.34
-
Select a sample of “final” nonrespondent establishments and call them back. Ask to speak to the person most knowledgeable about respirator use (who may or may not be the person to whom the mailings were addressed) and explain that BLS is conducting a quality check and just needs to know if the company uses respirators. This would have enabled BLS to estimate the response rate among companies that use respirators (which could be considerably different from the overall response rate) and would have provided an important indication of the potential for nonresponse bias among companies using respirators.
-
As a related point, ancillary information from the SOII might also have been used to assess the effect of bias due to unit nonresponse, since there would have been SOII substantive data (i.e., related to the purpose and key measurement outcomes of the study) that would be available for SRUP respondents and nonrespondents (since the SRUP sample was selected from a subset of SOII respondents).
-
When one has substantive data for both respondents and nonrespondents, it is possible to directly estimate nonresponse bias,35 at least for SOII key outcome measures, which would have given BLS an indication of the effect of nonresponse on the SRUP data.
Weighting and Estimation
While BLS seems to have followed industry standards in producing sample weights for SRUP data, the weighting process appears to have been poorly documented (based on materials available during the course of the committee’s assessment). Little documentation was available from BLS regarding the weighting approach followed. Moreover, no rationale or detailed formulas (to provide a complete assessment of the approach) were available.
More specifically, weighting in a two-phase sample should account for sampling and nonresponse in each phase, with final calibration of the nonresponse-adjusted weights to the target population (defined here as those businesses in the SOII frame that meet the eligibility requirements for inclusion in the SRUP). It appears that the final adjusted SRUP sample weights account for Phase 2 sampling rates and nonresponse, with calibration to the SRUP target population somehow (the source(s) of calibration data are not indicated). Thus, it appears that Phase 1 sampling and nonresponse may not have been directly accommodated in computing the weights.
Adjustment for Unit Nonresponse
Compensation was made for two levels of nonresponse in this survey. The first level was establishment (i.e., unit) nonresponse adjustment. For each sampling stratum—two-digit industry and size class—a nonresponse adjustment factor was computed as the sample count of the study-eligible establishments in the stratum divided by the corresponding number of usable establishments in the stratum. Sample establishments that were out-of-business or post office returns from both mailings were considered ineligible. Usable questionnaires were responses that had no outstanding level 1 or 2 edits that caused the schedule to be unusable in final estimates. If a sampling stratum did not have any usable questionnaires, the stratum was combined with all other size classes in the two-digit industry, and nonresponse adjustment was computed for those strata at the two-digit industry level.
Unit nonresponse in population samples often leads to unplanned imbalance in the sample due to differential rates of nonresponse in the selected sample. The degree and nature of this imbalance in SRUP is not known, since the final response rate of sample businesses is not given and findings from an assessment of patterns of response rates to indicate the degree of sample imbalance due to unit nonresponse were not conducted. An assessment of patterns of nonresponse typically precedes the calculation of a weight adjustment to compensate at least partially for the biasing effects of this sample imbalance.
For stratified establishment samples, this weight adjustment for any responding establishment is computed by multiplying the inverse of the establishment’s selection probability by the inverse of its estimated response propensity (i.e., the inverse of the response rate among all study-eligible establishments in its stratum). This approach is called a weighting class adjustment for nonresponse,36 where the “weighting classes” are the sampling strata for the SRUP. If the variables used to define SRUP strata are highly correlated with key study measures for the SRUP (presumed) and response rates differ among SRUP strata (unknown), then this adjustment will successfully reduce (but rarely eliminate) the bias due to unit nonresponse.
Calibration Adjustment
The final adjustment of sample weights is typically a multiplicative adjustment to adjust the existing weights so that the distribution of the final set of weights matches the corresponding distribution of the target population with respect to variables that are thought to correlate with key study variables. This calibration process, also called “post-stratification,” or an adaptation known as “raking” is done to improve the precision of survey estimates and to adjust for other factors that may lead to biased or imprecise estimates (e.g., time differences between when the frame was constructed and when sample data are obtained, differentially incomplete frame coverage).
The SRUP sample was apparently calibrated to population frequencies from the BLS Covered Employment and Wages, or ES-202, program.37 A benchmark factor was computed for establishments and for employees. The final weight used for respirator survey establishment and employment estimates was the final sampling weight multiplied by the nonresponse adjustment factor times the benchmark factor for establishments.
Effect of Variable Weights
Previous research has shown that variable weights can increase the variance of survey estimates (and thus reduce their statistical quality) in an amount that is directly related to how variable the weights are.38 No indication of the
extent of weight variation is provided, although the use of what appears to be a step to trim (or reduce the variation of) weights (an “outlier adjustment factor”) seems to indicate that the adjusted weights were in fact deemed sufficiently variable that a separate trimming step in the weighting process was in order (although it is not specifically mentioned in the appended technical documentation to the SRUP report of its findings). Again, without details on the formulas and rationale for the statistical step, there is no basis for any assessment beyond conjecture based on apparent computational steps. The usual approach for dealing with variable weights is to trim them or to otherwise control the size of the largest weights or adjustments.39
Statistical Efficiency of Estimation Strategies
Little documentation is given to determine how estimates from SRUP data are prepared. Weights are available and used in the analysis. It should be assumed that SRUP data analysts knew how to use them and in fact did use them in all analyses. The section on “final weights” in the SRUP report of findings seems to suggest this for estimated totals in the SRUP findings monograph at least.
Variance Estimation
It is generally viewed as good survey practice to produce measures of the quality of survey estimates along with the estimates themselves. Some of the common quality measures are variances, standard errors, and margins of error of survey estimates.40 BLS traditionally computes an estimate of variance using a balanced repeated replication technique. In this case, the agency applied SAS Version 6.0 to accomplish this task.
The standard error is used to define a range (confidence interval) around the estimate. BLS typically uses a 95 percent confidence interval—the estimate plus or minus 1.96 times the standard error. For example, the 95 percent confidence interval for an estimate of 50,000 establishments using respirators with a relative standard error of 1 percent would be 50,000 plus or minus 2 percent (2 times 1 percent), or 49,000 to 51,000. The total estimate for respirator use in the last 12 months of 281,776 establishments has an estimated relative standard error of less than 1 percent (see Table 4.1 for standard errors found in the SRUP report of findings).
TABLE 4.1 Standard Errors for Numbers of Establishments and Employees That Required Respirator Use in the 12 Months Prior to the SRUP, by Industry Division
|
Respirator Use |
Number of Establishments Using Respirators |
Number of Employees Using Respirators |
|
Private industry |
196 |
2,677 |
|
Agriculture, forestry, and fishing |
156 |
2,026 |
|
Mining |
17 |
564 |
|
Construction |
162 |
3,743 |
|
Manufacturing |
34 |
613 |
|
Transportation and public utilities |
144 |
2,026 |
|
Wholesale trade |
167 |
2,914 |
|
Retail trade |
153 |
1,186 |
|
Finance, insurance, and real estate |
547 |
1,610 |
|
Services |
457 |
5,749 |
|
SOURCE: U.S. Department of Labor. 2002. Respirator use and practices, United States Department of Labor News, 2002, Appendix B. |
||
Finding 13: Although a standard error was calculated for each estimate from this survey, these measures of error were not computed correctly. BLS used SAS Version 6.0 to produce the computations, which yielded appropriately weighted estimates but did not account for stratification in estimating the standard error of estimates.41 Also of concern was the finding that standard errors were not published along with the data in the main report.
Although standard errors for the numbers of establishments and employees that required respirator use in the 12 months prior to the survey, by industry division, did find their way into the BLS press release, they were available only on request for the bulk of the data that appeared in the SRUP report of findings.
Dealing with Item Missing Data
In addition to adjustment for unit nonresponse, BLS used imputation for item nonresponse. The need for imputation arises from the fact that the survey had missing data on some items among the questionnaires that were completed by responding establishments.
There are a number of reasons for item nonresponse. Missing data arise when respondents refuse to answer a question; when they answer that they “do not know”; when the respondent terminates the survey mid-interview; or when the respondent has skipped an item in error.
Several options are available for dealing with item nonresponse in surveys such as the SRUP. BLS could have produced estimates using fully responding establishments
only or using respondents who completed the key items used for analysis. The agency could also have weighted complete cases to make up for missing cases. The agency chose to impute values of missing items using a common technique called the hotdeck imputation method.
The hotdeck imputation method uses reported data based on responses from usable schedules in the same sampling strata to impute missing data. In this method, matching criteria within that strata are used to find a donor respondent. The matching criteria form a “model” for the missing data value. The model employed by BLS was to randomly select replacement data based on the prevalence of responses to the item in the strata. All told, 795 out of a possible 805 units were “hotdecked,” or 2.1 percent of the survey variables.42
The hotdeck method assumes that data are missing at random, where being missing is related to other observed values. An imputation is “good” if it provides unbiased estimates of the variable being evaluated (mean, variance), corrects for potential distributional differences between respondents with missing data and those with reported data, and maintains relationships among associated variables.43 Multiple sets of imputed values are often computed for each missing item to account for the statistical error arising out of the imputation process. It is not clear that this use of multiple imputations was followed.
In addition to serving as a method of imputing values to missing data items, an imputation method can also serve as a check on the quality of the responses by providing an indication of the type of item “missingness.” This measure was not employed—it would have been a useful tool for assessing the quality of the data collection protocol followed for the SRUP.
Assessment of Findings
In this section, the committee comments on (1) the appropriateness of conclusions reached from SRUP data and (2) the utility of SRUP data and findings to the user constituency of the SRUP. These elements of the charge to the committee are considered together. Appropriateness is related to the quality of the application of statistical methodologies and techniques in all aspects of the design and implementation of the survey. The committee summarizes its findings on the quantitative measures of appropriateness that are discussed above. This is followed by a more subjective evaluation of the usefulness of SRUP analysis, presentation of its findings, and release of its data, which are also aspects of the appropriateness of conclusions.
Appropriateness of the Conclusions. An assessment of the appropriateness of conclusions considers the quality of the data; that is, the accuracy, timeliness, and reliability of survey results. There are generally two broad methods used to interpret data quality: validation, a process whereby data are analyzed before their release to avoid gross errors and eliminate poor-quality data, and sources-of-error studies (sometimes referred to as error profiles), which provide quantitative information on the specific sources of errors in the data.44
There is evidence that BLS paid due diligence to the task of validating the data to avoid gross errors. The survey employed elaborate editing and data clarification to identify invalid and inconsistent data and, as discussed above, utilized data clarification routines that should have insured against processing and other types of errors. However, there has not been a systematic sources-of-error study to evaluate coverage errors, nonresponse errors, measurement errors, processing errors, and sampling errors.45 This review considered many of the elements that are normally considered in a sources-of-error study, but by no means with the systematic rigor that a statistical agency could apply. In conducting this assessment, the committee did not learn of any field studies or other separate error component investigations that would suggest NIOSH’s intention to conduct a sources-of-error study in conjunction with the SRUP.
The several indications of shortcomings in the design and implementation of the SRUP outlined in this chapter give the committee pause in being able to pronounce that the survey’s conclusions are fully appropriate. They were made from data and estimates based on a reasonably sound survey design and field operation, but where no clear attempt was made to measure the quality of the survey measurements needed for both. Estimates of the use of respirators in the workplace provided by employers in establishments selectively represent establishments that might be expected to use respirators based on responses to the Survey of Occupational Injuries and Illnesses and other sources. To that basic extent, the conclusions are appropriate. The sources and sizes of the nonsampling errors in the estimates on which these conclusions are based are unknown, however.
Utility of Data and Findings
Data Release. Timeliness of release of findings is an aspect of data utility, and the agencies succeeded in this aspect of survey operations. Findings from the SRUP report were disseminated in a timely manner in the form of BLS and NIOSH press releases and, soon after, in several analytical articles. The survey data collection was begun in August 2001, with data pertaining to the 12-month period occurring between August 2000 and January 2001. Within less than a year of the time of collection, in March 2002, BLS provided the initial tabulated data from the survey to NIOSH.
The first public release of these findings was in the form of a BLS press release entitled “Respirator Use and Practices” (USDL 02-141), which was issued on March 20, 2002. NIOSH followed the BLS release with its own release two days later. The release, entitled “Findings of Survey Co-developed by NIOSH Will Help Respirator Research, Recommendations” was issued as a NIOSH Update on March 22, 2002.
In September 2003, BLS and NIOSH published a 280-page, 103-table report of the survey results entitled Respirator Usage in Private Sector Firms, 2001. This report comprises the official record of the methodology and survey results. The selection of data presented in the 103 tables reflects the emphasis of the survey and of the NIOSH users. Most of the tabulations were presented by industry division, although several tables presented the cross-tabulations by employment size group. In a departure from usual BLS practice and in contrast to the procedures for publishing data from the SOII, for example, the publication did not present information on the statistical precision of the estimates. Tabular footnotes stated that “a measure of sampling variability for each estimate is available on request.”
Summary of the Findings. The voluminous data published in the NIOSH-BLS report clearly provided “a greater level of detail than any previous study of job-related respirator use.”46 The major findings of the study addressed two levels of data: (1) the number of establishments and employees using respirators, by type of respirator and type of use, and (2) the characteristics of the respirator program at the establishment level.
As for the number of establishments, the SRUP estimated that respirators were used for voluntary or required purposes in about 620,000 (or 10 percent of) workplaces —a number somewhat smaller than previously estimated. This estimate of the total number of establishments in which employees used respiratory protection equipment differed from estimates previously published. The OSHA Final Economic Analysis estimated that approximately 1.3 million establishments, or about 20 percent, had employees who use respirators, while the personal protective equipment cost survey estimated 684,000 reported respirator use.
The number of employees who used respirators for required purposes totaled 3.3 million in the 281,800 workplaces estimated to have required use. (Because of the construction of the questionnaire, it was not possible to obtain an estimate of the total number of employees who used respirators both voluntarily and as required.) Again, this number was substantially different from three previously published point estimates of the population of respirator users—each with differing sources of input data and employing very different means of estimation:
-
The number of employees “wearing or having access to certified respirators” was in the ballpark of 4.9 million (1980) based on an extrapolation of units sold to employees in mining, manufacturing, and construction.47
-
About 5 million employees in general industry, construction, and shipyards were estimated to use respirators as of 1997.48 This translated to an estimate that approximately 5 percent of employees in these industries were wearing respirators at any one time.
-
In 1999, it was reported that the number of “employees using respiratory protection (other than nontoxic dust mask)” was about 8.7 million.49
Previous estimates of users and establishments varied markedly from the SRUP estimate. The earlier estimates were derived from a variety of sources, each requiring the development of modeling techniques and assumptions that could be challenged, while the SRUP results are direct sample-based estimates but of unknown quality.
Other major findings regarding the total number of establishments and employees using respirators (for both required and voluntary purposes) addressed size of firm and industry. However, the bulk of the data collected and all other published details pertained only to establishments requiring respirator use. Thus, although the survey produced a few estimates of the total prevalence of respirator usage, they are derived from the less than one-half of the firms that required use. Those firms requiring use tended to be larger and somewhat more concentrated in the service-producing sector than in mining, construction, and manufacturing. Interpretation of the details regarding workplace practices and programs should be made with these limitations in mind.
Descriptive Analysis. The press release and the large volume of tables were followed by more focused analytical work. Most of the analysis of the SRUP data was conducted and published by a team of NIOSH surveillance experts. Several of these NIOSH researchers had been involved with this survey since its inception. The team has continued its work in the form of a steady series of articles and poster sessions.
The most comprehensive of these NIOSH articles appeared in the May 2005 Journal of Occupational and Environmental Hygiene.50 In addition to reporting on the survey methodology and the primary findings, the article was enriched with analysis of respirator use with program characteristics. The results focused on the relationship between the designation of a program administrator and program effectiveness factors. For example, 70 percent of establishments with a trained program administrator reported a written procedure for maintaining respirators, and 55 percent of them reported written procedures for periodic evaluations of effectiveness. The reported written procedures for establishments without a trained administrator were 23 percent and 11 percent, respectively.
These findings were an informative aspect of this survey. In essence, those establishments that were reporting no written procedures were admitting noncompliance because written procedures are a matter of compliance with regulations. A number of reasons could be posited for the fact that the reporting establishments so readily indicated they were out of compliance with regulations: perhaps they were comfortable with the BLS pledge of confidentiality; they might have been unaware of the legal requirements; maybe they were confident that the probability of enforcement was minimal or that the probable penalties were insignificant; or they could simply have failed to understand the questions. Since there was no sources-of-error study addressing this matter, it is not possible to give a reason for the apparent reporting of activities for which a citation could be issued.
Several other possible violations of OSHA regulations were noted. Establishments reported that 51 percent of employees in places where respirators were required were not assessed for medical fitness to wear respirators, despite OSHA regulations that the employer must provide a medical evaluation. The study concluded that a “large number of employers do not follow NIOSH recommendations for the selection and use of respirators.”51 It went on to comment that employers either are unfamiliar with the regulatory requirements or are not applying appropriate resources to meet regulatory requirements. Since NIOSH explicitly administers its respirator certification program with the assumption that regulations are being followed, this should be a subject of future investigation at NPPTL, as to whether such compliance is actually necessary for respirators to be effective at protecting employees.
This study introduced, but only briefly, the notion of Indicators of Potentially Inadequate Respirator Programs. The analytical staff identified 15 questions in the survey that could be considered indicators of potentially inadequate programs, depending on how they were answered (Box 4.1). If these indicators are representative, respirator program administrators have a difficult problem on their hands. More than 90 percent of establishments requiring respirators had at least one indicator of potentially inadequate programs, and 54 percent had at least five.
The selection of these particular indicators was quite subjective and seemed to give weight to “don’t know” answers, which may indicate confusion rather than lack of programs. Still, this was a useful attempt to turn statistical data into surveillance intelligence, but it was only a start. This path of inquiry gives an indication of the direction that future research efforts could fruitfully pursue. Even if NIOSH continues to use the information only as indicators of “potentially inadequate” programs, the analysis appears to provide a useful path of inquiry.
In the fall of 2003, the NIOSH team produced an analysis of the substances that prompt the use of respirators.52 The survey had collected information as to whether any of 26 listed substances or categories of substances had prompted the establishment to use APRs and whether exposure assessment by air sampling had been conducted for those categories.
Some of the reported survey results were quite unsettling. For example, a large number of respondents reported that they used disposable dust masks as protection for gas or vapor substances, although, for the most part, disposable dust masks protect only against particulate substances.53 The survey yielded an estimate of about 36,000 establishments, with some 193,000 employees using dust masks in these dangerously inappropriate ways. It would be useful (in future studies) to be able to assess the validity of these responses and, if valid, to identify why the apparently inappropriate protection was being used; was it lack of training, failure to read the labels, or what?
A third significant piece of analysis addressed a key administrative aspect of the NPPTL certification program—the clarity and understandability of the respirator manufacturer’s user instructions to users and of the NIOSH
|
BOX 4.1 Indicators of Potentially Inadequate Respirator Programs
SOURCE: Bureau of Labor Statistics and National Institute for Occupational Safety and Health. 2003. Respirator Usage in Private Sector Firms, 2001. |
approval labels.54 Instructions and labels are an important part of the certification program in that they are intended to transmit information about the mechanics and proper use of the respirator and the approved conditions of use.
On the positive side, the survey found that the instructions and labels had reportedly been received with the equipment and were understood by employees. Nonetheless, a careful reading of the survey results points to a potentially serious inadequacy in application of those instructions and labels in the workplace. The analysis identified a failure of establishments to provide appropriate airflow controls and hose couplings for airline respirators as called for in the instructions. This could result in a dangerous situation for wearers of airline respirators if the devices were inadvertently connected to a line that contained a substance other than breathing air. Based on this information, NIOSH issued a Safety and Health Information Bulletin describing the dangers and recommending actions to prevent fatalities associated with this hazard.
At the time this report was prepared, NIOSH staff were preparing several additional draft manuscripts that were in various stages of review and release.55 These additional studies expand the analysis into the chemical, transportation, and mining industries. The publications continue to be directed mainly to an audience of occupational health and safety professionals.
Beyond these sponsor-prepared analytical works, other uses of the data were found. One important application deserves mention. The data were used by OSHA in developing the preliminary economic and regulatory flexibility screening analysis (required by Executive Order 12886 and the Regulatory Flexibility Act), which addresses issues related to costs, benefits, and economic impacts of OSHA’s proposed Assigned Protection Factors rules.56 OSHA based its estimates of the number of employees using respirators and the corresponding number of respirator-using establishments on the 2001 SRUP. For the purpose of this regulation, OSHA found useful the breakouts by type of respirator (filtering facepieces, half-masks and full facepieces, non-powered air-purifying, powered air-purifying, and suppliedair). This was the only documented use of the NIOSH-BLS survey data outside of NIOSH.
Finding 14: A large number of analytical studies were conducted by NIOSH staff following the release of the initial SRUP report. However, more could have been done to disseminate survey findings and data to key stakeholders such as users, policy and decision makers, and the industrial hygiene and safety engineering communities.
If a survey is to effectively contribute to the quality of decision making, its findings must get into the hands of the right people. It is difficult to measure the impact of any particular data source in terms of policy impact or impact on public understanding. This review has described a couple of examples of the survey results finding their way into public decision making: Where a potentially dangerous condition was identified (e.g., the lack of controls where air hoses connect to the compressed breathing source), a widely disseminated NIOSH bulletin was issued, and OSHA used the information in preparing the economic analysis of the proposed APR regulation. These uses may or may not have justified the expense of the survey. In the end, only the survey sponsor can determine the ultimate cost-benefit of a survey.
However, there are several areas in which marginally increased expenditures of time and analytical resources could have added to the utility for the survey. Certainly, expanding dissemination was an avenue that could have increased the impact of the results. In the case of SRUP survey data, except for BLS and NIOSH press releases, most dissemination has been to NIOSH or the industrial hygiene community through articles in occupational health and safety journals and poster sessions at conferences. There were some attempts to enlarge the dissemination in the form of displays at industry meetings and an article or two in industry journals. However, the focus on release of tabular data and in the selection of dissemination venues limited the potential usefulness of the survey findings.
Another factor that undoubtedly limited the extent of analysis was the fact that, mainly as a result of BLS confidentiality rules, the NIOSH sponsors were not able to directly access survey microdata. The need to rely on laborious and time-consuming requests for special tabulations to support their analysis projects undoubtedly limited the reach of the research and analysis. Despite these obstacles, the NIOSH analytical team has arranged for an additional tabulation of the survey data, matching the respirator responding establishments with their 1999 BLS annual SOII responses for dust diseases of the lungs, respiratory conditions due to toxic agents (e.g., pneumonitis, pharyngitis, occupational asthma), and poisonings. At the time of this report, these data were being analyzed by NIOSH and had not yet been released.
Missed Opportunity. The late-coming initiative to enrich the analytical potential of the data by enriching it with matched data from the SOII should be applauded. There may yet be issues with the use of matched data. The inability to control for differences in the data related to different time periods as well as different conditions in the reporting establishments renders the potential of the match somewhat speculative at this point.
The importance of sample unit matching when possible should not be underestimated. This particular match was conducted late in the survey operation and primarily for the purpose of data analysis. It is unfortunate that the sample matching did not come earlier and as a planned feature in the processing cycle.
Finding 15: The failure to conduct the sample matching earlier in the process constituted a missed opportunity to improve the quality and richness of the data.
As mentioned earlier in this chapter, a matched file could have helped enrich the quality and efficiency of the estimation process. For example, sample matching, if conducted as part of the estimation process for production of the original findings from the SRUP, could have had important ramifications for the quality of the survey data in that SOII results could have been used to improve the estimates obtained from SRUP data. SOII data could have been used in a number of ways for estimation (e.g., ratio, regression, and difference estimators).57 There is no indication that these alternative and potentially superior approaches were considered or used in producing any of the SRUP findings. If not, this is a potentially important limitation of the SRUP findings, especially since the use of these estimation approaches could have improved the quality of estimated totals (of respirator use) that is a key finding of the SRUP.
Ultimate Impact of the SRUP
If a survey is to be effective, its findings must get into the hands of the right people. It is difficult to measure the impact of any particular data source in terms of policy impact or impact on public understanding. However, patterns of dissemination may be illustrative. In the case of SRUP survey data, except for BLS and NIOSH press releases, most dissemination has been to NIOSH or the industrial hygiene community through articles in occupational health and safety journals and poster sessions at conferences. Where a potentially dangerous condition was identified (e.g., the lack of controls where air hoses connect to the compressed breathing source), a widely disseminated OSHA bulletin was issued. Also, MSHA used the information in preparing the economic analysis of the proposed APR regulation.
Were these uses sufficient to justify the expense of the survey? Only the survey sponsor can determine the ultimate cost-benefit of a survey. However, several areas in which marginally increased expenditures could have produced additional information have been pointed out in this chapter.


