
7
Health Survey
BACKGROUND
Because the subjects in our study were primarily ages 55–64, their health was characterized best by a morbidity survey. Although mortality data were collected and analyzed, there was little expectation that much could be learned from these data, given the relatively young age of the study subjects. In addition, although the Department of Veterans Affairs (VA) system could provide data on inpatient and outpatient care, these data would be limited to the minority of veterans who were users of the VA health-care system. Thus, we were compelled to mount a health survey.
Although the health survey would not be subject to the same biases as would a records-based morbidity follow-up using only VA records, there are inherent limitations to this approach as well. Two important limitations can result in biased findings. First, a low response rate could produce biased prevalence estimates of specific conditions, as well as introduce bias into comparisons between participant and control groups depending on the nature of the nonresponse. Whether or not bias is introduced by low response rates depends on whether the nonresponse is differential or nondifferential with respect to participation. Differential nonresponse occurs when respondents differ in some systematic way from respondents within the participation group, and it will introduce bias into estimates of prevalence and of associations of participation with outcome. Second, respondents may not accurately report their current health for a variety of reasons, resulting in misclassification of outcome status. We will discuss the possible effects of these biases later in this report.
CONTENT OF THE HEALTH SURVEY
In many health surveys, the focus of the survey is easily determined. This was not the case in our study: although the agents used in the Project SHAD (Ship Hazard and Defense) tests were well characterized, potential long-term health effects are not. In an attempt to characterize potential long-term health effects, we consulted the Department of Defense (DoD) fact sheets (DoD, 2006) for each test and examined the VA’s guidance to physicians who were examining Project SHAD participants (VHA, 2002). We also took a careful look at published research on a group of experimental volunteers, some of whom had been exposed to a similar list of agents (Page, 2003), and asked members of our expert panel what sorts of items should be included in the health survey. We also consulted with former participants in Project SHAD who had developed an illness checklist, as well as the Vietnam Veterans
of America’s (VVA’s) SHAD Task Force, who provided us a list of questionnaire items regarding participation. Finally, at the urging of our expert panel, we commissioned a series of reports that reviewed the toxicological literature on the agents used in the Project SHAD tests. The executive summaries of these reports are included in Appendix A, and the full reports can be found on the study’s website (IOM, 2006).
Because we identified few predetermined health end points, we decided to use the SF-36 as our primary measure of health (Ware et al., 2000). The SF-36 has been used in a large number of studies and is a standard health survey instrument. The fact that the SF-36 is widely used also means that national normative data are available. In addition to the SF-36, we included standard items on self-reported medical conditions and symptoms (NCHS, 2005), including largely the same items as in the health survey of the Millennium Cohort Study (Millennium Cohort Study, 2006). To these items we added a scale for neurological problems and cognitive difficulties (O’Donnell et al., 1993), as well as questions on history of hospitalization, reproductive history, smoking, and alcohol use. The last part of the questionnaire includes items for Project SHAD participants only, asking about symptoms experienced during the tests, use of protective gear during the tests, decontamination experience, and so on. The entire questionnaire can be found in Appendix B.
The questionnaire was reviewed and approved by the National Academies’ Human Subjects Committee (institutional review board [IRB]), along with an accompanying cover letter and two endorsement letters, one signed by DoD and VA personnel and one signed by representatives of various veterans service organizations (VSOs). One of the stipulations of the National Academies’ IRB was that three different contact letters and informed consent documents would be mailed to study subjects. Notwithstanding our concerns that different contact letters might lead to response bias, the IRB was especially concerned that our request for information might be the initial contact with study subjects who did not know, until we contacted them, that they had been participants in Project SHAD. Thus, the initial contact letters were written so that a study subject would be informed of his possible exposures. The three different sets of documents were worded so that study subjects would know whether, according to the records we reviewed, they had been (1) possibly exposed to active chemical or biological agents during their participation in Project SHAD; (2) possibly exposed to simulants (agents thought to be harmless) during their participation in Project SHAD; or (3) not exposed to active agents or simulants (i.e., nonparticipants). The three sets of contact letters and informed consent forms, together with the endorsement letters, may also be found in Appendix B.
CONDUCT OF THE HEALTH SURVEY
After some discussion with our expert panel, we decided on a dual mode (mail questionnaire and telephone interview) for our health survey. There were some potential advantages to using a web-based questionnaire, but after consultation with some VSOs, we deemed it unlikely that participation rates would be high enough to justify the required additional effort. We decided to begin with an initial mailing of the questionnaire, followed by telephone interviewing of nonrespondents. The reason for this strategy was to obtain a quick, inexpensive response through the mail, and then follow that with a slower accumulation of data through telephone interviews. The initial mailing of the health survey took place December 2005.
As we prepared for the initial mailing, we selected a contractor for the telephone interviewing, Schulman, Ronca, and Bucuvalis (SRBI), of Silver Spring, Maryland. After five months of telephone interviewing, there were still several thousand nonrespondents for whom we had address information. We therefore decided to do a second mailing of the questionnaire in July 2006. This allowed us to update addresses from multiple sources, as well.
USING FEDEX DELIVERY TO CHECK THE QUALITY OF SURVEY ADDRESSES
After several months of data collection, there was still a high proportion of study subjects who had not responded to either a mail questionnaire or an attempted telephone interview. We were concerned that perhaps we had not correctly located these individuals, and thus we decided to undertake a pilot study to test the quality of our address information.
A stratified sample of N = 400 subjects was chosen from all nonrespondent subjects not known to be dead. The sample was stratified into three groups: group 1 (N = 100) consisted of subjects possibly exposed to active
TABLE 7-1 Number and Percent of FedEx-Delivered Mailings by Source of Address
|
Source of Address |
Delivered |
Wrong Address |
Not Deliverablea |
Refused |
Totalb |
|
DoD June 2006 |
76 (64.4%) |
16 (13.6%) |
19 (16.1%) |
7 (5.9%) |
118 (100%) |
|
IRS |
139 (78.1%) |
8 (4.5%) |
26 (14.6%) |
5 (2.8%) |
178 (100%) |
|
Commercial tracing |
5 (94.9%) |
1 (1.7%) |
0 (0%) |
2 (3.4%) |
59 (100%) |
|
Post office |
7 (100%) |
0 (0%) |
0 (0%) |
0 (0%) |
7 (100%) |
|
Addresses updated during telephone number search |
29 (85.3%) |
1 (2.9%) |
4 (11.8%) |
0 (0%) |
34 (100%) |
|
Total |
307 (77.5%) |
26 (6.6%) |
49 (12.4%) |
14 (3.5%) |
396 (100%) |
|
aIncludes post office box or rural route addresses. bExcludes 1 decedent, 2 pending, and 1 unknown status subject. |
|||||
chemical or biological agents; group 2 (N = 100) consisted of subjects possibly exposed only to simulants (agents thought to be harmless but having physical properties that make them resemble certain active agents); and group 3 (N = 200) consisted of subjects who were not participants in Project SHAD.
A FedEx delivery of the mail questionnaire, cover letter, endorsement letters from different VSOs, and the DoD and VA, together with an informed consent form, was attempted for all 400 subjects using the latest address on file. FedEx evening and weekend delivery with required signature was chosen to minimize subject burden while still obtaining documentation of actual delivery. We were interested in finding the percentage of “good” addresses, that is, addresses for which a FedEx delivery could successfully be made. We were also interested in how the percentage of good addresses varied by source of address and by group. Response proportions are shown as simple percentages.
Table 7-1 shows the number and percent of FedEx-delivered packages by source of address, while Table 7-2 shows a breakdown by study group. Overall, just over three-quarters of the mailings were successfully delivered by FedEx, with 12.2 percent not deliverable (a category that includes post office box or rural route addresses), 6.6 percent bad addresses, and 3.5 percent refused. Thus, the total percentage of good addresses could be as high as 81.0 percent, if we presume (possibly in error) that subjects who refused delivery were at the correct address, but did not want to receive the package or participate in the study.
Table 7-1 shows that post office and commercial tracing addresses were most often successfully delivered, with rates of 100 percent and 94.9 percent, respectively. DoD addresses, although thought to be up to date, were successfully delivered only 64.4 percent of the time, with the highest percentages of wrong (13.6 percent) and undeliverable (16.1 percent) addresses. Both the addresses updated during a telephone number search and those supplied by the Internal Revenue Service (IRS) were close to 80 percent successful. Differences between delivery rates for the five sources were statistically significant; a chi-square test, 4 df, gave a value of 25.13, P = .00005.
Table 7-2 shows that successful FedEx delivery rates were somewhat higher for groups 1 and 3 (possible exposure to active agents and controls), with correspondingly higher rates of wrong addresses, undeliverable addresses, and refusals in group 2 (possible exposure to simulants). Differences between delivery rates among the three groups were not statistically different; a chi-square test, 2 df, gave a value of 5.01, P = .082. Finally, out of the total of 400 attempted deliveries, there were a total of 50 questionnaire responses sent by returned mail and 30 subsequently completed telephone interviews. This gives an overall response rate of 20 percent to the FedEx mailing.
There are two major points that are clear from the pilot study that used FedEx to test the quality of addresses for nonrespondents. First, the addresses we had for nonrespondents were overwhelmingly correct ones, based on a FedEx delivery rate of nearly 80 percent. Second, because we now know that our addresses are overwhelmingly
TABLE 7-2 Number and Percent of FedEx-Delivered Mailings by Mailing Groupa
|
Mailing Groupa |
Delivered |
Wrong Address |
Not Deliverableb |
Refused |
Totalc |
|
Participants; possible active agents |
75 (78.1%) |
6 (6.3%) |
14 (14.6%) |
1 (1.0%) |
96 (100%) |
|
Participants; no active agents |
70 (70%) |
13 (13%) |
9 (9%) |
8 (8%) |
100 (100%) |
|
Controls |
162 (81.4%) |
7 (3.5%) |
25 (12.6%) |
5 (2.5%) |
199 (100%) |
|
Total |
307 (77.7%) |
26 (6.6%) |
48 (12.2%) |
14 (3.5%) |
395 (100%) |
|
a“Participants; possible active agents” consisted of subjects possibly exposed to active chemical or biological agents; “Participants; no active agents” consisted of subjects possibly exposed only to simulants (agents thought to be harmless but having physical properties that make them resemble certain active agents); and “Controls” consisted of subjects who were not participants in Project SHAD. bIncludes post office box or rural route addresses. cExcludes 1 decedent, 2 pending, and 2 unknown status subject. |
|||||
correct, the 80 percent nonresponse rate for this pilot study can be attributed to a subject’s choice not to return a questionnaire, other than our inability to locate him and put a questionnaire in his hands.
Aside from these two major points, we saw that commercial address tracing produces addresses with an apparently higher rate of delivery than provided by either the IRS or the DoD. We also saw no substantial difference in FedEx delivery rates among the groups, although we can not explain the reason for the nonstatistically lower rate of FedEx deliveries to group 2 participants.
FINAL SURVEY RESPONSE RATES
Table 7-3 shows the distribution of several demographic characteristics for all participants and controls, as well as respondent participants and controls. Compared with Project SHAD participants, controls had fewer non-whites and fewer officers. Compared with respondent participants, respondent controls had fewer Marines and fewer officers.
Of all the identifier data we collected, Social Security number (SSN) was by far the most important. Indeed, because address tracing depends in large part on having SSN for subjects, it turned out that no subjects without an SSN were respondents. Table 7-4 shows the percentage of subjects with SSN by analysis group (defined in Chapter 8). With the exception of group B controls, in all other analysis groups, whether participants or controls, the percentage of subjects with SSN was around 95 percent; for group B controls, it was only 84 percent. This no doubt limited our ability to locate subjects in this group and contributed to a lower response rate (see next paragraph).
Table 7-5 shows response proportions by analysis group, Project SHAD participation status, and the presence of an SSN. Response was higher among subjects with an SSN, but not very much higher, since relatively few subjects did not have an SSN. Response proportions were lower in group B than in the other analysis groups, particularly among controls, and participants had generally higher response proportions than controls. Limiting the comparison to subjects with SSNs, participants had a 63.6 percent response proportion, and controls had a proportion of 50.4 percent.
Due to difficulties in identifying and processing Marine control units, although Marine control subjects eventually went through the same follow-up procedures as all other study subjects, there was less time for follow-up of these subjects. This may have contributed to lower response rates. For example, in group B, Marine controls had an unusually low response rate of 16.1 percent, and 22.8 percent of them did not have an SSN. Excluding Marines from the group B controls gives a revised response rate of 59.1 percent, and limiting this further to subjects with SSNs gives a revised response rate of 61.4 percent.
TABLE 7-3 Percent Distribution of Various Demographic Characteristics by Participation Status, for All Study Subjects and for Survey Respondents
|
Characteristic |
All Project SHAD Participants (N = 5,741) |
All Controls (N = 6,757) |
Project SHAD Participant Respondents (N = 2,684) |
Control Respondents (N = 2,433) |
|
Age at survey |
|
|
|
|
|
54–64 |
68.5% |
69.7% |
73.1% |
76.0% |
|
65–74 |
21.5% |
20.3% |
22.2% |
18.5% |
|
75+ |
9.8% |
9.8% |
4.8% |
5.4% |
|
Missing |
0.2% |
0.2% |
0.2% |
0.2% |
|
Race |
|
|
|
|
|
Nonwhite |
9.6% |
6.1% |
8.4% |
6.8% |
|
White |
90.4% |
93.9% |
91.6% |
93.2% |
|
Branch |
|
|
|
|
|
Navy |
89.7% |
90.8% |
90.4% |
96.8% |
|
Marines |
10.3% |
9.2% |
9.6% |
3.2% |
|
Pay grade |
|
|
|
|
|
E1–E3 |
51.1% |
55.0% |
53.0% |
57.7% |
|
E4–E8 |
39.3% |
38.9% |
38.9% |
40.1% |
|
Officera |
9.6% |
6.1% |
8.2% |
2.2% |
|
Ever smoked cigarettes? |
— |
— |
79.1% |
82.5% |
|
Currently drink alcohol? |
— |
— |
58.2% |
57.1% |
|
Average BMI (Body Mass Indexb) |
— |
— |
28.7 |
28.6 |
|
aIncludes warrant officers. bBody Mass Index = weight (in kilograms)/height (in meters) squared. |
||||
TABLE 7-4 Percent of Study Subjects with Social Security Number, by Analysis Group
|
Analysis Groupa |
Participantsb (N = 4,403) |
Controlsb (N = 5,219) |
|
Group A |
96.4% |
93.4% |
|
Group B |
93.3% |
83.9% |
|
Group C |
94.4% |
93.4% |
|
Group D |
96.3% |
95.4% |
|
Total |
95.6% |
92.4% |
|
aGroup A = participants potentially exposed only to Bacillus globigii (BG) simulant agent or methyl acetoacetate (MAA); group B = participants potentially exposed only to trioctyl phosphate (TOF); group C = participants potentially exposed to any active chemical or biological agent; group D = participants potentially exposed only to simulants and not in groups A or B. bExcludes decedents and subjects not in the Navy or Marines. |
||
Finally, we used logistic regression to analyze response rates. After 106 observations were excluded for missing data, the final model included 9,516 subjects with data on age, participant status, race, pay grade, and branch. Neither age nor race had a statistically significant association with response, but the remaining variables were all statistically associated with response rate. Compared with officers, both E1–E3 and E4–E8 pay grades had significantly higher odds of responding, while Marines subjects had significantly lower odds of responding than Navy subjects. Controls also had lower odds of responding than participants. All significant odds ratios were roughly 2-to-1 (or 0.5 to 1).
TABLE 7-5 Response Proportions by Analysis Group, Participation Status, and Presence of Social Security Number
|
Analysis Groupa |
All Project SHAD Participantsb (N = 4,403) |
All Controlsb (N = 5,219) |
Project SHAD Participants with SSN (N = 4,210) |
Controls with SSN (N = 4,822) |
|
Group A |
62.0% |
48.9% |
64.3% |
52.4% |
|
Group B |
54.1% |
31.2% |
58.0% |
37.2% |
|
Group C |
61.5% |
45.5% |
65.2% |
48.7% |
|
Group D |
62.8% |
52.9% |
65.2% |
55.4% |
|
Total |
60.8% |
46.6% |
63.6% |
50.4% |
|
aGroup A = participants potentially exposed only to BG or MAA; group B = participants potentially exposed only to TOF; group C = participants potentially exposed to any active chemical or biological agent; group D = participants potentially exposed only to simulants and not in groups A or B. bExcludes decedents and subjects not in the Navy or Marines. |
||||
VARIATION IN TELEPHONE RESPONSES BY TIME
Because cumulative response rates necessarily grow with increasing time in the field, we spent nearly 12 months collecting morbidity data. Eventually, however, data collection had to be halted, and we were curious about the potential effects of setting a data collection cutoff date. Because we had read access to telephone interview data by interview date, we looked at SF-36 summary score responses over time (see Chapter 10 for further discussion of the SF-36 summary scales).
Figure 7-1 shows the mean values of the physical component score and the mental component score by month of telephone interview; sample sizes are shown in parenthesis below month of interview. Neither average physical component score nor mental component score show any substantial trends over time, which is welcome news.
COMPARISON OF MAIL QUESTIONNAIRE VERSUS TELEPHONE INTERVIEW RESPONSES
Although we attempted to translate the mail questionnaire as closely as possible into a telephone interview format, we were aware that there could be differences in responses between the two data collection modes. Differences between the mail and telephone interview data could come from two obvious sources: inherent differences in responding to the mail and telephone versions of the questionnaire or inherent differences in the subjects who chose to respond to either of the two questionnaire versions.
Table 7-6 shows a comparison of selected characteristics for mail questionnaire respondents versus telephone interview respondents. The group of telephone interview respondents were younger than mail questionnaire respondents, contained fewer officers, and more Marines. Mail questionnaire and telephone interview respondents reported the same SF-36 physical component scores, but telephone interviewees reported higher mental component scores than their mail questionnaire counterparts. Other researchers have reported similar findings (McHorney et al., 1994).
DEPARTMENT OF VETERANS AFFAIRS OUTPATIENT VISITS BY PARTICIPATION STATUS AND RESPONSE STATUS
Although there are difficulties associated with the use of VA data for follow-up, as noted in Chapter 1, we did use VA outpatient data to compare participants and control respondents and nonrespondents. Table 7-7 shows the percentage distribution of subjects with a VA outpatient visit for participants and controls by survey response status. Because there are potential differences in eligibility for VA care between not only participants and controls, but also respondents and nonrespondents, we can make few definitive statements about these data. Generally speaking, more respondents than nonrespondents tended to have VA outpatient visits, and more participants than
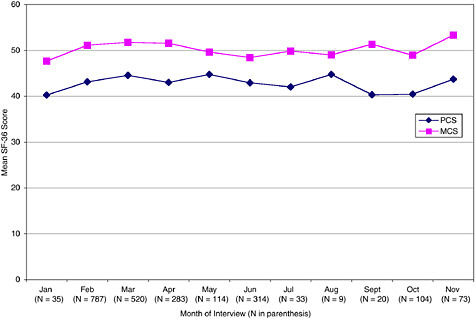
FIGURE 7-1 Mean summary SF-36 scores by month of telephone interview.
TABLE 7-6 Comparison of Mail Questionnaire Versus Telephone Interview Respondents for Selected Characteristics by Percentage Distribution
|
Characteristic |
Mail Questionnaire Respondents |
Telephone Interview Respondents |
|
Project SHAD participation |
|
|
|
Participant |
52.6% |
51.1% |
|
Control |
47.4% |
48.9% |
|
Current age |
|
|
|
55–64 |
70.9%* |
78.7%* |
|
65–74 |
23.2%* |
17.4%* |
|
75 + |
5.9%* |
3.9%* |
|
Pay grade |
|
|
|
E1–E4 |
51.6%* |
59.1%* |
|
E5–E8 |
42.2%* |
36.8%* |
|
Officer/Warrant Officer |
6.3%* |
4.2%* |
|
Branch |
|
|
|
Marine |
4.3%* |
8.6%* |
|
Navy |
95.7%* |
91.4%* |
|
SF-36 mean summary score |
|
|
|
PCS |
43.3 |
43.2 |
|
MCS |
49.4* |
50.5* |
|
Ever smoked cigarettes? |
81.5% |
79.9% |
|
Currently drink alcohol? |
60.3%* |
54.7%* |
|
Average BMI (body mass index) |
28.7 |
28.6 |
|
NOTE: Respondents with both mail and telephone data were excluded for comparison purposes. Missing values were excluded. *Statistically significant difference, P < .05. |
||
TABLE 7-7 Percent Distribution of Subjects with a VA Outpatient Visit, by Participation and Response Status, for Various Characteristics
|
Characteristic |
Project SHAD Participant Respondents (N = 2,684) |
Project SHAD Participant Nonrespondents (N = 3,057) |
Control Respondents (N = 2,433) |
Control Nonrespondents (N = 4,324) |
|
Exposure Groupa |
||||
|
A |
39.3% |
22.7% |
31.4% |
19.7% |
|
B |
45.1% |
27.9% |
30.0% |
25.6% |
|
C |
46.6% |
22.0% |
33.4% |
21.6% |
|
D |
36.7% |
38.6% |
30.3% |
20.9% |
|
Selected Diagnoses |
||||
|
Infectious disease |
8.6% |
5.6% |
7.4% |
5.3% |
|
Cancer |
12.1% |
7.8% |
9.1% |
6.9% |
|
Endocrine disease |
27.8% |
13.8% |
22.0% |
13.2% |
|
Mental disorder |
18.9% |
11.6% |
15.4% |
11.2% |
|
Circulatory disease |
28.1% |
16.1% |
22.9% |
14.6% |
|
Respiratory disease |
17.0% |
10.2% |
13.3% |
9.4% |
|
Digestive disease |
19.0% |
11.4% |
14.7% |
10.4% |
|
Genitourinary disease |
14.6% |
7.7% |
12.0% |
7.4% |
|
Skin disease |
14.7% |
8.2% |
11.5% |
7.5% |
|
Musculoskeletal disease |
21.6% |
12.4% |
18.7% |
11.9% |
|
Ill-defined disease |
23.9% |
14.1% |
18.5% |
13.7% |
|
Injury |
9.9% |
6.8% |
9.0% |
6.2% |
|
Branch |
||||
|
Navy |
39.4% |
21.8% |
31.2% |
20.2% |
|
Marines |
52.9% |
34.5% |
35.1% |
26.9% |
|
Paycode |
||||
|
E1–E3 |
41.8% |
26.7% |
31.1% |
22.8% |
|
E4–E8 |
40.0% |
20.8% |
31.5% |
21.8% |
|
Officerb |
36.1% |
16.4% |
35.2% |
6.7% |
|
Total |
40.6% |
23.3% |
31.4% |
21.1% |
|
aGroup A = participants potentially exposed only to BG or MAA; group B = participants potentially exposed only to TOF; group C = participants potentially exposed to any active chemical or biological agent; group D = participants potentially exposed only to simulants and not in groups A or B. bIncludes warrant officers. |
||||
controls had VA outpatient visits. With one exception (group D participants), these tendencies were true regardless of exposure group, outpatient diagnosis, branch, or paycode.
REFERENCES
DoD (Department of Defense). 2006. Project 112. http://deploymentlink.osd.mil/current_issues/shad/shad_intro.shtml (accessed November 28, 2006).
IOM (Institute of Medicine). 2006. Long-term health effects of participation in Project SHAD. http://www.iom.edu/CMS/3795/4909.aspx (accessed November 28, 2006).
McHorney, C. A., M. Kosinski, and J. E. Ware, Jr. 1994. Comparisons of the cost and quality of norms for the SF-36 health survey collected by mail versus telephone interview: Results from a national survey. Medical Care 32:551-567.
NCHS (National Center for Health Statistics). 2005. NHIS questionnaire, sample adult, adult conditions. http://www.cdc.gov/nchs/about/major/nhis/ quest_data_related_1997_forward.htm (accessed November 28, 2006).
O’Donnell, W. E., C. B. DeSoto, and J. L. DeSoto. 1993. Validity and reliability of the revised Neuropsychological Impairment Scale (NIS). Journal of Clinical Psychology 49:372-382.
Page, W. F. 2003. Long-term health effects of exposure to sarin and other anticholinesterase chemical warfare agents. Military Medicine 168:239-245.
Millennium Cohort Study. http://www.millenniumcohort.org/index.php (accessed November 27, 2006).
VHA (Veterans Health Administration). 2002. Clinical evaluation of veterans involved in Project 112 and related Project SHAD tests (VHA Directive 2002-079). http://www1.va.gov/shad/docs/Project_112-SHAD_Directive_2002-079.pdf (accessed November 28, 2006).
Ware, J. E., M. Kosinski, and J. E. Dewey. 2000. How to score version 2 of the SF-36 health survey. Lincoln, RI: QualityMetric Incorporated.


