
10
Morbidity Results
OVERVIEW: SURVEY RESPONSE
The data in this section of the report come from mail questionnaires and telephone interviews, as described in Chapter 7. The total number of subjects is 12,499, which excludes a total of 159 Army, Air Force, and Coast Guard participants and controls. As explained in Chapter 5, the primary reason for excluding the non-Navy, non-Marine subjects was their small number and our inability to assemble reasonable control groups. A total of 5,106 respondents is included in the analyses in this chapter.
Table 10-1 shows the total numbers of subjects and response rates for mail questionnaires and telephone interviews by analysis group. Response rates were calculated based on number of subjects presumed alive through 2005, and in all groups, participants have substantially higher response rates within each analysis group. Except for group B controls, participant response rates are all over 60 percent, while control response rates are 45–53 percent. In addition, mail questionnaire response rates were usually higher than telephone interview response rates. Overall, the response rate was 53.1 percent.
PRIMARY OUTCOME VARIABLE: SF-36
Unadjusted SF-36 Summary Scores by Analysis Group
Table 10-2 shows the two primary morbidity outcome measures from the SF-36, the physical component summary (PCS) and mental component summary (MCS) scores, by analysis group and participation status. Participants show uniformly lower scores (worse health) than controls in total as well as across all four analysis groups, with most of the differences in SF-36 scores being relatively small, in the range of 1 to 2 points. The exception is MCS scores in groups B and D, which show differences of around 5 points, considered moderate in size. Moreover, all differences between participant and control PCS and MCS scores were statistically significant, except for MCS and PCS scores in analysis group C, which contained the subjects potentially exposed to active agents. PCS and MCS scores in our survey were generally lower than comparable national norms for males aged 55–64 and 65–74: national PCS scores were 48.16 and 45.13, respectively; national MCS scores were 52.53 and 53.66, respectively.
It is important, especially when sample sizes are large, to interpret the clinical importance of these differences as well. According to the customary rule of thumb, based on Cohen’s criteria, differences of 0.2 to 0.49 standard
TABLE 10-1 Availability of Mail Questionnaire and Telephone Interview Data by Analysis Group and Participation Status
|
Analysis Group and Participation Status* |
Mail Questionnaire Only |
Telephone Interview Only |
Any Response (includes both) |
Total Subjects Presumed Alive |
|
Group A, participants |
834 (33.4%) |
637 (25.5%) |
1,545 (62.0%) |
2,494 (100%) |
|
Group A, controls |
725 (26.8%) |
552 (20.4%) |
1,325 (48.9%) |
2,710 (100%) |
|
Group B, participants |
192 (27.4%) |
175 (24.9%) |
380 (54.1%) |
702 (100%) |
|
Group B, controls |
85 (11.5%) |
137 (18.6%) |
230 (31.2%) |
738 (100%) |
|
Group C, participants |
174 (31.9%) |
130 (23.6%) |
339 (61.5%) |
551 (100%) |
|
Group C, controls |
209 (25.2%) |
159 (19.2%) |
377 (45.5%) |
829 (100%) |
|
Group D, participants |
218 (33.2%) |
178 (27.1%) |
412 (62.8%) |
656 (100%) |
|
Group D, controls |
261 (27.7%) |
225 (23.9%) |
498 (54.7%) |
942 (100%) |
|
Total number of responding subjects |
2,700 (28.1%) |
2,193 (22.8%) |
5,106 (53.1%) |
9,622 (100%) |
|
*Group A = participants potentially exposed only to BG or MAA; group B = participants potentially exposed only to TOF; group C = participants potentially exposed to any active chemical or biological agent; group D = participants potentially exposed only to simulants and not in groups A or B. |
||||
TABLE 10-2 Mean SF-36 Physical Component Summary (PCS) and Mental Component Summary (MCS) Scores, by Analysis Group and Participation Status (Sample Sizes in Parentheses), with Results of t-Test Comparisons
|
Analysis Groupa |
PCS Participant (sample size) |
PCS Control (sample size) |
t-Testb |
MCS Participant (sample size) |
MCS Control (sample size) |
t-Test |
|
Group A |
42.36 (N = 1,438) |
44.20 (N = 1,220) |
4.09 2,656 df P < .0001 |
49.32 (N = 1,438) |
51.22 (N = 1,220) |
3.92 2,656 df P < .0001 |
|
Group B |
42.64 (N = 357) |
44.93 (N = 220) |
2.41 575 df P = .0163 |
44.54 (N = 357) |
49.78 (N = 220) |
4.21 575 df P < .0001 |
|
Group C |
42.14 (N = 315) |
42.82 (N = 345) |
0.75 658 df P = .4558 |
48.83 (N = 315) |
50.06 (N = 345) |
1.24 658 df P = .2158 |
|
Group D |
42.80 (N = 388) |
44.59 (N = 460) |
2.22 846 df P = .0269 |
47.90 (N = 388) |
52.31 (N = 460) |
5.30 846 df P < .0001 |
|
All Subjects |
42.44 (N = 2,498) |
44.14 (N = 2,245) |
5.06 4,741 df P < .0001 |
48.74 (N = 2,498) |
51.48 (N = 245) |
7.40 4,741 df P < .0001 |
|
National norms for males |
||||||
|
age 55–64 |
|
48.16 |
|
|
52.53 |
|
|
age 65–74 |
|
45.13 |
|
|
53.66 |
|
|
NOTE: Statistically significant items are in bold. aGroup A = participants potentially exposed only to BG or MAA; group B = participants potentially exposed only to TOF; group C = participants potentially exposed to any active chemical or biological agent; group D = participants potentially exposed only to simulants and not in groups A or B. bt-test value based on pooled variance estimate. |
||||||
deviations are considered “small,” differences of 0.5 to 0.79 standard deviations are considered “moderate,” and differences greater than 0.8 standard deviations are considered “large.” Because our normed scores all have a mean of 50 and a standard deviation of 10, this means that differences in mean SF-36 scores of 2 to 4.9 points are interpreted as “small,” 5 to 7.9 points as “moderate,” and 8 or more points as “large.”
Figures 10-1 and 10-2 show bar graphs of the PCS and MCS scores by analysis group and participation status. Most of the differences in the PCS scores were considered small, around 2 points, with a smaller difference of less than 1 point in group C. For MCS scores, groups A and C showed small, 2-point differences, while the group B and D differences were moderate.
The next step was to examine the data for the SF-36 subscales, shown in Table 10-3. Overall, there were no striking differences in the SF-36 subscales. Group A showed small but consistent differences in all the SF-36 subscales, while group B differences were moderate in size, ranging up to 5 points; in all subscales, participants showed smaller values than controls. Group D differences were similar, but slightly smaller, than those of group B. Virtually all the SF-36 subscale differences in groups A, B, and D were statistically significant. In contrast, group C differences were relatively small, and none of them were statistically significant.
SF-36 Summary Scales by Potential Confounding Variables
Table 10-4 shows adjusted mean SF-36 summary scale values by analysis group for various potential confounding factors, with branch included only for group B, where there were sufficient numbers of Marines. Age was significantly associated with PCS and MCS scores in the majority of analysis groups, while race differences
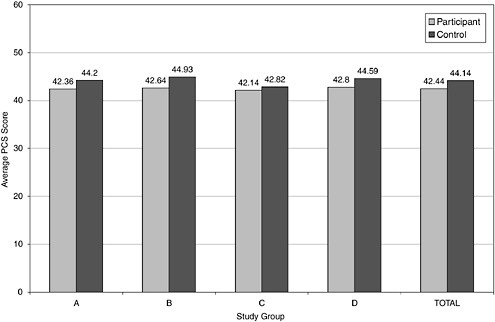
FIGURE 10-1 Average SF-36 physical component scores (PCS) by study group and participation status.
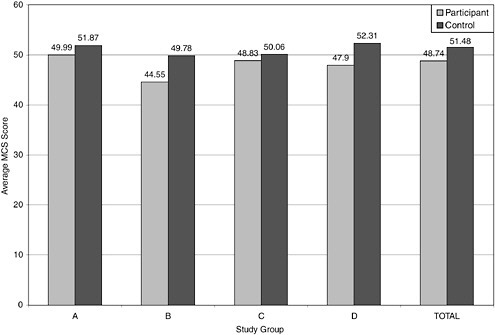
FIGURE 10-2 Average SF-36 mental component scores (MCS) by study group and participation status.
were statistically significant only for group A’s PCS and MCS scores and group B’s PCS score. Pay grade differences were all statistically significant except for group B; some of the differences by pay grade in Table 10-4 are moderate to large in size. Smoking, drinking, and body mass index (BMI) all had statistically significant effects on PCS and MCS in more than one analysis group, although BMI was not statistically associated with MCS in any group. In summary, age, race, pay grade, branch, smoking, drinking, and BMI were all significantly associated with either PCS or MCS scores in at least one of the analysis groups. Therefore, further general linear model analyses will compare SF-36 summary scores within analysis groups, having adjusted for age, race, pay grade, branch, smoking, drinking, and BMI. Because statistical adjustment for source of data (mail questionnaire versus telephone interview) and for age-squared did not result in any meaningful change in estimates, we did not adjust for either of these covariates, in the interests of parsimony.
Analysis of Adjusted SF-36 Summary Scores by Analysis Group
Having established that age, race, pay grade, and branch are all potential confounding variables, our general linear model analyses compared SF-36 summary scores adjusted for all these variables simultaneously. Table 10-5 shows the results of our general linear models comparisons.
Although participants have uniformly smaller adjusted mean SF-36 summary scores than controls, there were differences between PCS and MCS scores. Adjusted mean PCS scores all showed small differences between participants and controls, roughly two points, with the group C difference not reaching statistical significance.
TABLE 10-3 Mean SF-36 Subscale Scores, by Analysis Group and Participation Status, with Results of t-Test Comparisons
|
Participant |
Control |
t-Testc |
|
|
Group A |
|||
|
PF |
42.30 |
43.78 |
3.14, 2,794 df, P = .0017 |
|
RP |
43.79 |
45.74 |
4.17, 2,842 df, P < .0001 |
|
BP |
45.88 |
47.59 |
4.05, 2,845 df, P < .0001 |
|
GH |
42.73 |
45.40 |
5.79, 2,840 df, P < .0001 |
|
VT |
48.56 |
50.97 |
5.34, 2,811 df, P < .0001 |
|
SF |
46.25 |
48.09 |
3.99, 2,831 df, P < .0001 |
|
RE |
46.41 |
48.63 |
4.72, 2,850 df, P < .0001 |
|
MH |
48.95 |
51.07 |
4.67, 2,814 df, P < .0001 |
|
Group B |
|||
|
PF |
42.48 |
45.32 |
2.80, 597 df, P = .0053 |
|
RP |
42.99 |
46.56 |
3.37, 601 df, P = .0008 |
|
BP |
43.70 |
46.81 |
3.20, 603 df, P = .0015 |
|
GH |
40.49 |
44.50 |
3.72, 605 df, P = .0002 |
|
VT |
46.05 |
50.04 |
3.83, 601 df, P = .0001 |
|
SF |
42.05 |
46.89 |
4.24, 605 df, P < .0001 |
|
RE |
42.72 |
47.72 |
4.14, 602 df, P < .0001 |
|
MH |
44.31 |
49.33 |
4.28, 598 df, P < .0001 |
|
Group C |
|||
|
PF |
42.30 |
42.32 |
0.03, 698 df, P = .9764 |
|
RP |
43.48 |
44.06 |
0.61, 702 df, P = .5423 |
|
BP |
45.53 |
45.86 |
0.39, 705 df, P = .6935 |
|
GH |
41.92 |
43.36 |
1.61, 701 df, P = .1071 |
|
VT |
47.40 |
48.73 |
1.44, 703 df, P = .1492 |
|
SF |
45.93 |
45.48 |
-0.47, 706 df, P = .6378 |
|
RE |
45.78 |
46.34 |
0.56, 702 df, P = .5781 |
|
MH |
48.49 |
49.47 |
1.04, 706 df, P = .2999 |
|
Group D |
|||
|
PF |
42.69 |
44.29 |
1.91, 884 df, P = .0565 |
|
RP |
43.87 |
46.35 |
3.02, 899 df, P = .0026 |
|
BP |
45.12 |
47.90 |
3.77, 901 df, P = .0002 |
|
GH |
42.20 |
45.09 |
3.52, 901 df, P = .0004 |
|
VT |
47.41 |
50.73 |
4.07, 890 df, P < .0001 |
|
SF |
44.90 |
48.36 |
4.29, 895 df, P < .0001 |
|
RE |
45.45 |
49.36 |
4.80, 901 df, P < .0001 |
|
MH |
47.18 |
50.64 |
4.17, 893 df, P < .0001 |
|
aGroup A = participants potentially exposed only to BG or MAA; group B = participants potentially exposed only to TOF; group C = participants potentially exposed to any active chemical or biological agent; group D = participants potentially exposed only to simulants and not in groups A or B. bPF = physical functioning; RP = role physical; BP = bodily pain; GH = general health; VT = vitality; SF = social functioning; RE = role emotional; and MH = mental health. ct-test value based on pooled variance estimate. |
|||
TABLE 10-4 Mean SF-36 Summary Scores, by Analysis Group and Various Other Factors, with Results of F-Test Comparisons
|
Analysis Group and Factor* |
Mean Value PCS |
F-Test |
Mean Value MCS |
F-Test |
|
Group A |
||||
|
Age |
— |
28.70, 1 df |
— |
12.05, 1 df |
|
|
|
P < 0.0001 |
|
P = 0.0005 |
|
Race |
|
|
|
|
|
White |
45.40 |
7.64, 1 df |
50.33 |
3.75, 1 df |
|
Nonwhite |
43.00 |
P = 0.0078 |
48.46 |
P = 0.0529 |
|
Pay grade |
|
|
|
|
|
E1–E3 |
41.58 |
13.13, 2 df |
47.71 |
5.74, 2 df |
|
E4–E8 |
42.65 |
P < 0.0001 |
49.05 |
P = 0.0032 |
|
Officer |
48.36 |
|
51.43 |
|
|
Branch |
|
|
|
|
|
Marine |
48.06 |
2.58, 1 df |
47.29 |
3.43, 1 df |
|
Navy |
44.72 |
P = 0.1080 |
51.51 |
P = 0.0643 |
|
Smoking |
|
|
|
|
|
Yes |
44.67 |
36.81, 1 df |
48.61 |
6.38, 1 df |
|
No |
48.11 |
P < 0.0001 |
50.18 |
P = 0.0116 |
|
Drinking |
|
|
|
|
|
Yes |
47.98 |
51.12, 1 df |
50.54 |
21.97, 1 df |
|
No |
44.80 |
P < 0.0001 |
48.25 |
P < 0.0001 |
|
Body Mass Index |
— |
78.73, 1 df |
— |
1.30, 1 df |
|
|
|
P < 0.0001 |
|
P = 0.2540 |
|
Group B |
||||
|
Age |
— |
0.20, 1 df |
— |
2.64, 1 df |
|
|
|
P = 0.6510 |
|
P = 0.1048 |
|
Race |
|
|
|
|
|
White |
44.38 |
4.01, 1 df |
47.28 |
1.93, 1 df |
|
Nonwhite |
41.55 |
P = 0.0457 |
44.70 |
P = 0.1652 |
|
Pay grade |
|
|
|
|
|
E1–E3 |
43.51 |
2.98, 2 df |
46.00 |
0.56, 2 df |
|
E4–E8 |
44.57 |
P = 0.0514 |
46.96 |
P = 0.5721 |
|
Officer |
40.82 |
|
45.01 |
|
|
Branch |
|
|
|
|
|
Marines |
42.53 |
0.77, 1 df |
42.74 |
24.96, 1 df |
|
Navy |
43.40 |
P = 0.3809 |
49.24 |
P < 0.0001 |
|
Smoking |
|
|
|
|
|
Yes |
40.94 |
14.51, 1 df |
45.25 |
1.14, 1 df |
|
No |
44.99 |
P = 0.0002 |
46.73 |
P = 0.2866 |
|
Drinking |
|
|
|
|
|
Yes |
45.11 |
22.12, 1 df |
47.08 |
3.29, 1 df |
|
No |
40.82 |
P < 0.0001 |
44.90 |
P = 0.0702 |
|
Body Mass Index |
— |
11.25, 1 df |
— |
0.14, 1 df |
|
|
|
P = 0.0008 |
|
P = 0.7120 |
|
Analysis Group and Factor* |
Mean Value PCS |
F-Test |
Mean Value MCS |
F-Test |
|
Group C |
||||
|
Age |
— |
6.05, 1 df |
— |
0.03, 1 df |
|
|
|
P = 0.0142 |
|
P = 0.8725 |
|
Race |
|
|
|
|
|
White |
48.63 |
0.42, 1 df |
53.87 |
0.02, 1 df |
|
Nonwhite |
47.67 |
P = 0.5185 |
54.10 |
P = 0.8888 |
|
Pay grade |
|
|
|
|
|
E1–E3 |
46.10 |
4.07, 2 df |
51.48 |
3.01, 2 df |
|
E4–E8 |
46.25 |
P = 0.0176 |
53.39 |
P = 0.0501 |
|
Officer |
52.11 |
|
57.07 |
|
|
Branch |
|
|
|
|
|
Marine |
51.79 |
0.84, 1 df |
56.41 |
0.29, 1 df |
|
Navy |
44.52 |
P = 0.8597 |
51.55 |
P = 0.5894 |
|
Smoking |
|
|
|
|
|
Yes |
46.67 |
6.76, 1 df |
52.71 |
3.91, 1 df |
|
No |
49.63 |
P = 0.0095 |
55.26 |
P = 0.0486 |
|
Drinking |
|
|
|
|
|
Yes |
50.10 |
17.16, 1 df |
55.27 |
6.28, 1 df |
|
No |
46.28 |
P < 0.0001 |
52.70 |
P = 0.0125 |
|
Body Mass Index |
— |
27.28, 1 df |
— |
0.74, 1 df |
|
|
|
P < 0.0001 |
|
P = 0.3914 |
|
Group D |
||||
|
Age |
— |
7.47, 1 df |
— |
8.38, 1 df |
|
|
|
P = 0.0064 |
|
P = 0.0039 |
|
Race |
|
|
|
|
|
White |
45.98 |
0.35, 1 df |
51.95 |
2.32, 1 df |
|
Nonwhite |
47.17 |
P = 0.5519 |
48.72 |
P = 0.1282 |
|
Pay grade |
|
|
|
|
|
E1–E3 |
45.04 |
4.25, 2 df |
48.67 |
2.17, 2 df |
|
E4–E8 |
44.45 |
P = 0.0146 |
49.06 |
P = 0.1146 |
|
Officer |
50.24 |
|
53.28 |
|
|
Branch |
— |
|
— |
|
|
Marine |
|
— |
|
— |
|
Navy |
|
|
|
|
|
Smoking |
|
|
|
|
|
Yes |
44.63 |
16.92, 1 df |
48.93 |
7.75, 1 df |
|
No |
48.52 |
P < 0.0001 |
51.73 |
P = 0.0055 |
|
Drinking |
|
|
|
|
|
Yes |
48.37 |
17.94, 1 df |
52.01 |
15.12, 1 df |
|
No |
44.78 |
P < 0.0001 |
48.66 |
P < 0.0001 |
|
Body Mass Index |
— |
40.37, 1 df |
— |
0.12, 1 df |
|
P < 0.0001 |
P = 0.7244 |
|||
|
NOTE: Statistically significant items are in bold. *Group A = participants potentially exposed only to BG or MAA; group B = participants potentially exposed only to TOF; group C = participants potentially exposed to any active chemical or biological agent; group D = participants potentially exposed only to simulants and not in groups A or B. |
||||
TABLE 10-5 Adjusted Mean SF-36 Summary Scores, by Analysis Group, with Results of F-Test Comparisons
|
Analysis Group and Factor* |
Adjusted Mean PCS Score |
F-Test |
Adjusted Mean MCS Score |
F-Test |
|
Group A |
||||
|
Participants |
45.32 |
23.54, 1 df, P < .0001 |
48.36 |
18.50, 1 df, P < .0001 |
|
Controls |
47.45 |
|
50.43 |
|
|
Age |
— |
28.70, 1 df, P < .0001 |
— |
12.05, 1 df, P = .0005 |
|
Race |
— |
7.64, 1 df, P = .0058 |
— |
3.75, 1 df, P = 0.0529 |
|
Pay grade |
— |
13.13, 2 df, P < .0001 |
— |
5.74, 2 df, P = .0032 |
|
Branch |
— |
2.58, 1 df, P = .1080 |
— |
3.43, 1 df, P = .0643 |
|
Smoking |
— |
36.81, 1 df, P < 0.0001 |
— |
6.38, 1 df, P = 0.0116 |
|
Drinking |
— |
51.12, 1 df, P < 0.0001 |
— |
21.97, 1 df, P < 0.0001 |
|
Body mass index |
— |
78.73, 1 df, P < 0.0001 |
— |
1.30, 1 df, p = 0.2540 |
|
Group B |
||||
|
Participants |
42.12 |
3.06, 1 df, P = .0808 |
43.92 |
10.73, 1 df, P = .0011 |
|
Controls |
43.81 |
|
48.07 |
|
|
Age |
— |
0.20, 1 df, P = .6510 |
— |
2.64, 1 df, P = .1048 |
|
Race |
— |
4.01, 1 df, P = .0457 |
— |
1.93, 1 df, P = .1652 |
|
Pay grade |
— |
2.98, 2 df, P = .0514 |
— |
0.56, 2 df, P = .5721 |
|
Branch |
— |
0.77, 1 df, P = .3809 |
— |
24.96, 1 df, P < .0001 |
|
Smoking |
— |
14.51, 1 df, P = 0.0002 |
— |
1.14, 1 df, P = 0.2866 |
|
Drinking |
— |
22.12, 1 df, P < 0.0001 |
— |
3.29, 1 df, P = 0.0702 |
|
Body mass index |
— |
11.25, 1 df, P = 0.0008 |
— |
0.14, 1 df, P = 0.7120 |
|
Group C |
||||
|
Participants |
47.51 |
2.06, 1 df, P = .1517 |
53.03 |
3.59, 1 df, P = .0587 |
|
Controls |
48.79 |
|
54.94 |
|
|
Age |
— |
6.05, 1 df, P = .0142 |
— |
0.03, 1 df, P = .8725 |
|
Race |
— |
0.42, 1 df, P = .5185 |
— |
0.02, 1 df, P = .8888 |
|
Pay grade |
— |
4.07, 2 df, P = .0176 |
— |
3.01, 2 df, P = 0.0501 |
|
Branch |
— |
0.84, 1 df, P = .8597 |
— |
0.29, 1 df, P = .5894 |
|
Smoking |
— |
6.76, 1 df, P = 0.0095 |
— |
3.91, 1 df, P = 0.0486 |
|
Drinking |
— |
17.16, 1 df, P < 0.0001 |
— |
6.28, 1 df, P = 0.0125 |
|
Body mass index |
— |
27.28, 1 df, P < 0.0001 |
— |
0.74, 1 df, P = 0.3914 |
|
Group D |
|
|
|
|
|
Participants |
45.50 |
|
47.70 |
40.26, 1 df, P < .0001 |
|
Controls |
47.88 |
7.56, 1 df, P = .0061 |
52.97 |
|
|
Age |
— |
7.47, 1 df, P = .0064 |
— |
8.38, 1 df, P = 0.0039 |
|
Race |
— |
0.35, 1 df, P = .3519 |
— |
2.32, 1 df, P = 0.1282 |
|
Pay grade |
— |
4.25, 2 df, P = .0146 |
— |
2.17, 2 df, P = 0.1146 |
|
Branch |
— |
— |
— |
— |
|
Smoking |
— |
16.92, 1 df, P < 0.0001 |
— |
7.75, 1 df, P = 0.0055 |
|
Drinking |
— |
17.94, 1 df, P < 0.0001 |
— |
15.12, 1 df, P < 0.0001 |
|
Body mass index |
— |
40.37, 1 df, P < 0.0001 |
— |
0.12, 1 df, P = 0.7244 |
|
NOTE: Mean SF-36 summary scores adjusted for age, race, pay grade, branch, smoking, drinking, and body mass index. Statistically significant items are in bold. *Group A = participants potentially exposed only to BG or MAA; group B = participants potentially exposed only to TOF; group C = participants potentially exposed to any active chemical or biological agent; group D = participants potentially exposed only to simulants and not in groups A or B. |
||||
Differences between participants and controls for adjusted mean MCS scores were small in groups A and C (group A’s difference was statistically significant), whereas groups B and D showed larger differences (both statistically significant). The statistical significance of age, race, pay grade, and branch varied by group and by summary score, especially the effect of branch in group B’s MCS score. We note that although group C participants were the only subjects potentially exposed to active agents, neither adjusted mean PCS or MCS scores differed from those of group C controls.
Analysis of Group A “Factorial Design”
The subjects in group A were exposed only to Bacillus globigii (BG) simulant agent or methylacetoacetate (MAA), which allows a natural factorial design that allows for independent estimates of the effects of BG and MAA. Table 10-6 shows the results of a general linear model analysis of PCS and MCS mean scores, based on 2,661 subjects. The first analysis is a main effects model with separate effects for BG and MAA exposure, adjusted for age at participation, race, pay grade, branch, smoking, drinking, and body mass index. The second analysis was identical to the first, except that an additional adjustment was made for number of tests, a categorical variable with level 0 for controls and levels 1, 2, or 3 for participants.
In model 1, without adjustment for number of tests, potential exposure to BG or to MAA resulted in a statistically significant lowering of the PCS scores of around one point. MCS scores in model 1 were not statistically significantly different for BG exposure, but they were for MAA exposure, the difference being around 2.5 points. We also fit the same model with an interaction term added, which was not statistically significant (data not shown). In model 2, the effects of possible BG and MAA exposure were all attenuated and none were statistically significant. In model 2, the number of tests is a statistically significant factor for PCS and for MCS. For neither PCS nor MCS score is there a monotone decline in score with an increasing number of tests; that is, there is not a clear dose-response effect with number of tests.
Models 1 and 2 looked at the effects of simple BG or MAA exposure as either a yes or no. In Table 10-7 we report an analysis that attempts to assign “doses” of BG and MAA. Specifically, in this model, we defined the dose for BG and MAA as the number of tests at which a particular subject might have been exposed to these agents. For example, participation in Autumn Gold yields a BG dose of 1 and an MAA dose of 0, since only BG was used in that test. Eager Belle I, Eager Belle II, and Scarlet Sage also used only BG. Tests High Low and Purple Sage used only MAA, but DTC test 69-31 used both BG and MAA. The range of observed dose for BG ranged from 0 (controls) to 3, while the range of observed dose for MAA ranged from 0 to 2.
General linear model analyses of PCS and MCS scores were run using BG and MAA dose data as independent variables, adjusted for age, race, pay grade, and branch. Table 10-7 shows that both PCS and MCS scores have a statistically significant difference by BG and MAA dose, although neither exposure relationship shows a clear gradient. The maximum effect size is around 3–4 points for BG and MAA dose effects.
However, it is mostly the highest exposure group for both PCS and MCS that is not strictly monotone, and this is the group whose effect estimates have the largest standard error. Thus, we did analyses for linear trends. We found statistically significant coefficients for linear trend for both BG and MAA for both PCS and MCS scores, evidence that PCS and MCS scores were statistically significantly lower with each additional test in which there was potential exposure to either BG or MAA.
Analysis of Individual Exposure Data from DTC Test 69-10
As explained in detail in Chapter 8, during Project SHAD (Shipboard Hazard and Defense) test DTC 69-10, Marine troops were subjected to a simulated chemical weapons assault with the purpose of determining the “operational effects of a persistent, toxic, chemical agent spray attack on U.S. amphibious forces.” During this test, sampling was conducted on exposed personnel and their clothing to determine the extent of exposure to the simulant agent, trioctyl phosphate (TOF). DTC test 69-10 was conducted at Vieques island, east of Puerto Rico, on May 3, 4, 5, and 7, 1969. Using material from a redacted version of the DTC test 69-10 final report, we assigned individual exposure levels based on individual estimates of magnitude of contamination on an ordinal
TABLE 10-6 Mean SF-36 Physical Component Summary (PCS) and Mental Component Summary (MCS) Scores for Subjects in Group A (Standard Errors in Parentheses), by Agent, with Adjustment for Age, Race, Branch, Pay Grade, Smoking, Drinking, and Body Mass Index (Model 1) or These Factors Plus Number of Tests (Model 2)
|
Model Factor and Level |
Adjusted Mean PCS Value |
F-Test Value and Probability |
Adjusted Mean MCS Value |
F-Test Value and Probability |
|
Model 1 |
||||
|
BG |
|
|
|
|
|
No |
45.84 (1.25) |
10.38, 1 df, P = .0013 |
48.80 (1.37) |
2.77, 1 df, P = .0964 |
|
Yes |
44.37 (1.21) |
|
47.97 (1.33) |
|
|
MAA |
|
|
|
|
|
No |
45.92 (1.20) |
11.38, 1 df, P = .0008 |
49.58 (1.32) |
20.11, 1 df, P < .0001 |
|
Yes |
44.28 (1.26) |
|
47.19 (1.39) |
|
|
Age |
— |
29.06, 1 df, P < .0001 |
— |
6.62, 1 df, P = .0101 |
|
Race |
— |
7.89, 1 df, P = .0050 |
— |
3.76, 1 df, P = .0526 |
|
Pay grade |
— |
12.88, 2 df, P < .0001 |
— |
6.66, 2 df, P = .0013 |
|
Branch |
— |
1.02, 1 df, P = .3123 |
— |
4.38, 1 df, P = .0364 |
|
Smoking |
— |
35.53, 1 df, P < .0001 |
— |
5.86, 1 df, P = .0155 |
|
Drinking |
— |
51.54, 1 df, P < .0001 |
— |
21.61, 1 df, P < .0001 |
|
BMI* |
— |
76.35, 1 df, P < .0001 |
— |
1.47, 1 df, P = .2251 |
|
Model 2 |
||||
|
BG |
|
|
|
|
|
No |
44.45 (1.40) |
0.85, 1 df, P = .3565 |
47.78 (1.54) |
1.23, 1 df, P = .2666 |
|
Yes |
45.33 (1.35) |
|
48.94 (1.48) |
|
|
MAA |
|
|
|
|
|
No |
45.36 (1.30) |
1.37, 1 df, P = .2422 |
49.17 (1.43) |
3.35, 1 df, P = .0674 |
|
Yes |
44.42 (1.40) |
|
47.55 (1.54) |
|
|
Age |
— |
32.52, 1 df, P < .0001 |
— |
5.52, 1 df, P = .0189 |
|
Race |
— |
7.69, 1 df, P = .0056 |
— |
3.58, 1 df, P = .0584 |
|
Pay grade |
— |
14.78, 2 df, P < .0001 |
— |
7.63, 2 df, P = .0005 |
|
Branch |
— |
0.54, 1 df, P = .4605 |
— |
4.87, 1 df, P = .0274 |
|
Smoking |
— |
34.91, 1 df, P < .0001 |
— |
5.77, 1 df, P = .0164 |
|
Drinking |
— |
49.80, 1 df, P < .0001 |
— |
20.67, 1 df, P < .0001 |
|
BMI* |
— |
77.63, 1 df, P < .0001 |
— |
1.60, 1 df, P = .2067 |
|
Number of tests |
||||
|
0 |
46.59 (1.53) |
5.57, 3 df, P = .0008 |
49.86 (1.68) |
2.74, 3 df, P = .0419 |
|
1 |
45.38 (1.21) |
|
48.54 (1.33) |
|
|
2 |
42.56 (1.37) |
|
46.51 (1.50) |
|
|
3 |
45.03 (2.10) |
|
48.53 (2.31) |
|
|
NOTE: Statistically significant items are in bold. *BMI = body mass index. |
||||
scale: VH (very heavy), H (heavy), M (medium), L (light), VL (very light), T (trace) and N (negligible). When multiple exposures were taken into account, there were 428 individuals who had ordinal contamination data from one or more trials. Because we were unable to obtain quantitative data regarding the contamination levels, we analyzed the TOF exposure data by arbitrarily assigning the following exposure values: T (trace) and N (negligible) = 0.5; VL (very light) = 1.0; L (light) = 2.0; M (medium) = 3.0; H (heavy) = 4.0; and VH (very heavy) = 5.0. We further assigned a dose of zero to Marine controls in DTC test 69-10.
A total of 260 Marine subjects in group B provided data for an analysis of SF-36 summary outcomes. After adjusting for age, race, and pay grade, SF-36 PCS did not differ significantly by assigned TOF exposure levels (F statistic = 0.01, 1 df, P = .9309) nor did mental component scores (F statistic = 0.44, 1 df, P = .5094). When we dichotomized exposure into two groups, with “high” defined as 4.0 or more and “low” defined as less than 4.0, we
TABLE 10-7 Mean SF-36 Physical Component Summary (PCS) and Mental Component Summary (MCS) Scores (Standard Errors in Parentheses) for Subjects in Group A, by “Dose” of Agent, with Adjustment for Age, Race, Pay Grade, and Branch
|
Model Factor and Dosea |
Adjusted Mean PCS Value |
F-Test Value and Probability |
Adjusted Mean MCS Value |
F-Test Value and Probability |
|
BG |
|
|
|
|
|
0 |
46.30 (1.46) |
6.93, 3 df, P = .0001 |
48.58 (1.61) |
4.12, 3 df, P = .0063 |
|
1 |
45.77 (1.43) |
|
48.75 (1.57) |
|
|
2 |
43.30 (1.47) |
|
46.15 (1.62) |
|
|
3 |
45.25 (2.93) |
|
49.87 (3.22) |
|
|
MAA |
|
|
|
|
|
0 |
45.27 (1.36) |
9.24, 2 df, P < .0001 |
49.48 (1.49) |
12.91, 2 df, P < .0001 |
|
1 |
43.11 (1.45) |
|
46.62 (1.59) |
|
|
2 |
47.08 (2.61) |
|
48.91 (2.87) |
|
|
Age |
— |
31.59, 1 df, P < .0001 |
— |
5.35, 1 df, P = .0208 |
|
Race |
— |
7.70, 1 df, P = .0056 |
— |
3.60, 1 df, P = .0579 |
|
Pay grade |
— |
14.42, 2 df, P < .0001 |
— |
7.82, 2 df, P = .0004 |
|
Branch |
— |
0.29, 1 df, P = .5907 |
— |
6.28, 1 df, P = .0123 |
|
Smoking |
— |
35.42, 1 df, P < .0001 |
— |
5.73, 1 df, P = .0167 |
|
Drinking |
— |
48.88, 1 df, P < .0001 |
— |
19.96, 1 df, P < .0001 |
|
BMIb |
— |
76.61, 1 df, P < .0001 |
— |
1.45, 1 df, P = .2286 |
|
NOTE: Statistically significant items are in bold. aDose is the number of tests in which a subject was potentially exposed to an agent. bBMI = body mass index. |
||||
found similar results. The SF-36 summary scores did not differ statistically significantly for either PCS (F statistic = 0.00, 1 df, P = .9937) or MCS (F statistic = 0.40, 1 df, P = .5278).
SF-36 Summary
In summary, we detected many statistically significant differences in SF-36 scores, although relatively few were of even moderate size. In most cases, differences in adjusted SF-36 summary scores are all around two points, with age and pay grade generally the most important covariates, although group C differences were smaller and not statistically significant. In comparison to national norms, both participants and controls had lower PCS and MCS scores (worse health), but controls had PCS and MCS scores that were nearer the national norms. In comparison, veterans aged 50–64 in the Veterans Health Study, who were receiving outpatient care from the Department of Veterans Affairs (VA), had an average PCS score of 37.2 and an average MCS score of 47.0 (Payne et al., 2005), both of which are substantially lower than the participant or control scores in our study.
An analysis of the independent effects of BG and MAA exposure in group A found that neither agent was associated with a large change in SF-36 summary score, although both agents had a statistically significant effect on both PCS and MCS adjusted mean scores. We did not see a clear dose-response relationship between the number of tests in group A and either PCS or MCS, but there was a statistically significant linear trend. An analysis of the only individual exposure data available, from DTC test 69-10, showed no statistically significant association of recorded exposure level, either on an ordinal scale or dichotomized, with either PCS or MCS.
OTHER SCALED DATA
Somatization Scale
Twelve items, taken from the Structured Clinical Interview for DSM-IV (SCID) somatization scale, were included in the Project SHAD health survey questionnaire. The number of “yes” responses was totaled to produce a score ranging from 0 to 12. If 3 or more items were missing, the score was considered missing. Table 10-8 shows unadjusted and adjusted (for age, race, pay grade, branch, smoking, drinking, and BMI) somatization scores for participants and controls by analysis group; all mean differences were statistically significant. Somatization scores were uniformly higher for participants, with differences typically less than one point.
Memory and Attention Subscales of the Neuropsychological Scale
The subscales on memory and attention problems, taken from the Neuropsychological Impairment Scale (O’Donnell et al., 1993), were included in the Project SHAD health survey questionnaire. Each questionnaire item (e.g., “I have a hard time remembering people’s names”) is scored from 1 to 5 (“not at all” to “extremely”) and the individual items scores are summed. The responses on the memory subscale range from 0 to 32, and the attention subscale responses range from 0 to 36. We also analyzed data based on a dichotomous outcome, with a score of 14 or more on either scale considered as “high.”
Table 10-9 shows unadjusted and adjusted (for age, race, pay grade, branch, smoking, drinking, and BMI) memory and attention scores for participants and controls by analysis group. Except for group C, all mean differences were statistically significant; in group C only the adjusted memory scale scores were significantly different. Both memory and attention scores were uniformly higher for participants (indicating greater problems), with differences in unadjusted mean scores ranging from one to almost four points. The largest differences were found in group B.
OTHER MEDICAL DATA
Medical Conditions
Table 10-10 shows self-reported medical conditions by analysis group. The original 45 medical conditions (including open-ended items such as “Any other heart condition [please specify]”) have been grouped into 11 broader categories for analysis. Adjusted (for age, race, pay grade, smoking, drinking, and BMI) odds ratios (OR) are shown, with statistically significant odds ratios shown in bold.
TABLE 10-8 Mean Somatization Scores, Unadjusted and Adjusted, for Participants and Controls, by Analysis Group
|
|
Unadjusted |
Adjusteda |
||
|
Participants |
Controls |
Participants |
Controls |
|
|
Group Ac |
2.83b |
2.15 |
2.38b |
1.63 |
|
Group Bc |
3.49b |
2.59 |
3.62b |
2.90 |
|
Group Cc |
3.02b |
2.59 |
2.18b |
1.62 |
|
Group Dc |
2.90b |
2.27 |
2.76b |
1.98 |
|
aAdjusted for age, race, pay grade, branch, smoking, drinking, and body mass index. bStatistically significant difference. cGroup A = participants potentially exposed only to BG or MAA; group B = participants potentially exposed only to TOF; group C = participants potentially exposed to any active chemical or biological agent; group D = participants potentially exposed only to simulants and not in groups A or B. |
||||
TABLE 10-9 Mean Memory and Attention Scores, Unadjusted and Adjusted, for Participants and Controls, by Analysis Groupa
|
|
Unadjusted |
Adjustedc |
||
|
Participants |
Controls |
Participants |
Controls |
|
|
Group A |
||||
|
Memory |
8.33b |
6.83 |
8.27b |
6.64 |
|
Attention |
9.09b |
7.10 |
9.30b |
7.17 |
|
Group B |
||||
|
Memory |
10.08b |
7.56 |
10.12b |
8.32 |
|
Attention |
11.66b |
7.93 |
11.41b |
8.25 |
|
Group C |
||||
|
Memory |
8.46 |
7.59 |
5.74b |
4.56 |
|
Attention |
9.23 |
8.37 |
5.52 |
4.35 |
|
Group D |
||||
|
Memory |
8.53b |
6.89 |
8.30b |
6.51 |
|
Attention |
9.62b |
7.38 |
9.69b |
7.23 |
|
aGroup A = participants potentially exposed only to BG or MAA; group B = participants potentially exposed only to TOF; group C = participants potentially exposed to any active chemical or biological agent; group D = participants potentially exposed only to simulants and not in groups A or B. bStatistically significant difference. cAdjusted for age, race, pay grade, branch, smoking, drinking, and body mass index. |
||||
TABLE 10-10 Number of Medical Conditions for Participants and Controls, with Adjusted Odds Ratios (ORs) and 95% Confidence Intervals (CIs), by Analysis Group
|
|
Participants |
Controls |
Adjusted OR* |
95% CI |
|
Group A |
N = 1,548 |
N = 1,326 |
|
|
|
Cardiovascular |
1,106 |
892 |
1.31 |
1.05–1.62 |
|
Visual |
541 |
418 |
1.21 |
0.98–1.50 |
|
Respiratory |
648 |
460 |
1.49 |
1.22–1.83 |
|
Renal |
245 |
158 |
1.49 |
1.09–1.96 |
|
Endocrine |
556 |
421 |
1.26 |
1.01–1.56 |
|
Liver |
124 |
89 |
1.11 |
0.76–1.62 |
|
Autoimmune |
323 |
253 |
1.09 |
0.85–1.40 |
|
Gastrointestinal |
256 |
179 |
1.28 |
0.97–1.68 |
|
Neurological |
468 |
567 |
1.54 |
1.26–1.88 |
|
Psychological |
375 |
259 |
1.59 |
1.25–2.04 |
|
Cancer |
263 |
185 |
1.43 |
1.08–1.89 |
|
Group B |
N = 384 |
N = 230 |
|
|
|
Cardiovascular |
278 |
154 |
1.47 |
0.83–2.60 |
|
Visual |
115 |
55 |
1.02 |
0.57–1.84 |
|
Respiratory |
177 |
81 |
1.57 |
0.90–2.74 |
|
Renal |
63 |
20 |
1.74 |
0.79–3.80 |
|
Endocrine |
112 |
68 |
0.96 |
0.53–1.76 |
|
Liver |
38 |
20 |
0.66 |
0.24–1.81 |
|
Autoimmune |
102 |
43 |
2.14 |
1.05–4.35 |
|
Gastrointestinal |
74 |
28 |
1.75 |
0.82–3.74 |
|
Neurological |
214 |
87 |
2.01 |
1.16–3.47 |
|
Psychological |
161 |
63 |
2.84 |
1.50–5.37 |
|
Cancer |
56 |
24 |
1.27 |
0.52–3.09 |
|
|
Participants |
Controls |
Adjusted OR* |
95% CI |
|
Group C |
N = 337 |
N = 376 |
|
|
|
Cardiovascular |
251 |
264 |
1.16 |
0.73–1.86 |
|
Visual |
120 |
118 |
1.43 |
0.93–2.20 |
|
Respiratory |
159 |
139 |
1.27 |
0.85–1.92 |
|
Renal |
59 |
52 |
1.17 |
0.68–2.00 |
|
Endocrine |
128 |
133 |
0.78 |
0.50–1.20 |
|
Liver |
16 |
32 |
0.47 |
0.20–1.07 |
|
Autoimmune |
68 |
73 |
1.23 |
0.75–2.01 |
|
Gastrointestinal |
72 |
66 |
1.97 |
1.17–3.32 |
|
Neurological |
175 |
166 |
1.16 |
0.77–1.75 |
|
Psychological |
90 |
89 |
1.12 |
0.70–1.79 |
|
Cancer |
69 |
60 |
1.35 |
0.79–2.32 |
|
Group D |
N = 411 |
N = 498 |
|
|
|
Cardiovascular |
286 |
333 |
1.06 |
0.71–1.59 |
|
Visual |
131 |
144 |
1.18 |
0.80–1.74 |
|
Respiratory |
169 |
178 |
1.30 |
0.90–1.88 |
|
Renal |
63 |
56 |
1.65 |
0.98–2.72 |
|
Endocrine |
131 |
157 |
1.08 |
0.73–1.62 |
|
Liver |
28 |
38 |
1.09 |
0.57–2.06 |
|
Autoimmune |
83 |
98 |
0.97 |
0.61–1.54 |
|
Gastrointestinal |
59 |
68 |
1.07 |
0.65–1.75 |
|
Neurological |
184 |
221 |
1.04 |
0.72–1.50 |
|
Psychological |
121 |
94 |
2.04 |
1.34–3.09 |
|
Cancer |
71 |
59 |
1.40 |
0.86–2.28 |
|
NOTE: Cardiovascular: hypertension, coronary heart disease, heart attack, angina, other heart condition, stroke; Visual: cataract/lens problems, conjunctivitis; Respiratory: sinusitis, chronic bronchitis, emphysema, asthma; Renal: kidney failure, bladder infection; Endocrine: pancreatitis, diabetes, gallstones, thyroid condition; Liver: hepatitis B, hepatitis C, any other hepatitis, cirrhosis; Autoimmune: rheumatoid arthritis, lupus, multiple sclerosis; Gastrointestinal: Crohn’s disease, stomach/peptic ulcer, ulcerative colitis; Neurologic: neuropathy, seizures, Parkinson’s, amyotrophic lateral sclerosis, other neurodegenerative disease, migraines, hearing loss; Psychologic: depression, schizophrenia/ psychosis, manic depressive disorder, post-traumatic stress disorder. Sleep apnea, anemia, chronic fatigue syndrome, and dermatitis/eczema/ psoriasis did not fit into any categories. Statistically significant odds ratios in bold. *Adjusted for age, race, pay grade, smoking, drinking, and body mass index. |
||||
Based on adjusted OR estimates, in group A there were significantly more cardiovascular, respiratory, renal, endocrine, gastrointestinal, neurological, and psychological medical conditions reported by participants than controls; in group B, significantly more respiratory, renal, autoimmune, gastrointestinal, neurological, and psychological conditions reported by participants; for group C, significantly more respiratory and neurological conditions; and in group D, significantly more psychological conditions. Most adjusted ORs were under 2.0. Respiratory conditions were reported at significantly higher rates among participants in all analysis groups but group D, and psychological conditions in all but group C.
Table 10-11 shows a distribution of self-reported cancer by type. Skin cancer and prostate cancer are generally reported with the highest prevalences.
Table 10-12 shows adjusted ORs for medical conditions as they appeared in the questionnaire, rather than grouped into broader categories. The sparser data make for larger confidence intervals (CIs) and some slightly higher ORs. All groups reported higher rates of neurodegenerative conditions, with relatively large and statistically significant ORs in groups A, B, and C. Table 10-13 shows a breakdown of these self-reported neurodegenerative
TABLE 10-11 Summary of Cancer Types by Group and Participant Status
conditions. Most of the entries were unspecified, some overlap the categories in Table 10-12 (e.g., neuropathy), and the inclusion of conditions such as arthritis calls into doubt the utility of these data for further analyses.
Table 10-14 shows self-reported symptoms, rather than medical conditions, for participants and controls, along with adjusted ORs. In contrast to the data on medical conditions, nearly every symptom is reported at higher prevalence among participants than nonparticipants, even though not all differences are statistically significant. Among these is included “earlobe pain,” an item without a clear medical basis, included to obtain data on possible overreporting of medical problems.
TABLE 10-12 Ungrouped Medical Conditions by Analysis Group, Comparing Participants to Controls (Navy and Marine Only)
|
Analysis Group and Medical Condition |
Participants (N = 1,548) |
Controls (N = 1,326) |
Adjusted OR for Age, Race, Pay Grade, Smoking, Drinking, and BMI |
95% CI |
|
Group A |
N |
N |
|
|
|
Hypertension |
949 |
766 |
1.24 |
1.00–1.53 |
|
Coronary heart disease |
338 |
242 |
1.30 |
1.01–1.68 |
|
Heart attack |
265 |
186 |
1.23 |
0.93–1.62 |
|
Angina |
374 |
261 |
1.31 |
1.02–1.67 |
|
Other heart condition |
157 |
112 |
1.59 |
0.61–4.13 |
|
Cataracts/eye lens |
497 |
397 |
1.14 |
0.92–1.42 |
|
Conjunctivitis |
85 |
36 |
2.85 |
1.54–5.25 |
|
Sinusitis |
455 |
290 |
1.63 |
1.30–2.04 |
|
Chronic bronchitis |
230 |
156 |
1.56 |
1.15–2.12 |
|
Emphysema |
106 |
139 |
1.28 |
0.89–1.83 |
|
Asthma |
157 |
115 |
1.20 |
0.85–1.69 |
|
Kidney failure |
16 |
13 |
0.78 |
0.22–2.75 |
|
Bladder infection |
235 |
148 |
1.48 |
1.09–1.99 |
|
Pancreatitis |
33 |
28 |
1.17 |
0.59–2.31 |
|
Diabetes |
363 |
279 |
1.24 |
0.96–1.59 |
|
Gallstones |
163 |
110 |
1.15 |
0.82–1.61 |
|
Hepatitis B |
37 |
25 |
0.88 |
0.41–1.86 |
|
Hepatitis C |
26 |
23 |
0.91 |
0.42–1.97 |
|
Any other hepatitis |
46 |
37 |
0.85 |
0.50–1.47 |
|
Cirrhosis |
33 |
23 |
1.54 |
0.73–3.26 |
|
Rheumatoid arthritis |
303 |
244 |
1.06 |
0.82–1.37 |
|
Lupus |
14 |
10 |
0.96 |
0.32–2.88 |
|
Multiple sclerosis |
5 |
4 |
0.91 |
0.06–14.63 |
|
Crohn’s disease |
13 |
9 |
1.43 |
0.46–4.1 |
|
Stomach/peptic ulcer |
214 |
154 |
1.24 |
0.92–1.67 |
|
Ulcerative colitis |
51 |
44 |
0.94 |
0.53–1.66 |
|
Hearing loss |
567 |
405 |
1.31 |
1.06–1.61 |
|
Migraines |
171 |
112 |
1.86 |
1.28–2.71 |
|
Stroke |
107 |
71 |
1.27 |
0.82–1.96 |
|
Neuropathy |
320 |
203 |
1.69 |
1.30–2.20 |
|
Seizures |
32 |
34 |
1.05 |
0.53–2.09 |
|
Sleep apnea |
319 |
222 |
1.31 |
1.00–1.70 |
|
Anemia |
75 |
52 |
1.29 |
0.79–2.11 |
|
Thyroid condition |
98 |
82 |
1.12 |
0.76–1.66 |
|
Cancer |
263 |
185 |
1.43 |
1.08–1.89 |
|
Chronic fatigue syndrome |
100 |
41 |
2.55 |
1.51–4.30 |
|
Depression |
350 |
234 |
1.68 |
1.30–2.16 |
|
Schizophrenia |
19 |
11 |
4.34 |
0.95–19.89 |
|
Manic depressive disorder |
42 |
29 |
1.42 |
0.70–2.88 |
|
PTSD |
105 |
88 |
0.99 |
0.65–1.50 |
|
Dermatitis, eczema, psoriasis |
269 |
135 |
1.83 |
1.36–2.45 |
|
Parkinson’s |
9 |
5 |
2.39 |
0.48–12.02 |
|
ALS |
2 |
1 |
1.70 |
0.15–18.89 |
|
Other neurodegenerative disease |
61 |
18 |
3.77 |
1.81–7.84 |
|
Analysis Group and Medical Condition |
Participants (N = 384) |
Controls (N = 230) |
Adjusted OR for Age, Race, Pay Grade, Smoking, Drinking, and BMI |
95% CI |
|
Group B |
N |
N |
|
|
|
Hypertension |
241 |
138 |
1.12 |
0.64–1.96 |
|
Coronary heart disease |
74 |
37 |
1.28 |
0.59–2.79 |
|
Heart attack |
57 |
25 |
1.29 |
0.56–2.97 |
|
Angina |
108 |
48 |
2.12 |
1.06–4.16 |
|
Other heart condition |
42 |
29 |
2.07 |
0.06–72.76 |
|
Cataracts/eye lens |
101 |
46 |
1.01 |
0.55–1.87 |
|
Conjunctivitis |
23 |
10 |
1.64 |
0.49–5.50 |
|
Sinusitis |
121 |
53 |
1.86 |
1.00–3.44 |
|
Chronic bronchitis |
68 |
32 |
1.68 |
0.70–4.04 |
|
Emphysema |
41 |
14 |
1.21 |
0.43–3.42 |
|
Asthma |
46 |
22 |
0.98 |
0.45–2.14 |
|
Kidney failure |
6 |
0 |
— |
|
|
Bladder infection |
61 |
20 |
1.66 |
0.78–3.65 |
|
Pancreatitis |
12 |
3 |
3.43 |
0.35–34.09 |
|
Diabetes |
88 |
50 |
0.87 |
0.45–11.66 |
|
Gallstones |
27 |
20 |
1.22 |
0.43–3.72 |
|
Hepatitis B |
15 |
4 |
1.77 |
0.19–16.33 |
|
Hepatitis C |
14 |
8 |
0.62 |
0.17–2.34 |
|
Any other hepatitis |
11 |
5 |
0.86 |
0.15–5.06 |
|
Cirrhosis |
5 |
6 |
0.66 |
0.05–8.16 |
|
Rheumatoid arthritis |
99 |
41 |
2.28 |
1.09–4.74 |
|
Lupus |
4 |
1 |
— |
|
|
Multiple sclerosis |
2 |
0 |
— |
|
|
Crohn’s disease |
2 |
1 |
0.92 |
0.08–11.04 |
|
Stomach/peptic ulcer |
62 |
25 |
1.93 |
0.81–4.56 |
|
Ulcerative colitis |
17 |
2 |
2.63 |
0.53–13.03 |
|
Hearing loss |
154 |
55 |
2.08 |
1.14–3.79 |
|
Migraines |
70 |
25 |
3.15 |
1.16–8.58 |
|
Stroke |
23 |
12 |
1.05 |
0.30–3.67 |
|
Neuropathy |
88 |
34 |
1.46 |
0.70–3.3 |
|
Seizures |
18 |
6 |
1.14 |
0.28–4.69 |
|
Sleep apnea |
91 |
52 |
0.98 |
0.51–1.86 |
|
Anemia |
20 |
12 |
2.83 |
0.56–14.26 |
|
Thyroid condition |
19 |
9 |
2.55 |
0.55–11.87 |
|
Cancer |
56 |
24 |
1.27 |
0.52–3.09 |
|
Chronic fatigue syndrome |
31 |
12 |
9.27 |
1.12–76.80 |
|
Depression |
136 |
56 |
2.55 |
1.33–4.91 |
|
Schizophrenia |
12 |
4 |
1.68 |
0.33–8.66 |
|
Manic depressive disorder |
24 |
8 |
3.20 |
0.67–15.41 |
|
PTSD |
91 |
28 |
5.87 |
1.99–17.33 |
|
Dermatitis, eczema, psoriasis |
52 |
28 |
1.85 |
0.71–4.82 |
|
Parkinson’s |
6 |
0 |
— |
|
|
ALS |
1 |
0 |
— |
|
|
Other neurodegenerative disease |
18 |
4 |
2.85 |
0.31–25.93 |
|
Analysis Group and Medical Condition |
Participants (N = 337) |
Controls (N = 376) |
Adjusted OR for Age, Race, Pay Grade, Smoking, Drinking, and BMI |
95% CI |
|
Group C |
N |
N |
|
|
|
Hypertension |
211 |
232 |
1.06 |
0.69–1.65 |
|
Coronary heart disease |
67 |
82 |
0.91 |
0.55–1.50 |
|
Heart attack |
50 |
66 |
0.85 |
0.49–1.46 |
|
Angina |
71 |
90 |
0.93 |
0.58–1.51 |
|
Other heart condition |
36 |
38 |
0.64 |
0.06–6.61 |
|
Cataracts/eye lens |
106 |
104 |
1.20 |
0.77–1.86 |
|
Conjunctivitis |
23 |
19 |
2.52 |
0.98–6.47 |
|
Sinusitis |
115 |
86 |
1.46 |
0.93–2.28 |
|
Chronic bronchitis |
57 |
45 |
1.18 |
0.62–2.24 |
|
Emphysema |
35 |
36 |
1.21 |
0.61–2.38 |
|
Asthma |
42 |
32 |
1.44 |
0.74–2.82 |
|
Kidney failure |
5 |
3 |
1.59 |
0.09–27.74 |
|
Bladder infection |
56 |
50 |
1.14 |
0.66–1.97 |
|
Pancreatitis |
13 |
8 |
1.81 |
0.49–6.69 |
|
Diabetes |
80 |
90 |
0.68 |
0.41–1.13 |
|
Gallstones |
41 |
39 |
0.82 |
0.43–1.55 |
|
Hepatitis B |
5 |
11 |
0.33 |
0.08–1.36 |
|
Hepatitis C |
4 |
10 |
0.40 |
0.08–2.05 |
|
Any other hepatitis |
6 |
9 |
0.97 |
0.29–3.29 |
|
Cirrhosis |
4 |
6 |
0.28 |
0.03–2.61 |
|
Rheumatoid arthritis |
66 |
69 |
1.30 |
0.78–2.15 |
|
Lupus |
1 |
4 |
0.35 |
0.04–3.45 |
|
Multiple sclerosis |
0 |
0 |
— |
|
|
Crohn’s disease |
4 |
3 |
1.68 |
0.28–10.26 |
|
Stomach/peptic ulcer |
57 |
60 |
1.79 |
1.04–3.08 |
|
Ulcerative colitis |
19 |
7 |
4.99 |
1.29–19.30 |
|
Hearing loss |
119 |
121 |
0.99 |
0.64–1.53 |
|
Migraines |
45 |
41 |
1.21 |
0.66–2.24 |
|
Stroke |
18 |
21 |
1.46 |
0.60–3.53 |
|
Neuropathy |
70 |
62 |
1.31 |
0.79–2.19 |
|
Seizures |
14 |
9 |
2.02 |
0.57–7.15 |
|
Sleep apnea |
74 |
73 |
0.97 |
0.57–1.65 |
|
Anemia |
28 |
21 |
1.69 |
0.76–3.77 |
|
Thyroid condition |
25 |
23 |
1.17 |
0.52–2.65 |
|
Cancer |
69 |
60 |
1.35 |
0.79–2.32 |
|
Chronic fatigue syndrome |
26 |
25 |
1.65 |
0.78–3.60 |
|
Depression |
86 |
84 |
1.19 |
0.74–1.91 |
|
Schizophrenia |
2 |
9 |
0.16 |
0.02–1.77 |
|
Manic depressive disorder |
8 |
9 |
0.72 |
0.14–3.58 |
|
PTSD |
17 |
27 |
0.54 |
0.20–1.48 |
|
Dermatitis, eczema, psoriasis |
66 |
49 |
1.71 |
0.96–3.03 |
|
Parkinson’s |
6 |
8 |
0.79 |
0.23–2.72 |
|
ALS |
0 |
1 |
— |
|
|
Other neurodegenerative disease |
17 |
6 |
3.25 |
0.84–12.59 |
TABLE 10-13 Reports of Other Neurodegenerative Diseases by Participant and Group Status
|
|
Participant |
Control |
|
Group A |
(N = 61) 46 unspecified, 8 spinal problems/degenerative discs, 1 meningitis, 1 myasthenia gravis, 1 dementia, 1 erectile dysfunction, 1 diverticulitis, 1 gout, 1 polio |
(N = 18) 13 unspecified, 2 spinal/degenerative discs, 1 arthritis, 1 dementia, 1 neuropathy |
|
Group B |
(N = 18) 8 unspecified, 7 spinal problems/degenerative discs, 2 arthritis, 1 diverticulitis |
(N = 4) 1 unspecified, 2 osteoporosis, 1 anxiety |
|
Group C |
(N = 17) 12 unspecified, 3 tremors, 1 hearing loss, 1 attention deficit disorder |
(N = 6) 4 unspecified, 1 dementia, 1 neuropathy |
|
Group D |
(N = 17) 15 unspecified, 1 arthritis, 1 anxiety |
(N = 14) 8 unspecified, 2 neuropathy, 1 myasthenia gravis, 1 Guillan-Barre syndrome, 1 brain tumor, 1 spinal problem |
Hospitalizations Since Discharge from Active Duty
Table 10-15 shows self-reported data on hospitalizations since discharge from active duty. Roughly two-thirds of participants and controls reported a hospitalization, across all analysis groups; there were no statistically significant differences. Data on the mean number of hospitalizations (those not reporting a hospitalization were assigned zero number of hospitalizations) showed nearly equal rates between participants and controls across analysis groups, with no statistically significant differences.
Birth Defects
Table 10-16 shows data on self-reported birth defects. To calculate these rates, we divided the number of subjects who reported children with birth defects by the number of “eligible fathers.” Eligible fathers are defined as men who answered “yes” to the following question, “Have you ever been the biological father of any pregnancy, regardless of whether there was a live birth outcome from that pregnancy?” and also answered one or more to the following question, “How many of the pregnancies ended in live births, even if the infant died shortly after birth?”
Table 10-16 shows that roughly 10–16 percent of participants reported birth defects among their children born live. The corresponding rate among participant subjects was larger in group D, while the mean number of children born with birth defects showed no statistically significant differences.
REFERENCES
O’Donnell, W. E., C. B. DeSoto, and J. L. DeSoto. 1993. Validity and reliability of the revised Neuropsychological Impairment Scale (NIS). Journal of Clinical Psychology 49:372-382.
Payne, S. M., A. Lee, J. A. Clark, W. H. Rogers, D. R. Miller, K. M. Skinner, X. S. Ren, and L. E. Kazis. 2005. Utilization of medical services by Veterans Health Study (VHS) respondents. Journal of Ambulatory Care Management 28:125-140.
TABLE 10-14 Numbers of Symptoms by Group Comparing Participants to Controls, with Adjusted Odds Ratios (ORs)
|
|
Participants |
Controls |
Adjusted OR* |
95% CI |
|
Group A |
(N = 1,548) |
(N = 1,326) |
|
|
|
Severe headache |
201 |
115 |
1.73 |
1.25–2.38 |
|
Diarrhea |
284 |
143 |
1.90 |
1.43–2.52 |
|
Rash/skin ulcer |
282 |
137 |
2.00 |
1.51–2.63 |
|
Sore throat |
309 |
168 |
1.58 |
1.21–2.06 |
|
Frequent bladder infections |
61 |
32 |
1.55 |
0.84–2.85 |
|
Cough |
511 |
323 |
1.62 |
1.30–2.01 |
|
Fever |
150 |
90 |
1.42 |
1.00–2.01 |
|
Unexplained hair loss |
71 |
32 |
1.77 |
1.00–3.15 |
|
Earlobe pain |
53 |
35 |
1.15 |
0.65–2.01 |
|
Sleepy all the time |
321 |
207 |
1.52 |
1.16–1.98 |
|
Night sweats |
373 |
253 |
1.34 |
1.05–1.70 |
|
Chest pain |
325 |
191 |
1.79 |
1.38–2.34 |
|
Unusual muscle pains |
483 |
286 |
1.77 |
1.41–2.21 |
|
Shortness of breath |
592 |
414 |
1.53 |
1.24–1.89 |
|
Trouble sleeping |
625 |
416 |
1.50 |
1.22–1.84 |
|
Unusual fatigue |
444 |
309 |
1.42 |
1.13–1.78 |
|
Forgetfulness |
561 |
399 |
1.71 |
1.38–2.12 |
|
Confusion |
214 |
130 |
1.71 |
1.25–2.35 |
|
Group B |
(N = 384) |
(N = 230) |
|
|
|
Severe headache |
88 |
27 |
1.63 |
0.77–3.44 |
|
Diarrhea |
91 |
28 |
2.41 |
1.10–5.28 |
|
Rash/skin ulcer |
74 |
33 |
1.35 |
0.67–2.69 |
|
Sore throat |
85 |
39 |
1.36 |
0.70–2.62 |
|
Frequent bladder infections |
3 |
20 |
3.06 |
0.36–26.05 |
|
Cough |
132 |
58 |
1.50 |
0.85–2.64 |
|
Fever |
51 |
19 |
2.76 |
0.99–7.73 |
|
Unexplained hair loss |
27 |
12 |
3.40 |
0.69–16.80 |
|
Earlobe pain |
17 |
13 |
1.01 |
0.32–3.17 |
|
Sleepy all the time |
124 |
37 |
3.73 |
1.71–8.41 |
|
Night sweats |
149 |
52 |
3.10 |
1.58–6.07 |
|
Chest pain |
106 |
46 |
1.59 |
0.83–3.06 |
|
Unusual muscle pains |
160 |
61 |
1.35 |
0.77–2.37 |
|
Shortness of breath |
154 |
73 |
1.65 |
0.94–2.91 |
|
Trouble sleeping |
199 |
89 |
1.86 |
1.08–3..18 |
|
Unusual fatigue |
164 |
52 |
2.87 |
1.55–5.30 |
|
Forgetfulness |
176 |
71 |
2.45 |
1.34–4.74 |
|
Confusion |
96 |
31 |
3.79 |
1.61–8.94 |
|
|
Participants |
Controls |
Adjusted OR* |
95% CI |
|
Group C |
(N = 337) |
(N = 376) |
|
|
|
Severe headache |
46 |
49 |
1.14 |
0.63–2.07 |
|
Diarrhea |
68 |
66 |
1.28 |
0.76–2.15 |
|
Rash/skin ulcer |
73 |
48 |
2.20 |
1.29–3.76 |
|
Sore throat |
76 |
64 |
1.32 |
0.79–2.20 |
|
Frequent bladder infections |
15 |
20 |
0.75 |
0.29–1.95 |
|
Cough |
115 |
105 |
1.24 |
0.80–1.92 |
|
Fever |
29 |
27 |
1.77 |
0.82–3.82 |
|
Unexplained hair loss |
13 |
15 |
1.97 |
0.62–6.26 |
|
Earlobe pain |
11 |
11 |
0.90 |
0.77–3.03 |
|
Sleepy all the time |
81 |
78 |
1.07 |
0.66–1.76 |
|
Night sweats |
74 |
87 |
1.07 |
0.66–1.72 |
|
Chest pain |
71 |
79 |
1.02 |
0.62–1.68 |
|
Unusual muscle pains |
132 |
90 |
2.51 |
1.62–3.90 |
|
Shortness of breath |
135 |
143 |
1.15 |
0.76–1.75 |
|
Trouble sleeping |
152 |
141 |
1.48 |
0.98–2.22 |
|
Unusual fatigue |
119 |
102 |
1.88 |
1.21–2.92 |
|
Forgetfulness |
136 |
123 |
1.73 |
1.13–2.64 |
|
Confusion |
53 |
56 |
1.35 |
0.73–2.50 |
|
Group D |
(N = 411) |
(N = 498) |
|
|
|
Severe headache |
63 |
50 |
1.81 |
1.07–3.07 |
|
Diarrhea |
63 |
78 |
1.10 |
0.69–1.77 |
|
Rash/skin ulcer |
84 |
58 |
2.16 |
1.37–3.42 |
|
Sore throat |
74 |
58 |
1.70 |
1.05–2.78 |
|
Frequent bladder infections |
16 |
14 |
1.74 |
0.67–4.47 |
|
Cough |
133 |
132 |
1.51 |
1.03–2.22 |
|
Fever |
36 |
34 |
1.28 |
0.71–2.34 |
|
Unexplained hair loss |
15 |
11 |
3.89 |
1.22–12.38 |
|
Earlobe pain |
14 |
13 |
1.48 |
0.57–3.87 |
|
Sleepy all the time |
98 |
73 |
2.03 |
1.28–3.23 |
|
Night sweats |
95 |
95 |
1.36 |
0.89–2.08 |
|
Chest pain |
82 |
74 |
1.61 |
1.01–2.55 |
|
Unusual muscle pains |
133 |
110 |
1.85 |
1.25–2.75 |
|
Shortness of breath |
169 |
143 |
1.81 |
1.23–2.66 |
|
Trouble sleeping |
172 |
164 |
1.70 |
1.16–2.48 |
|
Unusual fatigue |
135 |
116 |
1.72 |
1.16–2.54 |
|
Forgetfulness |
148 |
143 |
1.68 |
1.15–2.46 |
|
Confusion |
68 |
50 |
2.10 |
1.23–3.56 |
|
Note: Statistically significant odds ratios in bold. *Adjusted for age, race, and pay grade. |
||||
TABLE 10-15 Proportion of Subjects Hospitalized Since Discharge from Active Duty Comparing Participants to Controls, with Adjusted Odds Ratios (ORs)
|
|
Participants |
Controls |
Adjusted OR* |
95% CI |
|
Group A |
68.0% (484) |
66.0% (396) |
1.10 |
0.87–1.39 |
|
Group B |
65.3% (124) |
62.5% (91) |
1.04 |
0.64–1.69 |
|
Group C |
71.2% (116) |
67.9% (114) |
1.20 |
0.74–1.95 |
|
Group D |
69.3% (133) |
64.4% (152) |
1.19 |
0.78–1.81 |
|
Mean # of Hospitalizations |
Participants |
Controls |
Adjusted Means (95% CI) Participants |
Adjusted Means (95% CI) Controls |
|
Group A |
3.18 |
3.23 |
2.82 (2.17–3.47) |
2.86 (2.17–3.55) |
|
Group B |
3.69 |
3.23 |
3.17 (2.24–4.10) |
3.45 (2.30–4.59) |
|
Group C |
3.69 |
3.61 |
3.95 (2.40–5.49) |
4.12 (2.47–5.77) |
|
Group D |
2.81 |
3.40 |
2.97 (1.62–4.35) |
2.35 (0.86–3.84) |
|
NOTE: Percentages are based on those who answered question—not total number. *Adjusted for age, race, and pay grade. |
||||
TABLE 10-16 Birth Defects Among Those Who Fathered a Child Comparing Participants to Controls, with Adjusted Odds Ratios (ORs)
|
|
Participants |
Controls |
Adjusted OR* |
95% CI |
|
Group A |
10.8% (59) |
13.0% (61) |
0.82 |
0.56–1.21 |
|
Group B |
14.8% (19) |
16.5% (19) |
1.11 |
0.55–2.27 |
|
Group C |
16.1% (20) |
9.3 (12) |
1.02 |
0.96–1.09 |
|
Group D |
13.3% (20) |
5.6% (10) |
2.42 |
1.07–5.48 |
|
Mean # of Birth Defects |
Participants |
Controls |
Adjusted Means (95% CI) Participants |
Adjusted Means (95% CI) Controls |
|
Group A |
0.14 |
0.15 |
0.10 (0.03–0.18) |
0.12 (0.04–0.200 |
|
Group B |
0.19 |
0.25 |
0.19 (0.06–0.31) |
0.21 (0.05–0.37) |
|
Group C |
0.18 |
0.14 |
0.19 (0.04–0.35) |
0.16 (-0.01–0.32) |
|
Group D |
0.18 |
0.08 |
0.28 (0.10–0.45) |
0.18 (-0.01–0.37) |
|
NOTE: Percentages and means are based on those who answered and had fathered a child. Statistically significant odds ratios in bold. *Adjusted for age, race, and pay grade. |
||||


