
APPENDIX C
Methods and Metrics for Wildlife Studies
A wide range of methods are available for assessing the ecological influences of wind-energy and aspects of the ecology and behavior of species that may be affected by wind-energy facilities; most of them are reviewed here. For additional information on methods readers are referred to syntheses presented in Anderson et al. (1999), Braun (2005), and Kunz and Parsons (in press).
Key Variables and Monitoring Methods
Researchers have only begun to investigate the ecological impacts of wind-energy facilities, especially impacts on bats. The possibility of large cumulative impacts on bat populations has not previously been considered in siting plans and wind-energy development in the United States, and thus research and monitoring studies are needed to develop predictive models of cumulative effects and to inform decision makers. Understanding of impacts on birds also is limited because of the lack of replication of studies at existing wind-energy facilities, the lack of information in some regions of the country, and inadequate evaluation of predicted impacts following facility construction and operation.
Bat fatalities at wind turbines have been reported at nearly every windenergy facility where post-construction surveys have been conducted, yet few of these studies have included more than one year of monitoring, and of these none monitored fatalities consistently from spring migration through fall migration at any single site. Moreover, only four studies prior to that of Arnett (2005) used fresh bat carcasses to assess searcher efficiency and/or
conducted scavenger-removal experiments to correct estimates for potential biases.
Study Design
The most important element in designing a study is deciding on the study objective. Once the study objective is determined, other essential issues include the following:
-
The area of interest,
-
Time period of interest,
-
Species of interest,
-
Potentially confounding variables,
-
The time and budget available for the required studies, and
-
The magnitude of the impact being evaluated.
The following is a general discussion of methods, metrics, and study design for achieving objectives commonly addressed in the study of wildlife impacts from wind-energy development. For a more detailed discussion of this topic, readers are referred to Green (1979), Underwood (1994), Anderson et al. (1999), Manly (2001), and Morrison et al. (2001). There is no fundamental difference between monitoring and research, but a commonly used criterion for distinguishing them is the duration of study. Monitoring schemes are essentially repeated surveys (Manly 2001) and are usually designed to detect changes and trends in the variable of interest. Because considerations in study design are essentially the same for both monitoring and observational studies, no effort will be made to further discriminate between the two.
Reliable study designs available for environmental impact assessments are limited. The before-after/control impact (BACI) design is commonly used in observational studies (e.g., Stewart-Oaten 1986) and has been considered the optimal impact-study design by Green (1979). As the name implies, this type of study involves the collection of data in the assessment area and a similar (control) area both before and after an impact occurs (Morrison et al. 2001). An effect typically is measured as a change in the difference between estimates of a variable for the control and an assessment area following an impact. Confidence intervals can increase the reliability of an impact estimate when data from more than one control area are available (Underwood 1994). Ideally, control areas should be randomly selected from a population of similar sites (Manly 2001). Study areas within the assessment and control area may be matched to reduce the natural variation common in impact studies (Skalski and Robson 1992), although
characteristics of study sites may change in longer-term studies, and thus matching may be unreliable.
When data are lacking before an impact, the control-impact design may be used. This type of study differs from the BACI design only in the lack of pre-impact data. As in the BACI design, if a significant difference is attributed to the impact of a perturbation the assumption is that nothing else could cause a change of that magnitude (Manly 2001). Before-after designs can be used when data from a control area cannot be obtained. A change immediately following an impact is assumed to be a result of the impact and not from some other cause. In the absence of data from control areas, the attribution of cause may be difficult to support, unless the impact is large and easily attributable to the cause. For example, a decline in bird abundance following the construction of a wind-energy facility might be attributed to the facility by finding large numbers of bird carcasses killed by turbines. In the absence of strong corroborative evidence, attributing the change in abundance to the wind-energy plant may be difficult to defend.
The impact-gradient design may be used for quantifying impacts in relatively small assessment areas with homogeneous environments (Anderson et al. 1999; Manly 2001). With this design, an effect is assumed if it appears to be reduced as the distance increases from the source of the impact (Manly 2001). The most important assumption made when using the impact-gradient design is that the environment is homogeneous. Homogeneity is relatively uncommon in the environment and the analysis of data resulting from this study design should take spatial correlation into account (Manly 2001). For example, wind turbines are typically placed on the windiest sites available in a wind-resource area, such as ridge tops. Thus, moderating environmental conditions as a function of distance from the turbines may create subtle differences in the characteristics of the sites that could mask impacts.
Morrison et al. (2001) suggested improving observational studies by using several general approaches to study design that can increase precision without requiring increased replication. Their suggestions include:
-
Vary sampling effort (or apply treatments) within homogenous groups of experimental units (blocking).
-
Measure non-treatment factors (co-variates) and use analysis of covariance when analyzing the response to a treatment to consider the added influence of variables having a measurable influence on the dependent variable.
-
Refine experimental techniques, including greater sampling precision within experimental units (Cochran and Cox 1957; Cox 1958).
Mensurative studies involve making measurements of uncontrolled
events at one or more points in space or time with space and time being the only experimental variable or treatment (Morrison et al. 2001). Mensurative studies are most convincing when the impacts are large and it is difficult or impossible to attribute the impact to some other cause. Nevertheless, mensurative studies often are conducted because there is no alternative, and they give more information than no study at all (Manly 2001). A study of impact should not rely on a single response variable, but should use the strongest design possible and accumulate all available evidence in a weight-of-evidence approach (Anderson et al. 1999) when evaluating the existence and magnitude of an impact. Table C-1, taken from Anderson et al. (1999), provides a decision matrix for selecting the appropriate impact-study design.
Methods for Estimating Abundance
Estimating abundance of species at proposed and existing wind-energy sites can be important in assessing the ecological impacts of wind-energy facilities. This section reviews several methods that are appropriate for assessing fatalities and effects of habitat alterations on populations of bats and birds. Direct impacts are fatalities resulting from collisions with wind-turbine blades or turbine monopoles while animals are in flight. Direct impacts may alter sex and age ratios, densities of resident or migratory populations, and survivorship and reproductive success. Indirect impacts include animal, plant, or ecosystem responses to habitat alteration caused by wind-energy facilities; they may include altered foraging behavior, breeding activities, migratory patterns, and demographics. Anderson et al. (1999) provided a detailed discussion of methods and metrics for the study of impacts on birds caused by wind-energy development. While many of these methods and metrics were developed for birds, an improved summary for methods and metrics useful in the study of bats and nocturnally active birds is included in this appendix; a complementary document also is being developed by the National Wind Coordinating Committee (Kunz et al. in press b).
Abundance of some animals can be determined from a census or estimated using line-transect sampling, point-counts, quadrat sampling, and other techniques (Buckland et al. 2001, 2004; Manly 2001; Morrison et al. 2001). Abundance also can be estimated through indirect approaches such as mark-resight and capture-mark-recapture estimation (Skalski and Robson 1992; Amstrup et al. 2005), catch-per-unit-effort (Laake 1992), survival analysis (Riggs and Pollock 1992), and change-in-ratio methods (Udevitz and Pollock 1992).
Censusing wildlife in designated areas or estimating absolute abundance is generally difficult, expensive, and time consuming. Impact-assessment
TABLE C-1 Study-Design Decision Matrix for Observational Studies
|
Design Options |
|
|
|
|
|
|
|
Potential |
|
|
Recommended |
Study |
Design |
|
Study Conditions |
Design |
Conditions |
Modification |
|
Pre-impact data possible |
BACI |
Matching of study sites on assessment and reference areas possible |
Matched pair, design with BACI |
|
Reference area indicated |
BACI |
||
|
Pre-impact data not possible |
Impact-reference |
Matching of study sites on assessment and reference areas possible |
Matched pair, design with impactreference |
|
Reference area indicated |
Impact-reference |
||
|
Pre-impact data possible |
Before-after |
|
|
|
Reference area not indicated Small homogenous area of potential impact |
|
|
|
|
Impact-gradienta |
|
|
|
|
Sampling Plan Options |
|
|
|
|
Sampling Plan |
Recommended Use |
|
|
|
Haphazard/judgment sampling |
Preliminary reconnaissance |
||
|
Probability-based sampling: |
|
|
|
|
Simple random sampling |
Homogenous area with respect to impact indicators and covariates |
||
|
Stratified random sampling |
Strata well defined and relatively permanent, and study of short duration |
||
|
Systematic sampling |
Heterogeneous area with respect to impact indicators and covariates, and study of long duration |
||
|
Parameters to Measure |
|
|
|
|
Parameter |
Empirical Description |
||
|
Abundance/relative use |
Use per unit area and/or per unit time as an indexb |
||
|
Mortality |
Carcasses per unit area and/or per unit time |
||
|
Reproduction |
Young per breeding pair of adults |
||
|
Habitat use |
Use as a function of availability |
||
|
Covariates |
Vegetation, topography, structure, distance, species, weather, season, etc. |
||
|
aImpact-gradient design can be used in conjunction with BACI, impact reference, and before-after designs. bCan be summarized by activity/behavior for evaluation of risk. SOURCE: Anderson et al. 1999. Reprinted with permission; copyright 1999, National Wind Coordinating Committee. |
|||
studies often estimate animal use as a surrogate for abundance. Animal use can be estimated by a variety of methods such as counting the animals detected from a given set of observation points, the amount of time spent by individual animals within a survey plot, the number of animals seen moving past a particular point, the number of targets passing through a radar beam, the number of targets within altitude bands, the number of nests present in a given area, the number of animals trapped or netted, the number of calls detected, or the amount of sign (e.g., tracks or scat) recorded within sample plots. Counts are expressed as the number of observations per unit area, per unit time, or both. Estimates of use allow comparisons among defined time periods and areas (Anderson et al. 1999; Hayes and Loeb 2007; Kunz et al. in press a). Comparison of indices such as animal use among studies or sites requires that indices be estimated using similar protocols.
Estimates of use also can assist in the interpretation of fatality data. For example, if two wind-energy facilities are being compared based on fatalities alone, the facility with the greater number of fatalities might be considered to have the greater impact. However, if the facility with more fatalities also has much greater use by the species being killed, then the greater use must be taken into account in any comparison. For example, at a minimum, estimation of use should include the intensity of activity, flight paths, flight heights, and the behavior of the animals of interest.
Monitoring productivity and survivorship may be an alternative to the direct estimation of fatalities and abundance when looking at the cumulative effects of wind-energy development on wildlife populations. The Monitoring Avian Productivity and Survivorship (MAPS) program was designed to accurately assess changes in bird productivity and survivorship in response to environmental changes (DeSante et al. 2001). The MAPS program provides annual and regional indices of post-fledging productivity from the number and proportion of young birds captured, annual and regional estimates of adult survivorship, recruitment in the adult population, and adult population size from capture-recapture data on adult birds. At the local level, Hunt (2002) used radiotelemetry data on golden eagles in the Altamont Pass Wind Resources Area (APWRA) to estimate the population’s annual growth rate, which was used to evaluate the effect of wind-energy production on fatalities.
This type of study often can provide more information about the mechanisms of impact than simply evaluating fatalities. For example, while Hunt (2002) concluded that the population of golden eagles had characteristics of a growing population, the confidence intervals around the point estimate of positive growth rate included zero, thus making it impossible to verify whether the population was growing or declining. Hunt (2002) concluded that golden eagle territories were consistently occupied and a sufficient number of non-territorial (floater) eagles existed to re-populate
vacant territories, suggesting a relatively healthy population. Nevertheless, the relatively high fatalities attributable to the wind-energy facilities resulted in a population without sufficient floaters to ensure stability, making the population susceptible to future declines should fatalities increase for any reason. It also was clear from Hunt’s study that the targeted group of eagles was part of a larger population. Thus, the APWRA may represent a mortality sink for the regional population of golden eagles. Certainly, at the current level of eagle fatalities in the APWRA (Smallwood and Thelander 2004, 2005), the viability of the eagle population depends on adequate immigration from surrounding areas.
The detection, identification, and counting of diurnally active organisms in the lower atmosphere is rather straightforward, despite the lack of standard protocols for making daytime observations at planned or existing wind-energy facilities. The situation at night is more difficult. Several methods for detecting, identifying, and counting birds, bats, and insects in the atmosphere at night have been developed (Hayes and Loeb 2007; Kunz et al. in press a). Table C-2 (modified from Larkin 2005a) provides a summary of current technology with respect to the detection range of the equipment, the ability to identify the type of animal, the ability to provide information on passage rates or density estimates, measurement of the altitude of a target, and cost of the equipment.
When confirmation of the age, sex, and reproductive condition of a species in an area of interest is desirable (as may often be the case during pre-siting and pre-construction surveys), capture is required. Information on species identity, sex, age, and reproductive condition can also be assessed from bats and birds killed by wind turbines. Remote sensing (e.g., radar) can provide information needed to assess risks to bats and birds at larger spatial and temporal scales.
In many cases, using a combination of approaches will be of value as no single method can be used for unambiguously assessing natural populations or the effects of wind turbines on biotic communities. Each approach has its own strengths, limitations, and biases. Investigators should understand the limitations, applicability, and operational considerations of each method before deploying them in the field. Local field guides and taxonomic keys for species identification are essential tools for investigators if they wish to identify the species composition at each locality and the identity of animals that are captured or killed. Use of mitochondrial- and nuclear-DNA sequence data that can be derived by extractions from feathers, hair, and skin of carcasses killed by wind turbines offers the potential for estimating population size of birds and bats (e.g., Waits 2004; Kunz et al. in press a; N.B. Simmons, American Museum of Natural History, personal communication 2006). Moreover, similar DNA-sequence data may be needed to verify the identity of some closely related or cryptic species (e.g., Myotis species). In
TABLE C-2 Remote-Sensing Tools for Detecting, Tracking, and Quantifying Flying Birds, Bats, and Insects
|
Equipment |
|
Range Identificationa |
|
Small marine radar |
30 m-6 km with proper siting of unit |
+ Bird bats vs. insects – Birds vs. bats straight flight: unknown |
|
Large Doppler surveillance radar (NWS) |
10-200 km |
+ Can discriminate targets by speed if winds are known + Waterfowl & raptors vs. other birds & bats + Insects slower than songbirds |
|
Thermal infrared |
Depends on equipment and cost: $75,000 US unit can detect birds at 3 km |
Size but not species + Discriminates birds, insects and foraging bats – Migrating birds & bats |
|
Image intensifier |
Good equipment: small birds at 400 m cheap equipment: shorter range |
– Cheap equipment: poor + Good equipment: better + Discriminate birds, bats vs. insects nearby |
|
Ceilometer-spotlight |
< 400 m – |
Poor for small targets – Insects can sometimes be confused with birds & bats |
|
Moon watching |
Observer-dependent |
+ Skilled observers can identify many types of birds and discriminate birds from bats + Insect contamination rare, butterflies & moths can be identified |
|
Radio tracking |
0-2 km |
Perfect |
|
Audio microphones for birds |
400 m, depends on ambient noise |
+ Some nocturnal songbird species + Data include no insects |
|
Ultrasound microphones for bats |
< 30 m, depends on humidity |
-? Bats may or may not emit sounds + If they do, may be species-specific |
|
a+ indicates capability; – indicates a lack of capability SOURCE: Modified from Larkin 2005a. Modified table reprinted with permission; copyright 2005, Wildlife Society. |
||
addition, voucher specimens of killed animals should be collected and deposited in recognized museum collections for future reference.
An overview of how different equipment and approaches are being used in studies associated with proposed and existing wind-energy facili-
|
Passage Rates |
Height Information |
Cost |
|
Good to excellent |
Unmodified marine radar antenna in vertical surveillance: yes Parabolic antenna: yes |
Specialized, expensive if done correctly |
|
Good in the infrequent cases where a radar siting happens to be opportune |
Very coarse with poor low altitude coverage |
Data are cheap; skilled labor for analysis |
|
Excellent when altitude of target is known |
Coarse when calibrated with vertically pointing radar and then used alone |
Expensive if high-quality equipment used |
|
Yes |
Same as last |
Rather expensive if highquality equipment used |
|
Yes but light may affect flying animals |
Same as last |
Inexpensive but labor-intensive |
|
2 days before and 2 days after full moon and with no cloud cover |
Very crude |
A good telescope of at least 20× is required; labor-intensive |
|
Poor |
Crude |
High |
|
Only some species call and quantification is assumption-ridden |
Microphones: Single: no Arrays: possible |
Recording equipment inexpensive, analysis expensive |
|
No, only presence/absence; too many unknowns at present state of knowledge |
Some; depends on microphones and placement |
Moderate costs |
ties, including both remote sensing (including passive acoustic recording, ultrasonic bat detectors, radar, moon-watching, ceilometer, reflectance infrared imaging, thermal infrared imaging, and radiotelemetry) and capture approaches are presented later in this appendix.
Estimating Abundance Using Molecular Markers
Estimates of population size, population structure, genetic diversity, and effective population size are important parameters for assessing life histories of natural populations and for managing endangered and threatened species at risk (Dinsmore and Johnson 2005; Lancia et al. 2005). Estimates of these parameters for both resident and migrating birds and bats are needed to better understand how populations are likely to respond to naturally occurring perturbations and to anthropogenic factors such as global climate change, deforestation, and habitat alteration. Wind-energy development, along with other anthropogenic factors, may have adverse effects on some animal populations by directly causing fatalities and indirectly altering critical nesting, roosting, and foraging habitats. To adequately assess whether fatalities or altered habitats are of biological significance to resident and migrating birds and bats, knowledge of baseline population levels, population structure, and genetic diversity is needed. These parameters can be expected to differ among species, which will be subject to different risks from local and regional environmental factors. For example, species represented by large populations, large genetic diversity, and little spatial breeding structure are likely to be less affected by anthropogenic factors than species represented by small populations, low genetic diversity, and strong spatial breeding structure (Avise 1992, 2004).
Rare and elusive species may be at greatest risk from anthropogenic changes (Thompson et al. 1998). An important challenge for population ecologists has been applying traditional census methods to rare and elusive species (Thompson et al. 1998). For example, for bats, few statistically defensible estimates of population size have been published—and this is especially the case for migratory tree-roosting species (O’Shea and Bogan 2003; O’Shea et al. 2003, 2004). Historically, population estimates of birds and bats have been derived using a variety of methods, including direct counts, point counts, and other estimating procedures such as capture-mark-recapture methods, photographic sampling, probability sampling, maximum likelihood models, and Bayesian methods (Bibby et al. 2000; Braun 2005; Kunz et al. in press a). Direct counts often are not practical, especially for nocturnally active bird and bat species, in part because these animals typically are small, cryptic, or otherwise difficult to census visually using most existing methods, either during daily or nightly emergences from roosts, or during migratory or foraging flights. Relatively recent approaches have been developed to use capture-mark-recapture models where some or all of the assumptions are relaxed; however, these approaches also have limitations in that a proportion of the originally marked individuals must be recaptured. More recently, capture-mark-recapture models have been used to estimate population sizes derived using non-invasive genetic sampling (Waits 2004).
For example, using this approach, Puechmaille and Petit (2007) compared estimates of colony sizes of the lesser horseshoe bat (Rhinolophus hipposideros) using DNA extracted from feces with independent estimates based on visual counts conducted during nightly emergence flights. Their results indicate that analysis of DNA extracted from feces can provide accurate estimates of colony size.
Large populations accumulate more genetic diversity and retain this diversity longer than do small populations. At the DNA level, these processes have predictable effects on both levels of genetic diversity and how this diversity is distributed among individuals within populations. Because these effects are predictable, it is possible to estimate long-term effective population size based solely on observed patterns of DNA diversity. If a population changes in size, predictable effects on patterns of diversity occur, and these effects are proportional to that change. Thus, significant declines in population size through time can be documented, although there is some time lag between changes in population size and observable effects on genetic diversity. A conceptual description of the “coalescent” process that results in these effects is provided below. Those interested in more detailed descriptions and applications are referred to Roman and Palumbi (2003), Avise (2004), Russell et al. (2005), and references cited therein.
The variation at any particular gene in a population can be illustrated as a topology (“gene tree”) reflecting the historical relationships or genealogy of the gene copies found in different individuals. The number of mutations (i.e., nucleotide substitutions) separating these variable DNA sequences is a function of the demographic history of the population. Because mutations accumulate through time, sequences that diverged longer ago will be separated by a larger number of mutations than those that diverged more recently. If a historically large population remains large, its gene trees will have many “branches” of varying lengths that reflect the accumulation and retention of older and younger mutations. If a large population is reduced in size, its gene tree will be “pruned.” That is, genes reflecting both long and short branches will be lost, with the result of less overall diversity. Short branches also will be proportionately fewer in the reduced population because fewer mutations occur, and older ones are less likely to be retained simply because of the smaller population size. Correspondingly, if a population that was historically small expands in size, its gene tree will consist mostly of short branches reflecting the increased occurrence and retention of more recent mutations.
Estimates of population size based on gene diversity have been applied to a variety of animals to investigate patterns of change caused by climatic change or human intervention. For example, the historical population sizes of humpback and fin whales prior to hunting by humans were estimated at approximately 240,000 and 360,000 whales, respectively, contrasted to
modern population sizes of 10,000 and 56,000 individuals (Roman and Palumbi 2003). The historical estimate of the effective population size of grey wolves prior to human settlement of North America was approximately 5,000,000, as compared to the current estimate of 173,000 (Vilà et al. 1999). The critically endangered Morro Bay kangaroo rat apparently never had an effective population size greater than about 13,000 (Matocq and Villablanca 2001). For bats, coalescent analysis indicates an expansion of migratory populations of Brazilian free-tailed approximately 3,000 years ago, a date that corresponds with the development of a wetter climate and increased insect availability (Russell et al. 2005; Russell and McCracken 2006). This was apparently followed by an approximately 16-fold decline in estimated population size in more recent times (Russell et al. 2005; Russell and McCracken 2006), perhaps as a consequence of human activity.
For the lesser long-nosed bat (Leptonycteris curasoae yerbabuenae), the most recent current estimate of effective population size was 159,000 individuals (Wilkinson and Fleming 1996), although no estimate of historical effective population sizes is available for comparison. These and other estimates of effective population size reflect the current distributional range of a given species. However, data from censuses of local populations also need to be considered when evaluating impacts of anthropogenic factors. For example, current colony sizes of the Brazilian free-tailed bats, determined using thermal infrared-imaging and computer-vision technologies (approximately 400,000), are important biological units that deserve special attention (Frank et al. 2003) apart from estimates of effective population size.
Migratory tree-roosting bats are especially challenging to census, largely because they are solitary and roost in foliage (eastern red bats, western red bats, and hoary bats) or tree cavities (silver-haired bats). Instead of using traditional marking methods, molecular markers could be used to estimate population sizes after identifying individuals from the DNA obtained non-invasively from samples of feces, hair, or skin tissue. As with traditional methods, the reliability of population estimates based on molecular methods depends on certain assumptions. For example, population size can be under- or overestimated if scoring errors are made when the alleles of heterozygous individuals are not amplified during a positive polymerase chain reaction (PCR), or PCR-generated alleles create a slippage artifact during the first cycles of the reaction (Waits and Leberg 2000). Errors of this type can be corrected by repeating the process of genotyping and comparing genotypes to each other (Paetkau 2003).
It is important to understand the extent of population-level structuring, because it may differ markedly among species. For example, population-genetic studies on Brazilian free-tailed bats show high genetic diversity and little population structuring (Russell and McCracken 2006), whereas other species, such as the lesser long-nosed bat, show relatively low genetic
diversity and high population structuring. The implications of these and other studies using molecular markers (Avise 1992, 2004) are that different species are subject to different risks from anthropogenic influences, and should be studied to assess whether a given species is more or less at risk from changing environments. Sex ratios, effective population size, and genetic diversity are intimately related. Changes in sex ratios in populations cause changes in effective population size, and when effective population size decreases, populations tend to lose genetic diversity.
Researchers charged with collecting samples of dead and moribund bats at wind-energy facilities can provide valuable data for advancing knowledge about local and migratory populations by recording the date, location, species, sex, age, reproductive condition, and standard external measurements for each individual recovered.
Collecting hair samples from bats and feathers from birds also is useful for analysis of the geographic origin of migrants and residents based on stable-isotope analysis. Ideally, data for stable-isotope analyses should be collected for all species found at each location. When necessary, representative specimens—and especially unidentifiable carcasses—should be collected in their entirety and deposited as voucher specimens with active scientists associated with natural-history museums. Data derived from feathers of birds and hair and wing biopsies from bats killed by wind turbines also offers the potential for identifying closely related or cryptic species (e.g., Myotis species). Collaborations with researchers affiliated with natural-history museums and other research laboratories equipped for genetic and stable isotope analysis are important. In the United States, the American Museum of Natural History, New York, serves as a repository for all carcasses and tissues collected from dead bats and birds collected from beneath wind turbines, and the Conservation Genetics Research Center at the University of California at Los Angeles serves as a repository for feather samples for genetic analysis.
Types of Studies: Strengths and Limitations of Different Approaches
Pre-siting Studies
Wind-energy developers spend much time and effort evaluating potential sites prior to investing in developing a particular site (macro-siting). Once a site is selected for development, evaluations are made in an effort to plan how best to develop the site (micro-siting) to optimize electricity production (Anderson et al. 2002). Macro- and micro-siting decisions are extremely important in minimizing the potential impacts of wind-energy facilities on wildlife and other natural resources.
Pre-siting studies will provide more information if they evaluate likely
impacts relative to other potentially developable sites, as well as evaluating impacts from an absolute perspective. Studies to address this question are usually short-term and do not qualify as either monitoring or research. They may vary from relatively simple reconnaissance surveys for species and habitat presence or absence to more sophisticated baseline studies and impact and risk assessments.
The elements of a reconnaissance survey for the purpose of comparing sites should include determination of the wildlife species known to use the area based on existing data and literature, the possible presence of species of concern (e.g., federal and state protected species), the presence of habitat that potentially supports species of concern, unique habitat features (e.g., old-growth forest, raptor-nesting sites), and wildlife concerns important to state and federal management agencies. A survey of existing information on wildlife in the area being considered for possible development, one or more seasonally appropriate site visits to examine habitat characteristics for potential occurrence of wildlife species of interest, and visits with knowledgeable agency professionals and local experts all provide valuable sources of information. Beyond the simple ranking of relative importance of each area to wildlife, pre-siting evaluation also should consider the potential for impacts to occur if a wind-energy facility is constructed on a particular site, and possible cumulative impacts, placed in the context of other sites being developed or proposed. The U.S. Fish and Wildlife Service (USFWS 2003) published Interim Voluntary Guidelines that recommend the development of a Potential Impact Index (PII). Although these guidelines still are under review, they describe the PII as a two-step process:
-
“Identify and evaluate reference sites within the general geographic area of Wind Resource Areas (WRA) being considered for development of a facility. Reference sites are areas where wind development would result in the maximum negative impact on wildlife, resulting in a high PII score. Reference sites are used to determine the comparative risks of developing other potential sites.
-
Evaluate potential development sites to determine risk to wildlife, and rank sites against each other using the highest-ranking reference site as a standard. While high-ranking sites are generally less desirable for wind development, a high rank does not necessarily preclude development of a site, nor does a low rank automatically eliminate the need to conduct predevelopment assessments of wildlife use and impact potential.”
The reference-area concept described for the PII emphasizes the value of a highly diverse site, such as a wetland or a woodland complex within a grassland community, or a mosaic of grasslands and forests, rather than comparing similar areas. This approach places a relatively high value on
species diversity and does not consider whether the species present are at high risk from impact. For example, the approach increases the possibility that areas with a single important species, such as a grassland area with relatively low species diversity but important habitat for a species at risk or of special concern, might actually appear to be a good site for wind-energy development when compared to an area with higher species diversity. Furthermore, the definition of the reference area by the person developing the PII score is highly subjective.
An alternative paradigm for selecting reference areas is to identify those that are similar to the one being proposed for development. If the objective is to predict potential impacts, the reference area or areas should be in similar habitats with comparable wildlife communities where wind-energy facilities already exist. If the objective is to combine pre-development assessments with post-development surveys to estimate possible project impact, then a reference area without a wind-energy facility and similar to the area proposed for development should be chosen for comparison.
Potential impacts resulting from perturbations are often evaluated using a general framework called “Ecological Risk Assessment” (ERA), defined by the U.S. Environmental Protection Agency (EPA 1992) as a “process that evaluates the likelihood that adverse ecological effects may occur or are occurring as a result of exposure to one or more stressors.” The primary difference between impact prediction and an ERA is in the estimation of some likelihood (or probability) of an impact occurring in an ERA, rather than an estimation of the actual impact.
The most difficult aspect of either impact or risk assessment is determination of exposure, i.e., an estimate of the number of individuals that are exposed to collisions with turbines. Young et al. (2004) estimated the number of potential bird fatalities that would occur at the proposed Mount Storm Wind Power Project in Grant County, West Virginia. They calculated the potential fatalities using estimates of nocturnal bird-passage rates obtained from X-band marine radar surveys and the dimensions of the proposed wind-energy facility at the Mount Storm site, and estimates of bird fatalities at the nearby Mountaineer wind-energy facility (Kerns and Kerlinger 2004). Rather than estimate the number of fatalities at a site, the ERA approach estimates the probability that an individual bird or bat would be killed. The appeal of the ERA paradigm is that it provides a structure for focusing scientific principles and critical thinking toward the goal of effective environmental management, and integrating the views of diverse stakeholders (EPA 1992). ERA is used by a variety of regulatory agencies, scientists, and industries for environmental decisions (e.g., NRC 1994, 2004; Suter et al. 2000; Efroymson and Suter 2001).
Collecting sufficient data to estimate exposure to wind turbines is problematic for nocturnal migrating passerines and resident and migrating
bats. Tucker (1996) and Podolsky (2003) modeled risk of bird collisions with a wind turbine, based on the characteristics of the turbines (e.g., rotor rpm) and the birds (e.g., flight speeds). However, these models do not incorporate behavior (e.g., avoidance or attraction), an important factor in risk assessment, and are of questionable value in estimating actual fatality rates (Chamberlain et al. 2006). More-sophisticated risk models that include turbine and wind-energy-facility characteristics, the environment (e.g., wind, weather), and some surrogate for bird and bat behavior (e.g., flight heights, species presence or absence) are necessary. As with all models, theoretical estimates must be compared to more-deterministic models that are based on empirical data on bird and bat use and fatality rates.
Pre-construction Studies
Pre-construction studies might evaluate a proposed site or sites for potential impacts of developing wind energy, evaluate a selected site to determine the least environmentally damaging development plan, and predict impacts or risk associated with the development of a particular site for wind energy. Both impact and risk assessments are possible with empirical data on exposure and impact, if certain assumptions are made. In addition, either assessment can be used in a comparison of two or more sites. Both approaches for characterizing a site would be improved with additional empirical data on exposure (i.e., abundance of animals at risk of collision) and response (e.g., fatalities, injuries, displacement) from similar sites. Frequently, in impact- and risk-assessment studies, an index of abundance is used, rather than an estimate of absolute abundance. When indices of abundance are used to compare multiple sites, it is essential that the indices be estimated using similar methods and metrics across sites.
Siting a wind-energy facility and individual turbines within a wind-resource area to minimize impacts to wildlife requires knowledge of species presence, relative abundance, behavior, and habitat. Anderson et al. (1999) suggested that pre-permitting studies that result in the collection of empirical data are useful in the following situations:
-
A site for a wind-energy facility is selected but the distribution of turbines and turbine strings has not been determined and turbine siting could be influenced by information on potential risk to bird species.
-
The decision to construct a wind-energy facility has been made, but development will proceed in phases based on assessment of impacts of construction and operation of the initial phase (i.e., adaptive management).
-
Other studies or credible information on bird use and habitat suggest that impacts are likely.
The importance of micro-siting studies is important for a variety of species, and is illustrated by several bird studies at existing wind-energy facilities. Orloff and Flannery (1992) concluded that raptor fatalities at the APWRA were higher for turbine strings near canyons and at turbines that were at the ends of rows. Smallwood and Thelander (2004, 2005) concluded that fatalities were related to turbine-site characteristics and the position of turbines within a turbine string. The implication of both studies is that turbine-siting decisions during the construction of a wind-energy facility could be important. Pre-construction studies identified areas of high raptor use at the Foote Creek Rim site in Wyoming, a flat-topped mesa with a very distinct rim edge. Approximately 85% of the estimated use of this site by raptors occurred within 50 m of the edge of the rim. These high-use areas were avoided by the wind-energy developer when turbines were sited. Anecdotally, the BLM (1995) considered the abundance of golden eagles at the Foote Creek Rim area prior to construction to be similar to that at the APWRA in California. Based on the assumption of similar densities, the BLM predicted fatality rates for the Foote Creek area similar to the APWRA, or approximately two golden eagle fatalities per year (BLM 1995). However, over a three-year period, 133 turbines were searched for fatalities, for a total of 202 turbine search years, resulting in the finding of only one dead golden eagle (Young et al. 2003c). Micro-siting of turbines may partially explain why fatalities of golden eagles were lower than predicted at Foote Creek Rim.
Species presence, relative abundance, behavior, and habitat use are determined through sample surveys (Kempthorne 1966), also referred to as observational studies (NRC 1985). The objective of these studies at proposed wind-energy facilities is usually an estimate of parameters necessary to describe the group of animals occurring on the proposed site, such as density and habitat use.
Because these studies are restricted to a single site, their strict statistical inference is restricted to the study site and the protocol used for collecting data, although these studies can provide some valuable insights applicable to other areas. Nonetheless, design principles for best practices, such as randomization of sample-collection locations, replication of sampling, and the use of measures to control or reduce experimental errors are essential to ensure rigorous results (Cox 1958; Cochran 1977; Anderson et al. 1999; Manly 2001). For these types of studies, precision can be increased by refinement of the experimental techniques, including greater sampling precision within experimental units; and improved experimental design, including stratification and measurements of non-treatment factors (covariates) that can potentially influence the outcome of the survey (Cox 1958; Cochran 1977).
Post-construction Studies
Post-construction studies should focus on determination of impacts and evaluation of actual risk versus predicted risk, evaluation of causal mechanisms of impact, evaluation of mitigation and reclamation measures, and evaluation of the ecological or biological significance of the impacts. A relatively small number of post-construction studies of wind-energy facilities have been conducted. With a few exceptions, post-construction studies at new wind-energy facilities have estimated use and fatalities of birds and bats, or fatalities alone (Erickson et al. 2001, 2003a,b, 2004; Howe et al. 2002; Johnson et al. 2002, 2003a,b; Nicholson 2003; Young et al. 2003a, 2005; Kerns and Kerlinger 2004; Koford et al. 2004; Arnett 2005; Arnett et al. in press; Paul Kerlinger, Curry and Kerlinger, LLC, personal communication 2002). Studies estimating raptor use and bird fatalities have also occurred at older wind-energy facilities in California (McCrary et al. 1986; Orloff and Flannery 1992; Howell 1997; Thelander and Rugge 2000; Anderson et al. 2004, 2005; Smallwood and Thelander 2004), primarily focused on raptors. Hunt (2002) conducted a demographic study of the golden eagle population at the APWRA and evaluated its viability in the face of fatalities, primarily from collisions with wind turbines. Responses to wind-energy facilities also have been evaluated for elk (Walter et al. 2004), pronghorns (Johnson et al. 2000a), and grassland birds (Leddy et al. 1999; Johnson et al. 2000b; Erickson et al. 2004).
The approach to estimating fatalities depends on the study objectives (Larkin et al. unpublished material 20071). Fatalities may be estimated so that comparisons can be made to other facilities. For this objective, similar protocols would be important. Alternatively, it may be important to determine the circumstances associated with each fatality (e.g., weather conditions) and thus more-frequent searches would be required (Larkin et al. unpublished material 2007). Frequently, the objective of the study is to estimate the absolute number of fatalities with acceptable precision. In such cases, the protocol should minimize measurement error. The basic components of a fatality-monitoring study are carcass searches of study plots, trials to estimate how effectively searchers detect carcasses, and trials to estimate how quickly scavengers remove carcasses. Potential biases associated with fatality-monitoring studies include use of inappropriate surrogates for bat and bird carcasses, inadequate effort in terms of search interval and search intensity, poorly sized search plots, lack of spatial and temporal replication, and lack of an estimate of background fatalities.
The estimation procedure for fatalities is important and one approach is described later in this appendix.
Post-construction surveys at wind-energy facilities in the United States have provided relatively little information on the extent of bat fatalities. To date, only 6 of 13 fatality-monitoring efforts have explicitly included bats in their protocols. These efforts vary significantly in landscape conditions, sampling intervals and periods, search methods, and sampling protocols. Potential sources of bias include sample frequency, removal of carcasses by scavengers, and search efficiencies. Sampling intervals in these studies have been relatively infrequent (e.g., 7-30 days), and even fewer studies have been designed to assess expected bias resulting from the removal of carcasses by scavengers. In fact, only five surveys used bat carcasses to correct for observer bias (Arnett 2005). Most studies designed to estimate bat fatalities used small bird carcasses as surrogates of bats to assess searcher efficiency and scavenger removal, largely because dead birds were available (Erickson et al. 2002). In one study, frozen bird carcasses were removed at significantly lower rates than frozen and fresh bat carcasses (Kerns and Kerlinger 2004). Other surveys only covered part of the expected autumn migration period and failed to include the period of summer residency (Kunz et al. 2007). None of the studies have successfully estimated bat abundance at the wind-energy facilities. As a result, estimating risk to individual bats is not possible at present.
To fully interpret bird and bat fatalities it is essential that the number of individuals exposed to collision with turbines be known. To understand the implications of the fatalities it also is important to relate the fatalities to the demographics of the affected populations.
Evaluation of Causal Mechanisms of Impact
Studies to elucidate the causal mechanisms of impact are typically conducted in an effort to identify possible mitigation measures (Kunz et al. 2007). Impact-reduction studies can vary from relatively simple observational studies, such as bat observations using thermal infrared imaging (Horn and Arnett 2005; Horn et al. in press) and bird- and bat-fatality studies (Arnett 2005; Johnson 2005; Arnett et al. in press), to more-complex experiments, such as the work by Hodos (2003), who evaluated bird visual acuity related to potential color schemes for turbine blades.
When studies are designed properly, the ultimate determination of statistical power is sample size. Replication to increase precision can be expensive. Manly (2001) and Morrison et al. (2001) provide a good general discussion of design and analysis when conducting observational and quasiexperimental studies. The study designs discussed above for impact assessment are also the preferred designs for quasi-experiments. Anderson et al.
(1999) suggested modifying the BACI design by applying the treatment and control in the first year to the selected subset of turbines and switching the treatment and control turbines the second year, sometimes referred to as a crossover experiment.
Most statistical texts provide a description of how to design and analyze classical experiments (e.g., Underwood 1997). Krebs (1989) notes that “every manipulative ecological field experiment must have a contemporaneous control…, randomize where possible…, and, because of the need for replication, utilize at least two controls and two experimental areas or units.” While classical experiments have limited statistical inference and are practically impossible when studying wind-energy developments, several quasi-experiments have been conducted at wind-energy facilities (e.g., Leddy et al. 1999; Johnson et al. 2000b; Young et al. 2003b). While quasi-experiments improve the confidence in the causal mechanism, the determination of the causal mechanism still requires professional judgment, illustrating the need for a weight-of-evidence approach when investigating the impacts of wind-energy development.
Spatial Component of Impacts
Assessments of impacts of wind-energy facilities typically focus on bird and bat fatalities. Direct habitat loss often is considered relatively minor for wind-energy facilities and is restricted to roads, turbine pads, and construction areas. Habitat loss also is relatively easy to measure using aerial photography, satellite imagery, and GIS. Until recently, impacts on bird habitat were considered the primary impact of wind-energy facilities in Europe (Winkelman 1985, 1990, 1992a,b, 1995). However, impacts on bats also are being documented (UNEP/EUROBATS 2006). Displacement is the greatest concern for most wildlife species and is very difficult to quantify. The cumulative impacts of habitat loss and displacement caused by turbines, roads, and other construction in an area can potentially lead to landscape fragmentation and loss of suitable habitat for wildlife.
Habitat use may be measured by direct observation (e.g., Young et al. 2003b) or with radiotelemetry (Hunt 2002). Habitat use is most meaningful when it is considered in relation to habitat availability. Manly et al. (1993) provided a unified statistical theory for the analysis of use versus availability (resource-selection statistics). The theory and application of resource-selection studies were updated by Manly et al. (2002). Sawyer et al. (2006) used resource-selection study design and analysis to estimate the displacement effect of a gas-field development on mule deer in western Wyoming. This method has considerable potential for addressing concerns regarding displacement and habitat fragmentation associated with wind-
energy development (e.g., prairie grouse and large mammals, including black bear).
Impacts and Actual Risk Versus Predicted Risk
Risk is the likelihood (probability) that “adverse ecological effects may occur or are occurring as a result of exposure to one or more stressors” (EPA 1992; Weed 2007). A simple model of risk requires the following (Kaplan and Garrick 1981):
-
An existing or planned action leading to the potential of an adverse environmental outcome;
-
A qualitative or quantitative statement about the probability of the adverse outcome occurring; and
-
A statement about the consequences or advisability of the action.
Pre-siting studies of wind-energy facilities typically incorporate (1) and (3) to estimate potential impacts, but not in the form of a probability statement as in (2) above. Recently, a more-formal risk assessment was attempted at the Chautauqua Wind Power site in Chautauqua County, New York (Chautauqua Windpower, LLC et al. 2004). Impact and risk predictions should be evaluated to allow improved decision making, reduction of adverse ecological effects at existing facilities, and evaluation of the effectiveness of mitigation measures. Predictions of impact and risk require both an estimate of exposure, or the number of organisms that have the potential to suffer impacts, and an estimate of the adverse consequences. In the case of wind-energy production, those adverse consequences for wildlife include mortality, displacement, and habitat loss, and the resulting effect on survival and reproduction. Use of DNA markers for estimating demographic parameters and effective population size of birds and bats promises to provide past and current abundance at local, regional, and continental scales.
Post-construction studies designed to detect impacts and to evaluate pre-project predictions of risk can generally be considered impact-assessment studies as described by Manly (2001). The studies typically are not true experiments, but instead are observational or “mensurative” studies designed to make sure that the data are properly collected to address research questions and hypotheses and to make them amenable to statistical analyses (Anderson et al. 1999; NRC 1994). Additionally, mathematical and statistical models can be important in assessing the significance of estimated impacts. It is common for design/data-based and model-based studies to be conducted in tandem, resulting in inferences based on a number of interrelated arguments. Hunt (2002) illustrates this approach where radiotelemetry data on golden eagle abundance and survival were used to
construct a demographic model of the group of birds using the APWRA in an effort to evaluate the significance of estimated eagle fatalities.
Mensurative studies have limited statistical inference because they are not true experiments, and thus must include randomization, replication, and controls (Manly 2001). Most mensurative studies of wildlife lack one or more of these conditions and are referred to as quasi-experiments (Manly 2001). Nonetheless, mensurative studies are essentially the only approach available for impact assessment.
Wind-energy facilities are not scattered randomly over the landscape. They are not even constructed at random within all of the known windy locations. Thus, extrapolation of study results from one site to another is strictly subjective (Gilbert 1987), although confidence can improve in these subjective extrapolations if the studies are conducted using similar methods and metrics in areas with similar ecological conditions.
Social and medical sciences often use meta-analysis (Hedges and Olkin 1985; Hedges 1986) as a statistical approach for analyzing results from several independent studies that are all concerned with the same issue. The purpose of meta-analysis is to provide researchers with a statistical tool to summarize, synthesize, and evaluate independent research studies in order to reach general conclusions (Adams et al. 1997). The troublesome aspect of meta-analysis is that combining different studies requires assumptions about a variety of potentially important issues such as publication bias (the tendency of journals to favor publication of studies with statistically significant results), non-independence among studies, and the quality of studies (Adams et al. 1997). Given the necessary assumptions, a conservative approach to the use of meta-analysis in ecological studies may be prudent. Adams et al. (1997) suggested a non-parametric approach using re-sampling methods (Manly 1991) when combining individual studies that violate necessary assumptions of standard parametric statistics.
Mensurative studies have limitations even when the desire to extrapolate is limited to the specific area of study. For example, a study may indicate that bird fatalities are much higher in one part of a wind-energy facility and the assumption may be that there are specific conditions at that site that may contribute to the difference. Similarly, bird abundance may be declining in the area surrounding a wind-energy facility when compared to a reference area, presumably because the facility is there. However, conclusions on causation are based on assumptions and judgment (Manly 2001).
METHODS AND METRICS FOR BIRD AND BAT STUDIES
This section provides information on the methods for assessing both direct and indirect impacts of wind-energy facilities on bats and birds. The
general nature of impacts on birds and bats is similar to that discussed for wildlife earlier in this appendix.
The methods discussed below include observational, remote-sensing (including passive acoustic recording of bird calls, ultrasonic detection of bat calls, radar-imaging, moon-watching, ceilometry, night-vision observations, reflectance-infrared imaging, thermal-infrared imaging, radiotelemetry), and capture protocols.
Comprehensive accounts of every North American bird species are available through the Birds of North America project (Cornell Laboratory of Ornithology 2005). This type of information is also often available through regional field guides for birds and bats that usually provide overviews of what species are known to occur and when they can be expected to occur in an area. Site-specific information can sometimes be obtained from local naturalists, scientists, or published reports, but is rarely at high enough resolution to inform estimations of potential impacts at a specific site. By far the greatest factor of uncertainty, and thus the present limiting factor in any estimate of potential interaction between birds and bats and wind-energy facilities, is natural variation in animal behavior, such as migratory movements, sound production, foraging habits, and mating behavior. Although one could conclude that such variation is so great and so complicated as to make it impossible to enumerate precise numbers of any species at any time, one must be careful not to confuse different spatial and temporal scales of analysis. There are several available methods, both traditional and emerging, for detecting, recognizing, and estimating numbers of birds and bats at given localities. When such methods are integrated with a well-designed sampling strategy, they can allow effective evaluation of the presence and numbers of species present or moving through a particular area.
Methods for Detection, Identification, and Estimating Activity of Flying Animals at Night
Methods of detecting nocturnal flying animals are discussed in Chapter 3. What follows is an overview of the traditional and emerging methods and metrics for detecting, recognizing birds and bats, with particular attention to how they are being used in studies associated with planned and existing wind-energy facilities.
Passive Acoustic Detection of Birds and Bats
Birds, bats, and insects produce sounds for communicating, and a wide variety of bats produce high-pitched sounds in the ultrasonic frequency band (above the range of human hearing) for navigating and finding food.
Most of the sounds, especially from birds, are audible, and there is a long history of detecting and recognizing birds by listening for their species-specific calls and songs. Today, as a result of the intense and dedicated efforts of many amateurs and scientists, the songs of all North American birds and a significant number of their calls are documented and available (Old Bird, Inc. 2005; Macaulay Library 2006), and from Evans and O’Brien (2002). A subset of calls of particular importance in this report is produced by birds at night during migration. These calls are referred to as nocturnal flight calls. Discovery of bat echolocation signals emerged in the early 1960s with the advent of ultrasonic-detection devices (Griffin 2004). Validated libraries of calls for most North American bat species are available online (SonoBat 2005; Batcalls.org 2006).
Passive-acoustic detection can determine presence, not absence, of a species. Once a call is produced and available for detection, there is a secondary level of uncertainty related to the probability of detecting the call once it has been produced. Thus, the overall probability of acoustically detecting a night migrant is the product of the probability of the bird’s or bat’s producing a call and the probability of detecting that call once it has been produced. By far the greatest source of uncertainty is the calling behavior of individual animals. The rate of calling by birds varies considerably throughout the night and is influenced by a variety of factors such as topography, weather condition, time of night, and time of year. The specific relationships between all the factors and flight-calling behavior are not well understood.
The probability of detecting a call once it is produced depends on its strength, the conditions for sound transmission between the bird or bat and a receiving system (e.g., microphone or microphone array), the bird’s distance from the receiving system, and the detection capabilities of the receiving system. There is little information on strengths of sound produced by nocturnal migrants, although there are several valuable models for predicting sound transmission through the atmosphere (typically stated as transmission loss) (Larom et al. 1997; Larom 2002). Detection capabilities vary tremendously, depending on the use of baffles or horns, the quality of the microphone electronics, the application of multiple microphones, and the sophistication of the software analysis. Most passive-acoustic applications have been relatively simple and have not taken advantage of detection gains that can be achieved using microphone arrays combined with advanced signal-processing methods. There is a cost-benefit tradeoff between using a relatively simple method (e.g., for birds a single FET [field-effect transistor] microphone at the base of a flowerpot baffle) that can be installed at modest cost (less than $30 per site) and a more elaborate method (e.g., an array of 16 microphones coupled with mechanical horns) that can cost an order of
magnitude more; but the elaborate method has a 30 dB greater gain than the simple method and covers ten times the volume of sky.
Simple methods can provide a determination of species presence for known call types (or species-group presence for call types associated with a species group, for example thrushes), the time of occurrence of each call, the number of occurrences (counts), and estimates of passage rates (in calls per unit time). More complex methods offer additional benefits. For example, with a sparsely distributed array of at least four simple microphones, one can locate the position of a calling bird in 3D space (Fristrup and Dhondt 2001). D.K. Mellinger (Oregon State University, unpublished material) analyzed data on nocturnal flight calls and applied a Doppler algorithm to compute the velocity and direction of nocturnal migrants and to better estimate the number of calls per bird per unit time. The more microphones used in an array and the greater their spatial distribution, the greater the spatial coverage and altitudinal resolution. Estimates of location resolution (range and bearing error) as a function of microphone number and spacing are fairly straightforward. Thus, a metric relating system cost to level of analysis, as measured by spatial coverage and resolution, could be developed.
Recording and Analyzing Audible Bird Calls
More than 200 passerine birds are known to produce audible calls in flight during night migration (Ball 1952; Graber and Cochran 1959). These flight calls often can be used for identification of bird species, and most species produce them in the early morning hours after descending to the ground after migrating throughout the night (Evans and O’Brien 2002). By careful observations and recordings, experts also can visually identify different species while recording their flight calls. The calls of approximately 150 species in the United States have now been validated to either species (e.g., warblers) or a species complex (e.g., thrushes) (Evans 1994; Evans and Mellinger 1999; Evans and Rosenberg 1999; Evans and O’Brien 2002; Farnsworth 2005; Farnsworth and Lovette 2005). With the availability of these acoustic “type specimens,” the flight calls of most species of passerine birds can now be identified acoustically. For nocturnally migrating birds, the best available evidence suggests that the number of calls detected per unit time is highly variable and not a good predictor of passage rate (Howe et al. 2002; Farnsworth et al. 2004). Thus, acoustic monitoring is an excellent method for verifying the presence of birds that primarily migrate at night and produce species-specific flight calls, but not for estimating the relative numbers of species, individuals, or passage rates. It will require further research that carefully integrates and compares passive acoustics with other methods (e.g., radar, visual survey) to adequately define the benefits and limitations of acoustic monitoring.
The functions of flight calls are not well understood, but they usually are assumed to serve to maintain flock cohesion (Hamilton 1962) or maintain spacing (Graber 1968). Farnsworth and Lovette (2005) analyzed song and flight-call characteristics of 33 species of wood-warblers to test the hypotheses that the acoustic characteristics produced by these birds were predictable from body size or bill length, but found no statistically significant relationship. They concluded that body size and bill length have not been important factors in the evolution of flight calls, and suggest that different ecological and atmospheric properties, such as sound transmission, might be more important in the selection of these calls. If flight calls have been selected to be optimized for maximum communication range, given the physiological constraints of flight, this should influence the detection range of flight calls and thus be an important factor when designing an acoustic monitoring project. At present, there have been no thorough studies quantifying the strengths and transmission characteristics of flight calls.
Since the mid-1990s, a few studies have used various technologies to detect the occurrence of flight calls, identify migrating species, and record the number of calls per unit time (Evans and Mellinger 1999). Some of these studies have been associated with the development or monitoring of wind-energy facilities. Overall, the type of equipment used to record flight calls of birds and in the sampling strategies used has been highly variable. This lack of consistency makes it difficult to compare, evaluate, and combine the results of various studies to ascertain the effectiveness and efficiency of passive-acoustic monitoring of birds.
Recording and Analyzing Ultrasonic Bat Calls
Ultrasonic-recording devices were first developed to evaluate the structure of echolocation calls of bats that navigate and feed on insects in the laboratory (Griffin 1958; Griffin et al. 1960). These devices first became available on a limited basis for field use in the 1960s (Griffin 2004), but they were not really suitable for field studies. Griffin (1958) provided an early summary of what had been learned from the earliest recordings of echolocation calls in the laboratory (see also Griffin 2004). Enormous strides have been made in the development and use of ultrasonic detectors for recording echolocation calls of bats in both the laboratory and field (Barclay and Brigham 2004; Thomas et al. 2004), and the development of specialized software for analyzing these calls (Britzke 2004; Corben 2004; Jones et al. 2004; Limpens and McCracken 2004; Parsons and Obrist 2004; Swezicak 2004).
From the mid-1970s until the present, several types of bat detector have become available (Ahlén 2004; Limpens and McCracken 2004; Pettersson 2004). In the 1980s the development of several commercial products made it possible for these devices to be deployed for assessing general activity
levels, monitoring activity of bats in different habitats, and for educating the public (Fenton 2000, 2004). In the 1990s advances in circuit design, the sensitivity of microphones to ultrasound, and storage and analytical software made it possible to record and store the full range of call structures in the field, and in many situations identify bats to species (Corben 2004; Limpens and McCracken 2004; Pettersson 2004). For some species it may even be possible to discriminate sex and age (Siemers et al. 2005).
Types of Ultrasonic Bat Detectors
The ultrasonic calls of bats are transmitted through the air, captured by a special microphone in a bat detector, and transmitted as an audible sound or as a voltage signal to a built-in speaker, tape recorder, or computer. The most common types of bat detectors are known as heterodyning, frequency division, and time expansion—each based on unique circuitry and types of microphone. Each type of detector has its own advantages and disadvantages. Commercially available detectors may have one or sometimes two or three separate conversion systems (Pettersson 2004).
Heterodyning detectors are designed to detect a narrow range of frequencies, typically a bandwidth of about 10 kHz. A tuning control on the detector is used to center the frequency range for transformation, so that if the detector is set at 40 kHz, it will record frequencies between 35 and 45 kHz. Heterodyne detectors are highly sensitive to bat echolocation calls, making it possible to detect and record relatively weak signals. Echolocation calls of bats that are transformed in a heterodyne detector may sound or appear different depending on the frequency to which the detector is tuned. The narrow bandwidth of a heterodyne detector means that only bats producing sounds within that frequency range will be detected.
Frequency-division detectors transform the entire ultrasonic range of signals (e.g., broadband) to a fixed fraction of the original signal. For example, a given ultrasonic frequency may be transformed or reduced to some fixed fraction of the original frequency. Frequency-division detectors are less sensitive than heterodyne detectors, making it difficult to detect weak signals. However, the transformed signal of a frequency-division detector contains more information than a heterodyne detector. Nonetheless, with frequency-division detectors, the signal is first converted into a square wave, and thus amplitude information is lost. Moreover, if the original call is composed of a fundamental frequency and one or more harmonics, typically only the fundamental frequency will be transformed. Some of the more advanced frequency-division detectors also process amplitude information based on the fundamental frequency of the original signal. If the amplitude is retained, then pulse duration and other temporal parameters can be measured (Ahlén 2004; Pettersson 2004).
A time-expansion detector records the original high-frequency signals
and then plays back the original signal at a slower rate, while retaining virtually all of the original characteristics. Thus, the resulting signal is longer and the frequency will be lower than the original signal. With time-expansion detectors, the signal is digitized and a portion of it is stored in digital memory, from which it can be replayed at one-tenth the original speed. Thus, an important advantage of time-expansion signals is that the original signal is stretched out, making it possible to detect details of the call. Most time-expansion detectors also include a built-in heterodyne system (Ahlén 2004; Pettersson 2004).
One of the disadvantages of frequency-division detectors is their lack of sensitivity. By contrast, an important advantage of frequency-division detectors is their inherent stability, which makes them more robust for long-term field use than either heterodyne or time-expansion detectors. In general, the circuitry of heterodyne and time-expansion detectors is more complex, including critical timing elements that can affect the accuracy of the signal detected and recorded. Frequency-division detectors provide the most robust technology and are the most cost-effective for monitoring purposes and for characterizing bat echolocation calls in field conditions. One of the advantages of the time-expansion circuitry is that sounds can be recorded at high speed and played back at slower speeds for detailed analysis. Another advantage of time-expansion detectors is that the storage medium is digital and the recordings can be played back immediately. An obvious disadvantage of time-expansion method is that sounds are not recorded in real time. The greatest advantage of time-expansion systems is that the signals are stored in memory and can be played back for more in-depth analyses, including power spectra, spectrograms, pulse length, interpulse interval, etc. (Pettersson 2004).
A Case Study of Bats
In a recent investigation conducted at the proposed Maple Ridge Wind Project in upstate New York, Reynolds (2006) deployed a spatial array of frequency-division ultrasonic detectors (Anabat Model version 6.2) connected to a CF-SCAIM data-storage unit (Titley Electronics), each housed within a waterproof storage box with a 12 V deep-cycle battery. These detectors were used to sample 35 different sites each for a single night in the period from June 23 through July 5, 2004. Each detector was mounted on a 1.5-m pole, with the microphone pointing toward the ground to prevent the condensation of moisture on the microphone. Echolocation calls produced by the bats were reflected toward the microphone using a 10 × 10 cm Lexan plate positioned at 45 degrees from the horizontal (Reynolds 2006). The Anabat microphones that were used in this study have the potential to detect approaching bats at a distance up to 11.6 m, with a potential sampling cone of 2,542 m3 (Larson and Hayes 2000). Actual field tests reported
by Reynolds (2006), however, revealed that the microphones that he used could consistently detect ultrasonic signals up to 22 m distant. Nonetheless, this limited detection range makes it difficult to record calls made by bats in the rotor-swept area of industrial-scale wind turbines using single microphones. The application of beam-forming arrays of microphones would significantly increase detection range and provide monitoring within the swept area of turbines.
Spatial data were statistically analyzed by comparing the number of bat passes recorded during three four-hour periods each night. The results, although limited spatially and temporally, show that bats were most frequently recorded in the vicinity of ponds, with different temporal patterns of activity exhibited by the four “species” detected. Myotis species (most likely M. lucifugus and M. septentrionalis), which accounted for 95.7% of all recorded calls, were active throughout the night. By contrast, big brown bat and silver-haired bat calls (Eptesicus/Lasionycteris), which could not be distinguished, were recorded most frequently in the early hours of the night. Only 1% of the activity was represented by tree-roosting eastern red and hoary bats (Lasiurus borealis and L. cinereus).
To further assess possible migratory behavior, Reynolds (2006) used the same bat detectors for spatial analysis from April 10 to June 22, 2004, at two locations at the New York project site. Frequency-division bat detectors were deployed as two vertical arrays on meteorological towers at each of two sites, with one detector at each site positioned at “ground” level (ca. 7 m) and the others positioned at approximately 15 and 50 m above the ground. Analysis of data recorded from the vertical array of ultrasonic detectors revealed that significantly more activity was recorded at 50 m above the ground than at 15 and 7 m (Reynolds 2006). Moreover, the results support the hypothesis that migratory behavior of bats is episodic.
More calls from Eptesicus/Lasionycteris were recorded in middle to late spring, although there was no evident seasonal pattern in the calls recorded from Myotis during this limited period. From these data, Reynolds (2006) concluded that migratory activity was the highest on the warmest days with low wind speeds. The results are consistent with reports of fatality data at the Mountaineer Wind-Energy Center, Tucker County, West Virginia and Meyersdale Wind-Energy Center, Pennsylvania, where the highest fatalities occurred on warm nights with low wind speed (Arnett 2005). Data from Reynolds (2006) suggest that accurate estimates of migratory behavior will require long-term acoustic monitoring, using both horizontal and vertical arrays of ultrasonic bat detectors. The few recordings made of eastern red and hoary bats (species that have experienced the highest fatality rates at these sites) suggested to Reynolds (2006) that these bats were not common in the study region or, at least that they could not be detected from the deployment heights of the bat detectors. The absence of a call does not
imply absence of bats, only that the call may not have been detected. These observations are consistent with Gruver’s (2002) study in Wyoming, which reported that hoary bats experienced the highest fatality rate, yet were seldom detected by bat detectors. To adequately assess risks to both resident and migratory bats, ultrasonic bat detectors should be deployed to monitor flight activity within the rotor-swept area of a wind turbine and with the capacity to detect bats flying from different directions. Clearly, additional studies are needed to better detect migratory tree bats, as they seldom appear in acoustic data but are consistently present in fatality samples. In fact, they account for 68% of all bat fatalities recorded at North American wind-energy facilities to date.
Recently, D.S. Reynolds of North East Ecological Services (personal communication 2006) developed a design that consists of a cluster of four ultrasonic detectors attached to meteorological towers with each detector aligned in each of the four cardinal directions (Figure C-1). With this approach, it may be possible to establish the dominant direction of migratory bats that fly within the range of the detectors. More important, few studies to date have used ultrasonic detectors to reliably detect bats flying within the rotor-swept area. Thus, even if bats are active at the height of the rotor-swept area, existing technology cannot detect bats flying in this zone. Moreover, with the increasing size of turbines being developed and installed, deployment of ultrasonic detectors on the turbines cannot provide
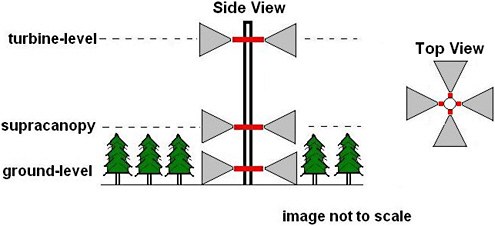
FIGURE C-1 Model of a vertical array of ultrasonic bat detectors for assessing nightly foraging and migratory activity of echolocating bats from ground level to the height of a turbine nacelle. Bat detectors are affixed to meteorological towers.
SOURCE: D.S. Reynolds 2006, modified figure printed with permission; copyright 2006, Journal of Wildlife Management.
information on the activity of some species within the range of detection, because there is no practical way to install ultrasonic detectors in the rotor- swept area. Instead, they need to be mounted on meteorological towers at comparable heights to the rotor -swept zone to access both migratory and foraging behavior of bats where they are most at risk at wind-energy facilities. However , use of blimps and kites, to which ultrasonic microphones can be attached (Menzel et al. 2005b), holds considerable promise for extending the ranges of detection above the forest canopy and into the range of the rotor -swept area of modern wind turbines.
Strengths and Limitations of Ultrasonic Bat Detectors
Some investigators have wondered whether insectivorous bat species do not echolocate when they migrate, which would render them unable to detect the presence of turbines or moving blades, resulting in collisions. However , a study conducted in Minnesota (Johnson et al. 2004) suggests that migrating bats do echolocate, at least while feeding in the vicinity of wind turbines. Summer resident species in the Mid-Atlantic Highlands and other regions of the United States (e.g., species of Myotis, Eptesicus, and Pipistrellus) as well as insectivorous species (species of Lasiurus, Lasionycteris , and Tadarida ) rely on echolocation while foraging. Moreover, Larkin (2006) suggested that because the energetic cost of echolocation is so low (see Speakman and Racey 1991), it is unlikely that bats would forego echolocation during migration. However, even if these bats do echolocate and feed near wind turbines, it is possible that they emit cries too infrequently and detection distances are too limited in range to protect them from encountering a rapidly moving rotor blade (Kunz et al. 2007). Also, given the limited range of detection of most ultrasonic detectors (< 30 m), it is quite likely that some migrating bats would have been missed when detectors were deployed at ground level.
Ultrasonic detectors for recording echolocation calls of bats have several limitations. Different models of detectors may have different microphones and ranges of detection, and even the same models can have different sensitivities, sometimes making it difficult to compare results from one detector to another (Larson and Hayes 2000; Limpens and McCracken 2004). In addition, these devices are not the “silver bullet” that some users have expected or promoted, as they have limited detection ranges (typically less than 25 m) and cannot be used unambiguously to identify all species pres ent in a given area, owing largely to the similarity of calls of some closely related species (e.g., little brown myotis, Myotis lucifugus, and Indiana bat, M. sodalis), the presence of cryptic species (e.g., Jones and Barlow 2004) and the variation among individual bats associated with both habitat and geographic location (Barclay and Brigham 2004; Gannon and Sherwin 2004).
Bat detectors offer alternatives to more traditional methods, such as mist-netting and harp-trapping,2 to determine the presence of many insectivorous bat species, especially in environments and in situations where it is not possible to capture them or make direct observations (e.g., open areas near wind turbines and above tree canopies). Bat detectors represent only one of a number of tools available to researchers for investigating the foraging, commuting, and migratory behavior of insectivorous bats (Kunz 2004). Ultrasonic detectors have their inherent biases associated with limits of detection, uncertainty of discriminating certain species based on call signatures, and the inability to discriminate individuals by sex, age, and reproductive condition (Barclay and Brigham 2004). However, a recent study suggests that it may be possible to distinguish sex and age of some bat species based on their echolocation call structures (Siemers et al. 2005). These situations place limits on the applicability of these devices for assessing the full extent of bat activities near wind turbines. Live capture and other methods (see below) are needed to gain a full understanding of which bat species are present in an area for assessing potential impacts in pre-siting surveys and pre-construction monitoring in the vicinity of windenergy facilities.
The importance of direct observations, in concert with recordings of echolocation calls, is essential for gaining a full understanding of how insectivorous bats are killed by wind turbines. Recordings of echolocation calls synchronized with multiflash, 3D photography or videography, thermal infrared imaging, and tracking radar can also provide additional insight into the behavior and echolocation call structure associated directly with prey capture (Kalko 2004; Horn and Arnett 2005) and responses to novel objects in their environment, such as wind turbines.
Some of the most promising research on migration, commuting, and foraging behavior of insectivorous bats could result from continuous recordings at sites proposed for development of wind-energy facilities. Use of ultrasonic bat detectors for assessing composition of local assemblages in the vicinity of proposed or constructed wind-energy facilities could provide valuable information, but accomplishing these goals requires reliable species identification (Barclay and Brigham 2004; Gannon and Sherwin 2004). Unfortunately, many studies that have used ultrasonic bat detectors have been hampered by inappropriate sample design, and uncertainties regarding species identity (Hayes 1997, 2000, 2003). These uncertainties and protocols must be addressed if ultrasonic detectors are to provide use-
ful information on species composition at wind-energy facilities and other areas of interest. Recent developments using time-expanded recordings of search calls produced by echolocating bats hold promise for improving the identification of species (e.g., Preatoni et al. 2005; Siemers et al. 2005).
An exhaustive analysis of empirical data using different bat detectors is probably beyond the scope of most projects. Instead, investigators should try to obtain data that would provide first-order understanding of basic questions, such as:
-
Over what volume of air space can reliable detection occur?
-
How do characteristics of calls affect detection?
-
How does this detection volume change with local conditions?
In cases where multiple sensors are being used to compute direction to or from the location of a calling animal, calibration should determine:
-
The directional, 2D, and/or 3D resolution of the system as a function of bearing and range to the source;
-
The directional, 2D, and/or 3D resolution of the system as a function of source-center frequency, bandwidth, and time-bandwidth product.
Array performance in the plane of the array can be assessed by projecting sounds with known acoustic characteristics from known x-y positions. Assessing array performance as a function of altitude is more of a challenge since one needs to have an acoustic source at various altitudes above the ground at various declinations from the array. No one, to our knowledge, has performed such a test. It could be conducted by deploying an array on or near a tall tower and placing controlled sources at various elevations on the tower.
Until comprehensive field studies involving acoustic calibrations are completed, it is difficult to develop reliable estimates of the costs and benefits of each method. Ideally, an acoustic calibration in the field would involve deployment of many sensors in a variety of geometries to spatially oversample, to obtain high-resolution location data, and to increase detection probability. During the post-processing phase, one could then subsample to determine the tradeoffs between detection probability, location accuracy, and processing complexity all as a function of call characteristics and environmental variables. A comprehensive field investigation would involve an integrated approach that combines multiple modalities including acoustics, radar, thermal imaging, and visual methods. Ideally one would do this with controlled objects moving in 3D space through the sampling region. Given the difficulty of that task, one could simultaneously use various methods so that at certain times each was operating blind and in-
dependently, and coordinate all methods and follow a prescribed protocol for sharing information to optimize detection and recognition within the largest space possible. This type of cross-validation would greatly improve the present state of knowledge by providing information on, for example, types of radar returns coincident with acoustic species-specific identification, acoustic locations associated with radar returns, and the proportion of radar targets that are bats.
The benefits of using different methods similarly could be evaluated using standardized metrics and their performances compared to the optimum as predicted by a model. Such an approach has been used successfully to predict potential impacts from anthropogenic noise and evaluate the efficacy of different animal-detection schemes in the marine environment. In most cases, an integrated approach using a combination of methods is preferred, because no single method can unambiguously assess the behavior of animals in natural populations, let alone measure the effects of wind turbines on a biotic community. Investigators should understand the limitations, applicability, and operational considerations of each method before deploying them in the field. Researchers responsible for evaluating a particular monitoring project should have some way of gauging its likelihood of success, its optimal expected benefits, and certainly whether the proposed effort has the statistical power to address the key issues of concern.
At present, some of the potential benefits from the application of passive-acoustic monitoring techniques for birds and bats have been demonstrated, but the actual benefits have not been rigorously field tested, calibrated, or fully quantified. Birds and bats produce sounds for various reasons, and the assumption is that one can take advantage of their natural behaviors to monitor their presence relative to wind-energy facilities. Technology can be applied to record, detect, and in some cases identify a significant portion of bird and bat species that are resident or occur seasonally as migrants through wind-energy facility areas. However, little is known about how to interpret counts of call detections for actual passage rates. Acoustic technologies exist, and a few pilot projects have demonstrated that they can be applied to characterize the 3D distributions of calling birds as they move through a wind-energy facility (Jacques Whitford Limited 2005). There often is considerable natural variability in the density, spatial distribution, and seasonal occurrence of bird and bat species in the vicinity of wind-energy facilities. However, there is no ideal way to predict or compensate for such variability with much spatial or temporal accuracy other than to conduct site-specific monitoring.
Challenges and Recommendations
Factors that limit the application of passive-acoustic technologies include the cost of the equipment and the time, level of expertise, and signal-
processing software required to analyze the data. Significant advances in hardware and software development have occurred in the past few years, and rates of improvements are expected to increase. In the hardware domain, there are several versions of low-powered, autonomous acoustic recorders that can be deployed as stand-alone units, and at least one version where units can be deployed in an array configuration. Such units can operate continuously in remote areas for months at a time and some can collect acoustic data in frequency ranges appropriate for birds and bats. In the software domain, extensible sound-analysis software packages are becoming available that allow automatic detection and 3D localization and batch processing. However, most bioacoustical technologies have not been rigorously calibrated in the field or systematically compared with other methods to help estimate biases in the data.
In cases where single, audible and ultrasonic sensors are being used to detect birds or bats, calibration should determine:
-
The absolute sensitivity of the recording electronics as a function of frequency. This can be accomplished in the laboratory prior to field work and can be used to predict the detection volume as a function of frequency in the ideal context of an acoustic free-field with spherical spreading;
-
The empirical sensitivity of the recording unit as a function of frequency, source location, and environmental conditions. Sensor performance should be verified in the field by projecting sounds of separate frequencies from known positions specified or known environmental conditions (e.g., wind speed, humidity, and temperature). Such data can be used to derive an empirical transmission-loss function that can be used to predict the detection volume under a variety of typical field conditions.
Using Radar to Detect, Monitor, and Quantify the Movements of Bats, Birds, and Insects in the Atmosphere
More than 60 years ago the British discovered that birds were responsible for some of the puzzling radar echoes dubbed “angels” (Lack and Varley 1945; Buss 1946). Subsequently, radar has proven to be a useful tool for the detection, monitoring, and quantification of the movements of organisms in the atmosphere. Radar can be used to investigate the movements of birds (Eastwood 1967; Gauthreaux 1970; Richardson 1979; Kerlinger 1982; Kerlinger and Gauthreaux 1985; Vaughn 1985; Bruderer 1997a,b), bats (Williams et al. 1973), and insects (Riley et al. 1983) in the atmosphere during the day, or at night including small (1-10 km of a tracking or marine radar), intermediate (10-200 km or the surveillance area of a single weather radar), and large spatial scales (continent-wide radar network surveillance).
Radar has been valuable not only for descriptive studies of daily and seasonal movements of flying animals, but technically has also been used to answer important questions related to orientation, aerodynamics, and habitat selection of migrants. During the past two decades, radar has been increasingly used in risk-assessment studies related to projects that could potentially impact species that are migratory, endangered, threatened, or of special concern (Cooper 1996; Gauthreaux and Belser 2003a, 2005; Larkin 2005b).
Tracking Radar
Small tracking radars can detect individual targets within a range of a 100+ m to 4-6 km, and large tracking radars used by the National Aeronautics and Space Administration (NASA), can detect and track individual bird-sized targets for tens of kilometers and a bumblebee out to a range of 10 km. Tracking radar “locks on” a target and follows the subsequent movements of the target in 3D space as long as another target does not enter the beam at the same range. If this happens, the radar may switch targets and track the new target. This is a serious problem when many targets are present. Although tracking radar can provide detailed information on the flight paths of individual targets as well as information on wing-beat patterns (Renevey 1981), the very narrow beam limits simultaneous sampling of several targets.
Small military-surplus tracking radars have been used to monitor the movements of individual birds (Bruderer and Steidinger 1972; Griffin 1972; Able 1977; Larkin and Frase 1988; Bruderer et al. 1995; Bäckman and Alerstam 2003) and insects (Larkin 1991) within a range of a few kilometers, although these units often require regular maintenance and parts are difficult to find. Birds and insects have also been tracked with large tracking radars (SPANDAR) used to track deep-space probes by NASA at the Wallops Island, Virginia facility (Glover et al. 1966, Williams et al. 1972, Demong and Emlen 1978). At present there is only one published study of bat movements recorded by tracking radar (Bruderer and Popa-Lisseanu 2005), although R.P. Larkin (Illinois Natural History Survey, personal communication 2005) has used his tracking radar unit based at the Illinois Natural History Survey to follow bats (Myotis lucifugus).
Marine Radar
Most of the small, mobile radars used in wildlife and entomological studies to date have been 5 to 60 kW marine-surveillance radars of 3- or 10-cm wavelengths. Many are commercial off-the-shelf units that are used without modification. In typical horizontal surveillance mode, the marineradar antenna samples a large airspace (20-25°) in the vertical and much less (1.0-2.3°) in the horizontal. Because of the broad vertical coverage of
the radar beam, measuring the altitude of targets is impossible in horizontal surveillance mode. To address this limitation, the radar can be tilted 90° so that the sweep of the antenna is vertical. In this mode accurate measurements of target altitude are possible without echoes from ground clutter. Some investigators have used a single unit for both horizontal and vertical surveillance (Harmata et al. 2003), whereas others have used two radars, one for horizontal and one for vertical surveillance (Harmata et al. 1999).
Another approach uses a second radar with either a non-rotating parabolic dish that can be positioned at any elevation angle between horizontal and vertical (Gauthreaux 1985a,b) or a non-rotating parabolic dish that is directed vertically and is mounted on top of the transmitter/receiver unit (Cooper et al. 1991). It also is possible to replace the open-array antenna with a rotating, parabolic antenna that projects a narrow, conical (e.g., 2.5-4.0°) beam (Gauthreaux and Belser 2003a). When the conical beam is elevated in the horizontal surveillance mode, the altitude of an echo is a trigonometric function of the range of the echo and the angle of antenna tilt.
Each of the above configurations has advantages and disadvantages. The open-array antenna samples a greater air space, but this reduces the range of detection and the altitude of a target in the vertical scan cannot be linked to the track of a target in the horizontal scan. The parabolic antenna samples a smaller volume of atmosphere but has a greater detection range and three-dimensional information on each target can be measured.
When tuned properly, high-resolution marine radars with parabolic antennas can readily detect small flocks of birds out to 6 km from the radar (Gauthreaux and Belser 2003a) and insects out to 1.5-2.5 km (Riley 1989). Low-powered marine radar can detect individual birds within a range of 2-3 km and flocks of birds out to 10 km, and a 25 kW marine radar with an open-array antenna can detect small passerines out to a range of 800-1,000 m, and European thrushes (Turdus spp.) can be detected by 10 and 12 kW units at the same range (Desholm et al. 2004). With 25 kW 3-cm-wavelength radar in clear weather, the range at which an 800 g duck can be detected has been computed to be 2.19 km for short-pulse and 3.2 km for long-pulse radars; with 60 kW 10-cm-wavelength radar in clear weather, a 500 g pigeon-like target can be detected at 3.97 km for short-pulse and 5.5 km for long-pulse radar (Desholm et al. 2004). Cooper et al. (1991, 2004a) noted that 12 kW radar with an open-array antenna can routinely detect flocks of waterfowl out to 5.6 km, individual hawks out to 2.3 km, and single, small passerines out to 1.2 km.
Based on simultaneous visual and vertical radar observations during the day, when birds are flying high and near the visual limits of observers, observers noted that fewer than half of the birds were detected by radar (Harmata et al. 1999). In a European study, about 40% of the birds fly-
ing below 50 m were missed by marine radar, but when birds were flying above 50 m, only 8% went undetected by the radar (Knust et al. 2003). Moreover, low-flying birds often were obscured by the ground-clutter pattern of the radar display. On short pulse lengths, minimum detectable range can be as close as 20-30 m, and range discrimination depends on the pulse length used.
Several technical limitations affect the quality of quantitative data gathered by marine radar. The aspect of the target relative to the radar beam affects the amount of energy reflected back to the radar receiver. Head-on and tail-on detections have significantly smaller radar cross-sections than broadside detections. In addition, a radar’s beam width is defined as the angle where the energy of the beam is reduced by one-half (or -3 dB) of the maximum at the center of the beam. If one of two identical targets at the same range occurs at the very edge of the radar beam and the other is positioned at the center of the beam, then the target at the edge of the beam will produce a weaker echo than the one at the center of the beam. Similarly, a strong target outside the “beam” can be detected as a weak target. The problem is amplified when using wide-beam (20-25°) radar, because of the rapid power loss with range.
The following factors are known to affect the performance of marinesurveillance radars and influence the results obtained from different radar studies of bird, bat, and insect movements:
-
Pulse length and corresponding pulse repetition frequencies.
-
Transmitter power (e.g., 5, 10, 25, 50, or 60 kW).
-
Sea clutter and rain clutter settings.
-
Tuning of the receiver.
-
Antenna rotation speed.
-
Antenna beam characteristics.
-
Range setting.
-
Beam-brilliance setting.
-
Gain setting.
-
Frequency or wavelength.
When impact assessment studies use different brands of surveillance radar, and the above factors are not the same, the results are not likely to be quantitatively comparable. Without some form of operational standards this problem will persist. Moreover, not all marine radars detect biological targets equally (J. Kube, Institut für Angewandte Ökologie, personal communication 2005). It is essential that calibration of the unit be performed before studies are begun, and the calibrations be conducted periodically during the study. This can be done with a radar reflector of standard crosssection. The reflector can be lifted by balloon or kite at a fixed range from
the radar, and the characteristics of the echo produced by the reflector target compared to some reference standard.
The transmitter power of the marine radar should be as high as possible (25 kW or greater), because long pulse lengths enhance detectability but suffer a loss of resolution, and short pulse lengths increase resolution with a loss of detectability. The greater the transmitter power the greater the cost, but 50 kW radar operating on short pulse will produce superior results in an assessment study over a 10kW unit operating on short pulse. Marine radars can be purchased in either of two wavelengths—3 cm (X-band) or 10 cm (S-band)—and there is considerable debate among users of these two radar types regarding which one is best. Both have been used to study bird movements aloft, but no published study has compared them at the same location and under similar weather conditions. It is well known that precipitation attenuates 3 cm wavelengths considerably more than it does 10 cm signals, and as a result, precipitation will greatly decrease the chances of a 3 cm radar’s detecting targets beyond a shower. Irrespective of wavelength, small target detection within an area of heavy precipitation is not likely.
A comparison of small radar systems that currently are being used to study bird movements can be found in Desholm et al. (2004) and in MacKinnon (2006). The former reference examines the performance of marine-surveillance radars used to study bird and bat movement in the vicinity of wind turbines and includes a discussion of the characteristics of an ideal bird/bat detecting radar. The latter is a compilation of information on small radars used to detect, monitor, and quantify bird movements that pose a threat to aircraft and includes information on recent developments in digital processing of marine-radar detections of biological targets in the atmosphere (e.g., Nohara et al. 2005).
The methods of collecting and processing marine-radar data differ among studies. In some cases, investigators extract the echo data from the radar display (or a digital image of the display) manually (Figure C-2A) and then perform analyses to compute descriptive statistics of migration direction and passage rate. In other cases commercial radars with digital processors gather raw radar data from the receiver and then use proprietary algorithms to process the data. The algorithms reduce ground clutter and the processed data from targets are reported out either in a spreadsheet format with information on target track (direction and velocity), reflectivity, and size or as plots (Figure C-2B). Hundreds of targets can be tracked at once, but as the number of targets increases, so does the possibility of tracking errors, because the tracking algorithms may switch between nearby targets. Manual data extraction is labor-intensive and time-consuming and there is always the possibility of some bias in manual extraction of the data. Automatic digital processing is extremely fast and eliminates the possibility
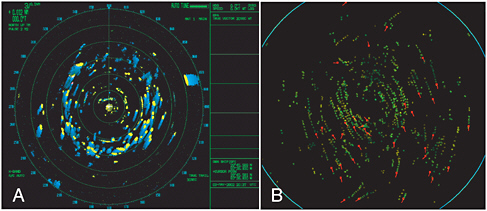
FIGURE C-2 (A) A frame from a Furuno 2155-BB radar with a parabolic dish (4° beam width) elevated 30° above the horizontal. Most of the echoes are from migrating birds and bats flying toward NNE. The yellow echoes show the position when the image was generated and the blue trails show past positions of the echoes. The large echo coming in from ENE is a helicopter. (B) An image generated from digitally processed data from same radar system showing tracks (green) and current position and heading (red symbols).
SOURCE: Sidney Gauthreaux, Clemson University.
of such bias, but the processing algorithms must be carefully evaluated to exclude the possibility that systematic biases are not introduced into the algorithms by the developer (e.g., algorithms requiring a certain number of detections before tracking begins and consequently excluding fast targets that produce less than the required number of detections). There is clearly a need to carefully ground-truth the reports of data from digitally processed radar return, but no published studies have done so.
The identification of birds, bats, and insects and determination of the number of targets per echo on marine radars can be problematical. The echo information returned to a radar receiver from birds and bats in the atmosphere makes it nearly impossible to discriminate echoes from bats and echoes from similarly sized birds, and this is particularly true for migrating bats and birds engaged in linear flight. Foraging bats may produce irregular echo movement patterns, but similar echo movement patterns may be produced by nocturnally foraging birds (nighthawks). Because of the inability to discriminate between radar reflections from birds and bats, investigators typically refer to the sources of echoes in radar studies as “targets.” One generally cannot discriminate an individual target from a tight cluster of targets, because a single large target may produce the same echo as a tight group of smaller targets. If one knows the speed and direction of the wind at the altitude where a target is detected, the airspeed of the target can be
calculated, and this information can be used to assign targets to categories based on flight speed (Harmata et al. 1999). Similarly, the flight behavior of a target may offer clues to its identity (e.g., very irregular flight path of a foraging bat, circling of a raptor in a thermal). Claims of target identification based on size of target (number of pixels) are likely incorrect. When echo characteristics of hundreds of known targets have been analyzed statistically, the relationship is not significant (O. Hüppop, Institut für Vogelforschung Vogelwarte Helgoland, personal communication 2006). Thus far, the best studies have employed simultaneous visual observations (Newman and Lowery 1959) and thermal imaging (Gauthreaux and Livingston 2006) during the daylight hours and moon-watching (Lowery 1951), ceilometry, image intensification (Gauthreaux 1969; Able and Gauthreaux 1975; Plissner et al. 2006), and thermal-imaging (Gauthreaux and Livingston 2006) observations at night (Horn et al. in press).
Marine Radar Studies at Eastern Wind-Energy Projects: Case Studies
Cooper et al. (2004a) studied spring bird-migration concurrently with radar and direct visual observations for about 4 hours per day and with radar observations alone for about 5 hours per night from April 15 through May 15, 2003, at the site of the proposed Chautauqua Wind-Energy Facility in western New York. The radar was an X-band Furuno Model FR-1510 MKIII with a peak power of 12 kW and a 2-m-long open array (T-bar) antenna that produces a horizontal-beam width of 1.23° and a vertical-beam width of 25° (± ~10° side lobe). Pulse lengths used were 0.07 and 0.5 sec.
The mean flight direction of targets observed with radar at night was 029° ± 40 and mean passage rates were 395 ± 69 targets km–1h–1, significantly higher than the daytime rate of 79 ± 13 targets km–1h–1. The mean flight altitude during the daytime was 372 ± 6 m above ground level (agl); the mean nocturnal flight altitude was 528 ± 3 m agl. The mean percentage of all targets flying below 125 m agl, a height that could bring them into contact with wind-turbine blades, was 17.2% during the day and 3.8% at night.
Cooper et al. (2004b) also conducted a radar study of nocturnal migration at the proposed Chautauqua facility site from September 2 through October 10, 2003. Sampling occurred for about 6 hours per night during 30 nights within the 40-day study period. The radar equipment and surveillance protocols were the same as described in Cooper et al. (2004a). The mean flight direction of birds and bats was toward the SSW (199° ± 58°). The mean (± SE) fall passage rate was 238 ± 48 targets km–1h–1 and ranged from nightly rates of 10 to 905 targets km–1h–1 with higher rates after midSeptember. The mean altitude of flights in fall was 532 ± 3 m agl.
Mabee et al. (2004) presented the results of a radar study of nocturnal bird and bat migration at the site of the proposed Mt. Storm wind-power
facility in northeastern West Virginia from September 3 through October 17, 2003 for approximately 6 hours per night on 45 nights. Vehicle-mounted radars (X-band Furuno Model FR-1510 MKIII) monitored five locations within the proposed site. Horizontal surveillance covered a 1.5-km radius and vertical surveillance covered altitudes up to about 1.5 km. The mean flight direction of targets detected by radar was toward 184° ± 1°, and the night-to-night passage rates varied from 8 to 852 targets km–1h–1 with a mean rate of 241 ± 33 targets km–1h–1 at the central study site and a mean of 199 targets km–1h–1 for all the fall sample sites in the project area. The authors found variation in passage rates among some ridge sites (e.g., central and southern sites) and between ridge and off-ridge sites (e.g., central and western sites) but did not find that nocturnal migrants concentrated along the Allegheny Front. The general direction of migration over the site was toward the southwest. According to the authors, “of 1,733 targets at the central station that could be tracked as they approached the primary ridgeline long enough to determine a response to the ridgeline, 5.3% of targets approached and turned greater than 10° before crossing or turned and did not cross the ridge, 49.7% approached and crossed the ridge, and 45% did not approach the ridge.” The mean altitude of flight measured with vertically scanning radar was 410 ± 2 m agl, but night-to-night mean altitudes were highly variable as were the hour-to-hour flight altitudes during the night. Migration at lower altitudes occurred later in the evening. The mean passage rate for the 13% of the targets that flew below 125 m agl was 36.3 targets km–1h–1.
Marine-radar and night-vision studies of bird and bat migration between August 16 and October 14, 2005, at two sites in the proposed Highland New Wind Development area in the Allegheny Mountains of western Virginia found a mean nocturnal passage rate of 385 ± 55 targets km–1h–1 with a range among nights between 9 and 2,762 targets km–1h–1 (Plissner et al. 2006). The study found no differences in passage rates, flight altitudes, or observed proportions of targets between the two survey sites. These passage rates are among the highest measured at eastern U.S. wind-energy development sites where similar equipment and methods have been used. The mean flight direction of targets observed on the marine radar was SSW (204°). For the entire fall season, the mean nocturnal flight altitude measured with vertical radar was 442 ± 3 m agl. The mean altitude of flight varied from 211 to 721 m agl, and during autumn 11.5% of targets flew at an altitude of 125 m agl or below.
In a recent review of radar studies at proposed and existing wind-energy projects in the United States, Young and Erickson (2006) indicated that the mean passage rates of targets (targets km–1hr–1) in the east (21 studies) was similar in spring and fall (258 vs. 247, respectively). Their analysis also showed that the mean height of flights was 409 m agl in spring and
470 m agl in fall, and 14% of the targets were below 125 m agl in the spring and 6.5% were below 125 m agl in the fall. Mean flight directions were toward the NNE (31°) in spring and toward the SSW (193°) in the fall. The passage rate of birds and bats during spring and fall migration periods is greater in the east than that measured in the central and western United States, and in general the passage rates are greater in autumn than in the spring, with Chautauqua, New York being a notable exception (Table C-3). The altitudinal distribution of targets detected by radar covers several hundreds of meters agl, and relatively few of these targets fly below 125-127 m agl in the potential strike zones of wind turbines (Table C-4). The strike zone is typically defined as the area swept by the turbine, but it is possible that some birds and bats collide with the supporting monopole below the rotor-swept area due to turbulence. It is also possible that birds flying higher than the zone could descend if attracted by warning lights on the turbines, but Kerlinger and Kerns (2003) found that birds were not attracted to FAA-recommended lighting on wind turbines (Johnson et al. 2002). Marine-surveillance radar does not detect low-flying birds and bats
TABLE C-3 Mean Nocturnal Passage Rates (targets km–1 hr–1) in Spring and Fall for Different Regions of the United States
|
Location |
Spring (year) |
Fall (year) |
Reference |
|
Eastern U.S. |
|
|
|
|
Chautauqua, NY |
395 (2003) |
238 (2003) |
Cooper et al. (2004a,b, 2005b) |
|
Copenhagen, NY |
170 |
242 |
Cooper and Mabee (2000) |
|
Wethersfield, NY |
62 |
180 |
Cooper and Mabee (2000) |
|
Carthage, NY |
|
225 |
Cooper et al. (1995a,b) |
|
Mt. Storm, WV |
|
54-241 (2003) |
Mabee et al. (2004) |
|
Nantucket Sound, MA |
53 (2000) |
135 (2000) |
Curry and Kerlinger LLC and ESS Group (2004) |
|
New England, ME |
71 (1994) |
478 (1994) |
Northrop, Devine, and Tarbell, Inc. (1995a,b) |
|
Highland, VA |
|
385 (2005) |
Plissner et al. (2006) |
|
Central U.S. |
|
|
|
|
Thief River-W, MN |
63 |
83 |
Day and Byrne (1989, 1990) |
|
Thief River-E, MN |
43 |
108 |
Day and Byrne (1989, 1990) |
|
Buffalo Ridge, MN |
93 (1997) |
98 (1996) |
Hawrot and Hanowski (1997) |
|
Amhurst-S, SD |
83 |
40 |
Cooper et al. (2004c) |
|
Amhurst-N, SD |
23 |
27 |
Cooper et al. (2004c) |
|
Western U.S. |
|
|
|
|
Vansycle, OR |
48 (2001) |
26 (2001) |
Mabee and Cooper (2002, 2004) |
|
Hatch Grade, OR |
45 (2001) |
22 (2001) |
Mabee and Cooper (2004) |
TABLE C-4 Percentage of Radar Echoes Flying Between Ground Clutter and 125-127 m Above Ground Level
|
Location |
Spring |
Fall |
Reference |
|
Nantucket Sound, MA |
21.8 |
7.7 |
Curry and Kerlinger LLC and ESS Group (2004) |
|
New York |
3.8 |
4 |
Cooper et al. (2004a,b,c) |
|
West Virginia |
|
16 |
Mabee et al. (2004) |
|
Virginia |
|
11.5 |
Plissner et al. (2006) |
|
Oregon |
15 |
6 |
Mabee & Cooper (2002, 2004) |
|
SOURCES: Cooper et al. (2004c); Curry & Kerlinger LLC and ESS Group (2004). |
|||
(less than 30 m agl), because of the recovery time of the radar and because ground clutter echoes obscure targets flying at very low altitudes. The tuning of the sensitivity-time control (STC) curve also is critically important, because high STC settings for short ranges will make detection of close-in targets more difficult.
Weather-Surveillance Radar (WSR-88D or NEXRAD)
The Weather-Surveillance Radar-1988, Doppler (WSR-88D) is the backbone of the national network of weather radars in the United States operated by the National Weather Service (NWS) in the National Oceanic and Atmospheric Administration (NOAA) of the Department of Commerce, the Department of Defense (units at military bases), and non-continental-United States (CONUS) Department of Transportation sites (Crum and Alberty 1993; Crum et al. 1993; Klazura and Imy 1993). There are 155 WSR-88D radars in the United States, including the Territory of Guam and the Commonwealth of Puerto Rico.
These powerful and sensitive S-band Doppler weather-surveillance radars (also known as NEXRAD for next generation radar) have a 1.0° beam, and when the beam is tilted 0.5° above the horizontal, the radar can detect concentrations of biological targets out to a range of 240 km and intense precipitation at a maximum range of 460 km. The WSR-88D detects the intensity of reflected energy from objects in the atmosphere as well as the Doppler shifts of returned frequencies from moving targets, and the latter information can be used to calculate radial velocities of the moving objects relative to the radar station. NEXRAD radar is extremely sensitive and can detect birds, bats, and concentrations of insects in precipitation mode. When there is no precipitation detected, the radar operates in “clear-air mode” and samples the same volume of air space more slowly, making it possible to detect the reflected energy from very small objects such as insects and even dust and smoke particles.
NOAA and the National Climatic Data Center (NCDC) in Asheville, North Carolina, have archived data from each WSR-88D station since 1995, although there are several gaps in the archived records. Level II archived data contain the three basic moments from the radar: reflectivity, radial velocity, and spectrum width (Figures C-3A-3C). Level III archived data contain derived products such as base reflectivity, base velocity, verticalwind profile, echo tops—products that are very useful for biological studies. These archived data are freely accessible from the NCDC. Data from one or more stations can be integrated to support analysis of nightly behavior, seasonal trends, and population shifts of bats and birds at local, regional, and national scales.
The antenna of the WSR-88D is computer-controlled and repetitively scans the atmosphere through a sequence of predefined elevation angles, antenna rotation rates, and pulse characteristics (volume coverage patterns or VCP) depending on the radar’s mode of operation. Two operational modes exist—a precipitation mode and a clear-air mode—and selection of an operational mode is closely related to the detected coverage of precipitation. Precipitation mode has four VCPs (11, 12, 21, and 121) and clear-air mode has two VCPs (31 and 32) (Table 4-1 in the Federal Meteorological Handbook No. 11, 2006). VCP 21 is the standard precipitation mode and is typically used when precipitation is first detected. VCP 11 provides better vertical sampling of weather echoes close to the antenna than VCP 21 and is usually preferred in situations where convective precipitation is within 120 km of the antenna. VCP 12 has the same number of elevation angles as VCP 11 but denser vertical sampling at lower-elevation angles. VCP 121 has the same elevation angles as VCP 21, but it has more scans and lessens the range and velocity aliasing (producing a false frequency with the correct one—the Doppler Dilemma). In the clear-air mode of operation, VCP 31 uses a 4.7 μsec pulse length and VCP 32 uses a 1.57 μsec pulse length. The longer pulse length of VCP 31 provides greater sensitivity, and the display threshold is reduced to detect minute amounts of energy returning from weak reflectors in the atmosphere (e.g., refractive index gradients, cloud droplets, dust and smoke particles, and pollen grains). Each operational mode is also associated with a product generation list (Table 4-2 in the Federal Meteorological Handbook No. 11, 2006), and additional characteristics of the WSR-88D can be found in that handbook (OFCM 2006).
WSR-88D digital-base data (Level II) from the signal processor of the Radar Product Generator (RPG) are recorded at all NWS and several select CONUS DOD WSR-88D sites on 8-mm magnetic tape and sent to the NCDC for archiving and dissemination. Other data include information on synchronization, calibration, date, time, antenna position, and operational mode. From these base data, additional computer processing generates a set of pre-determined products known as Level III data as defined in Federal
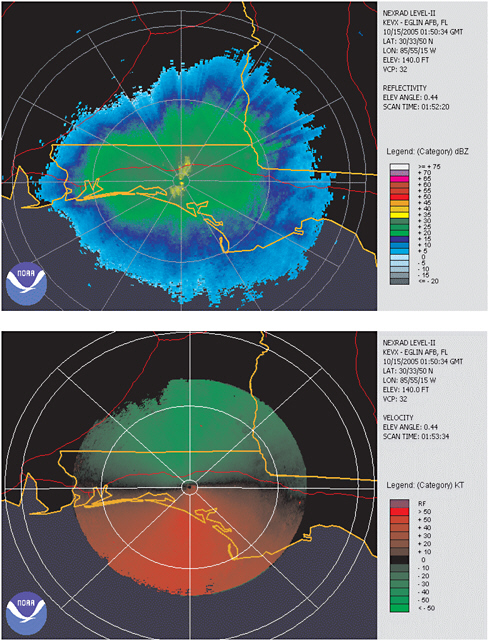
FIGURE C-3 (A) Base reflectivity image from WSR-88D Level II data showing the night during the fall of 2005 with the highest density of bird migration (ca. 1,800 birds km–3) over northwestern Florida. North is at the top and east is to the right in this and following figures. (B) Base-velocity image from WSR-88D Level II data showing the radial velocity of targets displayed in Figure C-3A. Greens indicate movement toward the radar and reds are moving away.
SOURCE: Sidney Gauthreaux, Clemson University.
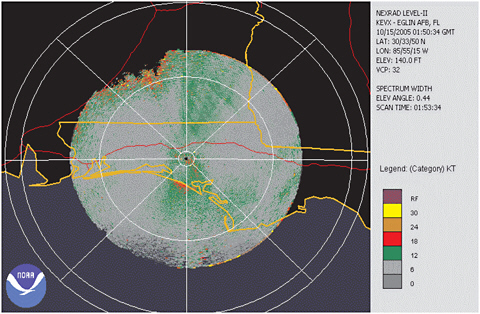
FIGURE C-3 (C) Spectrum width display from WSR-88D Level II data that corresponds to displays in Figures C-3A and B.
SOURCE: Sidney Gauthreaux, Clemson University.
Meteorological Handbook No. 11, Part A. Level III products are recorded at 155 of the 159 worldwide sites, and sent to NCDC for permanent storage.
The archive of digital data from the WSR-88D is stored on the NCDC Robotic Mass Storage System, commonly known as the Hierarchical Data Storage System (HDSS). WSR-88D data may be downloaded at no cost from NCDC, and they are available from 1991 to one day from present and are easily accessible with the NEXRAD Inventory Search tool. This tool can be used to view the data for completeness and to download data. The requested data are ready for use with the NCDC Java NEXRAD Viewer and Data Exporter. Each order may contain up to 24 hours of data at a time for a single site. The data may also be ordered from the NCDC HDSS Access System (HAS) web page. This is a better option for users needing large amounts of data in a compressed-archive format. Up to a week of data for multiple sites may be ordered. Downloaded radar data from NCDC are in a unique digital binary format. Special software must be used to visualize the data. Several free visualization and analysis products are available for download at the NCDC web site (NCDC 2006).
Detection of Biological Targets on the WSR-88D
Aerial biological targets are readily detected by the WSR-88D, and several investigators have detailed its use for studying bird migration (Gauthreaux and Belser 1998, 1999, 2003b; Diehl and Larkin 2005), bird roosts (Russell and Gauthreaux 1998; Russell et al. 1998), bat colonies (McCracken 1996; McCracken and Westbrook 2002), and concentrations of insects aloft (Westbrook and Wolf 1998). The WSR-88D can be used to quantify the amount of bird migration aloft (Gauthreaux and Belser 1998, 1999; Black and Donaldson 1999) and it has been used to study regional patterns of migration (e.g., Great Lake Region [Diehl et al. 2003]). Detailed methods of analyzing Level III data from the WSR-88D can be found in Gauthreaux and Belser (2003b).
WSR-88D technology has made it possible to characterize and quantify the nightly behavior of some bat species as they disperse nightly from their roosts to forage at high altitudes. For example, in the southwestern United States, Brazilian free-tailed bats (Tadarida brasiliensis) form enormous colonies that disperse nightly, as far as 70 km from their daily refuges. The first observation of expanding ring-like formations at WSR-57 radar installations in Texas was confirmed as bats flying at high altitudes (Williams et al. 1973). To quantify both direction and speed of nightly dispersal from the selected colonies, the density of bat reflectivity can be quantified. WSR-88D radar images taken at weather-monitoring stations in south-central Texas have been used by Horn (2007) to estimate colony size and patterns of nightly dispersal of Brazilian free-tailed bats from cave and bridge roosts remotely (Figure C-4). To accomplish this, a mosaic radar image is produced from different weather stations by translating reflectivity from radial to a geo-referenced grid format, and then filtered to remove weather activity and enhance the visibility of the biological activity. Spatiotemporal statistics are used to describe rates of dispersion, duration of foraging bouts, direction vectors for movements of foraging groups, activity centers where foraging may occur, and summary measures of overall activity from the reflectance data. Computer-vision algorithms provide the framework for spatial dependence and for calculating the probability of transition from one reflectivity level to another (Horn 2007).
While WSR-88D technology may have limited applicability for assessing impacts of wind-energy facilities on birds and bats at many locations because it cannot detect low-flying targets, it offers a powerful tool for quantifying nightly dispersal and migratory activity of bat species that form large cave- and bridge-roosting colonies and disperse over the landscape within the range of radar coverage, especially where wind-energy facilities have been and are being developed in Oklahoma, Texas, and New Mexico, where there are large colonies of Brazilian free-tailed bats (Horn 2007). Similarly WSR-88D analysis of bird-migration patterns and bird-roost
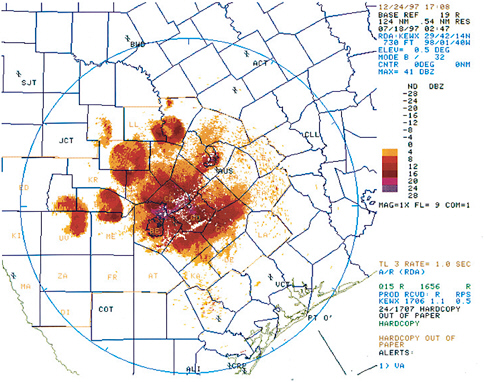
FIGURE C-4 NEXRAD, WSR-88D Doppler radar images of Brazilian free-tailed bats dispersing nightly from selected cave and bridge roosts in south-central Texas.
SOURCE: Kunz 2004; National Oceanic and Atmospheric Administration, National Weather Service.
locations in the general area of a planned wind-energy facility can help in the initial assessment of aerial bird activity at alternate development sites. Data from WSR-88D sites around the country have been archived for more than a decade and therefore could provide opportunities to assess annual variations in bird migration over large areas.
Within 60 km of the radar, WSR-88D can be used to delimit important migration stopover areas by measuring the density of birds (birds km–3) in the beam as they begin a migratory movement (exodus). Within minutes of the onset of nocturnal migration, the distribution and density of echoes in the radar beam can provide information on geographical ground sources of the migrants (migration stopover areas), and satellite imagery can be used to identify the topography and habitat type that characterizes these areas (Gauthreaux and Belser 2003a). At a larger spatial scale (that of the surveillance area of a single Doppler weather radar, out to 240 km), this approach
can also be used to quantify the density of birds and to delimit locations of post-breeding, nocturnal roost sites of birds such as purple martins (Progne subis) and other species. Martins flying toward the roost late in the day generally fly low, often under radar coverage. However, when they depart the roost near dawn (Figure C-5) they fly higher and can be easily detected by Doppler radar (Russell et al. 1998; Russell and Gauthreaux 1998). At a continental scale, the national network of WSR-88D radars can be used to measure the direction and quantity of bird migration over the United States on an hourly basis at different altitudes dependent on distance from the radar (Gauthreaux et al. 2003). This ability is significant because it provides a means of monitoring the seasonal and annual variation in the patterns of migration at different altitudes for different geographical regions and the nation as a whole.
Although the WSR-88D is highly beneficial for the study of bird migration, it does have limitations with respect to its use in environmental
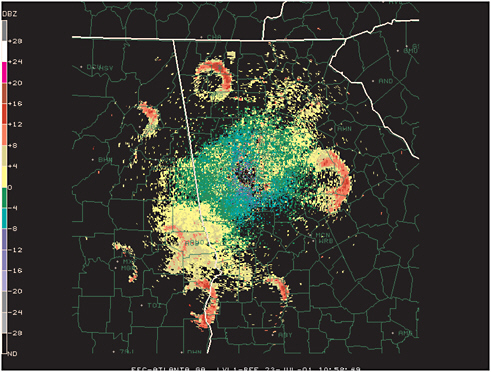
FIGURE C-5 Base reflectivity display of the Atlanta, GA (KFFC) WSR-88D showing the exodus of purple martins from roost sites near sunrise at 10:58 UTC on July 23, 2001.
SOURCE: National Oceanic and Atmospheric Administration.
risk assessment studies of wind-energy development. The pulse lengths of the radar are relatively long and the resolution of the data is rather coarse. The maximum resolution of the WSR-88D for reflectivity measurements and for Level III radial velocity measurements at 240 km range is 1° × 1 km. For Level III velocity data at 60 km range and for Level II velocity and spectrum-width data, the maximum resolution is 1° × 250 m. The lowest tilt of the WSR-88D antenna averages 0.5° above the horizontal, and over most of the surveillance coverage the base of the beam is too high to detect low-flying birds and bats. The beam width of the WSR-88D is 1°, and at a distance of 30 km the beam is 262 m wide. This eliminates the possibility of precise altitudinal measurements of targets.
Thus far, relatively few pre-construction studies at proposed wind-energy development sites have used WSR-88D data for a general assessment of migration volume over the site, but an analysis of these data can be valuable for assessing the temporal and spatial variability of daily (bird) and nightly (bats) dispersal and seasonal migration over the general area where wind-energy facilities are being considered proposed. WSR-88D data have been used to assess migration density during pre-construction studies at the proposed Mt. Storm Wind Power Site in northeastern West Virginia (Mabee et al. 2004). This study found no strong correlations between radar migration-passage rates measured with marine radar and NEXRAD reflectivity values (representing bird densities) during 25 nights of comparable data. The authors acknowledge that the WSR-88D station near Pittsburgh, Pennsylvania—170 km distant—is the closest to Mt. Storm. At such a distance, the effective coverage area of the lowest scan (0.5° above horizontal) of the WSR-88D overshoots most of the migration layer and does not allow for a direct comparison of the migration density recorded by both radar systems. Despite this shortcoming, mean flight directions of migrants recorded by both systems were correlated.
Because the radar pulse volumes of the WSR-88D are large, a given pulse volume often includes birds, bats, and insects, and one must use the mean airspeeds of targets to discriminate between slow-flying insects, foraging bats, and faster-flying migrating birds and bats (Gauthreaux and Belser 2003b). There is a need to compare migration-passage rates measured with marine radars and migration-traffic rates measured with thermal imagers and vertically pointing, fixed-beam radars and the WSR-88D. Larkin et al. (2002) related the number of flight calls from a nocturnally migrating bird, the dickcissel (Spiza americana), to displays of bird-migration density on the WSR-88D and concluded that the two measures were highly correlated. In contrast, Farnsworth et al. (2004) found a weak correlation between the number of flight calls per night and the maximum density of bird migration displayed on the WSR-88D, but the hour-to-hour pattern of flight calls during the night was not correlated with the hour-to-hour changes
in the density of migration displayed on the radar. This is not surprising because the frequency of flight calling by birds increases when the sky is overcast and the cloud ceiling low. Likewise, flight calls of birds increase dramatically during foggy, misty conditions. The WSR-88D was designed as a weather radar and was not intended to be used by biologists to study biological targets in the atmosphere. Despite its limitations, the WSR-88D has proven to be of great value for studying the distribution and abundance of biological targets in the atmosphere and different aspects of their flight behavior (e.g., foraging, roosting, daily [birds], and nightly [bats] dispersal and migration) over large geographical areas.
Moon-Watching, Ceilometer, Thermal Imaging, and Chemiluminescent Tags
Moon-Watching
One of the first techniques developed to observe bird migration at night was moon-watching (Lowery 1951; Lowery and Newman 1955). By directing a telescope of sufficient power (20-30×) toward the disc within two days of the full moon during periods of migration, it is possible to observe silhouettes of birds and bats (and an occasional insect) as they pass before the illuminated disc of the moon. By following clearly defined methods for making observations and analyzing data (Nisbet 1959, 1963a,b), one can quantify the magnitude of migration (migration-traffic rate) passing over an area, and an experienced observer can easily distinguish between birds and bats and even identify some birds to family. The migration-traffic rate (as originally defined by Lowery 1951) is the number of birds crossing a mile of front per hour up to 1 mile in altitude. A shortcoming of the technique is its limitation to the five-day periods from two days before to two days after full moon without an obscuring cloud cover.
Ceilometry
The need to visually investigate the overhead passage of nocturnal migration when no moon is visible prompted the development of additional techniques. Howell et al. (1954) and Graber and Hassler (1962) demonstrated that migrating birds could be observed with powerful light beams, and in 1965 and 1966, S. Gauthreaux made observations with 10× binoculars and a 20× telescope of nocturnal migration at fixed-beam ceilometers operated by the NWS at Lake Charles and at New Orleans, Louisiana. Fixed-beam ceilometers are intense, narrow light beams of almost a million candlepower. Although these instruments killed many birds during inclement weather (Gauthreaux and Belser 2006), observations of Gauthreaux showed that during fair weather very few birds were affected by the light; most flew through the beam without hesitation or deviation
in direction. No kills of migrants were recorded at either of the ceilometers during a two-year study.
Because fixed-beam ceilometers at airport weather stations were rapidly being replaced by rotating-beam devices that were unsuitable for migration studies, Gauthreaux (1969) constructed and tested a small, portable ceilometer for visual studies of nocturnal migration. The apparatus was inexpensive and easily constructed. Gauthreaux’s (1969) portable ceilometer is best suited for studies of bird migration below 760 m, and the technique can be used to compute quantitative estimates of nocturnal migrationtraffic rates (Able and Gauthreaux 1975; Gauthreaux 1980). Ceilometers have been used to quantify nocturnal bird migration in many different locations within the United States (e.g., Maine [Northrop et al. 1995a,b], New Hampshire [Williams et al. 2001], Vermont [Kerlinger 2002], North Dakota [Avery et al. 1976], California [McCrary et al. 1983]). The use of an image intensifier instead of binoculars or a telescope greatly enhances the detection of targets as they pass through the vertical light beam. An approach similar to this was used by Plissner et al. (2006), who made visual observations with Generation III night-vision goggles with a 1× eyepiece (Model ATN-PVS7, American Technologies Network Corporation) during nighttime radar sampling to determine relative numbers and proportions of birds and bats flying at altitudes at or below 150 m agl, the approximate maximal distance that passerines and bats could be distinguished. They used two 3-million-candlepower spotlights with infrared lens filters to illuminate targets flying overhead. The filters help prevent insects, birds, and bats from being attracted to the lights. They mounted a “fixed” spotlight on a tripod with the beam oriented vertically, and used a second, handheld light to track and identify targets flying through the fixed spotlight’s beam. During the study between August 16 and September 29, 2005, they found the proportions of birds and bats below maximal turbine height to be 88% and 12%, respectively.
Thermal Infrared Imaging
Although the ceilometer’s vertically pointing narrow beam of light did not appear to influence migrating birds or bats during fair weather, there was still concern that the light could possibly influence flight behavior. To address this problem the use of thermal infrared imaging cameras to monitor bird and bat movements aloft was explored. One of the advantages of thermal imaging over natural or artificial illumination is that thermal infrared cameras can detect warm objects independent of any visible or infrared light source (Hill and Clayton 1985). Thermal infrared cameras are designed to detect heat emitted by objects as long as they are warmer than the background, and thus these devices can be used at night and during the day (Figure C-6). A drawback to the widespread use of thermal imaging
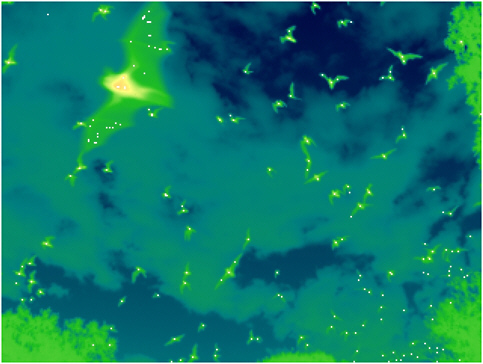
FIGURE C-6 Thermal infrared image of foraging Brazilian free-tailed bats in southcentral Texas.
SOURCE: Thomas Kunz, Boston University.
cameras for monitoring movements of birds, bats, and insects is the cost of the units. A single camera can range from $60,000-$120,000 depending on specifications (e.g., resolution and sensitivity) and lenses.
Thermal infrared imaging has been compared with other techniques (moon-watching and tracking radar) for detecting and monitoring aerial bird movements (Liechti et al. 1995), and the results suggest that a longrange thermal imaging unit (LORIS, IRTV-445L, Inframetrics) with a 1.45° telephoto lens could detect nearly 100% of the small passerines within 3000 m. The same unit has been used in southern Sweden to study fall bird migration (Zehnder and Karlsson 2001; Zehnder et al. 2001) and in Africa on the edge of the Sahara to study nocturnal bird migration across the desert (Liechti et al. 2003).
Thermal imaging has also been used to monitor bird movements near wind turbines (Winkelman 1992b; Desholm 2003). A thermal-imaging camera (UA 9053, Philips Usfa) with three different lenses was used to observe the flight behavior of nocturnal songbird migrants as they flew through land-based turbines in Holland (Winkelman 1992c). A 15° lens could detect
passerines out to a distance of 50-250 m and a pigeon out to 250-300 m. A 5° lens could detect a pigeon out to 600 m and a 3° lens could detect a duck out to 3 km. A long-wave (7-15 μm) thermal-imaging camera (Thermovision IRMV 320V, FLIR Systems 2000) was used for automatic detection of avian collisions at offshore wind-energy facilities by Desholm (2003). This device can be triggered automatically when a target is detected and can be aimed remotely (Desholm et al. 2004). Vertically pointing thermal-imaging cameras and fixed-beam radars were combined to monitor aerial bird, bat, and insect movements (Gauthreaux and Livingston 2006). The thermal imager and radar data are combined into a single video image (Figure C-7) and stored on digital video tape for analysis. This approach produced quantitative measures of migration-traffic rate for any combination of altitudinal bands, and the technique is useful for distinguishing birds from insects and foraging bats (Gauthreaux and Livingston 2006).
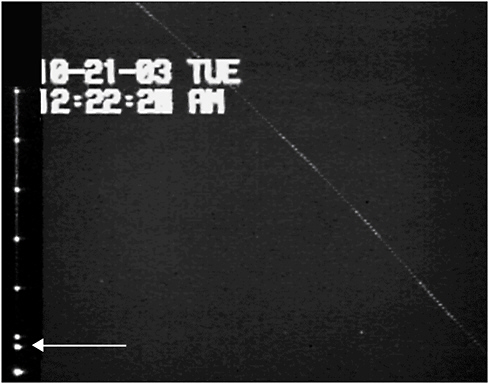
FIGURE C-7 Split video screen showing the vertical radar beam (left) and the field of view of the thermal imager (right). An arrow indicates the echo of a bird in the radar beam. The other marks in the radar beam are range marks over 463 m. The track of the bird as a thermal image is brighter when wings are open and duller when wings are closed. The target in this image is flying toward the southwest.
SOURCE: Sidney Gauthreaux, Clemson University.
Thermal infrared imaging has proven valuable for censusing roost sites for the presence and seasonal activity of bats near proposed or developed wind-energy facilities, as well as for observing their flight activity (commuting, foraging, and migratory activity) in the vicinity of wind turbines (Desholm 2003; Horn and Arnett 2005; Horn et al. in press). Coupled with portable computers, thermal images of flying bats, birds, and insects can be recorded and analyzed, making it possible to quantify flight trajectories as well as the relative densities of these animals in different landscapes.
Thermal infrared cameras were used at the Mountaineer Wind Energy Center in 2004 (Horn and Arnett 2005; Horn et al. in press) to investigate whether, when, where, and how bats were killed by the wind turbines. Three FLIR S-60 infrared thermal cameras were positioned at one of 44 wind turbines where the highest fatalities of bats were observed in 2003. Each camera was positioned to record images at overlapping locations that spanned the upper region of the monopole, the nacelle, and most of the rotor-swept zone (Figure C-8). The thermal images recorded in this study clearly indicated that bats were killed by direct contact with moving turbine blades. Additionally, the images showed some bats flying in the vicinity of
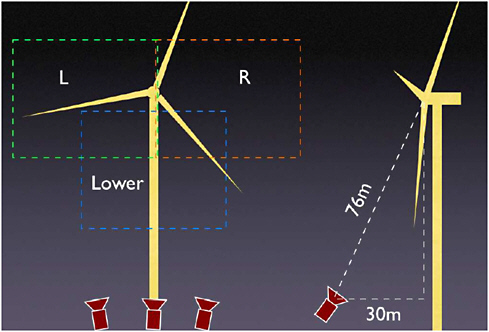
FIGURE C-8 Configuration of thermal infrared cameras (FLIR S-60) used to record the flight behavior of bats in the rotor-swept zone at a wind turbine at the Mountaineer Wind-Energy Center, Tucker County, West Virginia.
SOURCE: Horn et al. in press.
moving rotor blades, as if the bats were “inspecting” or being attracted to the blades, possibly by insects that also were in the vicinity of the rotors. Other images suggest that some bats may have followed the tips of the turbine blades, or were possibly caught in the blade-tip vortices (Figure C-9).
Because large numbers of insects accumulate on the surfaces of turbine blades at some localities (Corten and Veldkamp 2001), it is possible that insects may be attracted to the turbines. If so, wind turbines may be creating patches of aerial insects that bats feed on, a topic that needs additional research. Observations made with thermal-imaging cameras have recorded bats interacting with moving and stationary turbine rotors in various ways, and thus, images derived from thermal infrared cameras can provide valuable information on how bats interact with wind turbines and insects at these sites. Additional information of this type will be critical for identifying possible ways to mitigate the high fatality rates that have been observed and reported at various wind-energy facilities.
Thermal infrared-imaging cameras also can provide accurate and reliable census information about bats that roost in caves and similar structures, from which they emerge at dusk (Sabol and Hudson 1995; Frank
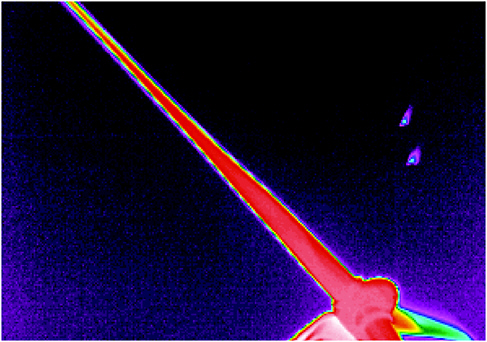
FIGURE C-9 Thermal infrared images of bats in the rotor-swept zone of a wind turbine at the Mountaineer Wind-Energy Center, Tucker County, West Virginia.
SOURCE: Adapted from Horn et al. in press.
et al. 2003; Betke et al. in press; Kunz et al. in press a). This type of information could be critical for assessing the long-term and cumulative impacts on bat colonies in the vicinity of proposed and developed wind-energy facilities. Recent developments of computer vision and tracking algorithms have advanced the ability to automatically census bats that roost in large colonies (Figure C-10) and also to record flight trajectories of foraging and migrating bats (Kunz 2004; Horn and Arnett 2005; Betke et al. in press; Horn et al. in press; Kunz et al. in press a).
Chemiluminescent Light Tags
Chemiluminescent light tags (Cyalume®, Cyalume Light Technologies 2006) also offer potential for observing the flight behavior of bats, including those flying in the vicinity of proposed and operational wind-energy facilities. Buchler (1976) and Buchler and Childs (1981) used chemiluminescent light tags to observe the dispersal, commuting, and foraging behavior of selected North American insectivorous bats. Other investigators (e.g., LaVal and LaVal 1980; Aldridge and Rautenbach 1987) also have used this technique with the greatest success rates when observations were made in open areas, in flyways, and along forest edges. Buchler and Childs (1981)
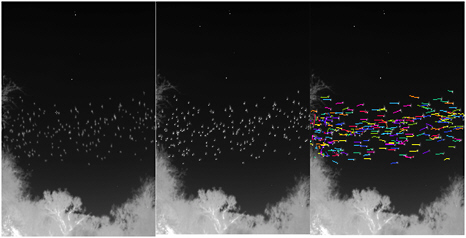
FIGURE C-10 Sequence showing thermal infrared image of Brazilian free-tailed bats emerging from Davis Blowout Cave in south-central Texas. “Left”: image as detected with Merlin mid thermal infrared camera; “Middle”: same image as in “Left” to which an automated detection algorithm was applied—identifying centroids; and “Right”: same image as “Left” and “Middle”, but with the automatic tracking algorithm applied.
SOURCE: Kunz et al. in press a.
observed the dispersal of light-tagged E. fuscus and postulated that individuals navigated to feeding grounds by following acoustic cues produced by calling frogs and stridulating insects. Use of chemiluminescent light tags may offer opportunities to observe the behavior of bats in response to sounds produced by moving wind-turbine blades or to insects that may be attracted to these structures. Light tags also have been used successfully to follow known individuals while their echolocation calls are monitored using ultrasonic detectors, and thus can be used to validate species-specific calls and therefore used to identity calling bats. The greatest limiting factor of using light tags to investigate flight behavior of bats is that they often quickly disappear from view, especially in heavily forested areas, and in some instances are difficult to distinguish from fireflies.
Radiotelemetry
Radiotelemetry has primarily been used to assess the roosting habits, foraging behavior, and home ranges of bats and birds, and less for assessing migratory behavior. The most comprehensive radiotelemetry study of birds associated with a wind-energy facility was Hunt’s (2002) four-year study of golden eagles at the APWRA. Hunt used telemetry to evaluate spatial and temporal use and to estimate reproduction and fatalities of a local population of golden eagles in northern California, and to relate these population parameters to impacts from the wind-energy facilities within the APWRA. Radiotelemetry generally has not been used to investigate migratory behavior of small bats and birds, largely because the detection ranges of most small transmitters are limited to a few kilometers. Nonetheless, some investigators have successfully used fixed-wing aircraft to follow dispersal movements of the endangered Indiana bats (Myotis sodalis) over considerable distances (C.W. Butchkoski, Pennsylvania Game Commission, personal communication 2006; J. Chenger, Bat Conservation and Management Inc., personal communication 2006; A. Hicks, New York Department of Environmental Conservation, personal communication 2006). The latter studies have shown that Indiana bats do fly along and actually cross over ridge tops in the eastern United States. Radiotracking by satellite telemetry currently is feasible only for birds and bats that are able to carry radiotransmitters weighing in excess of 10 g (Spencer et al. 1991; Eby 1991; Millspaugh and Marzliff 2001; Fleming and Eby 2003; Tidemann and Nelson 2004). In contrast, because of their small size, bat species from the Mid-Atlantic Highlands generally cannot carry transmitters heavier than 0.5 to 1.0 g and maintain normal flight behavior. Recent developments using satellite tracking of small vertebrates hold considerable promise for tracking small (~30 g) bats and birds (M. Wikelski, Princeton University, personal communication 2006).
Stable lsotopes and Genetic Markers
Stable isotopes used to assess geographic variation in patterns of precipitation and the unique stable-isotope signatures that are transferred from precipitation to biological primary producers (plants) and ultimately to consumers (herbivores and carnivores) have provided new tools for understanding migration of birds and bats (e.g., Chamberlain et al. 1997; Kelly and Finch 1998; Marra et al. 1998; Hobson 1999; Hobson and Wassenaar 2001; Bowen and Wilkinson 2002; Rubenstein et al. 2002; Rubenstein and Hobson 2004), and genetic data (Berthold 1991; Clegg et al. 2003; Royle and Rubenstein 2004; Kelly et al. 2005). Stable-isotope techniques have been used mostly to associate breeding areas (where molt to new plumage or hair growth or replacement occurs) to migratory stopover areas and wintering areas. The resolution of the signatures is rather crude with respect to latitude and longitude so that it may not be possible to precisely discriminate source areas within a small geographical region. However, as geographical distance increases so does the reliability of the isotope signature. Stable-isotope signatures are also sensitive to elevation; thus altitudinal migration may be confounded with latitudinal migration.
Analysis of stable isotopes shows promise in differentiating migratory status. Kelly et al. (2002) used stable isotopes of hydrogen contained in feathers to estimate hydrogen stable-isotope ratios (dD) of feathers from breeding, migrating, and wintering Wilson’s warblers (Wilsonia pusilla). They found that feathers from museum specimens collected throughout the western portion of the breeding range indicate that dD values were significantly and negatively related to latitude of collection, which is an indication that dD values provide a good descriptor of the latitude at which breeding occurs. They also found by analyzing feathers collected on the wintering grounds that the hydrogen isotope ratio was significantly positively related to wintering latitude. Gannes et al. (1997) pointed out the importance of identifying assumptions inherent in stable-isotope analysis and called for laboratory experiments to validate the method. Advances in genetic analysis also show promise in determining the population and geographical origin of individual birds (Webster et al. 2002), and may assist in identifying the origin of bird and bat fatalities at wind-energy facilities.
Mitochondrial and nuclear DNA markers have provided valuable for determining source populations of animals that move long distances. They could make it possible to identify geographic origin of bats and birds killed at wind-energy facilities if investigators collected hair samples from bats and feather samples from birds, and compared the isotope signatures and genetic markers on a geographic scale. This kind of information could aid in determining whether bats and birds killed at wind-energy facilities were residents or migrants. Moreover, established DNA sequences for different
species can aid in the identification of birds and bats (or parts thereof) from the carcass remains of individuals found during fatality searches.
CAPTURE TECHNIQUES
Capture methods are invaluable for assessing and confirming the presence of a species, although it may not be possible or practical to capture all species in an area. Some forage and migrate well above the practical limits of capture, although many species fly closer to ground level or forage over water or within the subcanopy of forests. While capture may be challenging for many nocturnal species, captures of migrating passerines are more likely during stopovers. Correct identification of species present in the area of interest is essential for assessing potential risks of wind-energy facilities to different species. For bats and migratory birds, this usually requires that live or dead animals be available for study.
Methods and equipment used to capture live bats have been thoroughly described (Greenhall and Paradiso 1968; Tuttle 1976; Kunz and Kurta 1988; Kunz et al. 1996a; Kunz et al. in press a). Methods for assessing colony size, demographics, and population status of bat species are in O’Shea and Bogan (2003) and Kunz and Parsons (in press) and methods for landbirds are in Sutherland et al. (2004). Many of the methods used to capture birds and bats are similar, albeit with some differences. If bats are to be captured at roost sites to assess the species present in the vicinity of wind-energy facilities, or to monitor changes in colony size, harp traps are preferable to mist nets (Kunz et al. in press a). Most important, efforts should be made to minimize disturbance to bat colonies. No single capture method is suitable for all bat species, although mist nets and harp traps are the most commonly used devices for capturing these animals while in flight because they are relatively easily deployed and can be used in a variety of situations.
A mist net consists of a nylon mesh supported by a variable number of taut, horizontal threads, or shelf strings. Bats and birds are captured after they become entangled in the mesh of the nets. Mist nets are available from manufacturers in different colors and sizes. For nighttime netting black is the preferred color. They may be set as single net at ground level or stacked on top of one another to form a canopy net (Figure C-11). Simple canopy nets can be modified by restringing horizontal nets (Munn 1991; Rinehart and Kunz 2001). Ground-level nets are generally most practical to deploy, but are biased against species or individuals that do not fly close to the ground. Use of elevated canopy nets can provide researchers access to the aerial space where some bats and birds may commute and forage, although even with canopy nets erected into or suspended in the subcanopy, elevated nets are not suitable for capturing species that typically fly above
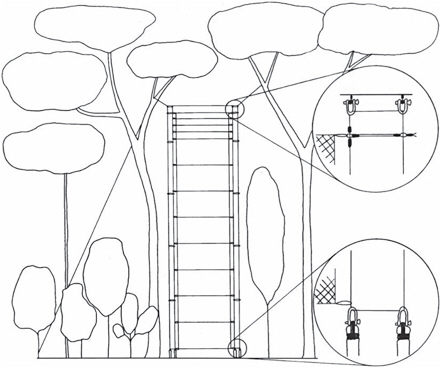
FIGURE C-11 Multiple stacked horizontal mist nets used for capturing bats and birds from ground level into the forest subcanopy.
SOURCE: Hodgkison et al. 2002. Reprinted with permission; copyright 2002, Global Canopy Programme.
the canopy. In these situations, other tools such as ultrasonic detectors and audible sound recordings may be more appropriate.
During pre-construction surveys where the local bat fauna and possible colony sizes are unknown, harp-trapping may be used successfully at expected or potential commuting, foraging, drinking, and roosting sites. Prior assessment of local topography, habitat structure (foliage density), and visual or acoustic surveys often can facilitate the selection of a potential capture site and the appropriate deployment of mist nets and harp traps.
VISUAL ESTIMATES OF OCCURRENCE AND USE
The most common approach to estimate species occurrence and relative abundance of diurnally active bird species is through visual observation (Ralph et al. 1993; Bibby et al. 2000). Quantification of abundance is achieved by sampling an area of interest, usually using line-transect
(Burnham et al. 1980) or point-count (Reynolds et al. 1980) sampling. The opportunity to estimate species-specific abundance and behavior is a valuable asset of visual-estimation methods. While this discussion is focused on visual surveys, the theory and application of line-transect and point-count sampling is well suited to nocturnal surveys using radar and other survey methods.
Line-transect sampling is typically applied with a line randomly or systematically located on a baseline as the basic sampling unit, and is extended across the study region (Morrison et al. 2001). Objects on either side of the line are recorded based on some rule of inclusion. Line-transect sampling, where an effort is made to count all organisms within a certain distance, is equivalent to a belt transect (or rectangular plot). When surveys are completed according to a standard protocol, without correction for detection bias, the counts can be considered an index of abundance (e.g., Conroy et al. 1988). Line-transect counts are most often considered incomplete when used to estimate absolute abundance, because objects are always missed and the probability of detection must be estimated. The theory and application of this sampling method have received much attention in the scientific literature (e.g., Burnham et al. 1980; Buckland et al. 1993; Manly et al. 1996; Quang and Becker 1996, 1997; Beavers and Ramsey 1998). Line transects are commonly used in bird surveys and are best suited to grassland and shrub-steppe landscapes.
Counts from a variable circular plot often are applied as a variation of the line-transect sampling method for estimating the number of birds in an area (Reynolds et al. 1980). The variable circular plot is more useful than the line transect in dense vegetation and rough terrain, where attention may be diverted from the survey and toward simply negotiating the transect line (Morrison et al. 2001). One major advantage of the circular plot is that the observer can allow the subjects of the counts to become accustomed to the observer. In breeding-bird surveys (Reynolds et al. 1980), observers wait several minutes after their arrival at a point before counts begin. Stationary surveys also allow the observer to use both visual and auditory senses to detect birds. Program DISTANCE (Laake et al. 1993) can be used to estimate densities from circular-plot data (see also Rosenstock et al. 2002). Johnson et al. (2000b) described the use of circular plots in the estimate of relative abundance of songbirds from small plots (i.e., 100-m radius) and large birds from larger plots (i.e., 0.8 km) in pre-project studies at the proposed Buffalo Ridge wind-energy facility in southwestern Minnesota.
Estimates of Fatalities
Fatalities are typically estimated from carcasses located on standardized search plots at turbines, turbine strings, meteorological towers, and refer-
ence areas. Search plots at wind-energy facilities may take many shapes from circular to rectangular and typically contain one or more turbines, depending on the spacing of individual turbines. Plot boundaries are delineated at a minimum distance from the turbines, usually based on the size of the turbine. Plots most often are circular or elliptical and are centered on the turbine or turbine string, with the edge of the plot from 30 to 100 m from the nearest turbine. Studies conducted at wind-energy facilities in Oregon (Erickson et al. 2000, 2003b), Minnesota (Johnson et al. 2003a), Wyoming (Young et al. 2003b), and Washington (Erickson et al. 2003a) found most dead bats (more than 80%) within one half the maximum distance from the tip height to the ground from the monopole of the turbine. Arnett (2005) found that 93% of all fatalities at the Mountaineer site and 84% of all the fatalities at Myersdale were found less than or at 40 m from the nearest turbine. At both sites, fewer than 3% of fatalities were found more than 50 m from the nearest turbine. Preliminary evaluation of the distribution of bird carcasses within search plots at the Stateline wind-energy facility in Oregon and Washington (Erickson et al. 2004) suggests that bird carcasses occur further from turbines than bats. However, few birds were located on the periphery of the 63-m-radius search plots, and thus may not represent what actually occurs. At the Mountaineer wind-energy Center in West Virginia, Kerns and Kerlinger (2004) searched out to 60 m from the base of each tower and found birds and bats out to 60 m, although the majority of the carcasses were between 16 and 30 m of the base of turbine towers. The size of search plots should increase with turbine height and diameter of the rotor, using a minimum plot radius approximately equal to diameter of the rotor. Turbine plots to be searched should be selected through a probabilistic sampling process allowing extrapolation to the entire wind-energy facility, after considering variation in topography and type of vegetation present at each site. A systematic selection process with a random start is the most effective method for most sites (Morrison et al. 2001).
Personnel trained in proper search techniques typically conduct standardized carcass searches by walking parallel transects within the search plot at a predetermined speed. The cause of death of each carcass should be determined so that fatalities determined not to be related to the wind-energy facility could be discounted. Suggested criteria for identifying bird and bat remains as a bird or bat carcass are:
-
Intact: A carcass that is completely intact, is not badly decomposed and shows no sign of being fed upon by a predator or scavenger.
-
Scavenged: An entire carcass that shows signs of being eaten by a predator or scavenger, or portions of a carcass in one location (e.g., wings, skeletal remains, legs, pieces of skin, etc.).
And for birds only:
-
Feather Spot: 10 or more feathers at one location indicating predation or scavenging.
Some bat and bird fatalities that are discovered and used in fatalityrate estimation may not be related to wind-energy projects, even though the cause of death cannot be determined. Natural mortality and predation may be responsible, but the level of this background mortality in project areas typically has not been studied. However, background fatalities can be significant. For example, of the 86 avian fatalities found during a four-year study at the Buffalo Ridge wind-energy facility in Minnesota, Johnson et al. (2002) found 31 fatalities (36%) at reference plots. Thus, including background fatalities in calculations of fatality estimates may contribute to overestimation of project-related fatality rates, particularly for smaller species. By contrast, failure to detect bird and bat fatalities outside a designated search area may underestimate fatality rates. Care should be taken to insure that fatality counts at reference and turbine plots are independent.
Carcass Survey Biases
Carcass searchers no doubt fail to locate some carcasses in search plots. Carcass detection is affected by topography, vegetation within the plot, the size of the search plot, size of the remains of the bird or bat, climate, weather, and observer skill. Observer-detection bias or searcher-efficiency studies are necessary to estimate the percentage of actual bird and bat fatalities that searchers are able to find (Anderson et al. 1999). Typically, these studies are conducted in the same area in which standardized searches occur and thus should include all habitat types. Trials should be conducted in each season in each monitoring year. Search efficiency can be improved when trained dogs are used to find carcasses (Arnett 2006). Estimates of observer-detection rates are used to adjust the number of carcasses found for detection bias.
Carcasses also may be removed from search plots before they are searched. This removal is most often by scavengers, but carcasses could be removed by other causes (e.g., human activity, wind). Carcass-removal bias is estimated by conducting experimental studies that estimate the length of time bird and bat carcasses remain in the search area before being removed by scavengers or other means. Carcass-removal studies should be conducted during each season of each monitoring year in the vicinity of, but not on the search plots. Estimates of carcass removal are used to adjust carcass counts for removal bias. Daily searches are essential when evaluating carcass removal of bats. Arnett (2005) estimated that 35% of randomly placed test
carcasses were removed with the first 24 hours, 48% were removed within 48 hours, and by the 18th day more than 90% of the test carcasses were removed. The rate of removal for small birds appears to be less than for bats, and weekly or biweekly searches for birds may be adequate. The mean duration for small-bird test carcasses have ranged from 4.69 days at Buffalo Ridge (Johnson et al. 2003a) to 16.7 days at Stateline (Erickson et al. 2004). Scavenging rates may differ seasonally and from year to year following construction of wind-energy facilities. It is possible that scavenging may actually increase because scavengers develop search images and return to sites more frequently once carcasses have been discovered.
Carcass-removal and searcher-detection trials use carcasses placed in areas either in plots used in standardized searches (searcher detection trials) or in nearby areas of similar characteristics (carcass removal trials). Carcasses of varying sizes should be placed in most of the habitats being searched. Carcasses of native bats and birds found within the wind-energy facility are ideal for use. The experimental placement of frozen instead of fresh carcasses and using birds as surrogates for bats may contribute to biases in estimated removal rates. Ideally, fresh carcasses should be used in these experiments, because they more closely mimic what occurs near a wind turbine. However, adequate supplies of native bats and birds are seldom available and surrogate carcasses may be used, even though this approach may yield biased results. The efficacy of using surrogate carcasses and fresh versus frozen specimens needs further investigation.
STATISTICAL METHODS FOR FATALITY ESTIMATES
Methods for estimation of the total number of wind-facility-related fatalities are taken from Erickson et al. (2004) and are based on:
-
Observed number of bat and bird carcasses found during standardized searches for which the cause of death is either unknown or is probably facility-related;
-
Searcher efficiency expressed as the proportion of planted carcasses found by searchers during the entire survey period; and,
-
Non-removal rates expressed as the estimated average probability that a carcass will remain in the study area and be available for detection by the searchers during the entire survey period.
Definition of Variables
The following variables are used in equations (1-3) below:
|
ci |
number of carcasses detected at plot I for the study period of inter |
|
|
est (e.g., one year) for which the cause of death is either unknown or is attributed to the facility |
|
n |
number of search plots |
|
k |
number of turbines searched (includes the turbines centered within each search plot and a proportion of the number of turbines adjacent to search plots to account for the effect of adjacent turbines within the arch plot buffer area) |
|
c |
average number of carcasses observed per turbine per year |
|
s |
number of carcasses used in removal trials |
|
sc |
number of carcasses in removal trials that remain in the study area after 40 days |
|
se |
standard error (square of the sample variance of the mean) |
|
ti |
time (days) a carcass remains in the study area before it is removed |
|
t |
average time (days) a carcass remains in the study area before it is removed |
|
d |
total number of carcasses placed in searcher efficiency trials |
|
p |
estimated proportion of detectable carcasses found by searchers |
|
I |
average interval between searches in days |
|
|
estimated probability that a carcass is both available to be found during a search and is found |
|
m |
estimated annual average number of fatalities per turbine per year, adjusted for removal and observer-detection bias |
Observed Number of Carcasses
The estimated average number of carcasses ![]() observed per turbine per year is:
observed per turbine per year is:

(1)
Estimation of Carcass Removal
Estimates of carcass removal are used to adjust carcass counts for removal bias. Mean carcass-removal time ![]() is the average length of time a carcass remains at the site before it is removed:
is the average length of time a carcass remains at the site before it is removed:

(2)
This estimator is the maximum-likelihood estimator assuming the removal times follow an exponential distribution. When the estimate is that no
carcasses will be left, the collection of data ends,or is censored. The probability of finding a carcass decreases with time, by convention to the right from the origin,and thus the data are said to be “right-censored.” Erickson et al.(2004) collected trial bird carcasses still remaining at 40 days, yielding censored observations at 40 days. If all trial bird carcasses are removed before the end of the trial, then sc is 0, and ![]() is simply the arithmetic average of the removal times. For bats,carcasses were monitored every day for 20 days. Removal rates are estimated by carcass size (small and large) and season.
is simply the arithmetic average of the removal times. For bats,carcasses were monitored every day for 20 days. Removal rates are estimated by carcass size (small and large) and season.
Estimation of Observer-Detection Rates
Observer-detection rates (i.e., searcher-efficiency rates) are expressed as p, the proportion of trial carcasses that are detected by searchers. Observer-detection rates are estimated by carcass size and season.
Estimation of Facility-Related Fatality Rates
The estimated per-turbine annual fatality rate (m) is calculated by:
(3)
where ![]() includes adjustments for both carcass removal (from scavenging and other means) and observer-detection bias assuming that the carcass removal times
includes adjustments for both carcass removal (from scavenging and other means) and observer-detection bias assuming that the carcass removal times ![]() follow an exponential distribution. Data for carcass removal and observer-detection bias are pooled across the study to estimate
follow an exponential distribution. Data for carcass removal and observer-detection bias are pooled across the study to estimate ![]() . Under these assumptions, this detection probability is estimated by
. Under these assumptions, this detection probability is estimated by
(4)
This equation has been independently verified by Shoenfeld (2004).
Fatality estimates should be calculated for the species and size class of interest. Erickson et al. (2004) used 7 groups including all birds, small birds, large birds, raptors, grassland birds, nocturnal migrants, and bats. The final reported estimates of fatalities and associated standard errors and 90% confidence intervals can be calculated using bootstrapping (Manly 1997), a computer-simulation technique that is useful for calculating point estimates, variances, and confidence intervals for complex test statistics.
3
TABLE C-5 Neotropical Migrant Species that Have Shown a Negative Population Trend During the Time Period 1978-1987
|
Common Name |
Scientific Name |
Trend, %/year |
|
Broad-winged Hawk |
Buteo platypterus |
–2.3 |
|
Black-billed Cuckoo |
Coccyzus erythrophthalmus |
–5.9 |
|
Yellow-billed Cuckoo |
Coccyzus americanus |
–5.0 |
|
Chuck-will’s Widow |
Caprimulgus carolinensis |
–2.0 |
|
Whip-poor-will |
Caprimulgus vociferus |
–0.8 |
|
Olive-sided Flycatchera |
Contopus borealis |
–5.7 |
|
Eastern Wood-peweea |
Contopus virens |
–0.7 |
|
Acadian Flycatcher |
Empidonax virescens |
–1.3 |
|
Least Flycatchera |
Empidonax minimus |
–0.2 |
|
Great crested Flycatchera |
Myiarchus crinitus |
–0.3 |
|
Veerya |
Catharus fuscescens |
–2.4 |
|
Swainson’s Thrusha |
Catharus ustulatus |
–0.2 |
|
Wood Thrusha |
Hylocichla mustelina |
–4.0 |
|
Gray Catbird |
Dumetella carolinensis |
–1.4 |
|
White-eyed Vireo |
Vireo griseus |
–1.2 |
|
Solitary Vireoa |
Vireo solitarius |
–0.1 |
|
Yellow-throated Vireo |
Vireo flavifrons |
–0.9 |
|
Blue-winged Warbler |
Vermivora pinus |
–1.0 |
|
Golden-winged Warblera |
Vermivora chrysoptera |
–1.9 |
|
Tennessee Warbler |
Vermivora peregrina |
–11.6 |
|
Northern Parula |
Parula americana |
–2.1 |
|
Chestnut-sided Warblera |
Dendroica pensylvanica |
–3.8 |
|
Cape May Warbler |
Dendroica tigrina |
–2.3 |
|
Black-throated Green Warblera |
Dendroica virens |
–3.1 |
|
Blackburnian Warblera |
Dendroica fusca |
–1.1 |
|
Yellow-throated Warbler |
Dendroica dominica |
–0.4 |
|
Prairie Warbler |
Dendroica discolor |
–0.4 |
|
Bay-breasted Warbler |
Dendroica castanea |
–15.8 |
|
Blackpoll Warbler |
Dendroica striata |
–6.3 |
|
Cerulean Warblera |
Dendroica cerulea |
–0.9 |
|
American Redstarta |
Setophaga ruticilla |
–1.2 |
|
Worm-eating Warblera |
Helmitheros vermivorus |
–2.0 |
|
Ovenbirda |
Seiurus aurocapillus |
–1.0 |
|
Louisiana Waterthrush |
Seiurus motacilla |
–0.4 |
|
Kentucky Warblera |
Oporornis formosus |
–1.6 |
|
Mourning Warblera |
Oporornis philadelphia |
–1.6 |
|
Common Yellowthroat |
Geothlypis trichas |
–1.9 |
|
Wilson’s Warbler |
Wilsonia pusilla |
–6.5 |
|
Canada Warblera |
Wilsonia canadensis |
–2.7 |
|
Summer Tanager |
Piranga rubra |
–0.8 |
|
Scarlet Tanagera |
Piranga olivacea |
–1.2 |
|
Rose-breasted Grosbeaka |
Pheucticus ludovicianus |
–1.4 |
|
Indigo Bunting |
Passerina cyanea |
–0.7 |
|
Baltimore Oriole |
Icterus galbula |
–2.9 |
|
aDenotes species that breed in the Mid-Atlantic Highlands. All others are known from migration records only. SOURCES: Data from Robbins et al. (1989); breeding status follows Hall (1983) and Buckelew and Hall (1994). |
||
TABLE C-6 Bird Species of Conservation Concern that Potentially Occupy Ridge-Top Habitats in the Mid-Atlantic Highlandsa
|
Common Name |
Scientific Name |
Statusb |
|
Bald Eagle |
Haliaeetus leucocephalus |
MD-T |
|
Peregrine Falcon |
Falco peregrinus |
MD-I, VA-T, PA-E |
|
Northern Goshawk |
Accipter gentilis |
MD-E |
|
Olive-sided Flycatcher |
Contopus cooperi |
MD-E |
|
Alder Flycatcher |
Empidonx alnorum |
MD-I, VA-SC |
|
Sedge Wren |
Cistothorus platensis |
MD-E, VA-SC, PA-E |
|
Winter Wren |
Troglodytes troglodytes |
VA-SC |
|
Appalachian Bewick’s Wren |
Thyromanes bewickii altus |
VA-E |
|
Golden-crowned Kinglet |
Regulus satrapa |
VA-SC |
|
Red-breasted Nuthatch |
Sitta canadensis |
VA-SC |
|
Blackburnian Warbler |
Dendroica fusca |
MD-T |
|
Blackpoll Warbker |
Dendroica striata |
PA-E |
|
Magnolia Warbler |
Dendroica magnolia |
VA-SC |
|
Swainson’s Warbler |
Limnothlypis swainsonii |
MD-E, VA-SC |
|
Mourning Warbler |
Oporornis philadelphia |
MD-E, VA-SC |
|
Nashville Warbler |
Vermivora ruficapilla |
MD-I |
|
Hermit Thrush |
Catharus guttatus |
VA-SC |
|
Red Crossbill |
Loxia curvirostra |
VA-SC |
|
aWV has no statutes requiring the development of State Endangered and Threatened species lists. bMD = Maryland, PA = Pennsylvania, VA = Virginia, E = Endangered, T = Threatened, SC = “Species of Special Concern”, I = “In Need of Conservation.” SOURCES: VA (Roble 2006), MD (MDDNR 2003), PA (PAGC 2006). |
||
BIRD SPECIES OF CONCERN FOR THE MID-ATLANTIC HIGHLANDS
Concern exists regarding the status of a number of bird species potentially occurring in the Mid-Atlantic Highlands. Table C-5 contains a list of neotropical-migrant bird species and Table C-6 contains a list of bird species of conservation concern. Because such species should receive careful attention when considering the impacts of a proposed wind-energy facility for the Mid-Atlantic Highlands. These lists should be updated as the status of these and other species changes.


