Appendix B
NRC Phase II and Firm Surveys
The first section of this appendix describes the methodology used to survey Phase II SBIR awards (or contracts.) The second part presents the results—first of the awards and then of the firm survey. (Appendix C presents the Phase I survey.)
ABOUT THE SURVEYS
Starting Date and Coverage
The survey of SBIR Phase II awards was administered in 2005, and included awards made through 2001. This allowed most of the Phase II awarded projects (nominally two years) to be completed, and provided some time for commercialization. The selection of the end date of 2001 was consistent with a GAO study, which in 1991, surveyed awards made through 1987.
A start date of 1992 was selected. The year 1992 for the earliest Phase II project was considered a realistic starting date for the coverage, allowing inclusion of the same (1992) projects as the DoD 1996 survey, and of the 1992, and 1993 projects surveyed in 1998 for SBA. This adds to the longitudinal capacities of the study. The 10 years of Phase II coverage spanned the period of increased funding set-asides and the impact of the 1992 reauthorization. This time frame allowed for extended periods of commercialization and for a robust spectrum of economic conditions. Establishing 1992 as the cut-off date for starting the survey helped to avoid the problem that older awards suffer from several problems, including meager early data collection as well as potentially irredeemable data loss; the fact that some firms and PIs are no longer in place; and fading memories.
Award Numbers
While adding the annual awards numbers of the five agencies would seem to define the larger sample, the process was more complicated. Agency reports usually involve some estimating and anticipation of successful negotiation of selected proposals. Agencies rarely correct reports after the fact. Setting limitations on the number of projects to be surveyed from each firm required knowing how many awards each firm had received from all five agencies. Thus, the first step was to obtain all of the award databases from each agency and combine them into a single database. Defining the database was further complicated by variations in firm identification, location, phone numbers, and points of contact within individual agency databases. Ultimately, we determined that 4,085 firms had been awarded 11,214 Phase II awards (an average of 2.7 Phase II awards per firm) by the five agencies during the 1992–2001 time frame. Using the most recent awards, the firm information was updated to the most current contact information for each firm.
Sampling Approaches and Issues
The Phase II survey used an array of sampling techniques, to ensure adequate coverage of projects to address a wide range both of outcomes and potential explanatory variables, and also to address the problem of skew. That is, a relatively small percentage of funded projects typically account for a large percentage of commercial impact in the field of advanced, high-risk technologies.
-
Random samples. After integrating the 11,214 awards into a single database, a random sample of approximately 20 percent was sampled. Then a random sample of 20 percent was ensured for each year; e.g., 20 percent of the 1992 awards, of the 1993 awards, etc. Verifying the total sample one year at a time allowed improved ability to adapt to changes in the program over time, as otherwise the increased number of awards made in recent years might dominate the sample.
-
Random sample by agency. Surveyed awards were grouped by agency; additional respondents were randomly selected as required to ensure that at least 20 percent of each agency’s awards were included in the sample.
-
Firm surveys. After the random selection, 100 percent of the Phase IIs that went to firms with only one or two awards were polled. These are the hardest firms to find for older awards. Address information is highly perishable, particularly for earlier award years. For firms that had more than two awards, 20 percent were selected, but no less than two.
-
Top performers. The problem of skew was dealt with by ensuring that all Phase IIs known to meet a specific commercialization threshold (total of $10 million in the sum of sales plus additional investment) were surveyed (derived from the DoD commercialization database). Since 56 percent of all awards were
-
in the random and firm samples described above, only 95 Phase IIs were added in this fashion.
-
Coding. The project database tracks the survey sample, which corresponds with each response. For example, it is possible for a randomly sampled project from a firm that had only two awards to be a top performer. Thus, the response could be analyzed as a random sample for the program, a random sample for the awarding agency, a top performer, and as part of the sample of single or double winners. In addition, the database allows examination of the responses for the array of potential explanatory or demographic variables.
-
Total number of surveys. The approach described above generated a sample of 6,410 projects, and 4,085 firm surveys—an average of 1.6 award surveys per firm. Each firm receiving at least one project survey also received a firm survey. Although this approach sampled more than 57 percent of the awards, multiple-award winners, on average, were asked to respond to surveys covering about 20 percent of their projects.
Administration of the Survey
The questionnaire drew extensively from the one used in the 1999 National Research Council assessment of SBIR at the Department of Defense, The Small Business Innovation Research Program: An Assessment of the Department of Defense Fast Track Initiative.1 That questionnaire in turn built upon the questionnaire for the 1991 GAO SBIR study. Twenty-four of the 29 questions on the earlier NRC study were incorporated. The researchers added 24 new questions to attempt to understand both commercial and noncommercial aspects, including knowledge base impacts, of SBIR, and to gain insight into impacts of program management. Potential questions were discussed with each agency, and their input was considered. In determining questions that should be in the survey, the research team also considered which issues and questions were best examined in the case studies and other research methodologies. Many of the resultant 33 Phase II Award survey questions and 15 Firm Survey questions had multiple parts.
The surveys were administered online, using a Web server. The formatting, encoding, and administration of the survey was subcontracted to BRTRC, Inc., of Fairfax, VA.
There are many advantages to online surveys (including cost, speed, and possibly response rates). Response rates become clear fairly quickly, and can rapidly indicate needed follow up for nonrespondents. Hyperlinks provide amplifying information, and built-in quality checks control the internal consistency of the responses. Finally, online surveys allow dynamic branching of question sets,
with some respondents answering selected subsets of questions but not others, depending on prior responses.
Prior to the survey, we recognized two significant advantages of a paper survey over an online one. For every firm (and thus every award), the agencies had provided a mailing address. Thus, surveys could be addressed to the firm president or CEO at that address. That senior official could then forward the survey to the correct official within the firm for completion. For an online survey we needed to know the email address of the correct official. Also, each firm needed a password to protect its answers. We had an SBIR Point of Contact (POC) and email address and password for every firm, which had submitted for a DoD SBIR 1999 survey. However, we had only limited email addresses and no passwords for the remainder of the firms. For many, the email addresses that we did have were those of Principal Investigators rather than an official of the firm. The decision to use an online survey meant that the first step of survey distribution was an outreach effort to establish contact with the firms.
Outreach by Mail
This outreach phase began with the establishing a NAS registration Web site which allowed each firm to establish a POC, email address and password. Next, the Study Director, Dr. Charles Wessner, sent a letter to those firms for which email contacts were not available. Ultimately only 150 of the 2,0802 firms provided POC/email after receipt of this letter. Six hundred fifty of those letters were returned by the post office as invalid addresses. Each returned letter required thorough research by calling the agency provided phone number for the firm, then using the Central Contractor Registration database, Business.com (powered by Google) and Switchboard.com to try to find correct address information. When an apparent match was found, the firm was called to verify that it was in fact the firm, which had completed the SBIR. Two hundred thirty-seven of the 650 missing firms were so located. Another ten firms were located which had gone out of business and had no POC.
Two months after the first mailing, a second letter from the Study Director went to firms whose first letter had not been returned, but which had not yet registered a POC. This letter also went to 176 firms, which had a POC email, but no password, and to the 237 newly corrected addresses. The large number of letters (277) from this second mailing that were returned by the postal service, indicated that there were more bad addresses in the first mailing than indicated by its returned mail. (If the initial letter was inadvertently delivered, it may have been thrown away.) Of the 277 returned second letters, 58 firms were located using the search methodology described above. These firms were asked on the
phone to go to the registration Web site to enter POC/email/password. A total of 93 firms provided POC/email/password on the registration site subsequent to the second mailing. Three additional firms were identified as out of business.
The final mailing, a week before survey, was sent to those firms that had not received either of the first two letters. It announced the study/survey and requested support of the 1,888 CEOs for which we had assumed good POC/email information from the DoD SBIR submission site. That letter asked the recipients to provide new contact information at the DoD submission site if the firm information had changed since their last submission. One hundred seventy-three of these letters were returned. We were able to find new addresses for 53 of these, and ask those firms to update their information. One hundred fifteen firms could not be found and five more were identified as out of business.
The three mailings had demonstrated that at least 1,100 (27 percent) of the mailing addresses were in error, 734 of which firms could not be found, and 18 were reported to be out of business.
Outreach by Email
We began Internet contact by emailing the 1,888 DoD Points of Contact (POCs) to verify their email and give them opportunity to identify a new POC. Four hundred ninety-four of those emails bounced. The next email went to 788 email addresses that we had received from agencies as PI emails. We asked that the PI have the correct company POC identify themselves at the NAS Update registration site. One hundred eighty-eight of these emails bounced. After more detailed search of the list used by NIH to send out their survey, we identified 83 additional PIs and sent them the PI email discussed above. Email to the POCs not on the DoD Submission site resulted in 110 more POC/email/Password being registered on the NAS registration site.
We began the survey at the end of February with an email to 100 POCs as a beta test and followed that with another email to 2,041 POCs (total of 2,141) a week later.
Survey Responses
By August 5, 2005, five months after release of the survey, 1,239 firms had begun and 1,149 firms had completed at least 14 of 15 questions on the firm survey. Project surveys were begun on 1,916 Phase II awards. Of the 4,085 firms that received Phase II SBIR awards from DoD, NIH, NASA, NSF, or DoE from 1992 to 2001, an additional seven firms were identified as out of business (total of 25) and no email addresses could be found for 893. For an additional 500 firms, the best email addresses that were found were also undeliverable. These 1,418 firms could not be contacted, thus had no opportunity to complete the surveys. Of these
TABLE App-B-1 NRC Phase II Survey Responses by Agency, August 4, 2005
|
Agency |
Phase II Sample Size |
Awards with Good Email Addresses |
Percent of Sample Awards with Good Email Addresses |
Answered Survey as of August 4, 2005 |
Surveys as a Percent of Sample |
Surveys as a Percent of Awards Contacted |
|
DoD |
3,055 |
2,191 |
72 |
920 |
30 |
42 |
|
NIH |
1,680 |
1,127 |
67 |
496 |
30 |
44 |
|
NASA |
779 |
534 |
69 |
181 |
23 |
34 |
|
NSF |
457 |
336 |
74 |
162 |
35 |
48 |
|
DoE |
439 |
335 |
76 |
157 |
36 |
47 |
|
Total |
6,408 |
4,523 |
70 |
1,916 |
30 |
42 |
firms, 585 had mailing addresses known to be bad. The 1,418 firms that could not be contacted were responsible for 1,885 of the individual awards in the sample.
Using the same methodology as the GAO had used in the 1992 report of their 1991 survey of SBIR, undeliverables and out-of-business firms were eliminated prior to determining the response rate. Although 4,085 firms were surveyed, 1,418 firms were eliminated as described. This left 2,667 firms, of which 1,239 responded, representing a 46 percent response rate by firms,3 which could respond. Similarly when the awards, which were won by firms in the undeliverable category, were eliminated (6,408 minus 1,885), this left 4,523 projects, of which 1,916 responded, representing a 42 percent response rate. Table App-B-1 displays by agency the number of Phase II awards in the sample, the number of those awards, which by having good email addresses had the opportunity to respond, and the number that responded.4 Percentages displayed are the percentage of awards with good addresses, the percentage of the sample that responded, and the responses as a percentage of awards with the opportunity to respond.
The NRC Methodology report had assumed a response rate of about 20 percent. Considering the length of the survey and its voluntary nature, the rate achieved was relatively high and reflects both the interest of the participants in the SBIR program and the extensive follow-up efforts. At the same time, the possibility of response biases that could significantly affect the survey results must be recognized. For example, it may be possible that some of the firms that could not be found have been unsuccessful and folded. It may also be possible that unsuccessful firms were less likely to respond to the survey.
|
3 |
Firm information and response percentages are not displayed in Table App-B-1, which displays by agency, since many firms received awards from multiple agencies. |
|
4 |
The average firm size for awards, which responded, was 37 employees. Nonresponding awards came from firms that averaged 38 employees. Since responding Phase IIs were more generally more recent than nonresponding, and awards have gradually grown in size, the difference in average award size ($655,525 for responding and $649,715 for nonresponding) seems minor. |
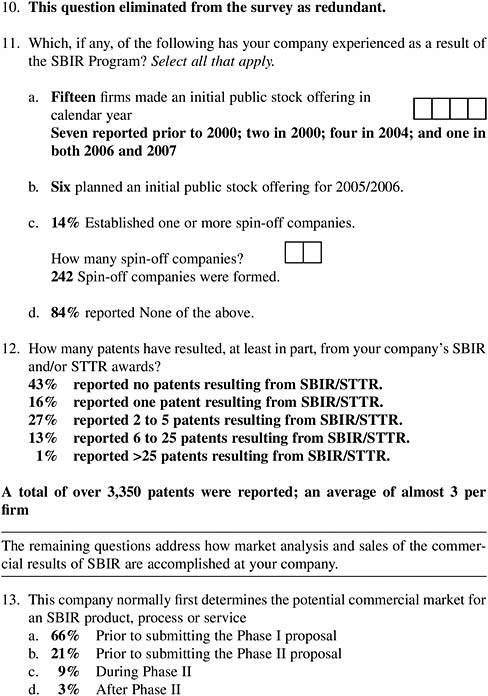
NRC Phase II Survey Results for DoD
NOTE: SURVEY RESPONSES APPEAR IN BOLD, AND EXPLANATORY NOTES APPEAR IN TYPEWRITER FONT. FOR FURTHER DETAIL AND ANALYSIS OF SURVEY RESULTS, SEE APPENDIX A.
Project Information 920 respondents answered the first question. Since respondents are directed to skip certain questions based on prior answers, the number that responded varies by question. Also some respondents did not complete their surveys. 837 completed all applicable questions. For computation of averages, such as average sales, the denominator used was 920, the number of respondents who answered the first question. Where appropriate, the basis for calculations is provided in red after the question.
PROPOSAL TITLE:
AGENCY: DoD
TOPIC NUMBER:
PHASE II CONTRACT/GRANT NUMBER:
Part I. Current status of the Project
-
What is the current status of the project funded by the referenced SBIR award? Select the one best answer. Percentages are based on the 920 respondents who answered this question.
|
a. |
5% |
Project has not yet completed Phase II. Go to question 21 |
|
b. |
23% |
Efforts at this company have been discontinued. No sales or additional funding resulted from this project. Go to question 2 |
|
c. |
10% |
Efforts at this company have been discontinued. The project did result in sales, licensing of technology, or additional funding. Go to question 2 |
|
d. |
27% |
Project is continuing post-Phase II technology development. Go to question 3 |
|
e. |
16% |
Commercialization is underway. Go to question 3 |
|
f. |
20% |
Products/Processes/Services are in use by target population/customer/consumers. Go to question 3 |
-
Did the reasons for discontinuing this project include any of the following?
PLEASE SELECT YES OR NO FOR EACH REASON AND NOTE THE ONE PRIMARY REASON
300 projects were discontinued. The % below are the percent of the discontinued projects that responded with the indicated response.
|
|
Yes |
No |
Primary Reason |
|
a. Technical failure or difficulties |
26% |
74% |
10% |
|
b. Market demand too small |
57% |
43% |
26% |
|
c. Level of technical risk too high |
19% |
81% |
3% |
|
d. Not enough funding |
56% |
44% |
20% |
|
e. Company shifted priorities |
32% |
68% |
7% |
|
f. Principal investigator left |
12% |
88% |
2% |
|
g. Project goal was achieved (e.g., prototype delivered for federal agency use) |
59% |
41% |
10% |
|
h. Licensed to another company |
4% |
96% |
2% |
|
i. Product, process, or service not competitive |
24% |
76% |
3% |
|
j. Inadequate sales capability |
20% |
80% |
3% |
|
k. Other (please specify): _____________________________ |
22% |
78% |
13% |
The next question to be answered depends on the answer to question 1. If c, go to question 3. If b, skip to question 16.
Part II. Commercialization activities and planning.
|
Questions 3–7 concern actual sales to date resulting from the technology developed during this project. Sales includes all sales of a product, process, or service, to federal or private sector customers resulting from the technology developed during this Phase II project. A sale also includes licensing, the sale of technology or rights, etc. |
-
Has your company and/or licensee had any actual sales of products, processes, services or other sales incorporating the technology developed during this project? Select all that apply. This question was not answered for those projects still in Phase II (5%) or for projects, which were discontinued without sales or additional funding (23%). The denominator for the percentages below is all projects that answered the survey. Only 72% of all projects, which answered the survey, could respond to this question.
|
a. |
18% |
No sales to date, but sales are expected Skip to question 8. |
|
b. |
8% |
No sales to date nor are sales expected Skip to question 11. |
|
c. |
35% |
Sales of product(s) |
|
d. |
6% |
Sales of process(es) |
|
e. |
20% |
Sales of services(s) |
|
f. |
7% |
Other sales (e.g., rights to technology, licensing, etc.) |
From the combination of responses 1b, 3a, and 3b, we can conclude that 31% had no sales and expect none, and that 18% had no sales but expect sales.
-
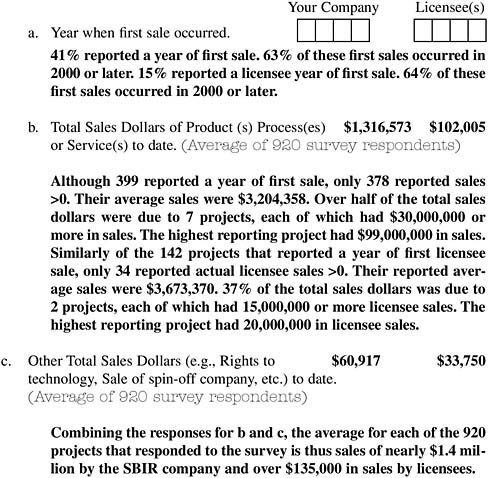
For your company and/or your licensee(s), when did the first sale occur, and what is the approximate amount of total sales resulting from the technology developed during this project? If multiple SBIR awards contributed to the ultimate commercial outcome, report only the share of total sales appropriate to this SBIR project. Enter the requested information for your company in the first column and, if applicable and if known, for your licensee(s) in the second column. Enter approximate dollars. If none, enter 0 (zero).
|
Display this box for Q 4 & 5 if project commercialization is known. Your company reported sales information to DoD as a part of an SBIR proposal or to NAS as a result of an earlier NAS request. This information may be useful in answering the prior question or the next question. You reported as of (date): DoD sales ($ amount), Other federal sales ($ amount), Export sales ($ amount), Private-sector sales ($ amount), and other sales ($ amount). |
-
To date, approximately what percent of total sales from the technology developed during this project have gone to the following customers? If none enter 0 (zero). Round percentages. Answers should add to about 100%.5 920 firms responded to this question as to what percent of their sales went to each agency or sector.
|
Domestic private sector |
21% |
|
Department of Defense (DoD) |
38% |
|
Prime contractors for DoD or NASA |
12% |
|
NASA |
1% |
|
Agency that awarded the Phase II |
−% |
|
Other federal agencies (Pull down) |
1% |
|
State or local governments |
1% |
|
Export Markets |
11% |
|
Other (Specify)_____________ |
16% |
|
The following questions identify the product, process, or service resulting from the project supported by the referenced SBIR award, including its use in a fielded federal system or a federal acquisition program. |
-
Is a federal system or acquisition program using the technology from this Phase II?
If yes, please provide the name of the federal system or acquisition program that is using the technology. 12% reported use in a federal system or acquisition program.
-
Did a commercial product result from this Phase II project? 27% reported a commercial product.
-
If you have had no sales to date resulting from the technology developed during this project, what year do you expect the first sales for your company or its licensee? Only firms that had no sales but answered that they expected sales got this question.
-
For your company and/or your licensee, what is the approximate amount of total sales expected between now and the end of 2006 resulting from the technology developed during this project? (If none, enter 0 [zero].) This
-
question was seen by those who already had sales and those w/o sales who reported expecting sales; however, averages are computed for all who took the survey since all could have expected sales.
|
a. Total sales dollars of product(s), process(es) or services(s) expected between now and the end of 2006. (Average of 920 projects) |
$900,280 |
|||
|
b. Other Total Sales Dollars (e.g., rights to technology, sale of spin-off company, etc.) expected between now and the end of 2006. (Average of 920 projects) |
$129,372 |
|||
|
c. Basis of expected sales estimate. Select all that apply. |
|
|||
|
|
a. |
18% |
Market research |
|
|
|
b. |
31% |
Ongoing negotiations |
|
|
|
c. |
33% |
Projection from current sales |
|
|
|
d. |
4% |
Consultant estimate |
|
|
|
e. |
31% |
Past experience |
|
|
|
f. |
34% |
Educated guess |
|
-
How did you (or do you expect to) commercialize your SBIR award?
|
a. |
3% |
No commercial product, process, or service was/is planned. |
|
b. |
32% |
As software |
|
c. |
60% |
As hardware (final product, component, or intermediate hardware product) |
|
d. |
23% |
As process technology |
|
e. |
18% |
As new or improved service capability |
|
f. |
0% |
As a drug |
|
g. |
0% |
As a biologic |
|
h. |
15% |
As a research tool |
|
i. |
2% |
As educational materials |
|
j. |
10% |
Other, please explain ______________________________ |
-
Which of the following, if any, describes the type and status of marketing activities by your company and/or your licensee for this project? Select one for each marketing activity. This question answered by 620 firms, which completed Phase II and have not discontinued the project, w/o sales or additional funding.
|
Marketing activity |
Planned |
Need Assistance |
Underway |
Completed |
Not Needed |
|
a. Preparation of marketing plan |
11% |
7% |
21% |
28% |
33% |
|
b. Hiring of marketing staff |
10% |
5% |
9% |
19% |
57% |
|
c. Publicity/advertising |
12% |
8% |
22% |
17% |
41% |
|
d. Test marketing |
10% |
6% |
16% |
13% |
54% |
|
e. Market Research |
9% |
9% |
23% |
21% |
37% |
|
f. Other (Specify) |
1% |
2% |
1% |
1% |
37% |
Part III. Other outcomes
-
As a result of the technology developed during this project, which of the following describes your company’s activities with other companies and investors? (Select all that apply.) Percentage of the 620 who answered this question.
|
Activities |
U.S. Companies/Investors |
Foreign Companies/Investors |
||
|
Finalized Agreements |
Ongoing Negotiations |
Finalized Agreements |
Ongoing Negotiations |
|
|
a. Licensing Agreement(s) |
16% |
16% |
3% |
5% |
|
b. Sale of Company |
1% |
5% |
0% |
1% |
|
c. Partial sale of Company |
1% |
4% |
0% |
1% |
|
d. Sale of technology rights |
4% |
10% |
1% |
3% |
|
e. Company merger |
0% |
3% |
0% |
1% |
|
f. Joint Venture agreement |
4% |
8% |
1% |
2% |
|
g. Marketing/distribution agreement(s) |
11% |
9% |
5% |
4% |
|
h. Manufacturing agreement(s) |
3% |
9% |
3% |
2% |
|
i. R&D agreement(s) |
14% |
14% |
3% |
3% |
|
j. Customer alliance(s) |
14% |
14% |
5% |
3% |
|
k. Other Specify____________ |
2% |
2% |
0% |
1% |
-
In your opinion, in the absence of this SBIR award, would your company have undertaken this project? Select one.
Percentage of the 618 who answered this question.
|
a. |
3% |
Definitely yes |
|
|
b. |
10% |
Probably yes |
If selected a or b, go to question 14. |
|
c. |
17% |
Uncertain |
|
|
d. |
33% |
Probably not |
|
|
e. |
37% |
Definitely not |
If c, d, or e, skip to question 16. |
-
If you had undertaken this project in the absence of SBIR, this project would have been Questions 14 and 15 were answered only by the 13% who responded that they definitely or probably would have undertaken this project in the absence of SBIR.
|
a. |
7% |
Broader in scope |
|
b. |
44% |
Similar in scope |
|
c. |
50% |
Narrower in scope |
-
In the absence of SBIR funding, (Please provide your best estimate of the impact.)
|
a. |
The start of this project would have been delayed about an average of 11 months. 62% of the 81 firms expected the project would have been delayed. 49% (40 firms) expected the delay would be at least 12 months. 22% anticipated a delay of at least 24 months. |
|||
|
b. |
The expected duration/time to completion would have been |
|||
|
|
|
1) |
78% |
Longer |
|
|
|
2) |
10% |
The same |
|
|
|
3) |
0% |
Shorter |
|
|
|
|
12% |
No response |
|
c. |
In achieving similar goals and milestones, the project would be |
|||
|
|
|
1) |
0% |
Ahead |
|
|
|
2) |
11% |
The same place |
|
|
|
3) |
69% |
Behind |
|
|
|
|
20% |
No response |
-
Employee information. Enter number of employees. You may enter fractions of full-time effort ( e.g., 1.2 employees). Please include both part-time and full-time employees, and consultants, in your calculation.
|
Number of employees (if known) when Phase II proposal was submitted |
Ave = 35 8% report 0 29% report 1-5 30% report 6-20 13% report 21-50 8% report >100 |
|
Current number of employees |
Ave = 60 1% report 0 17% report 1-5 30% report 6-20 22% report 21-50 18% report >100 |
|
Number of current employees who were hired as a result of the technology developed during this Phase II project. |
Ave = 2.5 48% report 0 42% report 1-5 5% report 6-20 2% report >20 |
|
Number of current employees who were retained as a result of the technology developed during this Phase II project |
Ave = 2.3 44% report 0 47% report 1-5 5% report 6-20 2% report >20 |
-
The Principal Investigator for this Phase II Award was a (check all that apply)
|
a. |
4% |
Woman |
|
b. |
11% |
Minority |
|
c. |
86% |
Neither a woman or minority |
-
Please give the number of patents, copyrights, trademarks, and/or scientific publications for the technology developed as a result of this project. Enter numbers. If none, enter 0 (zero). Results are for 816 respondents to this question.
|
Number Applied For/Submitted |
|
Number Received/Published |
|
836 |
Patents |
398 |
|
71 |
Copyrights |
62 |
|
211 |
Trademarks |
176 |
|
1,028 |
Scientific Publications |
990 |
Part IV. Other SBIR funding
-
How many SBIR awards did your company receive prior to the Phase I that led to this Phase II?
-
Number of previous Phase I awards. Average of 22. 29% had no prior Phase I and another 42% had 5 or less prior Phase I.
-
Number of previous Phase II awards. Average of 8. 46% had no prior Phase II and another 36% had 5 or less prior Phase II.
-
-
How many SBIR awards has your company received that are related to the project/technology supported by this Phase II award?
-
Number of related Phase I awards. Average of two awards. 46% had no prior related Phase I and another 48% had 5 or less prior related Phase I.
-
Number of related Phase II awards. Average of one. 56.5% had no prior related Phase II and another 42.1% had 5 or less prior related Phase II.
-
Part V. Funding and other assistance
-
Prior to this SBIR Phase II award, did your company receive funds for research or development of the technology in this project from any of the following sources? Of 854 respondents.
|
a. |
22% |
Prior SBIR Excluding the Phase I, which proceeded this Phase II. |
|
b. |
12% |
Prior non-SBIR federal R&D |
|
c. |
2% |
Venture Capital |
|
d. |
8% |
Other private company |
|
e. |
6% |
Private investor |
|
f. |
27% |
Internal company investment (including borrowed money) |
|
g. |
2% |
State or local government |
|
h. |
1% |
College or University |
|
i. |
5% |
Other Specify _________ |
|
Commercialization of the results of an SBIR project normally requires additional developmental funding. Questions 22 and 23 address additional funding. Additional Developmental Funds include non-SBIR funds from federal or private sector sources, or from your own company, used for further development and/or commercialization of the technology developed during this Phase II project. |
-
Have you received or invested any additional developmental funding in this project?
|
a. |
54% |
Yes |
Continue |
|
b. |
46% |
No |
Skip to question 24. |
-
To date, what has been the total additional developmental funding for the technology developed during this project? Any entries in the Reported column are based on information previously reported by your firm to DoD or NAS. They are provided to assist you in completing the Developmental Funding column. Previously reported information did not include investment by your company or personal investment. Please update this information to include breaking out Private investment and Other investment by subcategory. Enter dollars provided by each of the listed sources. If none, enter 0 (zero). The dollars shown are determined by dividing the total
-
funding in that category by the 920 respondents who started the survey to determine an average funding. Only 462 of these respondents reported any additional funding.
|
Source |
Reported |
Developmental Funding |
|
|
a. |
Non-SBIR federal funds |
$_ _, _ _ _, _ _ _ |
$ 361,277 |
|
b. |
Private Investment |
$_ _, _ _ _, _ _ _ |
|
|
|
(1) U.S. venture capital |
|
$169,313 |
|
|
(2) Foreign investment |
|
$16,744 |
|
|
(3) Other private equity |
|
$77,246 |
|
|
(4) Other domestic private company |
|
$57,177 |
|
c. |
Other sources |
$_ _, _ _ _, _ _ _ |
|
|
|
(1) State or local governments |
|
$6,018 |
|
|
(2) College or universities |
|
$1,812 |
|
d. |
Not previously reported |
|
|
|
|
(1) Your own company (Including money you have borrowed) |
|
$90,913 |
|
|
(2) Personal funds |
|
$15,232 |
|
Total average additional developmental funding, all sources, per award |
$795,734 |
||
-
Did this award identify matching funds or other types of cost sharing in the Phase II Proposal?6
|
a. |
81% |
No matching funds/co-investment/cost sharing were identified in the proposal. If a, skip to question 26. |
|
b. |
16% |
Although not a DoD Fast Track, matching funds/co-investment/cost sharing were identified in the proposal. |
|
c. |
3% |
Yes. This was a DoD Fast Track proposal. |
-
Regarding sources of matching or co-investment funding that were proposed for Phase II, check all that apply. The percentages below are computed for those 161 projects, which reported matching funds.
|
a. |
40% |
Our own company provided funding (includes borrowed funds) |
|
b. |
20% |
A federal agency provided non-SBIR funds |
|
c. |
43% |
Another company provided funding |
|
d. |
14% |
An angel or other private investment source provided funding |
|
e. |
12% |
Venture Capital provided funding |
-
Did you experience a gap between the end of Phase I and the start of Phase II?
|
a. |
69% |
Yes |
Continue |
|
b. |
31% |
No |
Skip to question 29. |
-
The average gap reported by 584 respondents was 5 months. 3% of the respondents reported a gap of two or more years.
-
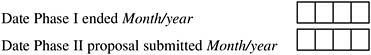
Project history. Please fill in for all dates that have occurred. This information is meaningless in aggregate. It has to be examined project by project in conjunction with the date of the Phase I end and the date of the Phase II award to calculate the gaps.
-
If you experienced funding gap between Phase I and Phase II for this award, (select all answers that apply)
|
a. |
58% |
Stopped work on this project during funding gap. |
|
b. |
34% |
Continued work at reduced pace during funding gap. |
|
c. |
4% |
Continued work at pace equal to or greater than Phase I pace during funding gap. |
|
d. |
7% |
Received bridge funding between Phase I and II. |
|
e. |
2% |
Company ceased all operations during funding gap. |
-
Did you receive assistance in Phase I or Phase II proposal preparation for this award? Of 791 repondents.
|
a. |
2% |
State agency provided assistance. |
|
b. |
2% |
Mentor company provided assistance. |
|
c. |
0% |
Regional association provided assistance. |
|
d. |
3% |
University provided assistance. |
|
e. |
93% |
We received no assistance in proposal preparation. |
-
Was this assistance useful?
|
a. |
58% |
Very Useful |
|
b. |
40% |
Somewhat Useful |
|
c. |
2% |
Not Useful |
-
In executing this award, was there any involvement by university faculty, graduate students, and/or university developed technologies? Of 837 respondents.
|
25% |
Yes |
|
75% |
No |
-
This question addresses any relationships between your firm’s efforts on this Phase II project and any University (ies) or College (s). The percentages are computed against the 837 who answered question 30, not just those who answered yes to question 30. Select all that apply.
|
a. |
1% |
The Principal Investigator (PI) for this Phase II project was at the time of the project a faculty member. |
|
b. |
1% |
The Principal Investigator (PI) for this Phase II project was at the time of the project an adjunct faculty member. |
|
c. |
14% |
Faculty member(s) or adjunct faculty member(s) work on this Phase II project in a role other than PI, e.g., consultant. |
|
d. |
11% |
Graduate students worked on this Phase II project. |
|
e. |
9% |
University/College facilities and/or equipment were used on this Phase II project. |
|
f. |
2% |
The technology for this project was licensed from a University or College. |
|
g. |
4% |
The technology for this project was originally developed at a University or College by one of the percipients in this Phase II project. |
|
h. |
13% |
A University or College was a subcontractor on this Phase II project. |
In remarks enter the name of the University or College that is referred to in any blocks that are checked above. If more than one institution is referred to, briefly indicate the name and role of each.
-
Did commercialization of the results of your SBIR award require FDA approval? Yes 2%
In what stage of the approval process are you for commercializing this SBIR award?
|
a. |
0% |
Applied for approval |
|
b. |
1% |
Review ongoing |
|
c. |
0% |
Approved |
|
d. |
0% |
Not Approved |
|
e. |
1% |
IND: Clinical trials |
|
f. |
0% |
Other |
NRC Firm Survey Results
NOTE: ALL RESULTS APPEAR IN BOLD. RESULTS ARE REPORTED FOR ALL 5 AGENCIES (DoD, NIH, NSF, DoE, AND NASA).
1,239 firms began the survey. 1,149 completed through question 14. 1,108 completed all questions.
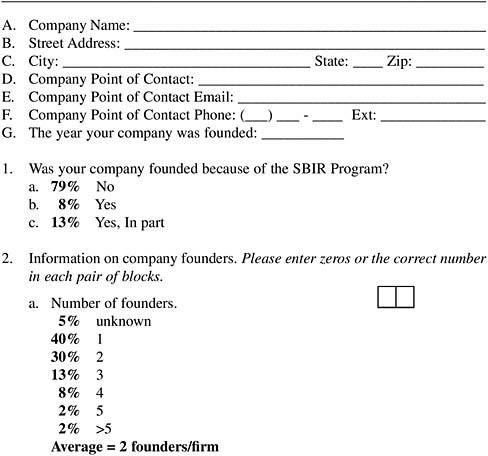
|
If your firm is registered in the DoD SBIR/STTR Submission Web site, the information filled in below is based on your latest update as of September 2004 on that site. Since you may have entered this information many months ago, you may edit this information to make it correct. In conjunction with that information, the following additional information will help us understand how the SBIR program is contributing to the formation of new small businesses active in federal R&D and how they impact the economy. Questions A–G are autofilled from Firm database, when available. |