
3
Statistics of SBIR Awards
3.1
INTRODUCTION
This chapter outlines the information available on Small Business Innovation Research (SBIR) program applications and awards, with a focus on the five study agencies: Department of Defense (DoD), National Institutes of Health (NIH), National Aeronautics and Space Administration (NASA), National Science Foundation (NSF), and Department of Energy (DoE). The objective is to provide a quantitative overview of award patterns, while highlighting both some data issues and some areas of possible concern.
There is no authoritative source for SBIR data. While the U.S. Small Business Administration (SBA) maintains the Tech-Net Database, which includes data submitted by the agencies, agency databases do not exactly match SBA databases (as we shall see in Section 3.7). And a more detailed review of agency data indicates that there are some areas where current data collection efforts are insufficient (see below).
We begin by providing an overview of the SBIR program, which today totals about $2 billion annually, divided between Phase I and Phase II. We consider each separately.
3.2
SBIR PHASE I AWARDS
In FY2005, all SBIR awarding agencies made a total of 4,208 Phase I awards (see Table 3-1).
Fifty-six percent of FY2005 Phase I awards were made by DoD. NIH accounted for a further 20 percent. Overall, the number of Phase I awards has fallen
TABLE 3-1 Phase I Awards
from a peak of 5,129 in FY2003, to 4,208 in FY2005, a decline of 18 percent (see Figure 3-1).
This overall decline primarily reflects a reduction in the number of Phase I awards at NIH (down 38 percent), NASA (down 4.8 percent), and DoE (down 19.8 percent). Since the number of Phase II awards has increased by 16.1 percent over the past few years (2002-2005), agencies appear to be making a shift in emphasis away from Phase I and toward Phase II.
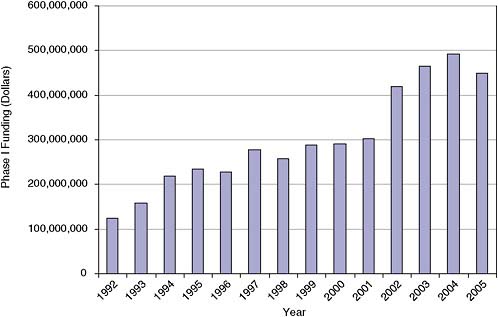
The growth and then decline in the number of Phase I awards are not directly reflected in the amounts spent by the agencies on Phase I. Funding levels for Phase I peaked in 2004, and funding committed to Phase I has fallen by only 8.6 percent (see Figure 3-2). This suggests that while the number of awards has been falling, the size of awards has been growing. And this is in fact the case (see Figure 3-3).
The decline in award size from 1999 to 2001 may be related to the introduction of Phase I options at DoD, which reduced the size of “standard” awards to $70,000 in most cases. The sharp increase in award size from 2001-2004 (up 56 percent in three years) has been driven by changes at the two largest programs.
At DoD, average award size increased from $71,056 to $90,508 (up 27 percent). At HHS (the home agency of NIH), average award size increased from
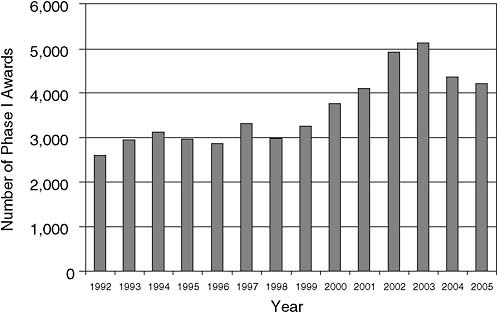
FIGURE 3-1 Total Phase I awards, 1992-2005.
NOTE: This is a correction of the prepublication version released on July 27, 2007.
SOURCE: U.S. Small Business Administration, Tech-Net Database.
$85,937 to $179,108 (up more than 108 percent). Doubling the average size of awards in three years, while reducing the number of awards by 37 percent, represents a fundamental shift within the NIH program.
3.3
SBIR PHASE II AWARDS
The number of Phase II awards made since 1992 does not fluctuate as dramatically, as shown in Figure 3-4.
Here the increase in numbers is more gradual, and the decline both more recent and less pronounced, with awards falling in only one year since 1999, and by only 6.6 percent.
Overall funding for Phase II grew considerably faster than the number of awards. It is up by 97.5 percent between 2000 and 2004 (see Figure 3-5).
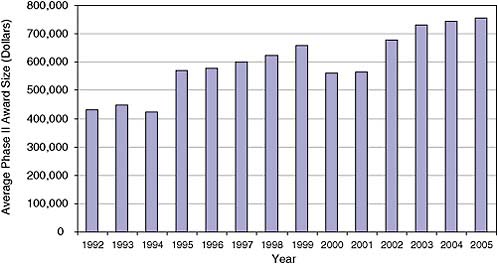
As with Phase I, this reflects growth in the average size of Phase II awards. The award data appear to show an increase of about 40 percent between 2001 and 2005 (see Figure 3-6).
3.4
OVERSIZED AWARDS—NIH
The formal size limits for awards were last changed in the 1992 reauthorization, to $100,000 for Phase I and $750,000 for Phase II. More recently, NIH
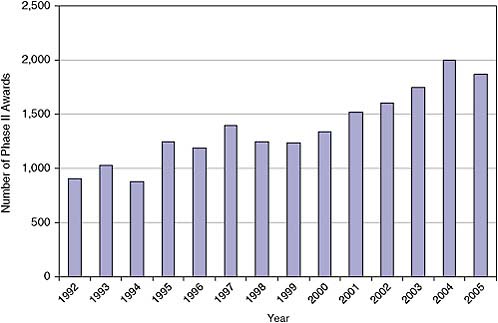
FIGURE 3-4 Number of Phase II awards, 1992-2005.
SOURCE: NIH Awards Database.
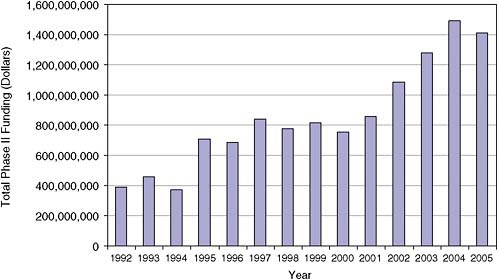
FIGURE 3-5 Funding for Phase II, 1992-2005.
SOURCE: NIH Awards Database.
expanded the definition of what is possible in terms of award size for SBIR. The agency has awarded at least one $3 million Phase I award, and SBA data indicates that 18 Phase I awards have been for more than $1 million (all since 2000).
While DoD has always had a few Phase II awards of more than $2 million (28 over 13 years), NIH has more recently made such awards in greater numbers:
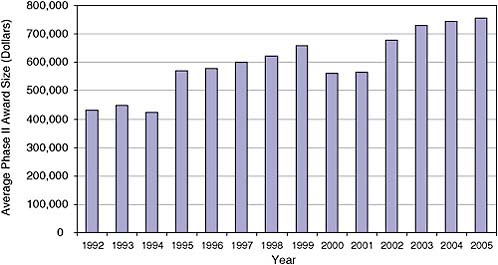
FIGURE 3-6 Average size of Phase II awards, 1992-2005.
SOURCE: NIH Awards Database.
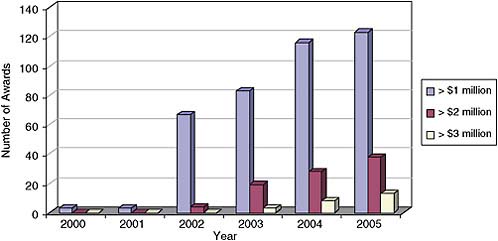
FIGURE 3-7 Over-sized Phase II awards at NIH.
SOURCE: NIH Awards Database.
91 overall, with all except 6 in the last three years. In FY2005, NIH made 38 awards (out of 373) of over $2 million. In FY2005, more than 10 percent of NIH Phase II awards were for more than $2 million, and a further 85 (22 percent) were for more than $1 million. Thirteen awards were for more than $3 million.
Sharp growth in award size in recent years has led to an average Phase II award size of $1,089,294 in FY2005—almost 40 percent above the mandated maximum of $750,000. The agency has been given a blanket waiver from SBA for this departure, but the change does raise some questions.1
These data and other aspects of award size at NIH are explored in more detail in the NIH volume.
3.5
APPLICATIONS AND SUCCESS RATES
As SBA does not provide information on the number of applications and success rates, we have used data from the agencies for this purpose. Figure 3-8 shows success rates (awards as a percentage of applications) by agency.
The data show that in general, success rates have fluctuated around 15 percent, with the exception of NIH, where Phase I success rates have averaged 23.9 percent since 1994. Neither at NIH nor at NSF has the recent increase in the amount of overall funding for SBIR been reflected in growing success rates. On the contrary, success rates at NIH have fallen since 2002, reflecting sharp growth in the number of applications, shown in Figure 3-9. Although agency-specific
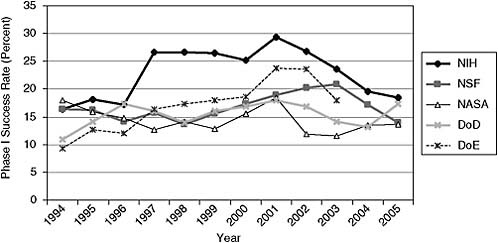
FIGURE 3-8 Phase I success rates at NSF, NIH, DoD, NASA.
SOURCE: Agency data.
features are also likely to have an impact, the number of applications appears, in general, to be more closely related to changes in the high-tech economy than to any other broad factor. Notably, the rise in Phase I applications in 2002 appears correlated to the collapse of the venture capital bubble that reached its peak in 2000. The correlation suggests that as private venture capital became scarce following the collapse of the venture capital bubble (Figure 3-10), small businesses looked to SBIR as a means to continue funding for their innovative activities.
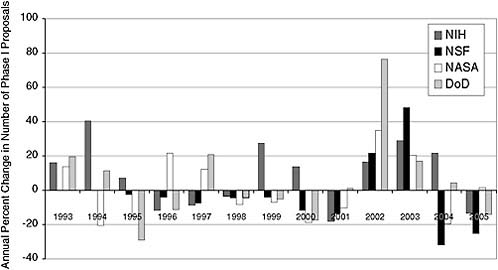
FIGURE 3-9 Annual change in the number of Phase I applications.
SOURCE: Agency data.
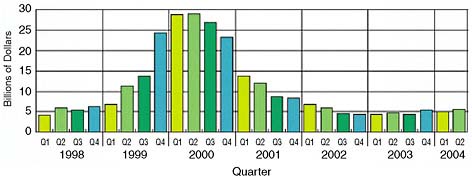
FIGURE 3-10 The venture capital bubble.
SOURCE: PriceWaterhouseCoopers, Thomson Venture Economics, National Venture Capital Association.
3.6
GEOGRAPHICAL DISTRIBUTION
The geographical distribution of awards reflects but does not mirror the distribution of science and engineering talent.
For Phase I, six states received more than 2,000 Phase I awards between 1992 and 2005. Together, these six states accounted for 54 percent of all awards during the study period (see Table 3-2).
Conversely, eight states received fewer than 100 Phase I awards, and together these states accounted for 1.1 percent of all awards.
A similarly skewed distribution is found when examining Phase II awards. Again, the top six states—winning at least 700 Phase II awards each—accounted for 54 percent of all Phase II awards (although it should be noted that this is not the same group of top winning states as Phase I). (See Table 3-3.)
The lowest-winning eight states accounted for 1.03 percent of all awards.
Many variables affect the geographical distribution of applications and awards. These include the populations of the state, the number of eligible high-
TABLE 3-2 States with 2,000 or More Phase I Awards
|
State |
Percent of All Phase I Awards |
|
California |
20.8 |
|
Massachusetts |
14.5 |
|
Virginia |
5.5 |
|
Maryland |
5.1 |
|
New York |
4.2 |
|
Texas |
4.0 |
|
Total |
54.0 |
|
SOURCE: U.S. Small Business Administration. |
|
TABLE 3-3 Top Six Phase II-Winning States
|
State |
Percent of All Phase II Awards |
|
California |
21.0 |
|
Massachusetts |
14.4 |
|
Virginia |
5.8 |
|
Maryland |
4.8 |
|
Colorado |
4.6 |
|
Ohio |
3.7 |
|
Total |
54.4 |
|
SOURCE: U.S. Small Business Administration. |
|
tech companies, the science and engineering talent in the state, state expenditures related to R&D, total R&D conducted, and the number of research universities.2
Analysis from the NIH Report3 shows that if Phase I awards were expressed per 1,000 life scientists employed, the top “winning” states would change dramatically (see Table 3-4).
Massachusetts, Maryland, Virginia, and California remain in the top ten winners for both gross number of awards and awards per 1,000 life scientists, but New York and Texas—two other “top six” states for gross number of awards, fall into the lower half of the state rankings per 1,000 life scientists, while Oregon and Connecticut move into the top five states.
It is important to look at state award levels, not by assessing gross data, but by placing that data in the context of the scientific and engineering talent available: It does not make sense to criticize that there are insufficient Phase II awards in a given state if there are few scientists and engineers qualified to apply for one.
TABLE 3-4 Phase I Awards by State at NIH, per 1,000 Life Scientists Employed, 2003
|
|
Life & Physical Sciences |
Phase I Awards |
Phase I Awards per 1,000 L&PS |
|
New Hampshire |
1,480 |
14 |
9.5 |
|
Vermont |
850 |
6 |
7.1 |
|
Massachusetts |
20,380 |
140 |
6.9 |
|
Maryland |
17,910 |
90 |
5.0 |
|
Oregon |
5,870 |
23 |
3.9 |
|
Connecticut |
5,670 |
22 |
3.9 |
|
California |
64,390 |
248 |
3.9 |
|
Virginia |
13,030 |
40 |
3.1 |
|
Ohio |
15,100 |
45 |
3.0 |
|
Iowa |
3,130 |
9 |
2.9 |
|
Colorado |
11,710 |
33 |
2.8 |
|
Indiana |
4,070 |
11 |
2.7 |
|
Rhode Island |
1,580 |
4 |
2.5 |
|
Michigan |
9,390 |
23 |
2.4 |
|
Arizona |
5,580 |
13 |
2.3 |
|
Nevada |
2,510 |
5 |
2.0 |
|
Wyoming |
1,510 |
3 |
2.0 |
|
Delaware |
2,020 |
4 |
2.0 |
|
Minnesota |
11,200 |
22 |
2.0 |
|
Washington |
16,940 |
33 |
1.9 |
|
New Mexico |
3,200 |
6 |
1.9 |
|
Wisconsin |
11,220 |
21 |
1.9 |
|
New Jersey |
17,530 |
32 |
1.8 |
|
Utah |
5,060 |
9 |
1.8 |
|
South Carolina |
4,610 |
8 |
1.7 |
|
Maine |
1,830 |
3 |
1.6 |
|
Pennsylvania |
25,080 |
41 |
1.6 |
|
District of Columbia |
5,210 |
8 |
1.5 |
|
Oklahoma |
3,350 |
5 |
1.5 |
|
North Dakota |
1,420 |
2 |
1.4 |
|
New York |
30,330 |
41 |
1.4 |
|
North Carolina |
17,770 |
24 |
1.4 |
|
Missouri |
9,240 |
12 |
1.3 |
|
Kansas |
3,910 |
5 |
1.3 |
|
Florida |
19,440 |
24 |
1.2 |
|
Alabama |
5,170 |
6 |
1.2 |
|
Texas |
42,440 |
49 |
1.2 |
|
Illinois |
18,300 |
21 |
1.1 |
|
Arkansas |
2,700 |
3 |
1.1 |
|
Louisiana |
5,540 |
5 |
0.9 |
|
Nebraska |
3,920 |
3 |
0.8 |
|
Kentucky |
2,660 |
2 |
0.8 |
|
Alaska |
2,800 |
2 |
0.7 |
|
South Dakota |
1,420 |
1 |
0.7 |
|
Georgia |
11,410 |
8 |
0.7 |
|
Tennessee |
7,130 |
4 |
0.6 |
|
Hawaii |
1,790 |
1 |
0.6 |
|
Montana |
2,790 |
1 |
0.4 |
|
Idaho |
3,100 |
1 |
0.3 |
|
Mississippi |
3,650 |
1 |
0.3 |
|
West Virginia |
2,510 |
0 |
0.0 |
|
Average |
|
|
3.2 |
|
SOURCE: NIH data; and National Science Board, Science and Engineering Indicators 2005, Arlington, VA: National Science Foundation, 2005. |
|||
3.7
GAUGING PARTICIPATION BY WOMEN AND MINORITIES
One congressional objective for the program concerns support for woman and minority firms. Understanding current trends is more complex than it might appear.4
A major problem concerns data collection and monitoring. NRC analysis revealed a systemic failure by NIH to capture this data effectively from applications forms during several recent years. At the request of the NRC, NIH has now re-entered that data for 2002-2005; and it is believed that the data prior to 2000 are accurate.5 At DoD, the problem lies with the companies: Spot checks have indicated that companies with many applications often label them inconsistently: a firm can label some applications as woman-owned, some as minority-owned, some as neither—sometimes all in the same year. While DoD makes an effort to correct these errors once the application has become an award, this means that the data for woman and minority success rates at DoD are not reliable.
Finally, there are inconsistencies described earlier with discrepancies between SBA and agency data.
Still, bearing these points in mind, we use the SBA data in this section to provide comparability.
Figure 3-11 shows the award data for woman-owned and minority-owned businesses reported by SBA. The data show that the number of Phase I awards to woman- and minority-owned businesses have increased, especially since 1998, and are up by 172 percent since then. The apparent surge in 2000 is not understood.
The data on minority-owned firms is different. It shows a much flatter trend—again marked by the surge in 2000, with no increase at all over the last five years, at a time when the number of awards made overall has increased sharply.
The number of awards provides only part of the story. Context is provided by the overall number of awards made, and hence by the shares of Phase I awards to woman- and minority-owned firms.
Overall, the percentage of Phase I awards going to minority-owned firms have been declining, while the share going to woman-owned firms has been growing (see Figure 3-13). The trends are broadly consistent, with woman-owned
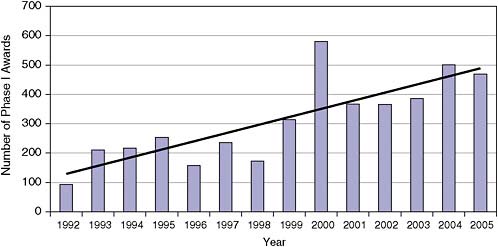
FIGURE 3-11 Phase I awards to woman- and minority-owned businesses.
SOURCE: U.S. Small Business Administration, Tech-Net Database.
firms growing from about 6.5 percent of all awards in 1998, to over 11 percent in 2004-2005. In the same period, award shares for minority-owned firms fell from just over 10 percent in 1992-1998 to just over 8 percent in 2001-2005, with a slight uptick in 2005.
In total, the share of awards to woman- and minority-owned firms has remained almost flat over the period, at 17 percent to 20 percent, while the absolute number of awards has increased substantially. Data for Phase II are comparable (see Figure 3-15).
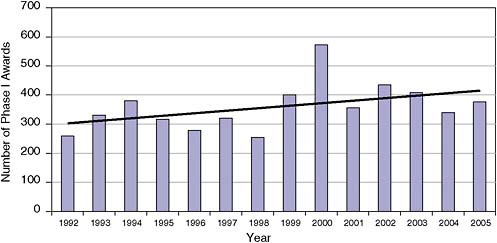
FIGURE 3-12 Phase I awards to minority-owned firms, 1992-2005.
SOURCE: U.S. Small Business Administration, Tech-Net Database.
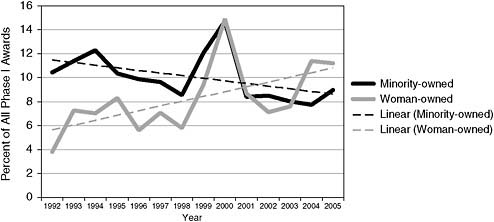
FIGURE 3-13 Woman- and minority-owned firms: Shares of Phase I awards, 1992-2005 (with trendlines).
SOURCE: U.S. Small Business Administration.
It is worth noting that while the share of awards going to woman-owned firms has increased, from 7.7 percent in 1999 to 11.7 percent in 2005, the percentage of female doctorates and scientists and engineers in the workplace has grown considerably faster, according to NSF data.
Finally, while the different patterns emerging from this analysis are interesting, detailed assessment requires that accurate data be collected on applications and on success rates (the number of applications per award for woman- and minority owned firms, and for all other firms). This will help to indicate whether
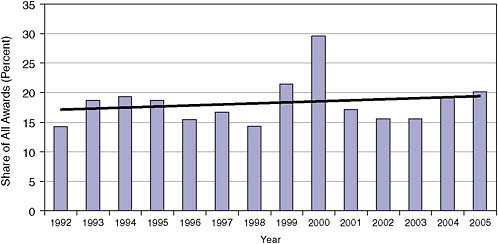
FIGURE 3-14 Share of woman- and minority-owned firms in Phase I awards (percent of total).
SOURCE: U.S. Small Business Administration.
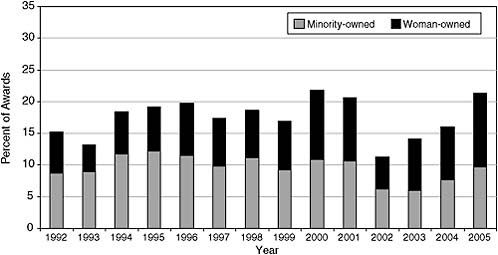
FIGURE 3-15 Phase II—award shares to minority- and woman-owned businesses, 1992-2005.
SOURCE: U.S. Small Business Administration, Tech-Net Database.
there are issues of outreach—insufficient applications from these groups—or whether there is something in the selection process that might need to be addressed (plenty of applications, lower success rates).
3.8
MULTIPLE-AWARD WINNERS AND NEW ENTRANTS
Data on multiple winners and on the percentage of awardees who are new to the program can be used as an indicator of the openness of the program—the extent to which good ideas and projects from outside the circle of previous winners can find a hearing and funding among the SBIR agencies and departments.
At the same time, the existence of multiple-award winners is sometimes used as an argument to justify limits on participation in the program. These proposed limits appear misconceived. They are discussed in detail in Chapter 5 of this volume, on Program Management.
Unfortunately, the absence of an effective centralized data management system for SBIR means that data on multiple-award winners are difficult to locate and verify and may not be especially accurate. Critics of multiple-award winners have tended to focus on DoD, partly because the numbers at DoD are higher than at other agencies. Analysis of NIH awards from 1992-2003 indicates that only two companies had as many as thirty Phase II awards during these 12 years.
By contrast, the DoD data show that ten firms had at least 75 Phase II awards.
TABLE 3-5 Multiple Award Winners, from the DoD Commercialization Database
3.8.1
New Program Participants
Much less attention is normally devoted to the extent to which the SBIR program is open to new entrants. Once again, this is not a metric tracked by SBA, but agencies provide their own figures on new entrants into the program.
At NIH, for example, “new” firms—not previously funded by the NIH SBIR program—accounted for about 60 percent of applicant firms in recent years, and for about 40 percent of Phase I winners.
Data from NSF are quite similar, indicating not only that the percentage of new winners ranges from 41 percent to 63 percent, but that the number has increased from 1999 to 2005, even though the number of past winners in the pool of potential applicants continues to increase every year.
TABLE 3-6 New Phase I Applicants and Winners at NIH
|
|
Percent of Applicants Not Previously Funded |
Percent of New Firms Among Funded Firms |
|
2000 |
63.0 |
47.1 |
|
2001 |
58.0 |
39.8 |
|
2002 |
61.8 |
42.2 |
|
2003 |
63.7 |
42.8 |
|
2004 |
63.5 |
41.7 |
|
2005 |
61.0 |
35.8 |
|
SOURCE: National Institutes of Health. |
||
TABLE 3-7 Percent of Winning Companies that Had Not Previously Received an SBIR Grant from NSF, 1996-2003
|
Fiscal Year |
Previous Winners |
New Winners |
Percent New Winners |
|
1996 |
98 |
109 |
52.7 |
|
1997 |
99 |
116 |
54.0 |
|
1998 |
83 |
100 |
54.6 |
|
1999 |
113 |
81 |
41.8 |
|
2000 |
97 |
108 |
52.7 |
|
2001 |
92 |
95 |
50.8 |
|
2002 |
99 |
133 |
57.3 |
|
2003 |
138 |
236 |
63.1 |
|
SOURCE: National Science Foundation. |
|||
DoD’s SBIR Program Office reports that 37 percent of awards on average go to firms that have not previously won a DoD SBIR award.6
To conclude, the data on new winners strongly makes clear that the various SBIR programs are open to new ideas from new firms, even though in some cases individual firms have been able to win a significant number of awards, remaining active participants in a growing program of innovative research. A detailed assessment of this issue is provided in Chapter 5.
|
6 |
See National Research Council, An Assessment of the SBIR Program at the Department of Defense, Charles W. Wessner, ed., Washington, DC: The National Academies Press, 2009; Chapter 2: Awards. |


