
1
Introduction
THE CHALLENGE
Water is essential to life; human well-being requires an adequate and continuous supply of clean water. As of 2004, about one-sixth of the world’s population (over 1 billion people) remained without access to improved drinking water, and over 40 percent (about 2.6 billion) had no access to improved sanitation (World Health Organization and UNICEF, 2006). Although the United States is blessed with abundant water, there are many regions with intermittent and even chronic water shortages. As populations increase, water problems will likely worsen. Landuse changes associated with population growth commonly increase flood peaks, lower base flows, and impair water quality. As worldwide stores of oil and gas become depleted, increased amounts of water may be required for biofuels production, coal gasification, and processing of oil shale and other alternative fuels. Anthropogenic and natural climate change will compound the problem by altering historical climate and weather patterns in unpredictable ways. And human demands for water are increasingly coming into conflict with environmental water use. There is little doubt that the future offers many challenges to the maintenance of adequate supplies of clean water.
The science questions associated with these challenges have been summarized in a series of reports by the National Research Council from the early 1990s to 2007; these are collated in Appendix A. These themes are mostly echoed in the science plans of the National Science Foundation’s proposed ecological, hydrologic, and water-quality observatories, reflecting considerable consensus in the scientific community. Progress in answering these questions has been disappointingly modest, due in part to the limited availability and/or use of the technologies and strategies described in this report. Because the societal issues and associated science questions are evolving only gradually, this report does not attempt a detailed recapitulation of these topics. However, they appear throughout this chapter and, indeed, throughout the report.
What is clear is that to meet these challenges the management of water resources will need to become more effective and systematic (see, for example, an international example in Box 1-1). This will require improvements in our capacity to understand and quantify the hydrologic cycle and its spatial and temporal interactions with the natural and built environment.
USES OF WATER AND THE HYDROLOGIC CYCLE
Water on the Earth continuously moves between the atmosphere, oceans, and various water stores on and below the land surface (Figure 1-1). The primary land-based water stores, in order of capacity, are icecaps and glaciers, groundwater, lakes, terrestrial soils, wetlands, and rivers. Water use and management generally focus on groundwater, lakes, rivers, and soils. These stores provide water for domestic, commercial, industrial, and agricultural uses. They have also been used to dispose various kinds of wastewater, although such uses have become increasingly constrained.
Ecosystems rely on and participate in the cycling of water. Water supports most forms of life and water stores are often associated with characteristic ecosystems. Late in the 20th century, societies recognized the utility of protecting and restoring ecosystems to maintain a “healthy” hydrologic cycle. For example, wet-
|
BOX 1-1 An International Initiative for Integrated Observations The international community is recognizing the importance of integrated, comprehensive Earth monitoring systems. Perhaps most notably, on February 16, 2005, at the Third Earth Observation Summit held in Brussels, Belgium, the Global Earth Observation System of Systems (GEOSS) 10-Year Implementation Plan was endorsed by nearly 60 governments and the European Commission. The vision for GEOSS is “to realize a future wherein decisions and actions for the benefit of humankind are informed via coordinated, comprehensive and sustained Earth observations and information.” The GEOSS implementation plan calls for developing these comprehensive Earth observations in order to improve monitoring the state of the Earth, to increase understanding of Earth processes, and to enhance prediction of the behavior of the Earth system. The ultimate goal is to deliver to Earth’s societies enhanced benefits from improved forecasting and management in areas such as weather and seasonal climate, water resources and ecosystem management, environmental factors affecting human health and understanding, climate variability and change. The intergovernmental Group on Earth Observations (GEO), which is leading the effort, is co-chaired by the United States, South Africa, China, and the European Commission. |
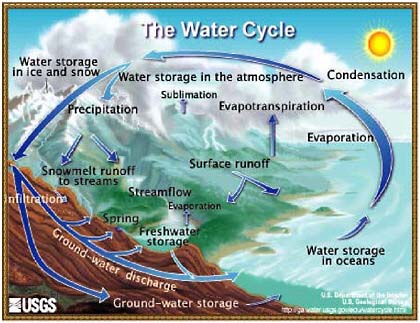
FIGURE 1-1 The water cycle. SOURCE: U.S. Geological Survey. Available on-line: http://ga.water.usgs.gov/edu/watercycle.html.
wetlands, many of which were drained for agricultural and other land uses, are now protected and restored in recognition of their role in moderating floods, maintaining dry-weather flows, and removing sediment and overabundant nutrients (NRC, 1995).
Water continuously moves between and within water stores. The rates of movement between stores, and consequently the amount of water stored, can vary significantly, posing challenges to water management. Droughts compromise water use and floods jeopardize activities sited near water bodies. The “quality” of water depends on its constituents, which include heat, sediment, nutrients, carbon, and harmful anthropogenic materials (contaminants). As water moves between and within stores, its constituents change. Some constituents, such as quartz sand, change only slowly during transport (Selley, 2000), although transport may be interrupted along the way. Other constituents undergo major transformations. For example, under certain conditions nitrate is converted to nitrogen gas as it moves from groundwater to surface water. Transformations typically involve a combination of physical, chemical, and biological processes. Effective water management requires that we understand and quantify the movement of water between and within stores, and the movement and transformation of important water constituents.
Of primary importance are the water budgets of important water stores and
their variation over time. Just as in balancing monetary accounts, it is important to keep track of the amount of water in storage as well as the rates of inflow and outflow. Natural inflows to surface-water bodies typically include precipitation, surface runoff, and groundwater inflow; outflows include evaporation, transpiration, and seepage into the ground. Natural inflow to groundwater (recharge) results from the percolation of soil and other surface waters; outflows include transpiration and discharge to surface waters. Humans also withdraw from, and discharge to, surface and groundwater; the sum of the natural and human infrastructure systems can lead to highly complicated water flow patterns and budgets (e.g., Figure 1-2).
Some aspects of global, regional, and local water budgets are better understood than others (Trenberth et al., 2007). For example, water accounting for lakes is relatively easy, although it can be difficult to obtain accurate estimates of evaporation and exchanges with groundwater. In contrast, it is often very difficult to estimate groundwater stores. Groundwater levels vary in space, and there are generally relatively few wells from which to make observations. Groundwater recharge depends on precipitation and evaporation, both of which are difficult to measure over large areas. For many important ground water stores (aquifers), pumping rates are not well known.
As previously mentioned, the quality of water depends on its constituents, which in turn are affected by the pathways and rates of water movement within water stores. Of particular importance is the time that individual constituent units (such as particles of sediment) spend in a store (i.e., the residence time). For example, the percentage of suspended materials carried into a quiet lake by streamflow that will settle out depends in part on the residence time, in accordance with Stokes’ Law, and its variants (Wu and Wang, 2006). In contrast, a long residence time in a lake may concentrate the chemical constituents by evaporation (Warren, 2006). Bacteria accumulate at different rates under certain conditions than under others. Hence to accurately predict the quality of water leaving a store it is necessary to understand and quantify the movement of water within the store. This can be much more difficult than estimating water budgets.
QUANTIFYING THE HYDROLOGIC CYCLE
There are two main challenges to understanding and quantifying the movement of water between and within stores and the associated changes in water constituents. First, many of the key processes cannot be readily observed. Evaporation is a good example. Movement of groundwater within an aquifer is another. Second, the rates of water movement can vary greatly in both space and time. For example, groundwater recharge depends on precipitation, soil properties, topography, and vegetation, all of which can vary widely in space and to some extent with time.
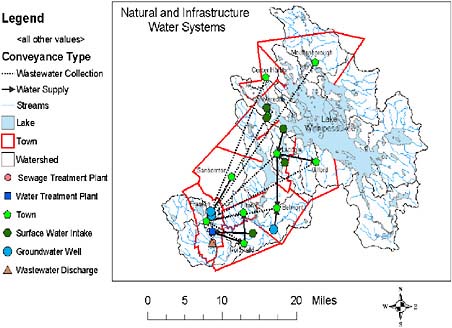
FIGURE 1-2 Combination of the natural and infrastructure water systems, Lake Winnipesaukee, central New Hampshire. The figure demonstrates the complexity of the modern water cycle when water use is superimposed on the natural system. SOURCE: NRC (2002).
Three strategies are used individually or in combination to get around these problems, with varying degrees of success. First, when feasible, variables are measured at specific locations (“point” measurements). These include key terms in the water budget, such as precipitation, as well as other variables that correlate with water budget terms. Examples of the later include river stage, which is used to estimate river discharge; and air and water temperature, wind speed, and relative humidity, which are sometimes used to estimate lake evaporation. Second, remote sensing methods are used to provide information on the spatial distribution of key variables. These methods measure over large areas, but the measurements represent averages over some space and time “window”. For example, radar estimates of rainfall usually correspond to an area of 1-4 km2 and a time interval of 5-10 minutes. Remote sensing can be ground based, as in the case of radar measurements of rainfall, or based on aircraft or satellites. In general, the size of the space and time window increases with the elevation of the sensor.
Third, models are used to extend the utility of measurements. Models can be used to interpolate between point measurements. For example, models are used to estimate spatially distributed precipitation in mountainous watersheds based on point measurements and topography. Models can be used to estimate unmeasured quantities based on measured ones. Some such models are based on statistical relationships. For example, statistical models are used to estimate chlorophyll concentrations based on satellite measurements of certain wavelengths of light (Bailey and Werdell, 2006). Other models are based on physical principles. The estimation of lake evaporation from wind speed, temperature, and relative humidity is an example, although in practice it is usually necessary to calibrate the model using independent estimates of evaporation. Finally, models can be used to predict hydrological conditions under hypothetical conditions, such as future land use, land cover, and climate.
SHORTCOMINGS OF TRADITIONAL MEASUREMENT TECHNIQUES
Point measurements, remotely sensed measurements, and models have been used effectively to manage water resources and conduct research on hydrologic processes. However, traditional approaches have serious shortcomings. Even using models to combine point and remotely sensed measurements, it is often not possible to accurately characterize the spatial and temporal variation of critical water budget components, such as precipitation, evaporation, and ground water recharge. In many applications it is not even possible to obtain accurate estimates of the temporally and spatially averaged components, and hence “close the budget”. For example, for most aquifers there are no accurate estimates of recharge. Finally, currently used methods rarely provide sufficient information on the movement of water within important water stores, such as groundwater and lakes.
These failings are particularly problematic given the challenges of population growth, land-use change, climate change, and the growing importance of water and environmental quality. This is illustrated below in the context of surface-water quality and groundwater recharge.
The Federal Water Pollution Control Act (33 U.S.C. 1251 et seq.), commonly known as the Clean Water Act, requires that states identify sources of pollution in waters that fail to meet state water-quality standards and develop strategies to meet the standards. This process is often based on the use of water-quality models that are calibrated using historical water-quality data (e.g., Soil and Water Assessment Tool [SWAT], http://www.brc.tamus.edu/swat/). For the most part these models grossly simplify the processes that control the quality of natural waters. Water quality may vary greatly in space and time based on a large number of variables. A short list of these variables would include natural
factors such as geology, topography, meteorology, hydrology, and biology; and human activities such as urbanization, agriculture, and industrial activity. Seasonal variations are common, and even within a single storm event the “first flush” may contain a cocktail of hydrocarbons, heavy metals, and nutrients, whereas the later flow may be comparably clean (NRC, 1994). Given the expense of traditional water-quality data collection, it should be no surprise that few projects are able to resolve these variations.
Consider, for example, the disposition of sediment, phosphorus, nitrogen, and carbon as these constituents move through a watershed. Although there is a general understanding of the various processes involved, there is little quantitative information for specific watersheds. What is the residence time of sediment particles and associated phosphorus at key storage sites, such as colluvial deposits, floodplains, and wetlands? What is the bioavailability of that phosphorus. and how does it change over time? Where does denitrification occur and at what rate? How would changes in land use, land cover, and climate affect the transport of sediment, nutrients, and carbon? What is the most cost-effective configuration of management practices? The goals of the Clean Water Act may be difficult to meet until these questions are answered at the required level of accuracy for specific watersheds, or at least for appropriately defined classes of watershed.
Similar issues exist with respect to groundwater. Basin-wide groundwater recharge for watersheds with stream gages is often estimated from the streamflow records by separating out the baseflow component from the stormflow component using a variety of methods, or by evaluating displacement in the recession curve after a storm. But these approaches generally do not provide information on the horizontal distribution of recharge or on vertical partitioning in the case of multiple aquifers. Point estimates of recharge can be made by a variety of methods based on temperature, solutes, isotopes, and moisture contents, and water levels, but their utility can be limited due to high spatial variability. Rainfall-runoff models provide some information on the spatial distribution of recharge, but are limited by uncertain information on the spatial distribution of precipitation, evapotranspiration, and soil properties, as well as by limited understanding of the recharge process.
One critical knowledge gap is the role of focused recharge vs. diffuse recharge. It is well known (Logan and Rudolph, 1997; Hayashi et al., 2003) that focused recharge via surface-water bodies dominates in some landscapes; but there is also evidence that focused recharge through small depressions is important in other landscapes (Delin et al., 2000). Modeling focused recharge requires accurate, high-resolution topographic information, which is just becoming available through technologies such as LiDAR. Groundwater models are also useful for estimating the spatial distribution of recharge, although such estimation requires many observation wells and the results are generally confounded by spatial variation in aquifer properties.
A VISION FOR THE FUTURE
The looming challenges of population growth and global climate change demand that we improve our capacity to observe, understand, and manage hydrologic systems. Fortunately, recent and potential future technological innovations offer unprecedented possibilities to do so. Sensors are being developed that are smaller, less expensive, and require less power, allowing for deployment in much larger numbers. Researchers are designing sensors to provide previously unavailable information, such as real-time measurements of nutrient concentrations in surface, soil, or groundwater. Sensors are being arrayed in networks that enable the sharing of information and hence produce synergistic gains in observational capacity; these sensor networks offer the promise of filling critical gaps between traditional point and remotely sensed measurements. New sensors are being deployed on aircraft and satellites, and new ways are being thought of to use existing remote sensors. Computer models are being used to assimilate data from multiple sources to predict system behavior. And cyberinfrastructure initiatives are providing efficient and effective ways to share data with scientists, managers, and other potential users. An integrated hydrologic measurement system that exploits these important innovations would significantly increase our capacity to understand and manage our water resources.
Imagine, for example, the extent to which environmental forecasting and management would have been improved during the fall of 1999 when Hurricanes Dennis, Floyd, and Irene impacted North Carolina if there had existed an integrated hydrologic meas urement system. The combined use of remote sensing, soil moisture sensor networks, and spatially distributed hydrologic modeling would have provided better estimates of runoff from spatially and temporally variable source areas. The use of recently obtained statewide LiDAR elevation data would have enabled more accurate forecasting of floodwater levels in streams, rivers, and coastal areas. The coupled use of emerging biochemical nutrient sensors, soil moisture measurement networks, and an expanded, real-time, stream water quality sensor network would have provided estimates of the changes in nutrient stores and fluxes associated with storm and inter-storm periods. Use of all of the above-mentioned data in advanced atmospheric, hydrodynamic, and ecosystem models would have enabled the forecasting of nutrient flushing, water quality, and long-term impacts on the riverine and estuarine ecosystems, and would have likely provided critical insights into coupled system behavior. Finally, an advanced environmental cyberinfrastructure representation of the watershed based on the observational and modeling data would have provided the information required to assess vulnerability and risk to populations in different parts of the basin and coordinate emergency response. As another example, consider drought. In the United States, the persistence of low precipitation in the West led to a series of Western Governors’ Association meetings calling for a more effective drought early warning system (http://www.westgov.org/wga/publicat/nidis.pdf).
This resulted in the creation of the National Integrated Drought Information System (NIDIS), with the National Oceanic and Atmospheric Administration (NOAA) being the lead agency. Central to agency plans for drought information is an attempt to strengthen observing systems, integrate operational systems that exist at federal, state, and local levels, combine this information with satellite observations and forecast weather models operated by NOAA, and to deliver the information and early warning through a “web portal”. An effective NIDIS information system will require smart sensors to measure snow pack and melt—critical springtime data for the West—and to measure summertime soil moisture and near-surface meteorology (e.g., humidity), as well as satellite information that can provide a spatial perspective to the local in-situ measurements.
However, before these societal benefits can be reaped, there are significant challenges to overcome. Major technical challenges include those associated with the development of robust, accurate, and affordable water-quality sensors. All of the required technologies are expensive to develop, and many if not most will at least initially require public funding. Design and implementation of integrated hydrologic measurement systems require the cooperation of diverse sets of researchers, technologists, and decisionmakers. How can this cooperation be facilitated? Water management in the United States is typically local and rarely integrated. How can integrated hydrologic measurement benefit local decision-making? Or will the problems of population growth and climate argue for integrated water-resource decisionmaking (Potter, 2006)? This report explores these and other issues.
SCOPE AND ORGANIZATION OF THIS REPORT
The NRC’s Committee on Integrated Observations for Hydrologic and Related Sci-ences was asked to provide guidance and advice to its sponsors in accordance with its statement of task (Box 1-3). This report contains the results of that study.
The global water cycle and the corresponding international water programs serve as the backdrop for this report, and international themes are echoed throughout it. These are illustrated in Boxes 1-1 and 1-2 of this chapter, in the Central America Flash Flood Guidance System example of Chapter 3, in the case studies on “Water and Malaria in sub-Saharan Africa” and “Achieving Predictive Capabilities in Arctic Land-Surface Hydrology” of Chapter 4, and even in the recommendation for international collaboration in Chapter 5. However, consistent with the statement of task and the report title, the study emphasizes the U.S. experience. The study was requested, and funded, by U.S. agencies. Further, understanding and integrating the roles of the major international monitoring and observing systems would have added a level of complexity to the study
|
BOX 1-2 Special Challenges in Developing Countries: An East African Example Drought in less-developed regions poses additional observational problems to overcome if the promise of integrated observation systems is to be realized. In East Africa, drought has become severe after below-average rainfall in the first six years of the 21st century. In this region, there typically is a long, rainy season from February to June and a short, rainy season October to December. In 2005, initially good rains in January were not sustained; this resulted in drought that became severe when the fall, rainy season failed to materialize, with annual rainfall totals of 20 to 60 percent of normal (NOAA Climate Prediction Center). Interspersed with this lack of rainfall were devastating floods in the April to June year period in Ethiopia, Somalia, Kenya, and Uganda that left almost 200 dead and 300,000 displaced (Dartmouth Flood Observatory, http://www.dart-mouth.edu/~floods). The sparseness of in-situ meteorological hydrological networks has hampered the monitoring of flood and drought, especially the severity and extent, at sufficiently high resolution to be useful for disaster relief. Additionally, the development of more-skillful forecast models, ranging from short-term weather models to seasonal climatic and hydrological forecasting requires denser in-situ observations and/or the merging of in-situ and satellite measurements of rainfall, wind, and atmospheric profiles of temperature and humidity. Quantitative satellite observations, when merged with sparse in-situ measurements, can provide areal coverage of terrestrial water and environmental variables useful for forecasting and decisionmaking. Monitoring of weather and climate over Africa, and the assessment of drought and flood conditions is being done through the Famine Early Warning System Network funded by the U.S. Agency for International Development and operationally implemented by National Weather Service’s Climate Prediction Center. The National Aeronautics and Space Administration’s Earth Observatory and Natural Hazards (http://earthobservatory.nasa.gov/NaturalHazards/) offers imagery related to floods, droughts, and other hazards globally. But, the above information tends to be qualitative (satellite imagery), poorly verified (e.g., the skill in seasonal precipitation and temperature forecasts), and dispersed among agencies and data centers, all making its usefulness for decisionmaking problematic. There is an information roadblock preventing the integration of these data with in-situ measurements—some technological and some institutional. An integrated Earth observation system useful for informed decisionmaking in Africa, or indeed anywhere, needs to combine new sensor technology for in-situ measurements, comprehensive satellite observations of the terrestrial water cycle, communications and data networking for the sensor networks and satellites systems, and computational platforms for merging the diverse data within models. It is also important to involve local communities and governments, taking into consideration their unique needs and customs, to ensure that equipment is maintained and human observations are integrated with sensor data. |
|
BOX 1-3 Statement of Task This study will examine the potential for integrating new and existing spaceborne observations with complementary airborne and ground-based observations to gain holistic understanding of hydrologic and related biogeochemical and ecological processes and to help support water and related land resource management. These systems are closely interconnected, and a great deal of common information is required in their study. The goal is to focus on information that would contribute to quantifying current and projected water availability, water quality and biogeochemical cycling, and land-surface and related ecologic conditions. The assessment would consider these goals in the light of the capabilities of sensor and other in-situ monitoring technologies and of spaceborne observation technologies. It would also look at likely advances in these technologies. The study will
|
that would have detracted from its core messages, which are directed toward the U.S. government.
Not all technologies and topics related to water are covered in the report. For example, despite their fundamental importance to the conduct of water research at any but the smallest scale, there is only cursory mention of stream gages. This is due primarily to the fact that such gages are based on technology that
was developed in the late 19th and early 20th centuries. As another example, glaciers are covered only marginally in the report. This is for two reasons. The first is that relative to related phenomena such as seasonal snowmelt, glaciers play only a small role in the water management picture in the United States. A second is that glaciers are traditionally considered part of the cryosphere—along with ice sheets, sea ice, and permafrost—and are thoroughly covered in studies involving global climate change and cold region processes.
The planning, design, operation, and utilization of an integrated observational-modeling system involves many elements, or stages. These include (a) defining goals, which may include specific “deliverables” for a narrowly defined research project or flexible targets when the project is established for broader and potentially changing uses; (b) building a team with appropriate expertise to define and oversee accomplishment of the goals; (c) designing the project to achieve the goals, either specifically or with flexibility to allow for multiple-use data; (d) collecting and validating the data, integrating and validating new data collection methods as appropriate over time; (e) organizing the large data sets for a variety of different uses; (f) integrating observations across sensors and networks; (g) merging the integrated observations with models and model validation; and (h) delivering the information products to those applying them to flood and drought forecasting, water management planning, disaster response, source water protection, and other areas. These steps are described in more detail in Appendix C.
The first three steps are explicitly or implicitly part of the case studies summarized in Chapter 4, but since they are common to all interdisciplinary projects are not discussed explicitly in the report. The last five steps are the subject of Chapters 2 and 3. Thus, Chapter 2 discusses innovations in sensor technologies. Chapter 3 outlines how data collected using existing and emerging technologies can be integrated and assimilated into models and communicated to the user. Chapter 4 uses case studies to illustrate how these innovations are, and could be, applied in specific settings. Finally, Chapter 5 synthesizes the lessons learned from the case studies and from other ongoing activities, and summarizes the committee’s findings and recommendations.


