
4
Energy Efficiency
The United States is the world’s largest consumer of energy. In 2006, it was responsible for some 20 percent of global primary energy consumption, while its closest competitor, China, used 15 percent (IEA, 2009). But given the energy-security concerns over oil imports, recent volatility in energy prices, and the greenhouse gas emissions associated with energy consumption, using energy more efficiently has become an important priority. Fortunately, the potential for higher energy efficiency1 is great.
This chapter focuses on the technologies that could increase energy efficiency over the next decade. It describes their state of development, the potential for their use, and their associated performance, costs, and environmental impacts. For these technologies to make a difference, however, they will have to be widely adopted. Hence, the chapter also addresses the sometimes formidable barriers to achieving such market penetration (see Box 4.1 for examples) and the experience that has been gained with policies and programs aimed at overcoming these barriers.
In fact, continued technological advances make energy efficiency a dynamic resource. When new efficient or otherwise advanced technologies reach the market, they hold the potential for reducing the then current level of energy use or moderating its growth. This chapter reviews some of these advanced technologies—some of which could become available and cost-effective in the
|
BOX 4.1 Why Energy Efficiency Opportunities Aren’t More Attractive to Consumers and Businesses Why don’t consumers and businesses take greater advantage of cost-effective energy efficiency opportunities? If so much energy can be saved, why doesn’t everyone do it, especially when the cost savings over time tend to well outweigh the initial costs? The answer is complex, as there is no one reason for this seeming behavior gap. Each of this chapter’s sector discussions, as well as the policy discussion at the end of the chapter, identify factors—commonly called barriers—that impede the full uptake of energy efficiency technologies and measures. They fall into several categories, but the following examples illustrate how some of them affect decisions:
|
2020–3035 timeframe and beyond—and the research and development (R&D) needed to support their development.
ENERGY USE IN THE UNITED STATES AND THE POTENTIAL FOR IMPROVED ENERGY EFFICIENCY
In 2008, the United States used 99.4 quadrillion Btu (quads) of primary energy (see Figure 4.1). About 31 percent of this total was consumed in industry,
More details on how barriers such as these play out in the buildings, transportation, and industrial sectors are given later in this chapter. |
28 percent in transportation activities, and about 41 percent in the myriad activities and services associated with residential and commercial buildings. Figure 4.2 provides more detail, breaking out energy consumption by source and sector and also defining “primary” energy.
Energy use in the United States has grown steadily since 1949, with the exception of a dip in the mid-1970s during the oil crisis. Energy consumption today is double what it was in 1963 and 40 percent higher than it was in 1975 (the low point following the oil crisis). But there has also been progress in increasing the efficiency of energy use. The nation’s energy use per dollar of gross domes-
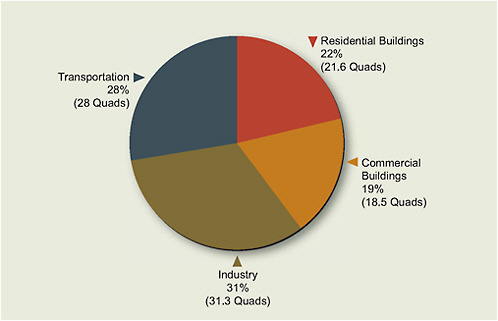
FIGURE 4.1 Total U.S. energy use by sector, 2008 (quadrillion Btu, or quads).
Notes: For each sector, “total energy use” is direct (primary) fuel use plus purchased electricity plus apportioned electricity-system losses. Economy wide, total U.S. primary energy use in 2008 was 99.4 quads.
Source: EIA, 2009a, as updated by EIA, 2009b.
tic product (GDP) has been cut in half since 1973, with about 70 percent of that decline resulting from improvements in energy efficiency (IEA, 2004). Nevertheless, the absolute amount of energy used continues to rise.
Yet the potential for higher energy efficiency is large, as illustrated by two points. First, despite the impressive gains made by the United States over the last 30 years, almost all other developed nations use less energy per capita and less energy per dollar of GDP (see Table 4.1 and Figure 1.5 in Chapter 1). Denmark’s levels of usage, for example, are about half on both measures. While there are structural variations that account for part of this gap, some 50 percent of it results from differences in energy efficiency (Weber, 2009).
The second point is that a greater number of energy-efficient and cost-effective technologies are available today to supply such services as lighting, heating, cooling, refrigeration, transport, and computing—all of which are needed throughout the economy and constitute the underlying driver of the demand for energy. Hundreds of realistic and demonstrated technologies, some already
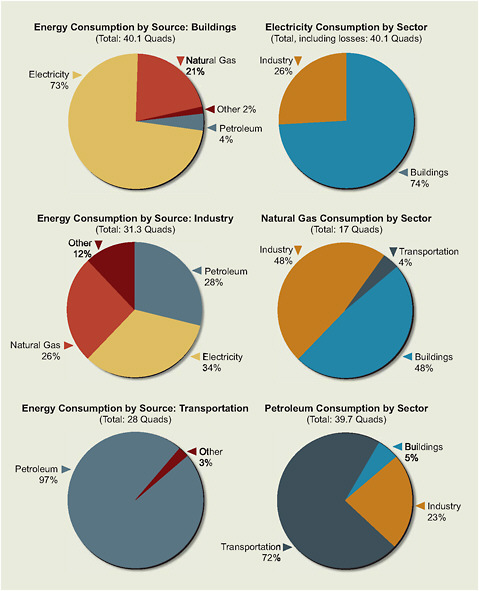
FIGURE 4.2 U.S. energy consumption by source and end-use sector, 2008 (quads).
Note: Does not include consumption in the electric power sector. Electricity includes delivered electricity as well as the allocated losses incurred in the generation, transmission, and distribution of electricity. “Delivered” energy refers to the electricity delivered to a site plus the fuels used directly on site (e.g., natural gas for heating water). This measure does not account for the losses incurred in generating, transmitting, and distributing the electricity. Delivered energy plus these losses is referred to as “primary” energy.
Source: EIA, 2009a, as updated by EIA, 2009b.
TABLE 4.1 Energy Use in 2006, per Capita and per Dollar of GDP (2000 Dollars)
|
|
Million Btu per Person |
Btu per Dollar of GDP |
|
Denmark |
161 |
4971 |
|
Germany |
178 |
7260 |
|
Japan |
179 |
4467 |
|
France |
181 |
7767 |
|
United States |
335 |
8841 |
|
Source: DOE, 2006b. |
||
commercial and some just beginning to enter the market, can provide these services more efficiently than is the case today, and they can collectively save large amounts of energy.
This chapter documents the AEF Committee’s review of the performance, costs, and environmental impacts—primarily greenhouse gas emissions2—of energy-efficient technologies and processes that are currently ready for implementation; technologies that need some further development; and scientific concepts that promise major efficiency improvements in the future. The assessment followed the traditional organization of energy use into three sectors: buildings (both residential and commercial), transportation, and industry. Further, each was considered over three timeframes—the present to 2020, 2020 to 2035, and 2035 to 2050. The first period received major attention because so many cost-effective technologies are ready for implementation today or will be ready within a few years.
The committee examined the available energy efficiency literature and performed additional analyses with primary data. The committee was able to estimate energy efficiency supply curves for electricity and natural gas in the residential and commercial sectors, showing the amount of energy that could be saved over a range of costs. In the transportation sector, the committee focused on alternative technologies that could power the nation’s cars and light trucks. By estimating the costs and energy savings associated with each technology as R&D improved
it over time, and the timeframes in which specific technologies can be expected to penetrate the market, the committee was able to develop illustrative scenarios of how total energy consumption could evolve. Confronted with myriad, diverse manufacturing industries, the committee focused on the five most energy-intensive industries. The committee examined other technologies, although in less detail.
For each sector, comparisons were made to a baseline, or business-as-usual, case in order to derive the potential for energy savings. For the buildings and industrial sectors, this was the reference-case scenario of the U.S. Energy Information Administration’s (EIA’s) Annual Energy Outlook 2007 or 2008 (EIA, 2007a, 2008161). For the transportation sector, a committee-directed baseline was derived. In all cases, though, the study estimates the level of energy-efficiency improvement beyond the baseline or reference case. More details can be found in the report titled Real Prospects for Energy Efficiency in the United States (NAS-NAE-NRC, 2009).
ENERGY EFFICIENCY IN RESIDENTIAL AND COMMERCIAL BUILDINGS
Energy Use in U.S. Buildings
In 2006, the United States had approximately 81 million single-family homes, 25 million multifamily housing units, 7 million mobile homes, and 75 billion square feet of floor space contained within 5 million commercial buildings (EIA, 2008). The building stock is long-lived; homes last 100 years or more, commercial buildings often last 50 years or more, and appliances used in buildings last 10 to 20 years. In 2008, residential and commercial buildings accounted for 73 percent of total electricity use in the United States and 40 percent of total primary energy use (Figures 4.1 and 4.2).
Use of delivered energy in the residential sector increased by 15 percent from 1975 to 2005, and in the commercial sector it grew by 50 percent. Meanwhile, primary energy grew by 46 percent and 90 percent, respectively, in the residential and commercial sectors. Despite these increases, energy “intensity”—energy use per unit of service or activity—decreased over that time span.
In the residential sector, on-site energy intensity, measured as energy use per household, fell by about 33 percent during 1978–2001, while primary energy use per household declined by 20 percent. In the commercial sector, on-site energy intensity, measured as energy use per square foot of floor area, dropped by about
20 percent during 1979–2003, while primary energy use per square foot decreased by 6 percent. The difference between on-site and primary-energy-use growth rates was due to growing electrification, which engendered sizable generating, transmitting, and distributing losses.
Factors that have affected energy use in buildings over the last several decades include increased electrification, population shifts to milder climates, growing penetration of appliances and electronics, larger home sizes, smaller households, growing household incomes, and dramatic improvements in the energy efficiency of appliances and other equipment. The last item is a key factor in the decline in energy intensity of buildings over the past 30 years. For example, the average electricity use of new refrigerators sold in 2007 was 71 percent less than that of new refrigerators sold in 1977 (AHAM, 2008), despite their becoming larger and having more features.
Significant energy efficiency gains have also been made in lighting. Sales and use of compact fluorescent lamps, which consume about 75 percent less electricity per unit of light output than incandescent lamps consume, have greatly increased in the past decade. In commercial buildings, energy-efficient fluorescent lighting fixtures containing T8 fluorescent lamps and high-frequency electronic lamp ballasts use 15–30 percent less energy per unit of light output than do older fixtures with T12 lamps and electromagnetic ballasts. These devices also have been used increasingly in recent years, as periodic surveys by the EIA attest. However, a large fraction of commercial buildings still have not embraced common energy efficiency measures such as energy management and control systems.
The adoption of ENERGY STAR®-labeled products has also grown substantially in recent years. For example, the construction and certification of ENERGY STAR® new homes increased from about 57,000 in 2001 to 189,000 in 2006, or 11.4 percent of all new homes built that year.
Energy Efficiency Improvement in Buildings
Many studies, whether on the local, regional, national, or global levels, have estimated the potential for improved energy efficiency in buildings.3 For the most part, these efforts evaluate the quantity of savings that could be realistically
achieved as a function of the cost of the saved energy, and they generally show consistent findings despite differences in assumptions and approaches.
Across the two building sectors, the studies demonstrate a median technical potential for improved energy efficiency of 33 percent for electricity (32 percent for the residential sector and 36 percent for the commercial sector) and 40 percent for natural gas (48 percent for residential and 20 percent for commercial), after accounting for energy prices and implementation barriers. The median cost-effective and achievable potential is 24 percent for electricity (26 percent for residential and 22 percent for commercial). For natural gas, this measure is 9 percent (9 percent for residential and 8 percent for commercial), but it could increase considerably as gas prices rise or could decrease as gas prices fall.
These studies have limitations, however, and care must be taken in their use. The question, How much efficiency is available at what price? is not well framed because “available” is ambiguous for several reasons. Among them are the timeframe over which the potential applies, the level of incentive required, and the motivation of society. In addition, the studies can underestimate the potential because of biases that might, among other things, exclude new and emerging technologies, hold technology static, or fail to consider nonenergy benefits. Conversely, the studies may overestimate savings by being excessively optimistic about energy efficiency potential.
Nevertheless, the potential for cost-effective energy efficiency improvements in buildings is large. And the prospects for savings will grow as new technologies become available, existing technologies are refined, and energy efficiency measures begin to be implemented in an integrated manner—often, with synergistic effects (such as those that can result from a whole-building approach to building design).
Approaches to Understanding Efficiency Potential
Analysts have developed a variety of ways to investigate the technologies and design principles that could make buildings more efficient. The two most important are the integrated approach and the technology-by-technology approach.
Integrated Approach
An integrated (also known as a whole-building or system-wide) approach to improving energy efficiency considers the energy consumption, and the set of improvements that could save energy, for entire buildings. It accounts for the ability to reduce energy use through design considerations—such as incorporation of
day lighting or reorientation or strategic placement of equipment to reduce heating and cooling loads—as well as through high-efficiency systems and equipment.
For residential buildings, a whole-house approach using a cost-effectiveness criterion can result in savings of 50 percent or more in heating and cooling and 30–40 percent reductions in total energy use. This conclusion is supported by the fact that more than 8,000 single-family households applied for the federal tax credit for 50 percent savings during its first year of availability. For 2008, the number of qualifying homes grew to more than 23,000, about 4.6 percent of all homes built. There are examples in Europe of new residences that have achieved even lower levels of energy consumption.4
For commercial buildings, several studies have reviewed the small but growing number of structures that have achieved 50 percent reductions in the energy needed for heating, cooling, and water heating. Most of these buildings have relied on
-
High-efficiency electrical lighting systems, which use state-of-the-art lamps, ballasts, and luminaires (complete lighting fixtures)
-
Luminaires chosen to provide the desired amount of lighting in the right places, coupled with the use of natural day lighting and associated controls that limit electrical lighting correspondingly
-
Fenestration (window) systems that reduce heat gains while providing daylight
-
Heating, ventilation, and air-conditioning controls that provide effective operation of the system during part-load conditions.
A few low-energy buildings have also made use of such on-site generation options as combined heat and power (CHP) systems5 or solar photovoltaic (PV) systems.6
This whole-building approach is usually applied to new buildings, but in some cases it can be used to identify the potential for system-wide savings in existing buildings.
|
4 |
See, for example, www.businessweek.com/globalbiz/content/apr2007/gb20070413_167016.htm. |
|
5 |
Combined heat and power (CHP) units transform a fuel (generally natural gas) into electricity and then use the remaining heat for applications such as space and hot-water heating or industrial and commercial processes. |
|
6 |
See the “Getting to Fifty” website, www.newbuildings.org/gtf. |
End-Use and Technology Approach
Some integrated approaches—for example, strategic placement of ductwork—are most easily applied to new buildings. A second approach, useful for existing buildings, relies on the one-by-one review of major categories of energy use and consideration of the types of efficiency measures and technologies that could be applied to them. For example, efficiency in the provision of space heating and cooling could be raised by upgrading furnaces, using variable-speed motors, reducing leakage, increasing insulation, and applying other measures, most of which could be incorporated into existing buildings.
This technology-by-technology approach can be carried out on as detailed or disaggregated a level as desired. A drawback is that it misses the kinds of integrated measures that can be identified with the whole-building approach.
Potential for Efficiency Improvement: Conservation Supply Curves
Developing conservation supply curves, which have been used widely in analyses of energy use in buildings to display the results of technology-by-technology or measure-by-measure assessments, involves evaluating a comprehensive list of measures that could be taken and ranking them in order of the cost of conserved energy (CCE).7 Each measure is evaluated not in isolation but in the context of the measures that have already been taken. Most of the studies reviewed for this report relied on the technology-by-technology approach to develop supply curves for both residential and commercial buildings. To reconcile the results across studies, this report integrates and updates these data to produce new conservation supply curves that can be applied at the national level.
The reference-case scenario of the EIA’s Annual Energy Outlook 2007 (EIA, 2007a) is used as the baseline for this analysis,8 which mostly involves technolo-
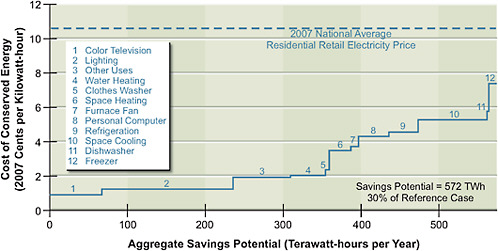
FIGURE 4.3 Residential electricity savings potential, 2030.
Source: Brown et al., 2008.
gies that are widely available in the market and well proven. Embedded in the scenario is the assumption that energy efficiency will improve over time in response to market forces as well as to codes and standards. Under these conditions, residential electricity use is projected to increase by an average of 1.4 percent per year, and commercial electricity use by 1.9 percent per year, over the period from 2006 to 2030. The potential for energy savings that is computed here is above and beyond that embodied in the baseline used for the analysis.
Figures 4.3 through 4.6 are the supply curves developed for this study. They illustrate the potential for energy efficiency improvements over the period 2010–2030 in the residential and commercial sectors for electricity and natural gas. The x-axis shows the total reduction in 2030 energy consumption, while the y-axis shows the CCE in fuel-specific units. Each step on the curve represents the total savings for a given end-use for all the cost-effective efficiency measures analyzed to that point. These plots are referred to as supply curves because they indicate how much energy savings is available for a given cost, with the CCE calculated as
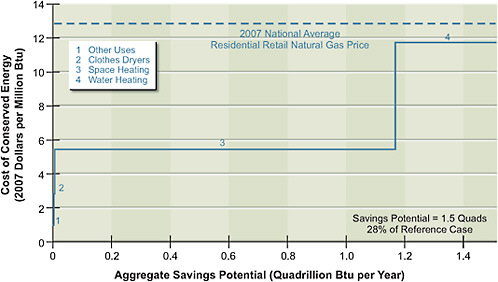
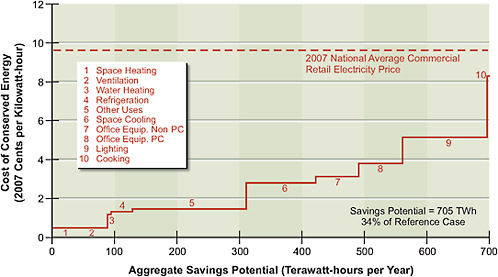
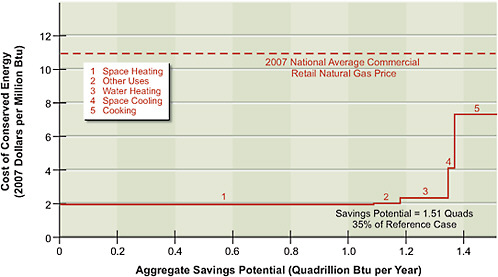
FIGURE 4.6 Commercial natural gas savings potential, 2030.
Source: Brown et al., 2008.
the weighted average of savings for all the measures in that end-use cluster. (The CCE here is given in terms of delivered energy.)
Table 4.2 compares the average CCE with the national average retail energy price. The analysis indicates that the projected baseline energy use in 2030 can be reduced by about 30–35 percent at a cost less than current average retail energy prices. That the results show an average CCE well below the retail energy prices in all areas means that adopting efficiency measures is very cost-effective for households and businesses: the average CCE for electricity-savings measures is only about one-quarter of the average retail electricity price. Of course, factors such as local energy prices and weather will influence cost-effectiveness in any particular location.
For the entire buildings sector, the cumulative capital investment needed between 2010 and 2030 is estimated to be about $440 billion to achieve annual energy-bill savings in 2030 of nearly $170 billion. These savings result in an average simple payback period of 2½ years, or savings over the life of the measures that are nearly 3.5 times larger than the investment required. (This analysis considers only the cost [or incremental cost] of the efficiency measures to purchasers; it does not include the costs of policies and programs aimed at increasing the adoption of the measures.)
TABLE 4.2 Comparison of Average Cost of Conserved Energy in Residential and Commercial Buildings with National Average Retail Energy Price, 2007
Advanced Technologies and Integrated Approaches
Advanced technologies for buildings promise large additional increases in efficiency. Most are available today but await further development and cost reduction. They include discrete technologies such as solid-state lighting, advanced windows, and high-efficiency air-conditioning equipment as well as the full integration of technologies into new and highly efficient buildings, both residential and commercial. These technologies demonstrate that energy efficiency is a dynamic resource—new and improved alternatives now under development will reach the marketplace in the future, thereby increasing the potential for energy efficiency and energy savings. (This review does not include many promising advanced technologies related to building materials, design, and appliances.)
Solid-State Lighting
Unlike compact fluorescent lights (CFLs), light-emitting diodes (LEDs) are point light sources that require no warm-up period, do not contain mercury, and are readily dimmable. They are increasingly available today. The best white LEDs are now more efficient than fluorescent lamps are. White LEDs are expected to reach 150 lumens per watt, more than twice the efficiency of CFLs (Craford, 2008).
Cost is the primary issue with LEDs, but it is decreasing rapidly, and this trend is expected to continue. For example, a 1000-lumen LED source that costs around $25 (wholesale) today is projected by the U.S. Department of Energy (DOE) to cost $2 in 2015 (DOE, 2008).
Highly Integrated Cooling Systems
Cooling is one of the largest users of energy in residential and commercial buildings, responsible for about 10 percent of total U.S. electricity consumption and 25–30 percent of total peak electricity demand (DOE, 2007b; Koomey and Brown, 2002). Cooling demand could be reduced or eliminated entirely in some climates by combining existing measures—such as highly efficient building envelopes, shading, reflective surfaces and roofs, natural ventilation, and thermal storage—with emerging technologies that are designed to supplement or replace vapor compression-based cooling with low-energy, thermally driven cooling approaches. These technologies include indirect and indirect-direct evaporative cooling, solar-thermal cooling systems, and thermally activated desiccants. Each option has already been used commercially as an individual component, but further R&D and commercial demonstration projects are needed to develop the technologies as integrated systems boasting optimized performance.
Technologies to Reduce Energy Consumption in Home Electronics
Consumer products dealing with information processing are responsible for about 13 percent of residential electricity use (Roth and McKenney, 2007; EIA, 2008). Numerous efficiency improvements have already been incorporated into them, and many observe ENERGY STAR® specifications, but energy use continues to increase in a few important products such as flat-panel televisions and set-top boxes. Strategies to reduce the energy used by consumer electronics include improving power supplies; designing smaller and more efficient circuitry; incorporating automatic power-down features, allowing products on a network to operate at a low-power sleep level without losing network connectivity; and designing “power strips” to manage energy consumption in clusters of products. These strategies are already evident in a few products but have had minimal impact on energy use to date. The efficiency of the products themselves can be expected to increase as the devices become ever smaller, and with the development of new materials and other advances that can reduce energy demands.
Advanced Window Technologies
Windows are responsible for about 2.7 quads of energy use annually in homes and about 1.5 quads in the commercial sector—primarily from the losses through energy leakage that they allow—and they affect another 1.0 quad of potential
lighting energy savings (Apte and Arasteh, 2006). Advances have largely been made by reducing the heat-transfer coefficient (U-value) of windows through the use of low-emissivity (low-E) coatings and by reducing the solar-heat-gain coefficient (SHGC) via spectrally selective low-E coatings. The U-value is the primary determinant of winter heat loss; the SHGC is the primary determinant of summer cooling loads.
Two new window-technology advances, now available in niche markets, could have far-reaching implications if they became mainstream products and systems. The first is highly insulating “superwindows” that achieve U-values in the range of 0.1–0.2, as compared with a typical U-value of 0.5 for double-glazing and 0.35–0.4 for the ENERGY STAR® windows currently being sold in cold climates. The second advance is a new generation of dynamic products that reduce cooling loads and electric illumination when daylighting is available in commercial buildings. The full penetration of these advanced technologies into the building stock, which could take decades, might shift the role of windows in buildings to being approximately “energy neutral.”
Low-Energy and Zero-Net-Energy New Homes
It is possible to construct homes that combine high levels of energy efficiency—in the building envelope, heating and cooling systems, and appliances—with passive and active solar features in order to approach zero-net-energy consumption.9
The whole-building approach described earlier is being used by the DOE to reach a zero-net-energy consumption goal. For example, two highly instrumented homes were built with the same floor plan in Lakeland, Florida, in 1998 (Parker et al., 2000). Over 1 year, the control home used 22,600 kWh of electricity. During that same year, the experimental home used only 6,960 kWh, a reduction of 70 percent. The experimental home also had solar PV production of 6,180 kWh. When this production is accounted for, the experimental home’s net energy use was only 780 kWh, about a 97 percent reduction relative to the control home.10
Low-Energy New Commercial Buildings
The best-performing commercial buildings in the country achieve energy-use reductions of 50 percent or more below standard practice by successfully integrating multiple “state-of-the-shelf” technologies11 (Turner and Frankel, 2008).12 This represents a huge opportunity for improved energy performance using existing and available technologies (Griffith et al., 2007). To achieve such high performance requires that integration, interaction, quality control, and monitoring be employed throughout the design, construction, and operation of the building.
Barriers to Improving Energy Efficiency in Buildings
Numerous barriers hinder the adoption of energy-efficient technologies in buildings. They vary in their relevance to particular situations and in the difficulty of their being overcome. Many of these barriers also apply to other sectors.
Environmental and social costs are usually not reflected in the price of energy. The price does include costs associated with meeting environmental standards, but other adverse environmental impacts, such as emissions of mercury or carbon dioxide, land disruption, and legal water contamination, are not factored in. Also, the costs incurred by society in defending sources and protecting shipments of oil and other energy imports are not included in energy prices. As a result, more fossil energy is used than would otherwise be the case.
Various types of fiscal policies may discourage investment in energy efficiency. For example, capital investments in commercial buildings must be depreciated over more than 30 years, while energy purchases can be fully deducted from taxable income the year they occur (Brown, 2001).
Some regulatory policies also discourage investment in energy efficiency. In particular, policies that allow public utilities to increase their profits by selling more electricity or natural gas are disincentives to effective utility energy efficiency programs (Carter, 2001). Many utilities also have applied tariffs and interconnection standards that discourage end users from adopting energy-efficient CHP
|
11 |
“State-of-the-shelf” technologies represent the state-of-the-art selection of technologies that are widely available (on the shelf) today. |
|
12 |
See also www.gettingtofifty.org for a searchable database of information about projects with energy performance targets that are 50 percent beyond the ASHRAE (American Society of Heating, Refrigerating and Air-Conditioning Engineers) standard 90.1-2001 (NBI, 2008). |
systems (Brooks et al., 2006a,b). Variabilities in the stringency and enforcement of building energy codes across states and localities constitute another barrier to energy efficiency in buildings (Brown et al., 2007).
Misplaced incentives, also known as split incentives or principal-agent problems, exist in numerous situations. The most visible example is in rental markets, where building owners are responsible for investment decisions but tenants pay the energy bills. Studies have revealed lower levels of energy efficiency in U.S. dwellings occupied by renters compared to those occupied by owners.
Misplaced incentives are found in new-construction markets as well, where decisions about building design and features are also made by people who are not responsible for paying the energy bills. Architects, builders, and contractors have an incentive to minimize first cost in order to win bids and maximize their profits (Koomey, 1990; Brown et al., 2007). Moreover, commercial leases are often structured so that the landlord allocates energy costs to tenants based on the amount of square footage leased rather than on the amount of energy used (Lovins, 1992).
It can take many years to inform and educate a large majority of households and businesses about energy efficiency options. For example, after nearly 8 years of active promotion and incentives for the use of compact fluorescent lamps, nearly one-third of households surveyed in the Pacific Northwest in late 2004 were still unaware of them (Rasmussen et al., 2005).
Lack of information is an even greater problem and a harder one to fix for individual end-uses. For example, when a tenant of a commercial building buys office equipment, its electricity usage is not individually metered. And not a single end-use in homes is ever metered separately. Householders have no direct information as to whether their computer or video game box or hair dryer is a big energy user or a trivial one.
Businesses tend to pay limited attention to energy use and energy-savings opportunities if energy costs are a small fraction of the total cost of owning or operating the business or factory—or if energy efficiency is not viewed as a priority by company management. As a result, many businesses limit energy efficiency investments to projects with payback periods of no more than 2 or 3 years (DeCanio, 1993; Geller, 2003).
Some highly efficient appliances or other energy efficiency measures are relatively new and still not widely available in the marketplace or not well supported by product providers (Hall et al., 2005). And some very effective energy efficiency
services, such as duct testing and sealing, and recommissioning of existing buildings, are not widely available in many parts of the country.13
Many households have limited resources and limited access to credit, which restricts their ability to invest in energy efficiency measures. In addition, some businesses (particularly small ones) have insufficient capital or borrowing ability.
Drivers for Improving Energy Efficiency in Buildings
Numerous factors—rising fuel and electricity costs, growing environmental awareness, increasing interest by consumers in cutting greenhouse gas emissions, the expanding number of “green” buildings, and corporate environmental initiatives—can help to overcome the barriers just described. Likewise, many energy efficiency measures provide nonenergy benefits that encourage their adoption. In addition, public policies—including building energy codes, appliance efficiency standards, and state and utility efficiency programs—are stimulating greater adoption of efficiency measures. See the section titled “Energy Efficiency Policies and Programs: Experience and Lessons Learned” (later in this chapter) for a review of experiences with some of these policies and programs.
Findings: Buildings
Studies taking several different approaches are consistent in finding the potential for large, cost-effective energy savings in buildings. Median predictions of achievable and cost-effective savings are 1.2 percent per year for electricity and 0.5 percent per year for natural gas, amounting to a 25–30 percent energy savings for the buildings sector as a whole over 20–25 years. The committee’s analysis suggests that baseline energy use can be reduced by 30–35 percent by 2030 at a cost less than current retail energy prices. If these savings were to be achieved, they would hold energy use in this sector about constant, in contrast to the current trend of continuing growth.
The full deployment of cost-effective energy-efficient technologies in buildings alone could eliminate the need to add to electricity generation capacity. Since the estimated electricity savings in buildings exceeds the EIA forecast for new net generation, implementing these efficiency measures would mean that no new
generation would be required except to address regional supply imbalances, to replace obsolete generation assets, or to substitute more environmentally benign generation sources. This conclusion assumes that electricity demand does not grow faster than the EIA forecast or that new demand does not require more generation capacity (e.g., electric vehicles are charged at night).
Studies of energy efficiency potential are subject to a number of limitations and biases. Factors such as not accounting for new and emerging energy efficiency technologies can lead these studies to underestimate energy-savings potential, particularly in the midterm and the long term. On the other hand, some previous studies have been overly optimistic about the cost and performance of certain efficiency measures, thereby overestimating energy-savings potential, particularly in the short term.
Many advanced technologies, including LED lights, innovative window systems, new types of integrated cooling systems, and power-saving electronic devices, are either commercially available already or likely to become available within the next decade. Their availability will further increase the energy-savings potential in buildings. In addition, new homes and commercial buildings with low overall energy use have been demonstrated throughout the country. With appropriate policies and programs, they could become the norm in new construction.
There are substantial barriers to widespread energy efficiency improvements in buildings, but a number of factors are counteracting these barriers. Drivers of increased energy efficiency include rising energy prices; growing concern about global climate change and the resulting willingness of consumers and businesses to take action to reduce emissions; more consumers moving toward “green buildings”; and growing recognition of the significant nonenergy benefits offered by energy efficiency measures.
ENERGY EFFICIENCY IN TRANSPORTATION
Energy Use in the U.S. Transportation Sector
The U.S. transportation sector is varied and complex, consisting of vast networks of land, air, and marine vehicles that are owned and operated by combinations of
public and private entities. As a whole, the sector’s activities use about 28 percent of the nation’s primary energy supply (see Figure 4.1), including more than 70 percent of all the petroleum. U.S. transportation is almost entirely dependent on petroleum, 56 percent of which was imported in 2008. Transportation also has environmental impacts. For example, it is responsible for about a third of all U.S. CO2 emissions arising from energy use, as well as for significant fractions of other air pollutants.
Passenger transport is dominated by personal automobiles and aviation.14 (Mass transit and scheduled intercity rail and bus services play important roles in some regions, but overall, they account for a modest proportion of total passenger-miles.) On the freight side, trucking dominates both with respect to tons and value of shipments.15 Thus, highway travel, for passengers and freight alike, is the preponderant mode of transportation in the United States, accounting for about 75 percent of all transportation energy use. Consequently, efficiency gains in highway vehicles will have the greatest effect on the transportation sector’s total consumption of energy.16
The motivators for energy efficiency in commercial transportation differ from those for private transportation. Lifetime operating cost, and thus energy efficiency, is important to companies supplying passenger and freight transportation. The commercial transportation sector is so highly competitive that even small cost differentials among firms can have major impacts on their profitability and growth. In contrast, consumer purchases of motor vehicles are influenced by many factors, including vehicle comfort, style, and operating performance. Historically, vehicle fuel efficiency has not been a major factor in consumer decisions. In addition, although there are many reasons for consumer choice of vehicles, from 1980 until recently U.S. gasoline prices had been falling (after accounting for inflation), which encouraged consumers to buy (and manufacturers to offer) larger, more powerful, and heavier vehicles.
Transportation energy consumption is also influenced by the physical networks of infrastructure through which vehicles move; by the logistic, institutional,
|
14 |
Bureau of Transportation Statistics, National Transportation Statistics. Available at www.bts.gov/publications/national_transportation_statistics/. |
|
15 |
Ibid. |
|
16 |
Nonetheless, other modes, such as mass transit, intercity rail, and water, have important roles to play in bringing about more energy-efficient passenger and freight transportation, particularly if traffic is shifted to them from the more energy-intensive highway and aviation modes. |
commercial, and economic considerations that determine the types of vehicles selected and how they are used; and by the performance of the infrastructure itself (e.g., in managing congestion). Energy use in air transportation, for example, is influenced by air-traffic management, and energy use in freight transport is affected by the possibilities (or lack thereof) for intermodal transfers. The functioning of the underlying physical and economic systems, in other words, can foster—or in some cases hinder—energy efficiency.
Potential for Energy Efficiency Improvements in Passenger Transportation
Automobiles account for the vast majority of local and medium-distance passenger-trips17 (those under 800 miles); airlines dominate for longer trips.
Light-Duty Vehicles
Globally, the major motivators for energy efficiency in light-duty vehicles (LDVs) are fuel prices, vehicle fuel-economy regulation, personal preferences, and environmental concerns. In Europe, a long history of elevated fuel taxes has been a major reason that motorists there have put a high priority on fuel efficiency when purchasing automobiles. In the United States, the corporate average fuel-economy (CAFE) standards have been the main impetus for boosting vehicle efficiency. Falling real fuel prices from 1980 to 2005, however, encouraged consumers to purchase larger, more powerful, and heavier vehicles rather than to seek greater fuel economy. However, during periods of high fuel prices (such as those prevailing in mid-2008), U.S. consumers have demonstrated more interest in fuel economy.
Today, the average fuel economy of new vehicles sold in the United States is about 25 mpg (new cars average 27.5 mpg compared with 22.3 mpg for light trucks). The U.S. Energy Independence and Security Act of 2007 (EISA 2007; P.L. 110-140) requires that CAFE standards be set for LDVs for model years 2011 through 2020. This provision aims to ensure that, by 2020, the industry-wide CAFE for all new passenger cars and light trucks combined will be at least 35 mpg18—a 40 percent increase over today’s average of 25 mpg.
While fuel economy in the United States has not improved for almost 30
years, vehicle fuel efficiency has improved. But the efficiency gains have been offset by increases in vehicle size and performance (Lutsey and Sperling, 2005; An and DeCicco, 2007).19
Current technologies offer many fuel-economy improvements, which become increasingly attractive as fuel prices rise. Opportunities through 2020 will apply primarily to today’s vehicle fleet of spark-ignition (SI) engines, compression-ignition (CI) diesel engines, and hybrid-electric vehicles (HEVs), fueled with petroleum, biofuels, or other nonpetroleum hydrocarbon fuels. Annual incremental improvements to engines, transmissions, and nonpropulsion systems are expected to continue. During the subsequent decade, plug-in hybrid-electric vehicles (PHEVs), using electricity plus any of the above-mentioned fuels, may become a significant part of new vehicle sales. Longer-term, substantial sales of hydrogen fuel-cell vehicles (FCVs) and battery-electric vehicles (BEVs) are possible. What follows are summaries of the possible improvements in efficiency that can be expected from new technologies for LDVs.
Engine Improvements in Light-Duty Vehicles
-
Gasoline spark-ignition engines. Technologies that improve the efficiency of gasoline SI engines, such as variable valve timing, cylinder deactivation, direct injection, and turbocharging with engine downsizing, could be deployed in large numbers over the next decade. Many of these are already being produced in low volumes. They have the potential to reduce fuel consumption20 in new vehicles, on average, by about 10–15 percent in the near term (through 2020) and an additional 15–20 percent over the longer term (15–20 years). It is expected that turbocharged but downsized gasoline engines will steadily replace a significant fraction of naturally aspirated (non-turbocharged) engines.
-
Diesel compression-ignition engines. Diesel CI engines offer about a 20–25 percent fuel consumption benefit over gasoline SI engines (when adjusted for the energy density of diesel fuel). There are opportunities for further efficiency improvements that could reduce the fuel consumption of new diesel-engine vehicles relative to current diesel vehicles by about 10 percent by 2020 and an additional 10–15 percent by 2030. New technologies are emerging for after-treatment that reduce emissions of particulate matter and nitrogen oxides to levels comparable to those of SI engines. The primary challenges for diesel engines in the United States are the added costs and fuel penalties (of about 3–6 percent) associated with those after-treatment systems (Bandivadekar et al., 2008; Johnson, 2008, 2009; Ricardo, Inc., 2008).
-
Gasoline hybrid-electric vehicles. HEVs combine an internal-combustion engine (ICE) with a battery-electric motor/generator system. Their primary efficiency benefits derive from smaller engines, regenerative braking, elimination of idling, and optimization of engine operating conditions. Hybrid vehicles span a range of technologies and fuel-economy levels. Diesel HEVs are also under development.
-
Plug-in hybrid-electric vehicles. PHEVs have larger batteries than regular hybrids do, and they can be recharged from an external source of electricity. They also require a larger electric motor and higher-capacity power electronics. Hybrid vehicles, including PHEVs, are designed to allow all-electric operation powered by the battery. The driving range with all-electric power depends on factors such as the size of the battery, the weight of the vehicle, and the driving cycle. Unlike a hybrid-electric vehicle, a PHEV’s external power connection can recharge the battery when the vehicle is at rest and plugged in; the internal combustion engine can also recharge the battery, provide power to the wheels, or both, extending vehicle range. The capacity of the battery and the distance of the trip(s) determine gasoline savings; current hybrids in commercial production have a range of less than 10 miles on all-electric power. The vast majority of U.S. vehicles are driven less than 40–60 miles per day in normal operation. Thus, a battery that can power the vehicle for 40 to 60 miles could substantially reduce petroleum consumption for this duty cycle. Commercial PHEVs with a variety of ranges on all-electric power will likely be introduced to the U.S. market over the next 5 years. However, success
-
for a mass-market vehicle with relatively long driving range on battery power alone (e.g., 40 miles or more) will require development of a low-cost, lightweight battery that can store the needed electricity and last for 10 years or more (Box 4.2).
-
Battery-electric vehicles. Successful development and deployment of PHEVs using advanced battery technology might lead to a battery suitable for BEVs (see Box 4.2). Although several models of BEVs are being introduced into the market today in low volumes, in the foreseeable future the only commercially viable BEVs may be small cars with modest performance expectations, such as “city BEVs.”
-
Hydrogen fuel-cell vehicles. Several scientific, engineering, and business challenges must be met before hydrogen FCVs can be successfully commercialized.21 The principal challenges are to increase the durability and lower the costs of fuel cells, achieve cost-effective storage of hydrogen in fueling stations and on board vehicles, and deploy a hydrogen supply and fueling infrastructure with low greenhouse gas emissions. These vehicles offer tremendous potential for reductions in oil imports and CO2 emissions in the long term (beyond 2035) but little opportunity for impact before 2020 because of the time required to address the technical and cost challenges and, subsequently, to achieve high-volume production.
Transmission Improvements in Light-Duty Vehicles
Automatic-transmission efficiency is likely to improve in the near term to midterm through increasing the number of gears and reducing losses in bearings, gears, sealing elements, and hydraulic systems. Seven- and eight-speed transmissions may become standard in the midterm. A continuously variable transmission (CVT) would in principle allow an engine to operate near its maximum efficiency, but its estimated actual efficiency improvement is lower than that expected for six- or seven-speed transmissions.
Nonpropulsion System Improvements in Light-Duty Vehicles
Improvements to nonpropulsion systems can involve better tires with lower rolling resistance, body designs that reduce aerodynamic drag, and reductions in vehicle weight. Weight reduction can be achieved by using lightweight materials, by redesigning vehicles, and by reducing vehicle size. A 10 percent reduction in vehicle weight can reduce fuel consumption by 5–7 percent, when accompanied by appropriate engine downsizing at constant performance (Bandivadekar et al., 2008).
Summary of Potential Improvements and Costs for Light-Duty Vehicles
Table 4.3 shows plausible reductions in fuel consumption and CO2 emissions stemming from evolutionary improvements in LDVs as well as the use of new vehicle types. Evolutionary improvements could reduce the fuel consumption of gasoline ICE vehicles by up to 35 percent over the next 25 years. While diesel engines will also improve, the gap between gasoline and diesel fuel consumption is likely to narrow. Hybrid vehicles—both HEVs and PHEVs—could deliver deeper reductions in fuel consumption, although they would still depend on gasoline or other liquid fuels. Vehicles powered by batteries and hydrogen fuel cells need not depend on hydrocarbon fuels; if they were to run on electricity or hydrogen, they could have zero tailpipe emissions of CO2 and other pollutants. If the electricity or hydrogen were generated without CO2 emissions, they would have the potential to reduce total life-cycle CO2 emissions dramatically.
Table 4.4 shows the approximate incremental retail price of different vehicle systems (including the costs of emission-control systems), as compared with a baseline 2005 gasoline-fueled ICE vehicle. The estimates shown in Table 4.4, when combined with the estimates of fuel-consumption reductions shown in Table 4.3, indicate that from the driver’s perspective evolutionary improvements in gasoline ICE vehicles are likely to prove the most cost-effective choice for reducing petroleum consumption and CO2 emissions. Given that these vehicles will be sold in large quantities in the near term, it is critical that efficiency improvements in these vehicles not be offset by increased power and weight. While the current hybrids appear less competitive than a comparable diesel vehicle, they are likely to become more competitive over time, in part because hybrids can deliver greater absolute emission reduction than diesel vehicles can.
PHEVs, BEVs, and FCVs appear to be more costly alternatives for reducing petroleum consumption and CO2 emissions. Among these three technologies,
|
BOX 4.2 Status of Advanced Battery Technology Lead acid batteries were invented in the 19th century and are still the standard battery technology in vehicles today. The GM EV1, a production battery-electric vehicle (BEV), used this battery technology as recently as 1999, and then transitioned to the nickel-metal hydride (NiMH) battery. The next generation of batteries, based on lithium-ion chemistry, is widely deployed in consumer electronic devices. Of course, the power and energy storage requirements of these devices are much smaller than those of electric vehicles. Hybrid-electric vehicles (HEVs) require batteries with high power (commonly stated in units of watts per kilogram). Plug-in HEVs (PHEVs) and BEVs require significant energy storage (along with sufficient power). Today’s batteries have an energy storage capacity of 150–200 Wh/kg. A typical vehicle consumes approximately 0.25 kWh per mile in all-electric mode. Typical electric motors that can propel a vehicle require power ranging between 50 and 150 kW. Chemistries Table 4.2.1 summarizes the promising advanced battery chemistries and their performance characteristics. Significant amounts of research and development are being devoted to promising new versions of the chemistries of cathode materials, anode materials, and electrolytes, as well as to manufacturing processes. TABLE 4.2.1 Lithium-ion Battery Cathode Chemistries
|
|||||||||||||||||||||||||||||||||||||||||||||
|
Performance and Cost Targets The U.S. Advanced Battery Consortium (USABC) has established a set of long-term performance goals for electrochemical energy storage devices:
In addition, goals were established for battery life in terms of the number of 80 percent discharge cycles. Meeting these goals is likely to be required for widespread commercialization of electrically powered vehicles. Lithium-ion batteries currently lead in energy density (Wh/kg) metric and have an average annual improvement rate of 3.7 percent. Lead-acid batteries lead in the cost of stored energy ($/kWh) at $50/kWh and have an average annual reduction rate of around 3 percent. However, lead-acid batteries are unable to satisfy the battery life requirements for PHEVs and BEVs. Today’s lithium-ion batteries that have the cycle life desired for automotive applications cost between $500/kWh and $1000/kWh. The cost target (in $/kWh) is currently viewed as the greatest challenge for lithium-ion battery technology. Industry Developments The lithium-ion consumer electronics market is currently at around 2 billion units annually. The volume of lithium-ion batteries in automotive applications, however, is very small. Frost & Sullivan (2008) predict a 19.6 percent compound annual growth rate for shipments of HEV batteries, as well as a smaller but rapidly growing market for PHEV and BEV batteries. An auto battery alliance has been promoted by the U.S. Department of Energy’s Argonne National Laboratory and includes 3M, ActaCell, All Cell Technologies, Altair Nanotechnologies, EaglePicher, EnerSys, Envia Systems, FMC, Johnson Controls-Saft, MicroSun, Mobius Power, SiLyte, Superior Graphite, and Townsend Advanced Energy. All major vehicle manufacturers have partnered with major battery manufacturers: Ford with Johnson Controls-Saft, General Motors with LG Chem, Chrysler with General Electric, Toyota with Panasonic/Sanyo, Nissan with NEC via the Automotive Energy Supply joint venture, and Honda with GS Yuasa. Specialists anticipate that it may be 10 to 20 years before advanced battery technology can reach the USABC performance and cost targets. |
TABLE 4.3 Potential Reductions in Petroleum Use and Greenhouse Gas Emissions from Vehicle Efficiency Improvements over the Next 25 Years
|
Propulsion System |
Vehicle Petroleum Consumption (gasoline equivalent)a |
Greenhouse Gas Emissionsa |
||
|
Relative to Current Gasoline ICE |
Relative to 2035 Gasoline ICE |
Relative to Current Gasoline ICE |
Relative to 2035 Gasoline ICE |
|
|
Current gasoline |
1 |
— |
1 |
— |
|
Current turbocharged gasoline |
0.9 |
— |
0.9 |
— |
|
Current diesel |
0.8 |
— |
0.8 |
— |
|
Current hybrid |
0.75 |
— |
0.75 |
— |
|
2035 gasoline |
0.65 |
1 |
0.65 |
1 |
|
2035 turbocharged gasoline |
0.57 |
0.89 |
0.57 |
0.88 |
|
2035 diesel |
0.55 |
0.85 |
0.55 |
0.85 |
|
2035 HEV |
0.4 |
0.6 |
0.4 |
0.6 |
|
2035 PHEV |
0.2 |
0.3 |
0.35–0.45 |
0.55–0.7 |
|
2035 BEVb |
— |
— |
0.35–0.5 |
0.55–0.8 |
|
2035 HFCVb |
— |
— |
0.3–0.4 |
0.45–0.6 |
|
Note: These estimates assume that vehicle performance and size (acceleration and power-to-weight ratio) are kept constant at today’s levels. BEV, battery-electric vehicle; HEV, hybrid electric vehicle; HFCV, hydrogen fuel-cell vehicle; ICE, internal-combustion engine; PHEV, plug-in hybrid vehicle. aGreenhouse gas emissions from the electricity used in 2035 PHEVs, 2035 BEVs, and 2035 HFCVs are estimated from the projected U.S. average electricity grid mix in 2035. Greenhouse gas emissions from hydrogen production are estimated for hydrogen made from natural gas. bThe metric “vehicle petroleum consumption” is not applicable to vehicles powered by batteries and hydrogen fuel cells. Estimated greenhouse gas emissions are those resulting from production of the needed electricity and hydrogen. Source: Bandivadekar et al., 2008. |
||||
PHEVs are likely to become more widely available in the near term to midterm, whereas BEVs and FCVs are high-volume alternatives for the midterm to long term.
Deployment of Light-Duty Vehicle Technologies
To have a significant effect on fuel use in the vehicle fleet and on associated CO2 emissions, advanced-technology vehicles must garner a sizable market share. Generally, however, a decade or more elapses in developing a technology to a stage that it can be deployed, introduced on a commercial vehicle, and then achieve significant sales. There are also technical constraints on the speed with which the
TABLE 4.4 Estimated Additional Cost to Purchaser of Advanced Vehicles Relative to Baseline 2005 Average Gasoline Vehicle
market shares of advanced technologies can grow, such as the need for breakthroughs in battery performance and for a hydrogen-distribution infrastructure.
Table 4.5 shows the AEF Committee’s judgment, based on the constraints just outlined, of the extent to which these advanced vehicle technologies could plausibly penetrate the new LDV market in the United States. (Note that Table 4.5 is not intended to imply that all these technologies would necessarily be deployed together.) The estimates are intended as illustrations of achievable deployment levels, based on historical case studies of comparable technology changes; these estimates suggest that relative annual increases of 8–10 percent in the deployment rate are plausible. With changes in the factors that affect vehicle attributes or purchases, such as stricter regulatory standards or high fuel prices, the timeline for reaching these market shares could be shortened.
TABLE 4.5 Plausible Share of Advanced Light-Duty Vehicles in the New-Vehicle Market by 2020 and 2035 (percent)
Savings in Total Fleet Fuel Consumption from Deployment of Light-Duty Vehicles
As noted previously, the Energy Independence and Security Act of 2007 (EISA 2007) requires CAFE standards to be set for LDVs through 2020 in order to ensure that the industry-wide average fuel economy by that time is at least 35 mpg. This would be a 40 percent increase over today’s average of 25 mpg.22
The AEF Committee examined two scenarios to explore how the deployment of the advanced technologies listed in Table 4.3, together with vehicle-efficiency improvements (such as reductions in vehicle weight, aerodynamic drag, and tire rolling resistance), could reduce the petroleum consumption of the LDV fleet in the United States. These scenarios, based on the methodology described in Bandivadekar et al. (2008), are not predictions of what the LDV fleet will be like in the future. Instead, they are intended as illustrative examples of the degree of change to the LDV fleet that will be necessary to improve fleet average fuel economy. The two scenarios—termed “optimistic” and “conservative”—are described below.
-
Optimistic scenario. The new CAFE target of 35 mpg for LDVs is met in 2020. This improvement rate is then extrapolated out through 2035. Under this scenario, 75 percent of the improvement is used to reduce actual fuel consumption; the remaining 25 percent is offset by increases
-
in vehicle size, weight, and performance. The resulting new LDV fuel economy in 2035 is double today’s value.
-
Conservative scenario. The new CAFE target is met 5 years later, in 2025. This improvement rate is then extrapolated out through 2035. Under this scenario, only half of the improvement is used to reduce actual fuel consumption; the remaining half is offset by increases in vehicle size, weight, and performance. The resulting new LDV fuel economy in 2035 is 62 percent above today’s value.
Both scenarios are compared with a “no-change” baseline that corresponds roughly to meeting the EISA target for 2020. The baseline also includes some growth in overall fleet size and miles driven, but no resulting change in fuel consumption. This is because the baseline extrapolates the history of the past 20 years, during which time power train efficiency improvements essentially offset any negative effects on fuel consumption from increasing vehicle performance, size, and weight.
Based on the estimated fuel consumption characteristics of individual vehicle types, shown in Table 4.3, and the fleet efficiency improvements represented in the scenarios, Table 4.6 shows examples of the sales mixes and weight reduction that would be required to meet the CAFE targets and to meet the scenario assumptions beyond 2020. Figure 4.7 shows, for the two scenarios, the corresponding annual gasoline consumption of the U.S. in-use LDV fleet from the present out to 2035. Table 4.7 shows the cumulative fleet-wide fuel savings, as compared with the no-change baseline. These savings can be substantial so long as the proposed fuel-economy standards are met and the rate of improvement is sustained. Table 4.8 gives the corresponding annual fuel savings from the no-change baseline in 2020 and 2035.
Air Transportation
Air transportation represents almost half of nonhighway transportation energy use (personal and freight), or about 10 percent of total transportation energy consumption. Fuel expenditures are the largest operating cost for most airlines, thereby driving their investment decisions toward higher energy efficiency. For example, Boeing’s and Airbus’s newest generation of airliners, the Boeing 787 Dreamliner and 747-8, and the Airbus 350XWB, attain a 15–20 percent improvement in fuel efficiency over the aircraft they replace. The new aircraft all employ
TABLE 4.6 Illustrative Vehicle Sales Mix Scenarios
|
|
Percent Emphasis on Reducing Fuel Consumptiona |
Percent Light Trucks vs. Cars |
Percent Vehicle Weight Reduction |
Market Share by Power Train (percent) |
Percent Fuel Efficiency Increase from Today |
|||||
|
Naturally Aspirated SI |
Turbo SI |
Diesel |
Hybrid |
Plug-in Hybrid |
Total Advanced Power Train |
|||||
|
Optimistic |
|
|
|
|
|
|
|
|
|
|
|
2020 |
75 |
40 |
17 |
52 |
26 |
7 |
15 |
0 |
48 |
+38 |
|
2035 |
75 |
30 |
25 |
36 |
26 |
9 |
20 |
9 |
64 |
+100 |
|
Conservative |
|
|
|
|
|
|
|
|
|
|
|
2025 |
50 |
40 |
17 |
55 |
24 |
7 |
14 |
0 |
45 |
+38 |
|
2035 |
50 |
40 |
20 |
49 |
21 |
7 |
16 |
7 |
51 |
+62 |
|
Note: Assumed average new-vehicle weight (cars and light trucks) currently is 1900 kg (4180 lb). Thus, average weight reductions of 700–1050 lb per vehicle would be required. Neither of these scenarios includes BEVs or FCVs. aThe amount of the efficiency improvement that is dedicated to reducing fuel consumption (i.e., that is not offset by increases in vehicle power, size, and weight). |
||||||||||
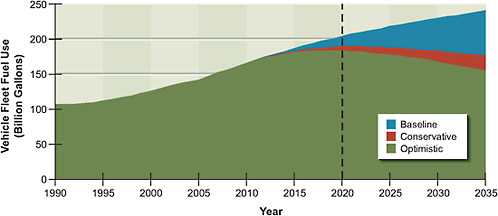
FIGURE 4.7 Vehicle fleet fuel use for the no-change baseline and the optimistic and conservative scenarios described in the text.
TABLE 4.7 Cumulative Fuel Savings from the Baseline Shown in Figure 4.7
TABLE 4.8 Annual Fuel Savings in 2020 and 2035 from the No-Change Baseline Shown in Figure 4.7
weight-reducing carbon composite structural materials and less energy-intensive electric systems.
Because the DOE expects air travel to grow about 3 percent per year over the next several decades, efforts to reduce aviation-fuel consumption face a stiff challenge. The expected efficiency improvement of 1–2 percent per year (Lee et al., 2004) will not be enough to offset the expected growth in demand.
Potential Energy Efficiency Improvements in Freight Transportation
The movement of freight represents about 6–7 percent of the U.S. GDP. Given that the EIA expects freight transport to continue to increase by 2 percent per year over the next two to three decades, energy use in the freight sector could grow by more than 40 percent by 2030.
Truck Transport
Pressure to reduce fuel costs has led truck manufacturers to make continuous progress in raising engine efficiency. Technological improvements have included more sophisticated fuel-injection systems, enhanced combustion, higher cylinder pressure (due to increased turbocharging), and automated manual-transmission systems. Technologies on the horizon include continuously variable transmissions, power-shift transmissions, and hybrid-electric systems that could be used to modulate auxiliaries (pumping, fans, compressors, air-conditioning, and power steering) and reduce idling. Auxiliary-power units with greater efficiency could increase fuel economy, as could use of utility-supplied electricity when parked at truck stops. Reduced idling is especially desirable in urban-duty cycles and in sleeper cabs, where idling alone can account for 10 percent of the vehicle’s fuel use.
Air, Rail, and Waterborne Freight Transport
A small proportion (less than 1 percent by weight) of total freight shipments is transported by air. Potential gains in efficiency would stem from the same improvements made to passenger aircraft.
Rail accounts for 2 percent of transportation energy use in the United States but about 10 percent of all freight shipments by weight. Freight railroads are nearly all diesel powered, unlike the mostly electrified rail systems of Europe and Japan. Per ton-mile, rail is 10 times more efficient than trucking is. Still, improvements in railroad technology would offer modest opportunities for gains in U.S.
transportation-energy efficiency. Advances in railroad operation could contribute to improved efficiency as well.
Shifting some freight from trucks to rail could save fuel. Candidates for diversion include trailers and containers carrying commodities that are not time sensitive and are being transported more than 500 miles.
The main fuels used in waterborne shipping—by ocean, inland, coastal, and Great Lakes routes—are diesel fuel (about 70 percent) and heavy fuel oil (30 percent). Waterborne freight accounts for about 3.5 percent of all shipments by weight.
Measured in tonnage, the oceangoing segment accounts for about half the freight moved on water into or within the United States. In terms of energy consumed per ton-mile, ocean shipping is highly efficient, as the vessels carry large payloads over long distances. Gains in energy efficiency are still possible, however. For example, one study estimates that improvements of 20–30 percent could be achieved in ocean shipping by 2020 (Kromer and Heywood, 2008). Speed reduction offers the greatest potential, although there are strong incentives to move shipments rapidly.
Potential System-Level Improvements in Transportation
Transitions in transportation systems—such as expanded use of rail for freight or passenger service—provide opportunities to boost overall energy efficiency. Such changes are usually costly and complicated, however, and are often driven by factors other than energy efficiency (such as productivity). Nevertheless, energy costs can play a motivating role.
The freight sector offers examples. The use of shipping containers has stimulated intermodal transfers among trucks, rail, ships, and even cargo airplanes, leading to dramatic productivity improvements, although gains in overall energy efficiency are less clear. Rail is much more energy-efficient than trucking is; thus, enhancing the quality of rail services and facilitating intermodal transfers should lead to significant gains in freight-transport energy efficiency.
In passenger transport, the opportunities for systemic approaches to improve energy efficiency may be even greater. Some studies have suggested that greater use of advanced information and communication technologies—“intelligent” transportation systems that electronically link vehicles to one another and to the infrastructure—could enable better traffic management. These and other studies have also examined the potential for reducing vehicle use by enhancing collective
modes of travel, substituting information and communication technologies for travel, enhancing nonmotorized travel, and reorganizing land use to achieve higher population densities.
In order for a diversified and efficient system to evolve, two types of policy changes are needed: better land-use management and greater use of pricing. The former would have to be implemented on a substantial scale to have a significant effect on fuel consumption and greenhouse gas emissions, and the timeframes of such deployments would span several decades, but the long-term implications could be enormous. The net effect of a concerted effort to internalize congestion-related and environmental externalities into prices could also be large, especially in reducing the numbers of single-occupant vehicles on the roads and encouraging the use of small and efficient city cars for local travel.
Barriers to Improving Energy Efficiency in Transportation
Numerous factors hinder the improvement of energy efficiency and the reduction of fuel consumption in passenger and freight transportation. Some of the most important are noted in the following list:
-
In the United States, many factors—including a century of falling energy prices and rising incomes, together with personal preferences and some government policies—have contributed to decentralized land-use patterns and a transportation-intensive economy.
-
Low-priced energy has led to consumer purchasing behavior, vehicle designs, and operating decisions that emphasize convenience, style, and speed over fuel economy in automobiles and light trucks. Changing these preferences, which have been developed and reinforced over decades, will not be easy.
-
The primary barriers to realizing greater energy efficiency in the transportation sector are the expectations of individuals and companies about future energy prices, fuel availability, and government policies. Although there is an extensive menu of existing technologies for saving energy in transportation, before decision makers decide to invest in these technologies they must be convinced that energy-price increases (or other factors that influence market demand) will persist.
-
Even if sufficient demand exists for certain vehicle technologies, there must be the capacity to supply them at the needed scale—vehicle manu-
-
facturers and their suppliers must have been able to make adequate capital investments for bringing new production capacity on line. Typical product-development times for individual automotive products are 3–5 years, but to deploy a new-vehicle technology across all product platforms and vehicle classes usually takes more than a decade, unless mandated by law.
-
Even when new or improved vehicle technologies are available on the market, barriers to purchasing them include high initial cost, safety concerns, reliability and durability issues, and lack of awareness. Reaching a substantial fraction of vehicle sales usually takes more than a decade unless mandated by law or made possible by clear consumer demand for the new or improved technology.
Findings: Transportation
In the transportation sector, the potential for reducing fuel consumption resides both in increasing the efficiency with which liquid fuels (especially petroleum) are used and in shifting some of the vehicle fleet’s energy demand to electricity. The greenhouse gas emissions and other environmental effects of such a shift depend on how the electricity (or hydrogen, if fuel-cell vehicles are used) is generated.
An extensive menu of technologies exists today for increasing energy efficiency in transportation. Even so, improving new-vehicle fuel economy substantially is a challenging task. A continued decrease in fuel consumption (and associated greenhouse gas emissions) beyond 2020, when the EISA standards must be met, will require that the historic emphasis on ever-increasing vehicle power and size virtually be abandoned.
In the near term, reductions in fuel consumption will come predominantly from improved gasoline and diesel engines, superior transmissions, and reduced vehicle weight and drag. Evolutionary improvements in gasoline internal-combustion engine vehicles are likely to prove the most cost-effective choice for reducing petroleum consumption in the 2009–2020 timeframe. Gasoline-electric hybrids will play an increasingly important role as their production volumes increase and their cost, relative to conventional vehicles, decreases. Meeting the EISA standards is likely to require that, over the next decade or two, an ever-larger fraction of the new-vehicle fleet be hybrids or plug-in hybrids.
Beyond 2020, continuing reductions in fuel consumption are possible. Plausible efficiency improvements and weight reductions in LDVs, alongside more extensive use of hybrid and plug-in hybrid (and possibly battery-electric) vehicles, could reduce transportation fuel consumption beyond 2020 to below the levels implied by EISA 2007 so long as a plausible rate of improvement can be sustained. An especially important R&D focus here will be developing marketable vehicles that use electricity, which will require improving the performance and reducing the cost of high-energy-storage batteries.
A parallel long-term prospect is fuel cells, with hydrogen as the energy carrier. But major improvements, especially in reducing costs, are needed if this option is to be attractive. Widespread implementation requires significant investment in low-emissions hydrogen supply and in ensuring efficient distribution systems. Onboard hydrogen storage is another key R&D issue. Because establishing a new propulsion-system technology and new fuel infrastructure on a large scale is a formidable task, significant deployment is unlikely before 2035.
Reduced energy use in freight transportation can occur both by improving vehicle efficiency and by streamlining freight-system logistics and infrastructure. Reductions of 10–20 percent in the fuel economy of heavy- and medium-duty vehicles appear feasible over a decade or so. Meanwhile, a broad examination is needed of the potential for further reductions in energy consumption stemming from improved freight-system effectiveness.
Most transportation-related energy efficiency studies and proposals have focused on the considerable gains that could be achieved with improved vehicles rather than on changing the transportation system as a whole. This emphasis is appropriate, given the potential impact of such gains. But major improvements will also come from a broader as well as deeper understanding of transportation-system issues for all transportation modes. The potential overall impact of systemic changes, such as densifying and reorganizing land uses and enhancing collective modes of travel, needs further exploration and quantification. Developing better tools for analyzing and forecasting the effects of different policies and investments on entire transportation systems is therefore an important task.
ENERGY EFFICIENCY IN INDUSTRY
U.S. industrial energy efficiency has improved over the past several decades in response to volatile fossil-fuel prices, fuel shortages, and technological advances, but improving the energy efficiency of the nation’s industrial sector even further is essential for maintaining its viability in an increasingly competitive world. Yet there still remain opportunities to incorporate cost-effective, energy-efficient technologies, processes, and practices into U.S. manufacturing. This section describes the progress made to date and the magnitude of the remaining opportunities, stemming both from broader use of current best practices and from a range of possible advances enabled by future innovations.
Energy Use in U.S. Industry
The U.S. industrial sector is composed of an exceptionally diverse set of businesses and products with a broad range of prospects for energy efficiency. While industry used more than 50 percent of the worldwide delivered energy in 2005, in the United States in 2008 industry’s share was only 31 percent (Figure 4.1), reflecting the high energy intensity of the domestic housing and transportation sectors as well as the net import into the United States of products containing embodied energy. U.S. industrial energy use is substantial: 31.3 quads of primary energy in 2008 (almost a third of the national total) at a cost of $205 billion. In 2006, about 7 quads of this total was dedicated to nonfuel needs, such as petroleum feedstocks for petrochemicals and coke used in the production of steel (DOE, 2009). Industries in the United States use more energy than those of any other G8 nation and about half of the total energy used by China.
The average annual growth of energy use in the U.S. industrial sector is projected to be 0.3 percent out to 2030. Industry’s CO2 emissions are projected to increase more slowly, at 0.2 percent annually (EIA, 2008). These low growth rates are due partly to the presumed updating with more energy-efficient technologies and practices in industry. They also reflect the restructuring of the economy away from energy-intensive manufacturing and toward service- and information-based activities.
The most energy-intensive industries are metals (iron, steel, and aluminum), petroleum refining, basic chemicals and intermediate products, glass, pulp and paper, and nonmetallic mineral products such as cement, lime, limestone, and soda ash. Less energy-intensive industries include the manufacture or assembly of automobiles, appliances, electronics, textiles, food and beverages, and other products.
Petroleum and natural gas are the two fuels most commonly consumed by the industrial sector. In 2002, they accounted for about 44 percent and 40 percent, respectively, of the sector’s primary energy use. While petroleum use in the industrial sector increased by some 24 percent from 1985 to 2002, coal consumption dropped by 27 percent. The use of renewable energy has exhibited a fluctuating pattern over the years, totaling about 1.4 quads in 1978, rising to about 1.9 quads in 1985, and then retreating to about 1.68 quads in 2002. Energy use in the manufacturing industries continues to be significantly higher than in the non-manufacturing industries, which include agriculture, forestry, fisheries, mining, and construction.
Energy-Intensity Trends and Comparisons
Between 1985 and 2004, real GDP in the U.S. industrial sector increased by nearly 45 percent, while total energy use was virtually unchanged; this led to a decrease in energy intensity by nearly a third. However, this apparent improvement in energy intensity was due primarily to a change in the mix of products manufactured in the United States rather than to improvements in energy efficiency. The share of industrial GDP accounted for by such energy-intensive industries as petroleum refining and paper manufacturing had declined and was replaced by relatively non-energy-intensive sectors such as computers and electronics. In general, industries in most industrialized countries are more energy-efficient than their counterparts in the United States.23 The differences in energy use among countries stem from multiple sources, including natural resource endowments, energy-pricing policies, and the average age of industrial plants.
The Potential for Energy Efficiency Improvement in Industry
This section briefly reviews two studies that attempted to assess the potential for cost-effective energy efficiency improvements across the U.S. industrial sector. Many other studies of energy efficiency potential either examine individual industrial subsectors, such as aluminum, chemicals, or paper manufacturing, or they focus on the potential impacts of specific technologies (such as membranes or combined heat and power) or a family of technologies (e.g., sensors and controls or fabrication and materials). Such cross-sectional studies are also reviewed here
for major energy-consuming industries and for important crosscutting technologies and processes. Because they do not treat the industrial sector comprehensively, however, these less-comprehensive studies cannot enable a sector-wide estimation of economic energy efficiency potential, though they do provide valuable benchmarking for the two comprehensive studies discussed below. State-level and international assessments of industrial energy efficiency potential are drawn on as well in the following paragraphs.
Two major studies have estimated the potential for energy savings in U.S. industry by 2020 at 14–17 percent (IWG, 2000; McKinsey and Company, 2007). These savings would occur largely through the deployment of technologies reported as being attractive on a commercial basis—e.g., with internal rates of return (IRRs) of at least 10 percent or that exceed a firm’s cost of capital by a risk premium.
In the first major study—the comprehensive and extensively reviewed Scenarios for a Clean Energy Future (the CEF study; IWG, 2000)—a portfolio of advanced policies was estimated to reduce energy consumption in the industrial sector by 16.6 percent relative to a business-as-usual forecast, and at no net cost to the economy (IWG, 2000; Brown et al., 2001; Worrell and Price, 2001). The business-as-usual forecast used in the CEF study was that of the Annual Energy Outlook 1999, which estimated that the industrial sector would require 41.2 quads of energy in 2020. The most recent EIA projection (Annual Energy Outlook 2008 [EIA, 2008]), however, forecast industrial sector consumption of energy at only 34.3 quads in 2020. Scaling the 16.6 percent savings estimate to this lower level suggests a savings of 5.7 quads. In a separate assessment, the CEF study concluded that new CHP systems could reduce industrial-sector energy requirements by another 2.0 quads in 2020 (IWG, 2000; Lemar, 2001), for a total savings of 7.7 quads.
The second and more recent major study, documented in McKinsey and Company (2007), concurred that U.S. industries have a significant opportunity for energy efficiency gains. Financially attractive investments (defined as those with an IRR of 10 percent or greater) were estimated to offer 3.9 quads in energy-usage reduction in 2020, as compared with a business-as-usual forecast. Projects with lower returns, with a positive IRR below 10 percent, were estimated to reduce energy use by 1.4 quads in 2020.
Table 4.9 summarizes the studies’ estimates of energy-savings potential for different industrial subsectors. The CEF study foresaw a large potential for energy savings in pulp and paper manufacturing (6.3 percent), iron and steel (15.4 per-
TABLE 4.9 Estimated Economic Potential for Energy Efficiency Improvements in Industry in the Year 2020: Sector-Wide and for Selected Subsectors and Technologies
|
|
CEF Study (IWG, 2000) Scaled to EIA (2008) (quads) |
McKinsey and Company (2007) (quads) |
Other U.S. Studies (quads) |
Global Estimates from IEA (2007) (percent improvement) |
|
Selected subsectors |
|
|
|
|
|
Petroleum refining |
N/A |
0.3 |
0.61–1.21 to 1.4–3.28a |
13–16 |
|
Pulp and paper |
0.14b |
0.6 |
15–18 |
|
|
Iron and steel |
0.21e |
0.3 |
0.76f |
9–18 |
|
Cement |
0.08g |
0.1 |
28–33 |
|
|
Chemical manufacturing |
N/A |
0.3 |
13–16 |
|
|
Combined heat and power |
2.0 |
0.7 |
|
|
|
Total industrial sector |
7.7 (22.4%) |
4.9 (14.3%) |
|
18–26 |
|
aBased on range of 10–20 percent savings (LBNL, 2005) to 23–54 percent savings (DOE, 2006a) from a baseline of 6.075 quads. b6.3 percent of the 2.311 quads of energy consumption forecast for the paper industry in 2020 by EIA (2008). cBased on 16 percent savings (Martin et al., 2000) and 25.9 percent savings (DOE, 2006c) from a baseline of 3.3 quads. dValues updated from prepublication draft. e15.4 percent of the 1.364 quads of energy consumption forecast for the iron and steel industry in 2020 by EIA (2008). f Based on 40 percent savings (AISI, 2005) from a baseline of 1.9 quads. g19.1 percent of the 0.431 quads of energy consumption forecast for the cement industry in 2020 by EIA (2008). h Based on a range of 34.8–71.9 percent savings (Worrell and Galitsky, 2004) for the 0.431 quads of energy consumption forecast for the cement industry in 2020 by EIA (2008). iNREL, 2002. jDOE, 2007c. kBailey and Worrell, 2005. |
||||
cent), and cement (19.1 percent) (IWG, 2000, Table 5.8; Worrell et al. 2001). On a segment-by-segment basis, McKinsey and Company (2007) concluded that the largest untapped opportunities for U.S. industrial energy efficiency savings reside in pulp and paper and in iron and steel. The CEF study’s estimates for iron and steel and for cement were similar to those of the McKinsey and Company study, but its estimate for pulp and paper was significantly lower.
Business-as-Usual Efficiency Improvement
The McKinsey and Company (2007) analysis assumes that a significant amount of energy efficiency improvement, resulting from capital-stock turnover of outdated technologies and from cost reductions and performance improvements that
happen through economies of scale and the advance of science and technology, is included in the business-as-usual forecast. Thus, the level of energy efficiency improvement anticipated in the year 2020 relative to today could far exceed 6.3 quads. Prime targets are waste-heat recovery and improved energy-management and integration practices. These are the kinds of cost-saving potential that EIA assumes will be absorbed in the business-as-usual case. Thus, relative to today’s energy efficiency practices, industrial energy efficiency improvements in 2020 could save considerably more energy than the 4.9 quads estimated by McKinsey and Company (2007) if the “naturally occurring” efficiency improvements relative to today’s technology were added on.
Looking beyond 2020, a wide array of advanced industrial technologies could make significant contributions to reducing industrial energy consumption and CO2 emissions. Possible revolutionary changes include novel heat and power sources, as well as innovative processes for new products that take advantage of developments in nanotechnology and micro-manufacturing. Examples include the microwave processing of materials and nanoceramic coatings, which show great potential for boosting the efficiency of industrial processes. In addition, advances in resource recovery and utilization—e.g., aluminum recycling—could reduce the energy intensity of U.S. industry. Many of these approaches provide other benefits as well, such as improved productivity and reduced pollution.
The Role of Innovation
Most of the discussion in this chapter focuses on new technology that lowers industry’s energy use. In some cases, energy savings of greater importance come from adapting the new technologies, such as fuel cells for CHP production, used in other sectors. This role of industry in the development of emerging technologies suggests even greater energy savings than might be apparent from looking at industry’s own energy-use patterns alone. Companies are adopting a much broader view of their energy and environmental responsibilities by, for example, addressing the sustainability of their products and services together with those of their suppliers.
Major Energy-Consuming Industries
Chemical Manufacturing and Petroleum Refining
The chemical industry manufactures an extensive array of organic and inorganic chemicals and materials. Feedstocks include hydrocarbons from petroleum refining, mined chemicals and minerals, and even animal and plant products such as fats, seed oils, sugars, and timber. For energy sources, the chemical industry uses petroleum-based fuels, natural gas, coal, electricity, and, to a lesser but growing extent, biomass (DOE, 2000, 2006b). Most of the larger chemical companies that have a major presence in the consumer marketplace are R&D oriented because of the continual need to generate new and improved products, enhance quality and yields, and conform to environmental regulations.
The petroleum-refining industry (DOE, 2007c) is similar to the chemical industry in its use of energy sources and process equipment, though its normal output is narrower—a range of refined hydrocarbon products, made in high volume, for the transportation industry. Many refining companies do have a bulk-chemical arm, however, to manufacture a limited spectrum of high-volume organic chemicals and bulk polymer intermediates that are natural extensions of their refining operations. Petroleum companies vary in research intensiveness; generally, they are less dependent on finding new products and processes than is the chemical industry.
Despite some differences, the chemical and petroleum-refining industries have many similarities in raw materials, energy sources, and process technologies. Together, they have the opportunity to achieve significant energy efficiency improvements. Technologies in common include high-temperature reactors, distillation columns for liquid-mixture separation, gas-separation technologies, corrosion-resistant metal and ceramic-lined reactors, sophisticated process-control hardware and software, and many others.
Benchmarking data indicate that most petroleum refineries can economically improve energy efficiency by 10–20 percent (LBNL, 2005); analyses of individual refining processes estimate energy savings ranging from 23 to 54 percent (DOE, 2006a). Major areas for energy efficiency improvement are utilities (e.g., steam generation and distribution, power generation, and compressors), process optimization, heat exchangers, and motors and motor applications.
Pulp and Paper
Pulp and paper production, which makes up a majority of the U.S. forest products enterprise, consumes about 2.4 quads of energy annually. Drying and the recovery of chemicals, the most energy-intensive parts of the papermaking process, rely on steam, which is also used for pulp digesting. Electricity is required to run equipment such as pumps and fans and to light and cool buildings.
Several energy-efficient methods of drying have been developed, many of which are cost-effective today. One of them involves using waste heat from other processes, such as power generation and ethanol production, as the energy source for evaporation (Thorp and Murdoch-Thorp, 2008). Advanced water-removal technologies can also reduce energy use substantially in drying and concentration processes (DOE, 2005). More generally, membrane and advanced filtration methods could effect significant reductions in the total energy consumption of the pulp and paper industry (ORNL and BCA, Inc., 2005). High-efficiency pulping technology that redirects green liquor to pretreat pulp and reduce lime-kiln and digester load is another energy-saving method for this industry (DOE, 2005). Modern lime kilns are available with external dryer systems and modern internals, product coolers, and electrostatic precipitators (DOE, 2006c).
Estimates of the cost-effective energy efficiency potential of the pulp and paper industry in 2020 range from a low of 16 percent (Martin et al., 2000) to a high of 25.9 percent (DOE, 2006c), yielding a range of energy savings of 0.37–0.61 quads by the year 2020. Additional savings are possible from the use of CHP technologies.
Iron and Steel
The iron and steel industry consumes 1.4–1.9 quads per year (EIA, 2007a). In 2006, approximately 43 percent of raw steel was produced by integrated steel-makers—i.e., blast furnace and basic oxygen furnace (BOF) operation—and 57 percent by electric arc furnace (EAF) operation. Energy intensities for the two production methods vary substantially, reflecting the fact that BOFs produce new steel mainly from iron ore whereas EAFs use mainly scrap steel. To produce hot rolled steel from iron ore takes almost five times the energy per ton as making the same product from scrap steel.
In 2006, yield losses totaled 8 million tons. Losses occur in many different operations and appear as “home” scrap and waste oxides. Integrated producers also lose a small percentage of coal and coke. The steel industry consumes about
18.1 million Btu per ton of product, which is 22 percent more than the practical minimum energy consumption of about 14 million Btu per ton (AISI, 2003). These energy losses are a result of the production energy embedded in yield losses and process inefficiencies.
Energy consumption per ton of steel has decreased 27 percent since 1990, while CO2 emissions fell by 16 percent. For 2002–2005, energy intensity per ton of steel decreased by 12 percent. Energy-use improvements from avoiding yield losses would contribute another 20 percent in savings.
In 2005, the American Iron and Steel Institute announced a goal of using 40 percent less energy per ton of steel in 2025 than what steelmakers were using in 2003 (AISI, 2005); this goal will require the development and implementation of “transformational technologies.” The most promising opportunities include EAF melting advances, BOF slag-heat recovery, integration of refining functions, heat capture from EAF waste gas, and increased direct carbon injection. The majority of these technologies may be available before 2020, assuming continued R&D. Several revolutionary new steelmaking technologies and concepts—the use of hydrogen as an iron-ore reductant or furnace fuel, for example, or electrolytic or biometallurgy-based iron and steel production—could be ready in the 2020–2035 timeframe.
Cement
The cement industry accounts for 5 percent of the energy used in the U.S. manufacturing sector, or 1.3 quads (DOE, 2002), and about 9 percent of global industrial energy use (IEA, 2007). The industry is also responsible for about 5 percent of worldwide anthropogenic CO2 emissions and for 2 percent in the United States (Worrell et al., 2001; Worrell and Galitsky, 2004).
Cement plants increase in efficiency with size, and advanced dry-kiln processes are substantially more efficient than older wet-kiln processes. In the United States, energy consumption varies from 6.2 million Btu per ton of clinker (the cement precursor produced from limestone and other chemicals in cement kilns) for smaller wet plants to 3.8 million Btu per ton of clinker for dry preheater-precalciner kilns (van Oss, 2005). Coal is the chief fuel consumed in U.S. plants, although they utilize an increasing proportion of waste materials, used tires, and petroleum coke.
Energy use also varies with the process and characteristics of a plant, but in general, about 90 percent of the energy use, and all of the fuel use, occurs in the
manufacture of clinker in the kiln. Half of the CO2 generated in cement manufacturing derives from energy use and the other half from the chemical process that converts limestone to lime, the key ingredient of clinker.
While most major energy savings in cement processes require a major upgrade to an advanced dry-kiln process, other technologies that incrementally improve energy efficiency include advanced control systems, combustion refinements, indirect firing, and optimization of components such as the heat shell. Opportunities vary with specific plants; however, the combination of these activities appears to yield energy savings on the order of 10 percent.
The most attractive available energy efficiency technologies, with potential energy savings of 10–20 percent, derive from changing the chemistry of cement to reduce the need for calcination. Blended cements include higher proportions of other cementitious materials, such as fly ash. Steel slag, which is already calcined, is an alternative to limestone for the production of clinker. Technologies that allow production of cement with a lower per-ton share of clinker thus yield multiple benefits: savings in fuel consumption and reductions in greenhouse gas emissions by a factor of two or more above what is associated with energy efficiency alone.
Advanced technologies with a potential to further improve energy efficiency and emissions include fluidized bed kilns, advanced comminution processes, and the substitution of mineral polymers for clinker. A Battelle (2002) study concluded that non-limestone-based binders may yield a reduction of 30 percent in CO2 emissions. Additional advanced approaches to reducing CO2 emissions are hybrid cement-energy plants, currently under investigation in the United States, and the incorporation of carbon capture and storage.
Crosscutting Technologies for Energy Efficiency in Industry
Several illustrations of technologies and approaches that could improve industrial energy efficiency are given in this section. Some have already been introduced but could have much greater application, while others are still in the development stage.
-
Combined-heat-and-power units transform a fuel (generally, natural gas) into electricity and then use the residual heat for space and hot-water heating or for industrial and commercial processes. Estimates of the economic energy-savings potential of CHP nationwide range from 0.7 quads (McKinsey and Company, 2007) to 2.0 quads (IWG, 2000; Lemar, 2001).
-
The general class of separation processes is one of the most attractive targets for improving energy efficiency in industry, as some separation processes have thermal efficiencies as low as 6 percent. Much of industrial separation now is done by distillation, especially in the petroleum and chemical industries, and technologies are available that could significantly reduce the energy required for this process. However, attention has recently begun to shift to the development of separation processes based on membranes and other porous materials, which could reduce industry’s energy intensity and total energy use.
-
The industrial sector needs advanced materials that resist corrosion, degradation, and deformation at high temperatures and pressures. Relatively low-energy-intensity materials with particular properties and potential uses, such as composites and nanomaterials for structural applications, could substitute for energy-intensive materials such as steel.
-
Numerous technologies and practices are available that could optimize and improve steam heating and process heating in industrial facilities. Some changes could take place immediately and could reduce natural gas consumption. Even further efficiency gains could result from R&D, particularly on ultrahigh-efficiency boilers. Such boilers, which employ a combination of advanced technologies, could offer considerable efficiency gains over today’s state-of-the-art boilers.
-
Electric motors make up the largest single category of electricity end-use in the U.S. economy. They also offer considerable opportunity for electricity savings, especially in the industrial sector. Based on an inventory of motor systems conducted in 1998 (Xenergy, Inc., 1998), it is estimated that industrial motor energy use could be reduced by 11–18 percent if facility managers undertook all cost-effective applications of proven energy efficiency technologies and practices. Specifically, implementation of all established motor-system energy efficiency technologies and practices that meet reasonable investment criteria could yield annual energy savings of 75–122 billion kWh. A next generation of motor and drive improvements is on the horizon, including motors with high-temperature superconducting materials that could extend savings much further.
-
New fabrication processes could improve yields per unit energy cost for multiple elements of the manufacturing supply chain, reduce waste,
-
and lower air- and water-pollutant emissions. New processes include net and near-net design and manufacturing; advanced casting, forming, joining, and assembly; engineering of functional materials and coatings; and nanomanufacturing, which would enable the mass production and application of nanoscale materials, structures, devices, and systems.
-
Sensor development for energy efficiency in the United States is being led by the DOE’s Office of Energy Efficiency and Renewable Energy, much of it in collaboration with industrial firms. The developers’ approach essentially entails data gathering by automated monitoring, automated data analysis, automated feedback and control, and effective communication among the components. Sensors include inferential controls, real-time and nondestructive sensing and monitoring, wireless technology, and distributed intelligence.
-
Remanufacturing of used products for resale is gaining recognition as a potentially profitable and resource-efficient business opportunity. Examples include the remaking of automobile pumps and photocopiers. Relative to making a new product from scratch, remanufacturing appears to offer substantial energy efficiency benefits because of the energy saved directly in the production process and indirectly by forgoing the use of many of the raw materials. However, a thorough assessment would require analysis of the options for collecting used products, remanufacturing them, and redistributing them (Savaskan et al., 2004).
Summary of Potential Energy Savings in Industry
Table 4.10 summarizes the potential energy savings stemming from energy efficiency improvements in industry. As shown, if the full potential were realized, industrial energy consumption in 2020 could fall to 14–22 percent below its projected level.
Barriers to Improving Energy Efficiency in Industry
Economic, managerial, and political barriers such as those described below can inhibit the broad deployment of otherwise available technologies:
-
Technical risks of adopting a new technology. Uncertainties about a technology’s benefits and impacts, particularly on existing production lines, can be significant. Such perceived risks result in longer and larger-
TABLE 4.10 Energy Use in Industry and Estimated Energy Savings in 2020 Due to Energy Efficiency Improvements
|
Industry |
Energy Use (quads) |
|
|||
|
2007 |
Business-as-Usual Projection (EIA, 2008) |
||||
|
2020 |
2030 |
||||
|
Petroleum refining |
4.39d |
6.07 |
7.27 |
0.3–3.28d |
|
|
Iron and steel |
1.38 |
1.36 |
1.29 |
0.21–0.76d |
|
|
Cement |
0.44 |
0.43 |
0.41 |
0.1–0.22d |
|
|
Bulk chemicals |
6.85 |
6.08 |
5.60 |
0.19–1.1d |
|
|
Pulp and paper |
2.15 |
2.31 |
2.49 |
0.14–0.85d |
|
|
Total savings—all industries (including those not shown) |
|
|
|
|
4.9–7.7e |
|
|
14–22% |
||||
|
aThe savings cited are the same as those listed in Table 4.9, which provides references. bBased on a review of studies for specific energy-using industries, both for industrial combined heat and power (CHP) and for industry as a whole. cSavings shown are for cost-effective technologies, defined as those providing an internal rate of return of at least 10 percent or exceeding a company’s cost of capital by a risk premium. dValues updated from prepublication draft of this report. eIncludes 0.7–2.0 quads from CHP systems. Source: Compiled from the sources given in Table 4.9. |
|||||
-
scale field testing of new technologies, more stringent investment criteria, and a slower pace of technology diffusion.
-
Relatively high costs. Because new technologies often have longer payback periods than does energy-efficient traditional equipment, they represent a more serious financial risk, given uncertainty about future energy prices.
-
External benefits and impacts that can be difficult to value quantitatively. Industrial plant managers are thus often inhibited from investing in greenhouse gas mitigation and other pollution-abatement efforts. Companies generally do so only when compelled by law or when they expect to be rewarded with lower energy costs, lower raw material costs, or other economic advantages. Moreover, firms may be reluctant to develop new technologies for reducing emissions without an assured market for their innovations.
-
Distorted price signals skew the demand for electricity in today’s retail markets. While time-of-use (TOU) pricing is available for many major industrial customers, electricity rates generally do not reflect the real-time costs of electricity production, which can vary by a factor of 10 over a single day. Most customers in traditionally regulated markets buy electricity under time-invariant prices that are set months or years ahead of actual use. As a result, current market structures actually block price signals from reaching customers (Cowart, 2001), who are thus rendered unable to respond. By contrast, broadly applied TOU pricing would encourage industrial customers to use energy more efficiently during high-price periods. According to Goldman (2006), 2700 commercial and industrial customers were enrolled in TOU programs in 2003, representing 11,000 MW. Three programs in the Southeast (TVA, Duke Power, and Georgia Power) accounted for 80 percent of these participants, most of which used large amounts of energy. Thus there would appear to be considerable room for expanding TOU programs to other regions and to smaller enterprises.
-
Lack of specialized knowledge. Industrial managers can be overwhelmed by the numerous technologies and programs that tout energy efficiency, especially in the absence of in-house energy experts. Managers may find it risky to rely on third-party information to guide investments, given that energy consulting firms, for example, often lack the industry-specific knowledge to provide accurate energy and operational cost assessments.
-
Incomplete or imperfect information is a barrier to the diffusion of energy-efficient industrial technologies and practices, such as those involving CHP systems, materials substitution, recycling, and changes in manufacture and design. This barrier is exacerbated by the high transaction costs for obtaining reliable information (Worrell and Biermans, 2005). Researching new energy-efficient industrial technologies consumes precious time and resources, especially for small firms, and many industries prefer to expend their human and financial capital on other investment priorities. In some cases, industrial managers are simply unaware of energy efficiency opportunities and low-cost ways to implement them.
This barrier is made more onerous by the limited governmental collection and analysis of data on energy use in the industrial sector. Con-
-
sider, for example, the Manufacturing Energy Consumption Survey, a widely used publication that is published every 4 years by the DOE’s Energy Information Administration (EIA). In it, one can find the fuel breakdown of the petroleum industry, but there is no estimation of how much energy is used in distillation columns or other separations. On the other hand, for other sectors, annual reports contain substantially more detailed statistics than those available for manufacturing. More frequent and comprehensive collection and publication of such data and analysis are needed.
-
Investments in industrial energy efficiency technologies are hindered by market risks caused by uncertainty about future electricity prices, natural gas prices, and unpredictable long-term product demand. Additionally, industrial end-use energy efficiency faces unfavorable fiscal policies. Because tax credits designed to encourage technology adoption are limited by alternative-minimum-tax rules, tax-credit ceilings, and limited tax-credit carryover to following years, qualified companies are often prevented from utilizing tax credits to their full potential. Similarly, outdated tax-depreciation rules that require firms to depreciate energy efficiency investments over a longer period of time than other investments can distort the efficiency investment options’ cost-effectiveness (Brown and Chandler, 2008).
-
Capital market barriers. Although, in theory, firms might be expected to borrow capital any time a profitable investment opportunity presents itself, in practice they often ration capital—that is, firms impose internal limits on capital investment. The result is that mandatory investments (e.g., those required by environmental or health regulations) and those that are most central to the firms’ product line often are made first. Moreover, projects to increase capacity or bring new products to market typically have priority over energy-cost-cutting investments; the former have a greater return on investment or are otherwise more important to the firm. Firms wishing to make energy efficiency investments may face problems raising capital—for example, when the technology involved is new to the market in question, even if it is well-demonstrated elsewhere.
-
Regulatory barriers can also inhibit energy-saving improvements. For example, the Environmental Protection Agency’s New Source Review
-
(NSR) program tends to hinder energy efficiency improvements at industrial facilities. As part of the 1977 Clean Air Act Amendments, Congress established the NSR program and modified it in the 1990 Amendments, but old coal plants and industrial facilities were exempted from the New Source Performance Standards (NSPSs) to be set. NSPSs are intended to promote use of the best air-pollution control technologies, taking into account the costs of such technologies, their energy requirements, and any non-air-quality-related health and environmental impacts. However, investment in an upgrade could trigger an NSR, and the threat of such a review has prevented many upgrades from occurring.
Drivers for Improving Energy Efficiency in Industry
Helping to overcome the barriers to improving energy efficiency in industry is a set of motivators that include the following:
-
Rising energy prices and fuel/electricity availability. Rapid increases in fuel prices command management’s attention. To remain competitive, industry must find ways to reduce costs, and higher energy costs can make efficiency investments more beneficial.
-
Air quality. Many states are allowing industry to use energy efficiency to qualify for NOx and SO2 offsets in non-attainment areas. Increasingly stringent ambient air-quality standards, together with cap and trade markets, have resulted in rising prices for NOx and SO2 allowances. The high costs of these allowances provide incentives to reduce energy use.
-
Demand charges and demand-response incentives. Demand charges to industrial and commercial customers—based on their peak electricity demand—can be greater than the payments for the consumed energy itself. These charges provide strong incentives for a plant to manage its electricity usage to avoid peaks and to shift power use from periods of peak prices.
-
Collateral benefits. An efficiently run plant, in terms of both energy use and other factors, will likely also have excellent product quality, high labor productivity, reliable production schedules, and an enviable safety record.
-
Corporate sustainability. Voluntarily reducing greenhouse gas emissions can help boost shareholder and investor confidence, encourage favorable future legislation, improve access to new markets, lower insurance costs, avoid liability, and enhance competitiveness.
Findings: Industry
Independent studies using different approaches agree that the potential for improved energy efficiency in industry is large. Of the 34.3 quads of energy forecast to be consumed in 2020 by U.S. industry (EIA, 2008), 14–22 percent could be saved through cost-effective energy efficiency improvements (those with an internal rate of return of at least 10 percent or that exceed a company’s cost of capital by a risk premium). These innovations would save 4.9–7.7 quads annually.
Comparisons of the energy content of manufactured products across countries underscore the potential for U.S. industry to reduce its energy intensity. Japan and Korea, for instance, have particularly low levels of industrial energy intensity. Care is needed, however, to avoid unrealistic assessments. The savings potentials of existing industrial plants in the United States cannot easily be derived from comparing them with new state-of-the-art facilities in rapidly growing economies.
Additional efficiency investments could become attractive through accelerated energy research, development, and demonstration. Enabling and crosscutting technologies—such as advanced sensors and controls, microwave processing of materials, nanoceramic coatings, and high-temperature membrane separation—could provide efficiency gains in many industries as well as throughout the energy system. For example, these innovations could apply to vehicles, feedstock conversion, and electricity transmission and distribution.
Energy-intensive industries such as aluminum, steel, and chemicals have devoted considerable resources to increasing their energy efficiency. For many other industries, energy represents no more than 10 percent of costs and is not a priority. Energy efficiency objectives compete for human and capital resources with other goals, including increased production, introduction of new products, and compliance with environmental, safety, and health requirements. Outdated depreciation capital schedules, backup fees for CHP systems, and other policies also hamper energy efficiency investment.
More detailed data, collected more frequently, are needed to better assess the status of energy efficiency efforts in industry and their prospects. In order to achieve this goal, proprietary concerns will have to be addressed.
ENERGY EFFICIENCY POLICIES AND PROGRAMS: EXPERIENCE AND LESSONS LEARNED
Although policy recommendations are beyond the scope of this study, policy actions will doubtless be an integral part of the nation’s efforts to transform the ways in which Americans use energy. To inform the policy debate, the AEF Committee reviewed some experiences with—and, just as important, lessons learned from—the use of policies and programs to influence energy use in the United States. This brief review concentrates on federal actions, but it also covers state policy initiatives as well as some programs that have been adopted by electric utilities. Among the important initiatives at the state level, the most successful and interesting are those in California and New York.
Barriers to Adoption of Energy-Efficient Technologies
There is no single market for energy efficiency. Instead, there are hundreds of end-uses, thousands of intermediaries, and millions of consumers (Golove and Eto, 1996). The preceding sections have identified some specific factors that hinder the adoption of energy-efficient technologies and practices by these consumers—individuals, organizations, and businesses—in each of the three end-use sectors. Summarized in the following list, the barriers include:
-
Limited supply and availability of some energy efficiency measures, such as newer products manufactured on a limited scale or not yet widely marketed;
-
Lack of information, or incomplete information, on energy efficiency options for businesses, households, and other venues;
-
Lack of funds to invest in energy efficiency measures, often resulting from constraints imposed within the financial system rather than from the financial inability of the would-be user to raise capital;
-
Fiscal or regulatory policies that discourage energy efficiency investments, often inadvertently;
-
Decision making that does not consider or value energy efficiency;
-
Perceived risks associated with the performance of relatively new energy efficiency measures;
-
Energy prices that do not reflect the full costs imposed on society by energy production and consumption (i.e., that insufficiently account for externalities);
-
Human and psychological factors, such as risk aversion, loss aversion, and status-quo bias.
The AEF Committee reviewed policies and programs at the federal and state levels that have attempted to overcome or compensate for these barriers so as to reduce energy use. These approaches are discussed below.
Federal, State, and Utility Policies and Programs
Certain policies and programs have played important roles in reducing energy use and energy intensity in the United States. For example, over the past 30 years the federal government has devoted billions of dollars to energy efficiency R&D. It has also adopted a number of laws—notably during the 1975–1980 period—that stimulated educational efforts, created financial incentives, and authorized the setting of efficiency standards. More recent legislation has established minimum efficiency standards on a wide range of household appliances and commercial/industrial equipment, as well as tax incentives to motivate commercialization and adoption of highly efficient products and buildings. In addition, many states have implemented building energy codes, utility-based energy efficiency programs, and other policies to complement the federal initiatives.
This review does not consider energy taxes that have been enacted over the past 30 years because increases have been very modest. The federal tax on gasoline, for example, was increased incrementally from 4¢/gal in 1973 to a total of 18.4¢/gal in 1993, but it has not been increased since then. Corrected for inflation, the gasoline tax in 2006 was only 26 percent greater than its value in 1973.
Vehicle Efficiency Standards
The United States adopted energy efficiency standards for cars and light trucks, known as CAFE standards, in 1975. These standards played a leading role in the near-doubling of the average new-car fuel economy and the 55 percent increase in the fuel economy of light trucks from 1975 to 1988 (Greene, 1998). Unfortu-
nately, the trend reversed between that period and 2006–2007, attributable mainly to the shift from cars toward less-efficient sport utility vehicles, pickup trucks, and minivans (EPA, 2007a). This shift to less-efficient vehicles, together with a greater number of vehicle-miles driven, resulted in a 31 percent increase in U.S. gasoline consumption during 1986–2006 (EIA, 2007b).
EISA included the first significant advance in fuel-economy standards in more than 30 years. Assuming that these standards are met, the average fuel economy of cars and light trucks combined will reach at least 35 mpg in 2020, a 40 percent increase.24 It is estimated that the new CAFE standards will save 1 million barrels per day of gasoline by 2020 and 2.4 million barrels per day by 2030 (ACEEE, 2007). These estimates account for the “rebound effect,” that is, the increase in travel demand due to the reduction in the cost per mile driven as vehicle fuel economy improves. This effect is generally thought to be real but small (Greene, 1998; NRC, 2002; Small and Van Dender, 2007).
Appliance Efficiency Standards
Appliance efficiency standards, first enacted by California, New York, Massachusetts, and Florida during the late 1970s and early 1980s, were followed by national standards in 1987. These standards led to dramatic improvements in the energy efficiency of new refrigerators, air conditioners, clothes washers, and other appliances. For example, the combination of state and federal standards resulted in a 70 percent reduction in the average electricity use of new refrigerators sold in the United States from 1972 to 2001 (Geller, 2003).
In 1992, minimum efficiency standards were extended to motors, heating and cooling equipment used in commercial buildings, and some types of lighting products. In 2005, standards were adopted for a variety of “second-tier” products, among them torchiere light fixtures, commercial clothes washers, exit signs, distribution transformers, ice makers, and traffic signals. With the addition of these products, national minimum efficiency standards were in place for better than 40 different types of products.
National appliance efficiency standards saved an estimated 88 terawatt-hours (TWh) of electricity in 2000, or 2.5 percent of national electricity use that year (Nadel, 2002); based both on the time required to turn over the appliance stock
and on the new and updated standards adopted for a number of products since 2000, the energy savings are expected to grow to about 268 TWh (6.9 percent) in 2010 and to 394 TWh (9.1 percent) by 2020 (Nadel et al., 2006). These projections are underestimates, as they consider only the savings from standards adopted as of 2007. Federal law requires dozens of additional standards to take effect before 2020, and some states are setting standards for appliances not covered by the federal standards.
Additional appliance efficiency standards were included in the 2007 federal energy legislation. Most noteworthy are efficiency standards for general service lamps, standards that will make it illegal to sell ordinary incandescent lamps after the standards take effect. In phase one, which takes effect in three stages during 2012–2014, manufacturers will be able to produce and sell improved incandescent lamps as well as CFLs and LED lamps that meet the efficacy requirements, namely, the minimum lumens of light output per watt of power consumption. In phase two, which takes effect in 2020, only CFLs and LED lamps will qualify unless manufacturers are able to roughly triple the efficacy of incandescent lamps. It is estimated that these new standards will save 59 TWh per year by 2020, additive to the savings from standards for other products (ACEEE, 2007).
Building Energy Codes
Most state and local authorities have adopted mandatory energy codes for new houses and commercial buildings, often following models such as the International Energy Conservation Code, although some state or local codes are more stringent. Building energy codes for new homes and commercial structures built during the 1990s are estimated to have reduced U.S. energy use by 0.54 quads in 2000. The DOE estimates that if all states adopted the model commercial building energy code approved in 1999 by the American Society of Heating, Refrigerating and Air-Conditioning Engineers, owners and occupants would save about 0.8 quads over 10 years (DOE, 2007a). Building energy codes are enforced at the local level, however, and there is evidence that enforcement and compliance are weak in many jurisdictions.
Research, Development, and Demonstration
The DOE spent more than $7 billion (in 1999 dollars) on energy efficiency research, development, and demonstration (RD&D) programs during 1978–2000 (NRC, 2001). The resulting efforts contributed to the evolution and commercial-
ization of high-efficiency appliances, electronic lighting ballasts, and low-emissivity windows, which provided net economic benefits to the buildings sector far in excess of the RD&D costs.
In contrast to the outcomes of its buildings technology program, the DOE’s transportation technology RD&D program has had little effect on the vehicle marketplace to date. During the 1980s and 1990s, the DOE chose to focus on advanced engines and power systems for which the technological problems could not ultimately be solved or that evoked little industry or customer interest. The more recent emphasis on hybrid and fuel-cell technologies, implemented through government-industry RD&D partnerships, shows greater promise (NRC, 2008a,b). This experience demonstrates that RD&D projects should be carefully selected and designed, taking into account the technological, institutional, and market barriers involved.
The DOE operates a number of programs to promote greater energy efficiency in industry, including RD&D on advanced technologies as well as deployment programs. These efforts are estimated to have saved about 3 quads of energy cumulatively and about 0.4 quads in 2005 alone (DOE, 2007b).
Federal Incentives and Grants
Federal tax credits of 15 percent for households and 10 percent for businesses were created in the late 1970s and early 1980s to stimulate investment in energy efficiency measures. Subsequent studies, however, were unable to show that the tax credits had expanded purchases of the technologies or measures involved (Clinton et al., 1986; OTA, 1992). This failure has been attributed to flaws in the design of the programs, notably that the incentives were too low, that they were based on cost rather than performance, and that they applied exclusively to commonplace energy efficiency measures such as home insulation and weather stripping. After costing the U.S. Treasury around $10 billion, these unsuccessful tax incentives were discontinued in 1985 (OTA, 1992).
Based in part on this experience, new tax credits were enacted in 2005 for innovative energy efficiency measures that included hybrid, fuel-cell and advanced diesel vehicles, highly efficient new homes and commercial buildings, and very efficient appliances. These tax credits were intended to support the commercialization and market development of these innovative technologies, but not necessarily to save a significant amount of energy. In addition, a 10 percent tax credit of up to $500 was adopted for energy retrofits to the building envelope of existing homes. Other than the tax credits for advanced vehicles, these new tax credits
expired at the end of 2007, although most were extended as part of the financial rescue legislation enacted in October 2008. It is too early to evaluate the impact of the 2005 tax credits.
State and Utility Programs25
Joint actions of states and electric utilities have played a major role in advancing energy efficiency. Many state utility regulatory commissions or legislatures require electric utilities to operate energy efficiency programs, also known as demand-side management (DSM). Most of these programs are funded through a small surcharge on electricity sales. In some states, utilities are allowed to earn more profit on their energy efficiency programs than on building new power plants or other sources of energy supplies, thereby reducing or removing the utilities’ financial disincentives to promote energy savings.
Overall, state/utility energy efficiency programs reduced electricity use in 2004 by about 74 TWh, or 2 percent of electricity sales nationwide (York and Kushler, 2006). But certain states stood out. California, Connecticut, Minnesota, Vermont, and Washington reduced electricity use in 2004 by 7–9 percent. Further, energy savings have risen since 2004 because overall DSM funding has increased. Assuming typical energy-savings rates, national savings reached approximately 90 TWh in 2006.
Promoting Combined Heat and Power Systems
Policy initiatives have also improved the efficiency of energy conversion and supply, specifically by expanding the use of combined heat and power (CHP), also known as cogeneration. Installed CHP reached 82 GW, at a total of more than 2800 sites, by 2004 (Hedman, 2005). It is estimated that the use of CHP systems resulted in total energy savings of about 2.8 quads in 2006, with perhaps 60 percent attributable to the Public Utilities Regulatory Policies Act (PURPA) of 1978 and other policy initiatives (Elliott and Spurr, 1999).
Consumer Education, Training, and Technical Assistance
Complementing the minimum efficiency standards and financial incentives just discussed, the ENERGY STAR® product-labeling program informs U.S. consumers
of the most efficient products in the marketplace at any given time. The ENERGY STAR® label helps consumers by reducing uncertainties about energy performance and lowering transaction costs for obtaining such information. The ENERGY STAR® label applies to a wide range of products, including personal computers and other types of office equipment, kitchen and laundry appliances, air conditioners and furnaces, windows, commercial appliances, and lighting devices. Whole structures—energy-efficient commercial buildings and new homes—also can qualify for the ENERGY STAR® label.
The ENERGY STAR® program in aggregate is estimated to have saved about 175 TWh of electricity in 2006 (EPA, 2007b). The program has achieved the most energy savings in the areas of commercial building improvements and personal computers, monitors, and other types of office equipment. The ENERGY STAR® program continues to develop criteria and adopt labeling for additional products, for instance, televisions and water heaters.
Summary of Estimated Savings from Policies and Programs
Table 4.11 provides estimates of the annual energy savings resulting from most of the policies and programs addressed in this chapter. In some cases (e.g., for CAFE standards and PURPA), the savings reflect expert judgments of the relative importance of the policies and market forces. The total energy savings from the nine policies and programs listed in Table 4.11, about 13.3 quads per year, was equivalent to 13-plus percent of national energy use in 2007. This level of savings is greater than the energy supplied by nuclear power and hydroelectric power combined. It is also more than five times the increase in the supply of renewable energy in the United States between 1973 and 2006.
It should be noted, however, that these policies and programs provided only a moderate amount of the total energy savings associated with the 50 percent decline in national energy intensity during 1973–2007. Increasing energy prices, ongoing technological change, and structural change have also contributed to the steep decline in energy intensity in the past 35 years.
Comparing energy savings across the various policies and programs listed in Table 4.11, regulatory initiatives such as the CAFE standards, appliance efficiency standards, and PURPA provided the greatest amount of energy savings. It should be recognized that some energy efficiency policy initiatives, such as RD&D efforts in the buildings sector, are not included in Table 4.11 in order to avoid double counting of savings.
TABLE 4.11 Estimates of Energy Savings from Major Energy Efficiency Policies and Programs
|
Policy or Program |
Electricity Savings (TWh/yr) |
Primary Energy Savings (Quads/yr) |
Year |
Source |
|
CAFE vehicle efficiency standards |
— |
4.80 |
2006 |
NRC, 2002a |
|
Appliance efficiency standards |
196 |
2.58 |
2006 |
Nadel et al., 2006b |
|
PURPA and other CHP initiatives |
— |
1.62 |
2006 |
Shipley et al., 2008c |
|
ENERGY STAR® labeling and promotion |
132 |
1.52 |
2006 |
EPA, 2007bd |
|
Building energy codes |
— |
1.08 |
2006 |
Nadel, 2004e |
|
Utility and state end-use efficiency programs |
90 |
1.06 |
2006 |
York and Kushler, 2006f |
|
DOE industrial efficiency programs |
— |
0.40 |
2005 |
DOE, 2007b |
|
Weatherization assistance program |
— |
0.14 |
2006 |
DOE, 2006dg |
|
Federal energy management program |
— |
0.11 |
2005 |
FEMP, 2006h |
|
Total |
— |
13.31 |
— |
— |
|
Note: Estimates are based on the sources shown, augmented or modified as indicated. aExtrapolation to 2006 of fuel savings estimated by NRC (2002), and assuming that 75 percent of the energy savings from vehicle efficiency improvements are due to the CAFE standards. bExtrapolates between savings estimates by ACEEE for 2000 and 2010. cAssumes that 85 percent of the energy savings from all CHP systems installed in 2006 was due to PURPA and other policy initiatives. dAssumes 75 percent of energy savings estimated by U.S. EPA in order to avoid double counting savings with utility and state programs. eIncreases energy savings estimate for new buildings constructed during 1990–1999 from Nadel (2004) by 100 percent to account for the impact of codes prior to 1990 and post–1999. fExtrapolates 2004 national electricity savings estimate to 2006 based on national DSM budget estimates for 2005 and 2006. gAssumes 5.6 million weatherized households and average energy savings of 25 million Btu/yr per household, from Berry and Schweitzer (2003). hBased on the reported reduction in energy use per square foot of floor area during 1985–2005 and actual primary energy use in federal buildings as of 2005 (i.e., excluding energy use by transport vehicles and equipment). |
||||
Experience in California and New York
This section describes the experience of two large states that have put many energy efficiency programs in place, predominantly for electricity, and have collected extensive data on the results. Both states have achieved electricity consumption per capita that is about 40 percent below the national average. Figure 4.8 illustrates electricity use per capita from 1960 to 2006 in California, New York, and the United States as a whole.
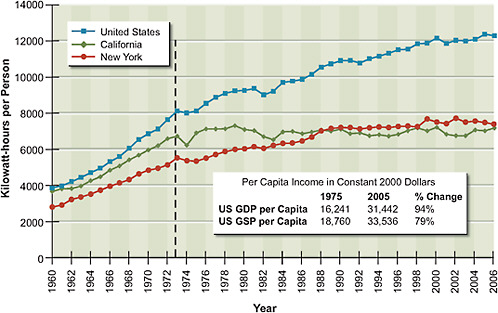
FIGURE 4.8 Per capita electricity consumption in California, New York, and the United States, 1990–2006 (not including on-site generation).
Note: GDP = gross domestic product; GSP = gross state product.
Source: Energy Information Administration, State Energy Consumption, Price, and Expenditure Estimates, available at www.eia.doe.gov/emeu/states/_seds.html.
California
As shown in Figure 4.8, California maintained nearly flat per capita electricity consumption from 1975 to the present. Per capita use in California is currently about 40 percent less than in the United States as a whole, even though the two were nearly equal in the 1960s.
There are many regulatory, demographic, and climatic reasons why the per capita electricity use in California has differed from that of the rest of the United States. In addition, the relatively high price of electricity in California has helped to lower demand. Approximately 25 percent of the differential, however, appears to be related to California’s policies designed to reduce electricity use (Sudarshan and Sweeney, 2008). They include tiered electricity prices, utility-based incentives and other DSM programs, and codes and standards for energy use in buildings.
California first enacted efficiency standards for major types of appliances, as well as for new residential and commercial buildings, in the mid-1970s. These standards have been updated many times since then and have been extended to additional appliances.
California also adopted a number of policies intended to stimulate utility energy efficiency programs. They included the decoupling of utility profits from sales, the inclusion of efficiency as part of integrated resource planning, and the creation of performance incentives to meet or exceed efficiency targets. California’s investor-owned utilities spent in excess of $600 million per year to promote more efficient electricity use by their customers as of 2007.26 They can now earn a profit on these expenditures through the performance-based incentive program.
The combination of appliance standards, building energy codes, and utility efficiency incentives has resulted in considerable electricity savings in California. It is estimated that these initiatives have saved a total of some 40,000 GWh per year as of 2003, equivalent to about 15 percent of actual electricity use in the state that year (CEC, 2007).
New York
New York State has a long history of implementing policy actions to encourage more efficient use of energy across all sectors. They have included adoption and continual updating of building codes and appliance standards, for example, and well-funded research and development programs. Consequently, New York has maintained a relatively flat level of total energy use per capita (about 36 percent lower than the national average in 2005) for the past 30 years (see Figure 4.8).
New York’s energy efficiency programs targeting energy consumers are designed to promote behavioral changes that favor adoption of a greater number of energy efficiency technologies, appliances, and services. Programs directed at electric utilities include the implementation of utility-run DSM efforts and a revenue-decoupling mechanism to allow utilities to recover revenues lost from reductions in energy demand due to efficiency measures. As a result of its energy efficiency initiatives since 1990, New York has lowered its annual electricity use by nearly 12,000 GWh, or about 8 percent (New York Energy $mart Annual Evaluation and Status Report, 2008).
Lessons Learned
The experiences of these two states in particular show that well-designed policies can overcome barriers to the use of energy-efficient technologies and can result in substantial energy savings. This is clear from the estimates in Table 4.11.
Minimum efficiency standards can be a very effective strategy for stimulating energy efficiency improvements on a large scale, especially if the standards are periodically updated. Such standards should not only be technically and economically feasible but also provide manufacturers with enough lead time to phase out production of nonqualifying products in an orderly manner.
Government-funded RD&D has contributed to the development and commercialization of a number of important energy efficiency technologies. While technological advancement is always a central objective of such grants, experience demonstrates that more attention should be devoted in the future to commercialization and market development. Also, a prudent RD&D portfolio should include high-risk but potentially high-payoff projects as well as those involving incremental improvements and lower risk (NRC, 2001).
Financial incentives, including those provided by utilities, can increase the adoption of energy efficiency measures. But these incentives should be carefully designed so as to avoid costly efforts that have little or no incremental impact on the marketplace.
Information dissemination, education, and training can raise awareness of energy efficiency measures and improve know-how with respect to energy management, including the successful implementation of building energy codes.
In general, energy efficiency policies and programs work best if they are integrated into market-transformation strategies that address the range of barriers present in a particular locale (Geller and Nadel, 1994). In the appliance market, for example, government-funded RD&D helps to nurture and commercialize new technologies; product labeling educates consumers; efficiency standards eliminate inefficient products from the marketplace; and incentives offered by some utilities and states encourage consumers to purchase products that are significantly more efficient than what the minimum standards specify.
Energy efficiency policies should be kept in place for a decade or more in order to ensure an orderly development of markets. Meanwhile, policies such as efficiency standards and targets, product labeling, and financial incentives should be periodically revised, as past successes and disappointments have shown. Dynamic policies steadily improved residential appliance efficiency, while stagnant
policies failed to achieve continuing efficiency improvements in cars and light trucks during the 1990s and early part of this decade.
GENERAL FINDINGS: REAL PROSPECTS FOR ENERGY EFFICIENCY IN THE UNITED STATES
Energy efficiency technology for the buildings, transportation, and industry sectors exists today, or is expected to be developed in the normal course of business, that could save about 30 percent of the energy used in the U.S. economy by 2030. If energy prices remain high enough to motivate investment in energy efficiency, or if public policies have the same effect, energy use could be lower than business-as-usual projections by 15–17 quads by 2020 and by 32–35 quads by 2030. These energy efficiency improvements would save money as well as energy.
There are formidable barriers to improving energy efficiency. Overcoming them will require significant public and private support, as well as sustained resourcefulness. The experiences of states provide valuable lessons for national, state, and local policy makers in the leadership skills required and in the policies and programs that are most effective.
Particular attention must be paid to buildings, infrastructure, and other long-lived assets. Once an asset is installed, it embodies a level of energy use that is difficult to modify. Thus, it is important to take advantage of windows of opportunity for putting efficient technologies and systems in place.
REFERENCES
ACEEE (American Council for an Energy-Efficient Economy). 2007. Energy Bill Savings Estimates as Passed by the Senate. Washington, D.C.: ACEEE. Available at http://www.aceee.org/energy/national/EnergyBillSavings12-14.pdf.
AHAM (Association of Home Appliance Manufacturers). 2008. Data compiled by the Association of Home Appliance Manufacturers. Washington, D.C. www.aham.org.
AISI (American Iron and Steel Institute). 2003. Steel Industry Technology Roadmap: Barriers and Pathways for Yield Improvements. Prepared by Energetics, Inc. for the AISI. Washington, D.C.: AISI. October.
AISI. 2005. Saving One Barrel of Oil per Ton. Washington, D.C.: AISI. October.
Alamgir, M., and A.M. Sastry. 2008. Efficient batteries for transportation applications. SAE paper 2008-21-0017. SAE Convergence, Detroit, Mich. October.
An, F., and J. DeCicco. 2007. Trends in Technical Efficiency Trade-offs for the U.S. Light Vehicle Fleet. Technical Paper Series No. 2007-01-1325. Society of Automotive Engineers. April.
Apte, J., and D. Arasteh. 2006. Window-Related Energy Consumption in the US Residential and Commercial Building Stock. LBNL-60146. Berkeley, Calif.: Lawrence Berkeley National Laboratory. Available at http://gaia.lbl.gov/btech/papers/60146.pdf.
Bailey, O., and E. Worrell. 2005. Clean Energy Technologies: A Preliminary Inventory of the Potential for Electricity Generation. Report LBNL-57451. Berkeley, Calif.: Lawrence Berkeley National Laboratory. September.
Bandivadekar, A., K. Bodek, L. Cheah, C. Evans, T. Groode, J. Heywood, E. Kasseris, K. Kromer, and M. Weiss. 2008. On the Road in 2035: Reducing Transportation’s Petroleum Consumption and GHG Emissions. Laboratory for Energy and the Environment Report, Massachusetts Institute of Technology.
Battelle (Battelle Memorial Institute). 2002. Toward a Sustainable Cement Industry: Climate Change. Substudy 8 of an independent study commissioned by the World Business Council for Sustainable Development. Columbus, Ohio: Battelle Memorial Institute.
Berry, Linda, and Martin Schweitzer. 2003. Metaevaluation of National Weatherization Assistance Program Based on State Studies, 1993–22002. ORNL/CON-488. Oak Ridge, Tenn.: Oak Ridge National Laboratory. February.
Brooks, S., B. Elswick, and R. Neal Elliott. 2006a. Combined Heat and Power: Connecting the Gap Between Markets and Utility Interconnection and Tariff Practices (Part I). American Council for an Energy-Efficient Economy (ACEEE) Technical Report IE062. Washington, D.C.: ACEEE.
Brooks, S., M. Eldridge, and R. Neal Elliott. 2006b. Combined Heat and Power: Connecting the Gap Between Markets and Utility Interconnection and Tariff Practices (Part II). American Council for an Energy-Efficient Economy (ACEEE) Technical Report IE063. Washington, D.C.: ACEEE.
Brown, M.A. 2001. Market failures and barriers as a basis for clean energy policies. Energy Policy 29:1197-1207.
Brown, M.A., and S. Chandler. 2008. Governing confusion: How statutes, fiscal policy, and regulations impede clean energy technologies. Stanford Law and Policy Review 19:427-509.
Brown, M.A., J. Chandler, M.V. Lapsa, and B.K. Sovacool. 2007. Carbon Lock-In: Barriers to Deploying Climate Change Mitigation Technologies. ORNL/TM-2007/124. Oak Ridge, Tenn.: Oak Ridge National Laboratory.
Brown, M.A., M. Levine, W. Short, and J. Koomey. 2001. Scenarios for a clean energy future. Energy Policy 33:1179-1196.
Brown, R., S. Borgeson, J. Koomey, and P. Biemayer. 2008. U.S. Building-Sector Energy Efficiency Potential. Berkeley, Calif.: Lawrence Berkeley National Laboratory.
Carter, S. 2001. Breaking the Consumption Habit: Ratemaking for Efficient Resource Decisions. The Electricity Journal 14:66-74.
CEC (California Energy Commission). 2007. California Energy Demand: 2008–22018. Staff Revised Forecast, FINAL Staff Forecast, Second Edition. CEC-200-2007-015-SF2, Table 4.2. Sacramento, Calif. November.
Clinton, J., H. Geller, and E. Hirst. 1986. Review of government and utility energy conservation programs. Annual Review of Energy 11:95-142.
Cowart, R. 2001. Efficient Reliability: The Critical Role of Demand-Side Resources in Power Systems and Markets. Report to the National Association of Regulatory Utility Commissioners by the Regulatory Assistance Project. Available at http://www.raponline.org/Pubs/General/EffReli.pdf. Accessed January 11, 2009.
Crabtree, G., M. Dresselhaus, and M. Buchanan. 2004. The hydrogen economy. Physics Today 57(12):39-44.
Craford, M.G. 2008. High power LEDs for solid state lighting: Status, trends, and challenges. Presented at First International Conference on White LEDs and Solid State Lighting, Tokyo, November 26–30, 2007.
DeCanio, S.J. 1993. Barriers within firms to energy-efficient investments. Energy Policy 21(9):906-914.
DOE (U.S. Department of Energy). 2000. Energy and Environmental Profile of the U.S. Chemical Industry. Energetics Incorporated. Available at http://www1.eere.energy.gov/industry/chemicals/tools_profile.html.
DOE. 2002. 2002 Manufacturing Energy Consumption Survey. Table 2a. Available at www.eia.doe.gov/emeu/efficiency/mecs_trend_mecs_trend9802.html.
DOE. 2005. U.S. Climate Change Technology Program Technology Options for the Near and Long Term. Climate Change Technology Program. Available at www.climate technology.gov. Accessed April 29, 2009.
DOE. 2006a. Energy Bandwidth for Petroleum Refining Processes. Energetics, Inc. October. Available at www1.eere.energy.gov/industry/petroleum_refining/bandwidth. html. Accessed April 29, 2009.
DOE. 2006b. 2006 Manufacturing Energy Consumption Survey. Available at www.eia.doe.gov/emeu/mecs/mecs2006/2006tables.html.
DOE. 2006c. Pulp and Paper Industry Energy Bandwidth Study. Prepared by Jacobs Engineering Group and the Institute of Paper Science and Technology for the American Institute of Chemical Engineers and DOE. Washington, D.C.: DOE. August. Available at http://www1.eere.energy.gov/industry/forest/bandwidth.html.
DOE. 2006d. Weatherization Assistance Program Fact Sheet. Washington, D.C.: DOE Office of Energy Efficiency and Renewable Energy, Weatherization Assistance Program. Available at http://www1.eere.energy.gov/office_eere/pdfs/weatherization_fs.pdf.
DOE. 2007a. Energy Department Determines That Model Commercial Building Code Will Save Energy and Benefit Consumers. Office of Energy Efficiency and Renewable Energy, Industrial Technologies Program. Available at www.energycodes.gov/implement/determinations_com_news.stm. Accessed April 29, 2009.
DOE. 2007b. Impacts. Industrial Technologies Program: Summary of Program Results for CY 2005. Office of Energy Efficiency and Renewable Energy, Industrial Technologies Program. Washington, D.C.
DOE. 2007c. Energy and Environmental Profile of the U.S. Petroleum Refining Industry. Prepared by Energetics, Inc., for the U.S. Department of Energy, Industrial Technologies Program. Washington, D.C. November. Available at http://www1.eere.energy.gov/industry/petroleum_refining/analysis.html.
DOE. 2008. Solid State Lighting Research and Development Multi-Year Program Plan FY’09–FY’13. Available at www1.eere.energy.gov/buildings/ssl/.
DOE. 2009. 2006 Manufacturing Energy Consumption Survey. Washington, D.C. Available at http://www.eia.doe.gov/emeu/mecs/contents.html.
EIA (Energy Information Administration). 2007a. Annual Energy Outlook 2007. DOE/EIA-0383(2007). Washington, D.C.: U.S. Department of Energy, Energy Information Administration.
EIA. 2007b. Annual Energy Review 2006. DOE/EIA-0384(2006). Washington, D.C.: U.S. Department of Energy, Energy Information Administration.
EIA. 2008. Annual Energy Outlook 2008. DOE/EIA-0383(2008). Washington, D.C.: U.S. Department of Energy, Energy Information Administration.
EIA. 2009a. Annual Energy Review 2008. DOE/EIA-0384(2008). Washington, D.C.: U.S. Department of Energy, Energy Information Administration.
EIA. 2009b. Monthly Energy Review (July). Washington, D.C.: U.S. Department of Energy, Energy Information Administration.
Elliott, R.N., and M. Spurr. 1999. Combined Heat and Power: Capturing Wasted Energy. Washington, D.C.: American Council for an Energy Efficient Economy.
EPA (U.S. Environmental Protection Agency). 2007a. Light-Duty Automotive Technology and Fuel Economy Trends: 1975 Through 2007. EPA420-R-07-008. Office of Transportation and Air Quality.
EPA. 2007b. ENERGY STAR® and Other Climate Protection Partnership Programs 2006 Annual Report. Office of Air and Radiation.
FEMP (Federal Energy Management Program). 2006. Annual Report to Congress on Federal Government Energy Management and Conservation Programs, Fiscal Year 2005. U.S. Department of Energy. Washington, D.C.
Frost & Sullivan. 2008. World Hybrid/Electric Vehicle Battery Markets. MC1812769. June 26.
Geller, H. 2003. Energy Revolution: Policies for a Sustainable Future. Washington, D.C.: Island Press.
Geller, H., and S. Nadel. 1994. Market transformation strategies to promote end-use efficiency. Annual Review of Energy and the Environment 19:301-346.
Goldman, C. 2006. Utility experience with real-time pricing. Workshop on Smart Meters and Time-Based Rates, March 15, Lawrence Berkeley National Laboratory.
Golove, W.H., and J.H. Eto. 1996. Market Barriers to Energy Efficiency: A Critical Reappraisal of the Rationale for Public Policies to Promote Energy Efficiency. LBL-38059. Berkeley, Calif.: Lawrence Berkeley National Laboratory.
Greene, D.L. 1998. Why CAFE worked. Energy Policy 26:595-614.
Griffith, B., N. Long, P. Torcellini, D. Crawley, and J. Ryan. 2007. Energy efficiency improvements that use the best available technologies and practices and integrated whole-building design approaches can, on average, reduce energy consumption by 43%. In: Assessment of the Technical Potential for Achieving Net Zero Energy Buildings in the Commercial Sector. NREL/TP-550-41957. Golden, Colo.: National Renewable Energy Laboratory. Available at http://www.nrel.gov/docs/fy08osti/41957.pdf.
Hall, N., C. Best, J. Roth, P. Jacobs, and L. Lutzenhiser. 2005. Assessing markets to design programs that more fully attack key market barriers and take advantage of market opportunities—Why do we continue to miss so many opportunities? Pp. 697-713 in Reducing Uncertainty Through Evaluation. Proceedings of the International Energy Program Evaluation Conference, August, Brooklyn, N.Y.
Hedman, B. 2005. CHP market status. Presentation at the Gulf Coast Roadmapping Workshop, April 26. Available at files.harc.edu/Sites/GulfCoastCHP/News/RoadmapWorkshop2005/GulfCoastCHPOverview.pdf. Accessed April 29, 2009.
IEA (International Energy Agency). 2004. Oil Crises and Climate Challenges: 30 Years of Energy Use in IEA Countries. Paris: Organisation for Economic Co-operation and Development (OECD)/IEA.
IEA. 2007. Tracking Industrial Energy Efficiency and CO2 Emissions. Paris: IEA.
IEA. 2009. Energy Balances by Country/Region. Paris: OECD/IEA. Database available at http://www.iea.org/Textbase/stats/prodresult.asp?PRODUCT=Balances. Accessed June 25, 2009.
IWG (Interlaboratory Working Group on Energy-Efficient and Clean-Energy Technologies). 2000. Scenarios for a Clean Energy Future. ORNL/CON-476 and LBNL-44029. Oak Ridge National Laboratory and Lawrence Berkeley National Laboratory.
Johnson, T. 2008. Diesel emission control technology in review. SAE Technical Paper 2008-01-0069. Warrendale, Pa.: Society of Automotive Engineers. April.
Johnson, T. 2009. Diesel emission control in review. SAE Technical Paper 2009-01-0121. Warrendale, Pa.: Society of Automotive Engineers. April.
Koomey, J. 1990. Energy Efficiency Choices in New Office Buildings: An Investigation of Market Failures and Corrective Policies. PhD Thesis. Energy and Resources Group, University of California, Berkeley. Available at enduse.lbl.gov/Info/JGKdissert.pdf. Accessed April 29, 2009.
Koomey, J., and R.E. Brown. 2002. The Role of Building Technologies in Reducing and Controlling Peak Electricity Demand. LBNL-49947. Berkeley, Calif.: Lawrence Berkeley National Laboratory. September.
Kromer, M., and J. Heywood. 2008. A comparative assessment of electric propulsion systems in the 2030 U.S. light-duty vehicle fleet. SAE Technical Paper 2008-01-0459. Warrendale, Pa.: Society of Automotive Engineers.
LBNL (Lawrence Berkeley National Laboratory). 2005. Energy Efficiency Improvement and Cost Saving Opportunities for Petroleum Refineries: An ENERGY STAR® Guide for Energy and Plant Managers. Lawrence Berkeley National Laboratory.
Lee, J.J., S.P. Lukachko, and I.A. Waitz. 2004. Aircraft and Energy Use. Encyclopedia of Energy. Volume 1. Elsevier.
Lemar, P.L. 2001. The potential impact of policies to promote combined heat and power in U.S. industry. Energy Policy 29:1243-1254.
Lovins, A. 1992. Energy-Efficient Buildings: Institutional Barriers and Opportunities. Boulder, Colo.: E-Source.
Lutsey, N., and D. Sperling. 2005. Energy efficiency, fuel economy, and policy implications. Transportation Research Record 1941:8-25.
Martin, N., N. Anglani, D. Einstein, M. Khrushch, E. Worrell, and L.K. Price. 2000. Opportunities to Improve Energy Efficiency and Reduce Greenhouse Gas Emissions in the U.S. Pulp and Paper Industry. LBNL-46141. Berkeley, Calif.: Lawrence Berkeley National Laboratory.
McKinsey and Company. 2007. The Untapped Energy Efficiency Opportunity in the U.S. Industrial Sector. Report prepared for the U.S. Department of Energy, Office of Energy Efficiency and Renewable Energy.
Nadel, S. 2002. Appliance and equipment efficiency standards. Annual Review of Energy and the Environment 27:159-192.
Nadel, S. 2004. Supplementary Information on Energy Efficiency for the National Commission on Energy Policy. Washington, D.C.: American Council for an Energy Efficient Economy.
Nadel, S., A. de Laski, M. Eldridge, and J. Kleisch. 2006. Leading the Way: Continued Opportunities for New State Appliance and Equipment Standards. Report ASAP-6/ACEEE-A062. (Updated from and supersedes report ACEEE-051.) Washington, D.C.: American Council for an Energy-Efficient Economy (ACEEE) and Boston, Mass.: Appliance Standards Awareness Project. March.
NAS-NAE-NRC (National Academy of Sciences-National Academy of Engineering-National Research Council). 2009. Real Prospects for Energy Efficiency in the United States. Washington, D.C.: The National Academies Press.
NBI (New Buildings Institute). 2008. Getting to Fifty. White Salmon, Wash.: NBI. Available at http://www.newbuildings.org/gtf.
New York Energy $mart Annual Evaluation and Status Report. 2008. Available at http://www.nyserda.org/pdfs/Combined%20Report.
NRC (National Research Council). 2001. Energy Research at DOE: Was it Worth It? Washington, D.C.: National Academy Press.
NRC. 2002. Effectiveness and Impact of Corporate Average Fuel Economy (CAFE) Standards. Washington D.C.: The National Academies Press.
NRC. 2004. The Hydrogen Economy: Opportunities, Costs, and R&D Needs. Washington, D.C.: The National Academies Press.
NRC. 2008a. Transitions to Alternative Transportation Technologies: A Focus on Hydrogen. Washington D.C.: The National Academies Press.
NRC. 2008b. Review of the Research Program of the FreedomCar and Fuel Partnership: Second Report. Washington, D.C.: The National Academies Press.
NREL (National Renewable Energy Laboratory). 2002. Chemical Industry of the Future: Resources and Tools for Energy Efficiency and Cost Reduction Now. DOE/GO-102002-1529; NREL/CD-840-30969. October. Available at http://www.nrel.gov/docs/fy03osti/30969.pdf.
ORNL (Oak Ridge National Laboratory) and BCA, Inc. 2005. Materials for Separation Technologies: Energy and Emission Reduction Opportunities. Available at http://www1.eere.energy.gov/industry/imf/pdfs/separationsreport.pdf. Accessed April 29, 2009.
OTA (Office of Technology Assessment). 1992. Building Energy Efficiency. Washington, D.C.: U.S. Congress, OTA.
Parker, D.S., J.P. Dunlop, S.F. Barkaszi, J.R. Sherwin, M.T. Anello, and J.K. Sonne. 2000. Towards zero energy demand: Evaluation of super efficiency housing with photovoltaic power for new residential housing. Pp. 1.207-1.223 in Proceedings of the 2000 ACEEE Summer Study on Energy Efficiency in Buildings. Washington, D.C.: American Council for an Energy-Efficient Economy.
Rasmussen, T., V. Goepfrich, and K. Horkitz. 2005. Drivers of CFL purchase behavior and satisfaction: What makes a consumer buy and keep buying? In Reducing Uncertainty Through Evaluation: Proceedings of the International Energy Program Evaluation Conference. August. Brooklyn, N.Y., pp. 897-910.
Ricardo, Inc. 2008. A Study of Potential Effectiveness of Carbon Dioxide Reducing Vehicle Technologies. Prepared for EPA Office of Transportation and Air Quality. January. Available at http://www.epa.gov/OMS/technology/420r08004a.pdf.
Roth, K., and K. McKenney. 2007. Energy Consumption by Consumer Electronics in U.S. Residences. Report No. D5525. Cambridge, Mass.: TIAX, LLC.
Savaskan, R.C., S. Bhattacharya, and L.N. Van Wassenhoveet. 2004. Closed-loop supply chain models with product remanufacturing. Management Science 50(February):239-252.
Shipley, A., A. Hampson, B. Hedman, P. Garland, and P. Bautista. 2008. Combined Heat and Power: Effective Energy Solutions for a Sustainable Future. ORNL/TM-2008/224. Oak Ridge, Tenn.: Oak Ridge National Laboratory.
Small, K., and K. Van Dender. 2007. Fuel Efficiency and Motor Vehicle Travel: The Declining Rebound Effect. Working Paper 05-06-03. Irvine, Calif.: Department of Economics, University of California.
Sudarshan, A., and J. Sweeney. 2008. Deconstructing the “Rosenfeld Curve.” Working paper, draft. Palo Alto, Calif.: Stanford University. June 1. Available at http://peec.stanford.edu/modeling/research/Deconstructing_the_Rosenfeld_Curve.php.
Thorp, B.A., and L.D. Murdock-Thorp. 2008. Compelling case for integrated biorefineries. Paper presented at the 2008 PAPERCON Conference, May 4-7, 2008, Dallas, Tex. Norcross, Ga.: Technical Association of the Pulp and Paper Industry.
Turner, C., and M. Frankel. 2008. Energy Performance of LEED for New Construction Buildings. White Salmon, Wash.: New Buildings Institute. Available at http://www.newbuildings.org/downloads/Energy_Performance_of_LEED-NC_Buildings-Final_3-408b.pdf.
van Oss, H.G. 2005. Background Facts and Issues Concerning Cement and Cement Data. Open-File Report 2005-1152. Washington, D.C.: U.S. Department of the Interior, U.S. Geological Survey.
Weber, C.L. 2009. Measuring structural change and energy use: Decomposition of the U.S. economy from 1997 to 2002. Energy Policy 37(April):1561-1570.
Worrell, E., and G. Biermans. 2005. Move over! Stock turnover, retrofit, and industrial energy efficiency. Energy Policy 33:949-962.
Worrell, E., and C. Galitsky. 2004. Energy Efficiency Improvement and Cost Saving Opportunities for Cement Making—An ENERGY STAR® Guide for Energy and Plant Managers. LBNL-54036. Lawrence Berkeley National Laboratory.
Worrell, E., and L. Price. 2001. Policy scenarios for energy efficiency improvement in industry. Energy Policy 29(14):1223-1241.
Worrell, E., L. Price, N. Martin, C. Hendriks, and L.O. Meida. 2001. Carbon dioxide emissions from the global cement industry. Annual Review of Energy and the Environment 26:303-329.
Xenergy, Inc. 1998. United States Industrial Electric Motor Systems Market Opportunities Assessment. Prepared for the U.S. Department of Energy, Office of Energy Efficiency and Renewable Energy. Available at http://www1.eere.energy.gov/industry/bestpractices/pdfs/mtrmkt.pdf.
York, D., and M. Kushler. 2006. A nationwide assessment of utility sector energy efficiency spending, savings, and integration with utility system resource acquisition. In Proceedings of the 2006 ACEEE Summer Study on Energy Efficiency in Buildings. Washington, D.C.: American Council for an Energy-Efficient Economy.


