
5
Alternative Transportation Fuels
The U.S. transportation sector relies almost exclusively on oil. Because domestic sources are unable to supply sufficient oil to satisfy the demands of the transportation and petrochemical industry sectors, the United States currently imports about 56 percent of its petroleum supply. Volatile crude oil prices and tight global supplies, coupled with fears of oil production peaking in the next 10–20 years, further aggravate concerns over oil dependence. The other key issue is greenhouse gas emissions from the transportation sector, which contribute one-third of the country’s total emissions. These issues have motivated the search for alternative domestic sources of liquid fuels that also have significantly lower greenhouse gas emissions.
CONVERSION OF COAL AND BIOMASS TO LIQUID FUELS
Coal and biomass are in abundant supply in the United States, and they can be converted to liquid fuels for use in existing and future vehicles with internal-combustion and hybrid engines. Thus, they could be attractive candidates for providing non-oil-based liquid fuels to the U.S. transportation system. There are important questions, however, about the economic viability, carbon impact, and technology status of these options.
While coal liquefaction is potentially a major source of alternative liquid transportation fuels, the technology is capital intensive. Moreover, on a life-cycle
basis,1 coal liquefaction yields about twice the greenhouse gas emissions produced by petroleum-based gasoline when the carbon dioxide (CO2) is vented to the atmosphere. Capturing this CO2 and geologically storing it underground—a process frequently referred to as carbon capture and storage, or CCS—is therefore a requirement for production of coal-based liquid fuels in a carbon-constrained world. However, the viability of CCS, its costs, and its safety could pose a barrier to commercialization.
Biomass is a renewable resource that, if properly produced and converted, can yield biofuels with lower greenhouse gas emissions than petroleum-based gasoline yields. However, biomass production on fertile land already cleared might displace food, feed, or fiber production; moreover, if ecosystems were cleared to produce biomass for biofuels, the accompanying releases of greenhouse gases could negate for decades to centuries any greenhouse gas benefits from the biofuels (Fargione et al., 2008). Thus, there are questions about using biomass for fuel without seriously competing with other crops and without causing adverse environmental impacts.
This chapter assesses the potential for using coal and biomass to produce liquid fuels in the United States; provides consistent analyses of technologies for the production of alternative liquid transportation fuels; and discusses the potential for use of coal and biomass to substantially reduce U.S. dependence on conventional crude oil and also reduce greenhouse gas emissions in the transportation sector. Quantities in this chapter are expressed in the standard units commonly used by biomass producers. Greenhouse gas emissions, however, are expressed in tonnes of CO2 equivalent, as in other chapters in this report. Details of the analyses and numerical estimates presented in this chapter can be found in the America’s Energy Future panel report Liquid Transportation Fuels from Coal and Biomass: Technological Status, Costs, and Environmental Impacts (NAS-NAE-NRC, 2009).
FEEDSTOCK SUPPLY
Biomass Supply and Cost
While it is important that both the development of feedstocks for biofuels and the expansion of biofuel use in the transportation sector be achieved in a socially, economically, and environmentally sustainable manner, the social, economic, and environmental effects of domestic biofuels production have so far been mixed. In 2007, the United States consumed about 6.8 billion gallons of ethanol, made mostly from corn grain, and 491 million gallons of biodiesel, made mostly from soybean (EIA, 2008b), for a combined total of less than 3 percent of the U.S. transportation-fuel consumption. Diverting corn, soybean, or other food crops to biofuel production induces competition among food, feed, and fuel uses. Moreover, both for corn grain ethanol and soybean biodiesel, the use of fossil fuels and other inputs are substantial, and greenhouse gas reductions compared to petroleum-based gasoline emissions are small at best (Farrell et al., 2006; Hill et al., 2006). Thus, the committee judges that corn grain ethanol and soybean biodiesel are merely intermediates in the transition from oil to cellulosic biofuels or other biomass-based liquid hydrocarbon transportation fuels (for example, biobutanol and algal biofuels).
Assuming that technologies for conversion will be commercially viable, liquid fuels made from lignocellulosic biomass2 can offer major greenhouse gas reductions relative to petroleum-based fuels, as long as the biomass feedstock is a residual product of some forestry and farming operations or is grown on marginal lands that are not used for food and feed crop production. Therefore, the committee focused on the lignocellulosic resources available for producing biofuels, and it assessed the costs of different feedstocks of this type—corn stover, wheat and seed-grass straws, hay, dedicated fuel crops, woody biomass, animal manure, and municipal solid waste—delivered to a biorefinery for conversion. Societal needs were considered by examining recent analyses of trade-offs between land use for biofuel production and land use for growing food, feed, and fiber, as well as for ecosystem services.
The committee estimated the amounts of cellulosic biomass that could be produced sustainably in the United States and result in fuels with significantly lower greenhouse gas emissions than petroleum produces. For the purpose of this study, the committee considered biomass to be produced in a sustainable manner if it met the following criteria: (1) croplands would not be diverted for biofuels (so that land would not be cleared elsewhere to grow the crops thus displaced); and (2) the growing and harvesting of cellulosic biomass would incur minimal adverse environmental impacts—such as erosion, excessive water use, and nutrient runoff—or even reduce them.
The committee estimated (1) that about 400 million dry tons (365 million dry tonnes) per year of biomass could potentially be made available for the production of liquid transportation fuels using technologies and management practices of 2008 and (2) that the cellulosic biomass supply could increase to about 550 million dry tons (500 million dry tonnes) each year by 2020 (Table 5.1). A key assumption in the committee’s analysis was that 18 million acres of land currently enrolled in the Conservation Reserve Program (CRP) would be used to grow perennial grasses or other perennial crops for biofuel production, and that the acreage would increase to 24 million acres by 2020 as knowledge increased with time. Other key assumptions were that (1) harvesting methods would be developed for efficient collection of forestry or agricultural residues; (2) improved
TABLE 5.1 Estimated Amount of Lignocellulosic Feedstock That Could Be Produced Annually for Biofuel Using Technologies Available in 2008 and in 2020
|
Feedstock Type |
Million Tons |
|
|
With Technologies Available in 2008 |
With Technologies Available by 2020 |
|
|
Corn stover |
76 |
112 |
|
Wheat and grass straw |
15 |
18 |
|
Hay |
15 |
18 |
|
Dedicated fuel crops |
104a |
164 |
|
Woody biomass |
110 |
124 |
|
Animal manure |
6 |
12 |
|
Municipal solid waste |
90 |
100 |
|
Total |
416 |
548 |
|
aCRP land has not been used for dedicated fuel crop production as of 2008. As an illustration, the committee assumed that two-thirds of the CRP land would be used for dedicated fuel production. |
||
TABLE 5.2 Estimate of Biomass Suppliers’ Willingness-to-Accept Price (in 2007 Dollars) per Dry Ton of Delivered Cellulosic Material
|
Biomass |
Willingness-to-Accept Price (dollars per ton) |
|
|
Estimated in 2008 |
Projected in 2020 |
|
|
Corn stover |
110 |
86 |
|
Switchgrass |
151 |
118 |
|
Miscanthus |
123 |
101 |
|
Prairie grasses |
127 |
101 |
|
Woody biomass |
85 |
72 |
|
Wheat straw |
70 |
55 |
management practices and harvesting technology would raise agricultural crop yield; (3) yield increases would continue at the historic rates seen for corn, wheat, and hay; and (4) all cellulosic biomass estimated to be available for energy production would be used to make liquid fuels. The last assumption allowed the committee to estimate the potential amount of such fuel that could be produced.
Although the committee estimated that 550 million dry tons of cellulosic feedstock could be harvested or produced sustainably in 2020, those estimates are not predictions of what would be available for fuel production in 2020. The actual supply of biomass could be greater if existing croplands were used more efficiently (Heggenstaller et al., 2008) or if genetic improvements to dedicated fuel crops resulted in higher yields. But the supply could be lower if producers decided not to harvest agricultural residues or grow dedicated fuel crops on their CRP land.
The committee also estimated the costs of biomass delivered to a conversion plant (Table 5.2). In this analysis, the price that the farmer or supplier would be willing to accept was assumed to include land-rental cost; other forgone net returns from not selling or using the cellulosic material for feed or bedding; and all other costs incurred in sustainably producing, harvesting, storing, and transporting the biomass to the processing plant. The cost or feedstock price is the long-run equilibrium price that would induce suppliers to deliver biomass to the conversion plant. Because an established market for cellulosic biomass does not exist, the analysis relied on estimates obtained from the literature. The committee’s estimates are higher than those of other published reports because transportation and land-rental costs are included.
The geographic distribution of biomass supply is an important factor in the
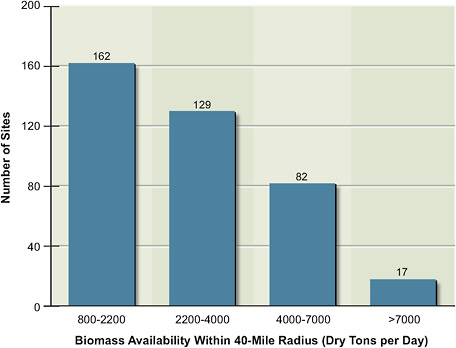
FIGURE 5.1 The number of sites in the United States that can supply the indicated daily amounts of biomass from within a 40-mile radius of each site.
development of the U.S. biofuels industry. For illustrative purposes, the committee estimated the quantities that could, for example, be available within a 40-mile radius (about a 50-mile driving distance) of fuels-conversion plants across the United States (Figure 5.1). With the exception of transport of woody material (primarily pulpwood), 40–50 miles has historically been the maximum distance considered economically feasible for biomass transport. An estimated 290 sites could supply from 1,500 up to 10,000 dry tons per day (from 0.5 million to 3.7 million dry tons per year) of biomass to conversion plants within a 40-mile radius. Notably, the wide geographic variation in potential biomass availability for processing plants affects their sizes. This variation suggests the potential to optimize each individual conversion plant to decrease costs and maximize environmental benefits and supply within a given region. Increasing the distance of delivery could result in larger conversion plants with lower fuel costs.
To help realize the committee’s projected sustainable biomass supply, incentives could be provided to farmers and developers for using a systems approach to address biofuel production; soil, water, and air quality; carbon sequestration; wild2
life habitat; and rural development in a comprehensive manner. Such incentives might encourage farmers, foresters, biomass aggregators, and biorefinery operators to work together to enhance technology development and ensure that best management practices were used for every combination of landscape and potential feedstock.
Findings: Biomass Supply and Cost
An estimated annual supply of 400 million dry tons of cellulosic biomass could be produced sustainably with technologies and management practices already available in 2008. The amount of biomass deliverable to conversion facilities could probably be increased to about 550 million dry tons by 2020. The committee judges that this quantity of biomass can be produced from dedicated energy crops, agricultural and forestry residues, and municipal solid wastes with minimal effects on U.S. food, feed, and fiber production and minimal adverse environmental effects.
Biomass availability could limit the size of a conversion facility and thereby influence the cost of fuel products from any facility that uses biomass irrespective of the conversion approach. Biomass is bulky and difficult to transport. The density of biomass growth will vary considerably from region to region in the United States, and the biomass supply available within 40 miles of a conversion plant will vary from less than 1,000 tons per day to 10,000 tons per day. Longer transportation distances could increase supply but would increase transportation costs and could magnify other logistical issues. The development of technologies that increase the density of biomass in the field, such as field-scale pyrolysis, could facilitate transportation of biomass to larger-scale regional conversion facilities.
Improvements in agricultural practices and in plant species and cultivars will be required to increase the sustainable production of cellulosic biomass and to achieve the full potential of biomass-based fuels. A sustained research and development (R&D) effort to increase productivity, improve stress tolerance, manage diseases and weeds, and improve the efficiency of nutrient use will help to improve biomass yields. Focused R&D programs supported by the federal government could provide the technical bases for improving agricultural practices and biomass growth to achieve the desired increase in sustainable production of cellulosic biomass. Attention could be directed toward plant breeding, agronomy, ecology, weed
and pest science, disease management, hydrology, soil physics, agricultural engineering, economics, regional planning, field-to-wheel biofuel systems analysis, and related public policy.
Incentives and best agricultural practices will probably be needed to encourage sustainable production of biomass for production of biofuels. Producers need to grow biofuel feedstocks on degraded agricultural land to avoid direct and indirect competition with the food supply; they also need to minimize land-use practices that result in substantial net greenhouse gas emissions. For example, continuation of CRP payments for CRP lands when they are used to produce perennial grass and wood crops for biomass feedstock in an environmentally sustainable manner might be an incentive. A framework could be developed, with input from agronomists, ecologists, soil scientists, environmental scientists, and producers, to assess the effects of cellulosic-feedstock production on various environmental characteristics and natural resources. Such a framework would provide guidance to farmers on sustainable production of cellulosic feedstock and contribute to improvements in energy security and in the environmental sustainability of agriculture.
Coal Supply
Deployment of coal-to-liquid fuel technologies would require large quantities of coal and thus an expansion of the coal-mining industry. For example, because a plant producing 50,000 barrels per day (bbl/d) of liquid transportation fuels uses approximately 7 million tons of coal per annum, 100 such plants—producing 5 million bbl/d of liquid transportation fuels—would require about 700 million tons of coal per year, or a 70 percent increase in the nation’s coal consumption. That would require major increases in coal-mining and transportation infrastructure, both in bringing coal from the mines to the plants and in bringing fuel from the plants to the market. These issues would represent major challenges, but they could be overcome. Thus, a key question is whether sufficient coal is available in the United States to support such increased consumption while also supplying other coal users, such as coal-fired electric power plants. In evaluating domestic coal resources, the National Research Council concluded:
Despite significant uncertainties in existing reserve estimates, it is clear that there is sufficient coal at current rates of production to meet anticipated needs through 2030. Further into the future, there is probably sufficient coal to meet the nation’s needs for more than 100 years at current rates of consumption. [However, a] combination of increased rates of production with more detailed reserve analyses that take into account location, quality,
recoverability, and transportation issues may substantially reduce the number of years of supply. Future policy will continue to be developed in the absence of accurate estimates until more detailed reserve analyses—which take into account the full suite of geographical, geological, economic, legal, and environmental characteristics—are completed. (NRC, 2007)
Recently, the Energy Information Administration estimated the proven U.S. coal reserves to be about 260 billion tons (EIA, 2009). A key conclusion of these two studies is that coal reserves in the United States are probably sufficient to meet the nation’s needs for more than 100 years at current rates of consumption—and possibly even with increased rates of consumption. The primary issue is likely not to be reserves per se, however, but rather the increased mining of coal and the opening of many new mines. Increased mining would have numerous potential environmental impacts—and, possibly, heightened public opposition—which would need to be addressed in acceptable ways. Meanwhile, the cost of coal, which currently is low relative to the cost of biomass, would undoubtedly increase.
Finding: Coal Supply
Despite the vast coal resource in the United States, it is not a forgone conclusion that adequate coal will be mined and available to meet the needs of a growing coal-to-fuels industry and the needs of the power industry. The potential for a rapid expansion of the U.S. coal-supply industry would have to be analyzed by the U.S. coal industry, the U.S. Environmental Protection Agency, the U.S. Department of Energy, and the U.S. Department of Transportation so that the critical barriers to growth, environmental effects, and their effects on coal costs could be delineated. The analysis could include several scenarios, one of which would assume that the United States will move rapidly toward increasing use of coal-based liquid fuels for transportation to improve energy security. An improved understanding of the immediate and long-term environmental effects of increased mining, transportation, and use of coal would be an important goal of the analysis.
CONVERSION TECHNOLOGIES
Two key technologies, biochemical conversion and indirect liquefaction, are used for the conversion of biomass and coal into fuels, as illustrated in Figure 5.2.
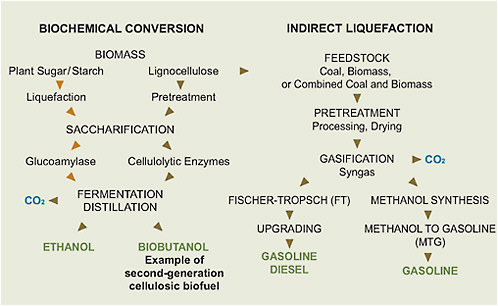
FIGURE 5.2 Steps involved in the biochemical conversion of biomass and the thermochemical conversion (indirect route only) of coal, biomass, or combined coal and biomass into liquid transportation fuels.
Biochemical conversion typically uses enzymes to transform starch (from grains) or lignocelluloses into sugars (saccharification), which are then converted into ethanol by microorganisms (fermentation). Thermochemical conversion includes indirect liquefaction, which uses heat and steam to convert biomass or coal into carbon monoxide and hydrogen (synthesis gas). The synthesis gas can then be catalytically converted into liquid fuels such as diesel and gasoline. The CO2 from the fermentation process in biochemical conversion or from the offgas streams of the thermochemical processes can be captured and geologically stored. Direct liquefaction of coal (not shown in Figure 5.2), which involves adding hydrogen to slurried coal at high temperatures and pressures in the presence of suitable catalysts, represents another route from coal to liquid fuels, but it is less developed than is indirect liquefaction.
Biochemical Conversion
The biochemical conversion of starch (from grains) to ethanol, as depicted on the left side of Figure 5.2, has been commercially deployed. But while this pro-
cess is important for stimulating public awareness and enhancing the industrial infrastructure for fuel ethanol, the committee considers grain-based ethanol to be a transition to cellulosic ethanol and other so-called advanced biofuels, because grain-based ethanol does not meet the sustainability criteria discussed above. The biomass supplies likely to be available by 2020 could technically be converted into ethanol by biochemical conversion, thereby displacing a significant proportion of petroleum-based gasoline and reducing greenhouse gas emissions, but the conversion technology has to be demonstrated first and developed into a commercially deployable state.
Over the next decade or two, cellulosic ethanol could be the main product of the biochemical conversion of biomass into fuels. Further research and development could also lead to commercial technologies that convert sugars into other biofuels such as butanol and alkanes, which have higher energy densities and could be distributed by means of the existing infrastructure. Although the committee focused on cellulosic ethanol as the most deployable technology over the next 10 years, it sees a long-term transition to conversion of cellulosic biomass to higher-energy alcohols or hydrocarbons—so-called advanced biofuels—as having significant long-term potential.
The challenge in biochemical conversion of biomass into fuels is to first break down the resistant structure of a plant’s cell wall and then to break down the cellulose into five-carbon and six-carbon sugars fermentable by microorganisms; the effectiveness with which this sugar is generated is critical to economic biofuel production. The process for producing cellulosic ethanol, as shown in Figure 5.2, includes (1) preparation of the feedstock to achieve size reduction by grinding or other means; (2) pretreatment of the feedstock with steam, liquid hot water, or an acid or base to release cellulose from the lignin shield; (3) saccharification, by which cellulase hydrolyzes cellulose polymers into cellobiose (a disaccharide) and glucose (a monosaccharide), and hemicellulase breaks down hemicellulose into monosaccharides; (4) fermentation of the sugars into ethanol; and (5) distillation to separate the ethanol. The CO2 generated by the conversion process and the combustion of the fuel is mostly offset by the CO2 uptake during the growth of the biomass. The unconverted materials are burned in a boiler to generate steam for the distillation; some surplus electricity can thus be generated.
As of the end of 2008, no commercial-scale cellulosic ethanol plants were in operation. However, the U.S. Department of Energy (DOE) announced in February 2007 that it would invest up to $385 million for six biorefinery projects (two of them based on gasification) over 4 years to help bring cellulosic ethanol to
market (DOE, 2007). When fully operational, the total production of these six plants would be 8000 bbl/d. In addition, a number of companies are actively pursuing commercialization of cellulosic ethanol plants. The corresponding technologies will continue to evolve over the next 5–10 years as challenges are overcome and experience is gained in the first technology-demonstration and commercial-demonstration plants. As a result, the committee expects deployable and commercialized technology to be in place by 2020 if technology-demonstration plants continue to be built, despite the current economic crisis, and if they are rapidly followed by commercial-demonstration plants.
The committee developed a model, in collaboration with the Massachusetts Institute of Technology, that estimated costs and CO2 emissions for converting the biomass feedstocks just discussed into ethanol via biochemical pathways. The model included the effects of enzyme cost (10–40 cents per gallon [¢/gal]),3 feedstock composition, solids loading (18–25 percent), and plants size (40 and 100 million gallons per year, corresponding to daily feed rates of 1400 and 3500 dry tons, respectively). The analysis also included the effects of pretreatment, hydrolysis, and fermentation yields. Three scenarios (representing low, medium, and high levels of improvements) were developed, in the form of process-cost estimates, representing current technology for the biochemical conversion of cellulosic feedstocks, reasonable evolutionary advancement of the technology, and the most optimistic advancement of the technology. (See NAS-NAE-NRC, 2009, for details on the analyses and results.)
The committee judges that the reasonable-improvement scenario best represents where the technology will be for 2020 deployment, and that the major-improvement scenario shows the considerable potential likely to remain. Results of the modeling for the woody biomass poplar, as an illustration of how technology improvements and the size of the ethanol plant could affect costs, are given in Table 5.3. The current costs of production are estimated for a biorefinery with a production capacity of 40 million gallons of ethanol per year; the committee accounted for the costs of production by 2020 by assuming reasonable technological advancements between now and then for the same-size plant. The estimated cost of production in 2020 at a biorefinery with a production capacity of 100 million gallons of ethanol per year is also shown to illustrate the economy of scale.
Table 5.3 shows that the cost of biomass (listed as “raw material-dependent
TABLE 5.3 Comparison of Costs (in 2007 Dollars) for Three Scenarios That Represent Low, Medium, and High Levels of Improvements in Technology and Process Efficiency in a Biorefinery Using the Woody Biomass Poplar
|
|
Level of Improvement |
Cost at Higher Capacity and Medium Improvement |
||
|
Poplar Low |
Poplar Medium |
Poplar High |
||
|
Plant capacity (million gallons) |
40 |
40 |
40 |
100 |
|
Total capital ($ million) |
223 |
194 |
174 |
349 |
|
Total capital ($ per annual gallon) |
5.65 |
4.85 |
4.34 |
3.49 |
|
Total capital ($ per barrel per day) |
87,000 |
75,000 |
67,000 |
61,000 |
|
Biomass used (dry tons) |
593,000 |
514,000 |
461,000 |
1,286,000 |
|
Yield (gallons per ton) |
67 |
78 |
87 |
78 |
|
Ethanol operating cost ($ per gallon) |
1.95 |
1.40 |
0.90 |
1.30 |
|
Ethanol production cost ($ per gallon) |
2.70 |
2.00 |
1.50 |
1.82 |
|
Facility-dependent fraction of cost (percent) |
34 |
39 |
48 |
36 |
|
Raw material-dependent fraction of cost (percent) |
57 |
51 |
40 |
57 |
fraction of cost”) is a significant component of ethanol production costs. But with significant evolutionary improvement of the technology and scaling up of the operation, the process economics can be improved.
Ethanol has 66 percent as much energy as gasoline does. Ethanol is also hygroscopic and cannot be transported in existing fuel-infrastructure pipelines because of its affinity for water. It also is corrosive and can damage seals, gaskets, and other equipment and induce stress-corrosion cracking in high-stress areas. Ethanol is currently shipped by rail or barge. If ethanol is to be used in a fuel at concentrations higher than 20 percent ethanol (for example, in E85, which is a blend of 85 percent ethanol and 15 percent gasoline), the number of refueling stations will have to be increased. If ethanol is to replace a substantial volume of transportation gasoline, an expanded infrastructure will be required for its distribution. (The transport and distribution of synthetic diesel and gasoline produced from thermochemical conversion are less challenging because they are compatible with the existing infrastructure for petroleum-based fuels.)
Some key research, development, and demonstration challenges related to the ethanol-production process need to be overcome before the fuel’s widespread commercialization can be achieved. These challenges are as follows: (1) improve the effectiveness of pretreatment in removing and hydrolyzing the hemicellulose, separating the cellulose from the lignin, and loosening the cellulose structure; (2) reduce the production costs of the enzymes for converting the cellulose to sugars; (3) reduce operating costs by developing more effective enzymes and more efficient microorganisms for converting the sugar products of biomass-deconstruction into biofuels; (4) demonstrate the biochemical-conversion technology on a commercial scale; and (5) begin to optimize capital costs and operating costs. The size of the biorefineries will likely be limited by the supply of biomass available from the surrounding regions. Such limitations could result in potential loss of the economies of scale that characterize large plants.
Findings: Biochemical Conversion
Process improvements in cellulosic-ethanol technology are expected to reduce the plant-related costs associated with ethanol production by up to 40 percent over the next 25 years. Over the next decade, process improvements and cost reductions are expected to come from evolutionary developments in technology, from learning gained through commercial experience and increases in the scale of operation, and from research and engineering in advanced chemical and biochemical catalysts that will enable their deployment on a large scale. Federal support for R&D programs is important for resolving the major technical challenges facing ethanol production from cellulosic biomass: pretreatment, suitable enzymes, tolerance to toxic compounds and products, solids loading, engineering microorganisms, and novel separations for ethanol and other biofuels. Designing the R&D programs with a long-term perspective could address current problems at a fundamental level and contribute to visible industrial goals. Furthermore, R&D programs that are closely coupled with pilot and commercial-scale demonstrations of cellulosic-ethanol plants could help resolve issues that arise during demonstrations.
Biochemical conversion processes, as configured in cellulosic-ethanol plants, produce a stream of relatively pure CO2from the fermenter that can be dried, compressed, and made ready for geologic storage or used in enhanced oil recovery with little additional cost. Geologic storage of the CO2 from biochemical conversion of plant matter (such as cellulosic biomass) further reduces greenhouse gas life-cycle emissions from advanced biofuels, whose greenhouse gas life-cycle
emissions would become highly negative. Because geologic storage of CO2 from biochemical conversion of biomass to fuels could be important in reducing greenhouse gas emissions in the transportation sector, it could be evaluated and demonstrated in parallel with a program of geologic storage of CO2 from coal-based fuels.
Future improvements in cellulosic technology that entail invention of biocatalysts and related biological processes could produce fuels that supplement ethanol production in the next 15 years. In addition to ethanol, advanced biofuels (such as lipids, higher alcohols, hydrocarbons, and other products that are easier to separate than ethanol) should be investigated because they could have higher energy content and would be less hygroscopic than ethanol and therefore could fit more compatibly into the current petroleum infrastructure than ethanol can. Large-scale commercial application of advances in biosciences (genomics, molecular biology, and genetics) and in biotechnologies to convert biomass directly to produce lipids, higher alcohols, and hydrocarbons fuels (that can be directly integrated into the existing transportation infrastructure) poses many challenges. These challenges will need to be resolved by R&D and demonstration if major advances in the production of alternative liquid fuels from renewable resources are to be realized. Research support from the federal government could help focus advances in bioengineering and the expanding biotechnologies on the development of advanced biofuels.
The need to expand the delivery infrastructure to meet a high volume of ethanol deployment could delay and limit the penetration of ethanol into the U.S. transportation-fuels market. Replacing a substantial proportion of transportation gasoline with ethanol will require a new infrastructure for ethanol’s transport and distribution. Although the cost of delivery is a small fraction of the overall ethanol fuel cost, the logistics and capital requirements for widespread expansion could present many hurdles if they are not well planned.
A comprehensive study could be conducted jointly by the DOE and the biofuels industry to identify the infrastructure system requirements of, the research and development needs in, and the challenges facing the expanding biofuels industry. Such a study would consider the long-term potential of truck or barge delivery versus the potential of pipeline delivery that is needed to accommodate increasing volumes of ethanol, in addition to the timing and role of advanced biofuels that are compatible with the existing gasoline infrastructure.
Thermochemical Conversion
Indirect liquefaction converts coal, biomass, or mixtures of coal and biomass to liquid fuels by first gasifying the feedstocks to produce syngas, then cleaning it and adjusting its H2-to-CO ratio (whereupon it is called synthesis gas) and catalytically converting the synthesis gas using Fischer-Tropsch (FT) technology into high cetane, clean diesel, and some naphtha (which can be upgraded to gasoline). The synthesis gas can also be converted into methanol using commercial technology, and methanol-to-gasoline (MTG) technology can then be used to produce high-octane gasoline from the methanol (Figure 5.2). These technologies can be integrated with those that compress the CO2 emitted during production and store it underground—for example, in deep saline aquifers. Unlike ethanol, the gasoline and diesel produced via FT and MTG are fully compatible with the existing infrastructure and vehicle fleet.
Gasification has been used commercially worldwide for nearly a century by the chemical, refining, and fertilizer industries and for more than 10 years by the electric power industry. More than 420 gasifiers are currently in use in some 140 facilities worldwide, with 19 plants operating in the United States. Application to coal-to-liquid-fuel systems, and to combined coal-and-biomass gasification, will lead to further improvements in the technology so that it might become more robust and efficient by 2020. Gasification of biomass alone has been commercially demonstrated but requires added operational experience to render it more robust.
FT technology was first commercialized by the South African firm Sasol in the mid-1950s. Sasol now produces more than 165,000 bbl/d of transportation fuels from coal, and it has built large plants based on conversion of natural gas into synthesis gas, which is then converted into diesel and gasoline by FT. As with several other ready-to-deploy technologies, FT will likely undergo significant process improvements by 2020. For example, more robust and efficient technology for producing liquid transportation fuels, and significant catalyst improvements for coal applications, can be expected.
In technologies based on methanol synthesis, synthesis gas is converted to methanol using available commercial technology; plants as large as 6000 tons per day are currently operating. The methanol can be used directly or upgraded into high-octane gasoline using the proprietary MTG catalytic process developed by ExxonMobil and commercialized in New Zealand in the late 1980s.4 Standard
MTG technology is considered by the committee to be commercially deployable today; a number of projects are in fact moving toward commercial deployment. Meanwhile, several variations on the technology, which could provide improvements, are ready for commercial demonstration.
While the technologies involved in thermochemical conversion of coal have all been commercialized and their operators have logged years of experience, geologic storage of CO2 has not been adequately developed and demonstrated. For power generation from coal, most of the costs for CCS are in the CO2 capture part of the process, and this technology has been demonstrated on a large scale. However, geologic storage of CO2 in the subsurface has not been developed and demonstrated, except for use in enhanced oil recovery, and so there is insufficient confidence in its efficiency and long-term efficacy for commercial application at required scales. This is an important consideration for coal-to-liquid-fuels technology, as its CO2 emissions are high because of the high carbon content of coal (about twice the carbon content of oil). Even with geologic storage of CO2, the well-to-wheel emissions from coal-to-liquid fuels are about the same as those of gasoline because, as for any hydrocarbon fuel, CO2 is released when the fuel is combusted in vehicles.
Inclusion of biomass in the feedstock with coal decreases the greenhouse gas life-cycle emissions because the biomass takes up atmospheric CO2 during its growth. Thus, it is possible to optimize the biomass-plus-coal indirect liquefaction process to produce liquid fuels that have somewhat lower life-cycle greenhouse gas emissions than does gasoline, and even to make carbon-neutral liquid fuels if geologic storage of CO2 is used. Although the notion of gasifying mixtures of coal and biomass to produce liquid fuels is relatively new and commercial experience is limited, several demonstration units are currently running in Europe. The committee judges that the technology for co-feeding biomass and coal is close to being ready for commercial deployment.
Gasifiers for biomass alone, designed around limited biomass availability, operate on a smaller scale than those for coal and thus will be more costly because of the diseconomies of scale of small plants. However, the fuels produced from such plants can have greenhouse gas life-cycle emissions that are close to zero without geologic storage of CO2, and they can have highly negative carbon emissions if geologic storage of CO2 is employed. The committee judges that standalone biomass gasification technology is probably 5–8 years away from commercial scale-up.
Working with the Princeton Environmental Institute, the committee analyzed the costs and CO2 balances for thermochemical conversion of coal and biomass.
In these analyses, the viability of CCS was assumed to have been demonstrated by 2015 so that integrated coal-to-liquid fuel plants could start up by 2020. This assumption is ambitious, and focused and aggressive government action will be needed to make it happen. Four technologies, with and without CCS, were evaluated:
-
A 50,000 bbl/d plant converting coal into diesel and naphtha using FT and then upgrading the naphtha to gasoline.
-
A 50,000 bbl/d plant converting coal into gasoline using MTG.
-
A 4,000 bbl/d plant converting biomass into diesel and naphtha using FT and then upgrading the naphtha to gasoline. The capacity of the plant is limited by the biomass supply of 4,000 dry tons per day.
-
A 10,000 bbl/d plant converting biomass and coal into gasoline and diesel at a 40:60 ratio by feedstock energy (about 4,000 tons per day of biomass) using FT or MTG.
Some key results of the analysis are given in Table 5.4, and the complete results are contained in the report Liquid Transportation Fuels from Coal and Biomass: Technological Status, Costs, and Environmental Impacts (NAS-NAE-NRC, 2009). Details of models can be found in Kreutz et al. (2008) and Larson et al. (2008).
Table 5.4 shows that a large-scale coal plant with a 50,000 bbl/d capacity could produce fuels at a cost of about $50–70/bbl of crude oil (or about $60–80/bbl of gasoline equivalent). However, without CCS, the plant’s CO2 emissions would be double those of petroleum-based gasoline on a life-cycle or well-to-wheels basis. Results with MTG are comparable. But even with CCS, both the FT and the MTG process produce low-cost fuels, and the CO2 emissions are similar to those of petroleum gasoline.
The engineering cost of CCS is about $10–15 per tonne of CO2 avoided. The coal-to-liquid plant configurations produce a concentrated stream of CO2 as an integral part of the process, so CO2 capture can be readily and more cheaply achievable than that, for example, in integrated gasification combined-cycle or pulverized-coal plants. The FT and MTG options without CCS are relevant if reduced CO2 emissions are not desired and if energy supply and diversity of supply are the overriding societal issues. However, in a carbon-constrained world, there will be a drive to produce fuels with zero net CO2 emissions. A plant that used combined coal and biomass as a feedstock with CCS could produce
TABLE 5.4 Fuel Costs and CO2 Emissions for Thermochemical Conversion of Coal and Biomass
|
|
Coal-to-Liquid FT |
Coal-to-Liquid FT |
Coal-to-Liquid MTG |
Coal-and-Biomass-to-Liquid FT |
Biomass-to-Liquid FT |
|
Without CCS |
With CCS |
With CCS |
With CCS |
With CCS |
|
|
Inputs: |
|
|
|
|
|
|
Coal (tons per day as received) |
26,700 |
26,700 |
23,200 |
3,030 |
0 |
|
Biomass (dry tons per day) |
0 |
0 |
0 |
3,950 |
3,950 |
|
Biomass (mass %) |
0 |
0 |
0 |
57 |
100 |
|
Biomass energy (%, low heating value) |
0 |
0 |
0 |
42 |
100 |
|
Outputs: |
|
|
|
|
|
|
Gasoline (bbl/d) |
21,290 |
21,290 |
50,000 |
4,260 |
|
|
Diesel (bbl/d) |
28,700 |
28,700 |
0 |
5,750 |
|
|
Total liquid fuels (bbl/d) |
50,000 |
50,000 |
50,000 |
10,000 |
4,410 |
|
Economic metrics: |
|
|
|
|
|
|
Specific total plant cost ($/bbl per day) |
97,600 |
98,900 |
80,400 |
134,000 |
147,000 |
|
Total liquid fuels cost ($/gal of gasoline equivalent) |
1.50 |
1.64 |
1.57 |
2.52 |
3.32 |
|
Break-even oil price ($/bbl) |
56 |
68 |
51 |
103 |
139 |
|
Emissions relative to petroleum-derived fuels |
2.18 |
1.03 |
1.17 |
−0.02 |
−1.35 |
|
Cost of avoided CO2 ($/tonne)a |
— |
11 |
10 |
15 |
20 |
|
Note: CCS = carbon capture and storage; FT = Fischer-Tropsch; MTG = methanol-to-gasoline. aIncludes the costs of CO2 transport and geologic storage and is expressed as dollars per tonne of CO2 equivalent avoided. |
|||||
10,000 bbl/d of fuels with close to zero CO2 emissions. Note that the case shown is for FT, but the economics would look similar if MTG were used. FT primarily produces diesel; MTG produces gasoline. The economics show that the capital costs of coal-and-biomass-to-liquid fuel plants are higher than the costs of coal-to-liquid fuel plants.
The CO2 emissions are near zero on a life-cycle basis because the biomass in the feedstock is a carbon sink, offsetting some of the coal carbon. The key assumption in this case is that biomass availability is limited to 4000 tons per day by regional harvesting and transportation considerations. In those sites where locally sustainable biomass densities are higher (see Figure 5.1), larger plants—perhaps as many as 100 nationwide—could be built at similar biomass-to-coal
ratios and result in lower cost for carbon-neutral fuels. The last column of Table 5.4 shows the case for gasification with biomass as the single feedstock. The costs are high because of the small plant size, limited by feedstock availability. However, the life-cycle CO2 emissions are net negative, which would be attractive if overall costs of production could be brought down.
The area of greatest uncertainty for conversion of coal and biomass into liquid fuels is the geologic storage of CO2. As of late 2008, few commercial-scale geologic storage demonstrations had been carried out or were ongoing. Yet well-monitored and commercial-scale demonstrations are needed to gather data sufficient to assure industry and governments of the long-term viability, costs, and safety of geologic CO2 storage and to develop procedures for site choice, permitting, operation, regulation, and closure. These objectives are particularly critical to the commercial success of thermochemical technology, which relies on the political and commercial acceptability of large-scale geologic storage of CO2.
The potential costs of CCS of $10–15 per tonne of CO2 avoided are “bottom-up” estimates, based largely on engineering estimates of expenses for transport, land purchase, permitting, drilling, capital equipment, storage, well capping, and monitoring for an additional 50 years. However, uncertainty about the regulatory environment arising from concerns of the general public and policy makers has the potential to raise storage costs and slow commercialization of thermochemical fuel production technology. Ultimate requirements for design, monitoring, carbon-accounting procedures, and liability for long-term monitoring of geologically stored CO2, as well as the associated regulatory frameworks, are dependent on future commercial-scale demonstrations of geologic storage of CO2. These demonstrations will have to be pursued aggressively over the next few years if thermo-chemical conversion of biomass and coal with geologic storage of CO2 is to be ready for commercial deployment in 2020 or sooner.
As a first step toward accelerating the commercial demonstration of coal-to-liquid and coal-and-biomass-to-liquid fuels technology and addressing the CO2 storage issue, commercial-scale demonstration plants could serve as sources of CO2 for geologic storage demonstration projects. So-called capture-ready plants that vented CO2 would create liquid fuels with higher CO2 emissions per unit of usable energy than petroleum-based fuels produce; commercialization of these plants would not be encouraged unless they were integrated with geologic storage of CO2 at their start-up.
Direct liquefaction of coal—which involves relatively high temperature, high hydrogen pressure, and liquid-phase conversion of coal directly into liquid
products—has a long history, as does the FT process. Direct liquefaction products generally are heavy liquids that require significant further upgrading into liquid transportation fuels. The technology is not ready for commercial deployment. Further, because of the absence of recent detailed design studies in the available literature, the committee’s ability to estimate costs and performance is limited.
The three most significant R&D priorities for commercialization of thermochemical technologies are these:
-
Immediate construction of a small number of commercial first-mover projects, combined with geologic storage of CO2, that put the technology on the path toward reduced cost, improved performance, and robustness. These projects would have major R&D components that focus on solving problems identified in the operation of plants and on developing technology for specific improvements.
-
R&D programs, associated with commercial-scale geologic CO2 storage demonstrations, that involve detailed geologic analysis and a broad array of monitoring tools and techniques to provide the data and understanding upon which future commercial projects will depend.
-
Research that determines the penalties associated with preprocessing of biomass, the choice of a best gasifier for a given biomass type, the technical problems with feeding biomass to high-pressure gasification systems, and the answers to related questions. Biomass gasification and combined biomass and coal gasification have potential CO2-reduction benefits, but they can be brought to commercialization only if such practical issues are resolved.
Findings: Thermochemical Conversion
Technologies for the indirect liquefaction of coal to transportation fuels are commercially deployable today; without geologic storage of the CO2produced in the conversion, however, greenhouse gas life-cycle emissions will be about twice those of petroleum-based fuels. With geologic storage of CO2, coal-to-liquid transportation fuels could have greenhouse gas life-cycle emissions equivalent to those of equivalent petroleum-derived fuels.
Technologies for the indirect liquefaction of coal to produce liquid transportation fuels with greenhouse gas life-cycle emissions equivalent to those of petroleum-
based fuels can be commercially deployed before 2020 only if several first-mover plants are started up soon and if the safety and long-term viability of geologic storage of CO2is demonstrated in the next 5–6 years.
Indirect liquefaction of combined coal and biomass to transportation fuels is close to being commercially deployable today. Coal can be combined with biomass at a ratio of 60:40 (on an energy basis) to produce liquid fuels that have greenhouse gas life-cycle emissions comparable to those of petroleum-based fuels if CCS is not implemented. With CCS, production of fuels from coal and biomass would have a carbon balance of about zero to slightly negative. A program of aggressive support for first-mover commercial plants that produce coal-to-liquid transportation fuels and coal-and-biomass-to-liquid transportation fuels with integrated geologic storage of CO2 would have to be undertaken immediately if the United States were to address energy security with those fuels that have greenhouse gas emissions similar to or less than those of petroleum-based fuels. If decisions to proceed with commercial demonstrations are made soon so that the plants could start up in 4–5 years, and if CCS is demonstrated to be safe and viable, those technologies would be commercially deployable by 2020.
The technology for producing liquid transportation fuels from biomass or from combined biomass and coal via thermochemical conversion has been demonstrated but requires additional development to be ready for commercial deployment. For example, key technologies for biomass gasification would have to be demonstrated on an intermediate scale, alone and in combination with coal, to obtain the engineering and operating data required to design synthesis-gas-production units on a commercial scale.
Geologic storage of CO2on a commercial scale is critical for producing liquid transportation fuels from coal without a large adverse greenhouse gas impact. This is similar to the situation for producing power from coal. The operational procedures, monitoring, safety, and effectiveness of commercial-scale technology for geologic storage of CO2 would have to be demonstrated in an aggressive program if geologic storage of CO2 is to be ready for commercial deployment by 2020. Three to five commercial-scale demonstrations (each with about 1 million tonnes of CO2 per year and operated for several years) would have to be set up within the next 3–5 years in areas with different geologic stroage media. The demonstrations would focus on the site choice, permitting, monitoring, operation,
closure, and legal procedures needed to support the broad-scale application of the technology and would provide the needed engineering data and other information to determine the full costs of geologic storage of CO2.
COSTS, CO2EMISSIONS, AND SUPPLY
This section compares the life-cycle costs, CO2 emissions,5 and potential supplies of the alternative liquid fuel options for technologies deployable by 2020. The result of its analyses is a supply curve of fuels that use biomass, coal, or combined biomass and coal as feedstocks.
It should be noted that the supply curve does not represent the actual amounts of fuels that would be commercially available in 2020. Those supplies could well be smaller because of critical lags—both in the decisions to construct new conversion plants and in the construction itself—as discussed in the deployment section that follows. In addition, some of the coal and biomass supplies that appear to be economical might not be made available for conversion to alternative fuels because of logistical, infrastructural, and organizational issues or because they have already been committed to electric power plants. The analyses show how the potential supply curve might change with alternative carbon dioxide prices and alternative capital costs.
As mentioned earlier, the committee worked with several research groups to develop the costs and CO2 emissions of the individual conversion technologies and the cost of biomass. The analyses presented in this section use those inputs to derive life-cycle costs and CO2 emissions for the alternative fuels.
To examine the potential supply of liquid transportation fuels from non-petroleum sources, the committee developed estimates of the unit costs and quantities of various biomass sources that could be made available. The committee’s analysis was based on use of land that is currently not used for growing foods, although the committee cannot ensure that this land would not be used for food production in the future. The estimates of biomass supply were combined with estimates of supply of corn grain to satisfy the current legislative requirement to produce 15 billion gallons of ethanol per year. The analysis allowed the estimation
of a supply curve for biomass that shows the quantities of biomass feedstocks that would potentially be available at various unit costs. Coal was assumed to be available in sufficient quantities at a constant unit cost if used with biomass in thermochemical conversion processes. Quantitative analyses were developed to compare alternative pathways to convert biomass, coal, or combined coal and biomass to liquid transportation fuels using thermochemical technologies. Biochemical technology that produced ethanol from biomass was also evaluated quantitatively on as consistent a basis as possible. Various combinations of biomass feedstocks could, in principle, be converted with either thermochemical or biochemical conversion processes.6 However, rather than examining all possible combinations, the committee first examined the cost of and CO2 emission associated with each of the various thermochemical and biochemical conversion processes by using a generic biomass feedstock with approximately a median cost and biochemical composition (the committee used Miscanthus in the analysis) and then examined the costs, supplies, and CO2 emissions associated with one thermochemical conversion process and one biochemical conversion process that would use each of the different biomass feedstocks. The following assumptions underlie the analyses:
-
All suitable CRP land is allocated to the growing of biomass for liquid fuels. Conversion plants that use biomass as a feedstock by itself or combined with coal (with 60 percent coal and 40 percent biomass on an energy basis) have the capacity of about 4000 dry tons of biomass per day.
-
All product prices are free of government subsidies. The total cost of CO2 avoided, which includes the costs of drying, compression, pipelining, and geologic storage of CO2, is estimated to be in the range of $10–15 per tonne.
-
If a carbon price is imposed, it applies to the entire life-cycle CO2 net emissions—the balance of CO2 removal from the atmosphere by plants, CO2 released in the production of biomass, emissions from conversion of the feedstock to fuel, and emissions from combustion of the fuel. A process that removes more CO2 from the atmosphere than it produces receives a net payment for CO2.
-
No indirect greenhouse gas emissions result from land-use changes in the growing and harvesting of biomass.
-
The price of subbitumimous Illinois #6 coal is $42 per dry ton.
-
Electricity generated as a coproduct is valued at $80/MWh, absent any price placed on greenhouse gas emissions.
-
The biomass and co-fed coal/biomass conversion plants are sized for biomass feed rates of approximately 4000 dry tons per day.
-
The biomass feedstock is Miscanthus, a high-yield perennial grass costing $101 per dry ton.
Costs and CO2Emissions
The estimated 2020 supply function for biomass cost versus availability is shown in Figure 5.3. The costs of two of the feedstocks—corn grain and hay—are based on recent market prices. The corn price in particular is assumed to have dropped sharply from the 2008 high of $7.88 per bushel to $3.17 per bushel in 2020, corresponding to $130 per dry ton—a price more consistent with its historical levels. The price of hay is assumed to be $110 per dry ton, also similar to historical prices. The costs of most of the other feedstocks—corn stover, straw, high-yield grasses (such as Miscanthus), normal-yield grasses (such as native and mixed grasses and switchgrass), and woody biomass—are estimated from the growing, harvesting, transportation, and storage costs reported in the literature. Finally, the cost of using municipal solid wastes is based on a rough estimate of the costs of gathering, transporting, and storing them; although such costs can be highly variable, the committee assumes that they add up to $51 per dry ton.
The costs of producing alternative liquid fuels through the various pathways were estimated on the basis of the feedstock, capital, and operating costs, the conversion efficiencies, and the assumptions outlined above. Figure 5.4 shows the estimated gasoline-equivalent7 costs of alternative liquid fuels, without a CO2 price, produced from biomass, coal, or combined coal and biomass. Liquid fuels are produced using biochemical conversion—to make cellulosic ethanol from Miscanthus—or using thermochemical conversion via FT or MTG. For thermochemical conversion, FT and MTG are shown both with and without CCS. The cost of ethanol produced from corn grain is also included in Figure 5.4. For
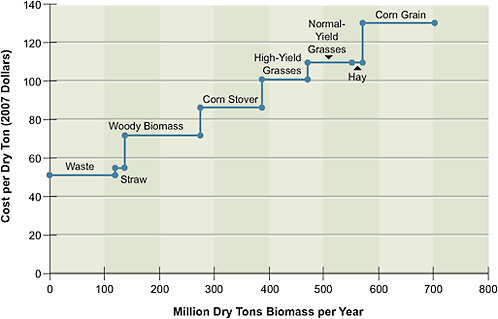
FIGURE 5.3 Supply function for biomass feedstocks in 2020. High-yield grasses include Miscanthus and normal-yield grasses include switchgrass and prairie grasses.
comparison, costs of gasoline are shown in Figure 5.4 for two different crude oil prices: $60/bbl and $100/bbl (that is, $73 and $113 per barrel of gasoline equivalent). Results are also shown in Table 5.5.
Figure 5.5 shows the net CO2 emissions per barrel of gasoline equivalent produced by various production pathways. The CO2 released during combustion of the fuel is similar among the options, with ethanol releasing less CO2 than is released with either gasoline or synthetic diesel and gasoline. But a large variation in net releases results from the CO2 taken out of the atmosphere when biomass is grown and from the significant differences in CO2 released into the atmosphere during the conversion process. CO2 emissions for corn grain ethanol are slightly lower than those of gasoline. In contrast, CO2 emissions of cellulosic ethanol without CCS are close to zero.
Figure 5.4 shows that FT coal-to-liquid fuel products with and without geologic CO2 storage are cost-competitive at gasoline-equivalent prices below $70/bbl (this represents equivalent crude-oil prices of about $55/bbl) and that prices for MTG are somewhat lower. Figure 5.5 shows that without CCS, both FT and MTG vent a large amount of CO2—over twice that of petroleum gasoline on a
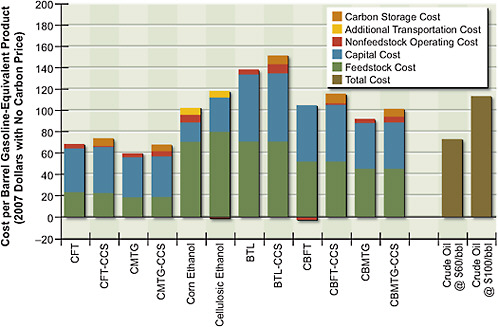
FIGURE 5.4 Cost of alternative liquid fuels produced from coal, biomass, or coal and biomass with no carbon price.
Note: BTL = biomass-to-liquid fuel; CBFT = coal-and-biomass-to-liquid fuel, Fischer-Tropsch; CBMTG = coal-and-biomass-to-liquid fuel, methanol-to-gasoline; CCS = carbon capture and storage; CFT = coal-to-liquid fuel, Fischer-Tropsch; CMTG = coal-to-liquid fuel, methanol-to-gasoline.
life-cycle basis. With CCS, the life-cycle CO2 emissions from FT and MTG are about the same as those from petroleum gasoline.
The biochemical conversion of biomass produces fuels that are more expensive than coal-to-liquid fuels because the conversion plants are small and the feedstock is more expensive—biomass costs almost four times as much as coal on an energy-equivalent basis. The production cost of cellulosic ethanol is around $115/bbl on a gasoline-equivalent basis. The cost of thermochemical conversion of biomass, without coal, is higher than the cost of cellulosic ethanol on an energy-equivalent basis and with geologic storage has the potential for large negative net releases of CO2; that is, the process involves a net removal of CO2 from the atmosphere. For biomass-to-liquid and venting of CO2, the estimated fuel cost is $140/bbl if electricity is sold back to the grid at $80/MWh; with geologic storage of CO2, it is $150/bbl if electricity is sold back to the grid at $80/MWh. The
TABLE 5.5 Estimated Costs of Various Fuel Products With and Without a CO2-Equivalent Price of $50 per Tonnea
results of the relatively small co-fed coal and biomass plant (total feed, 8000 tons per day) are particularly interesting. Fuels produced by that plant cost about $95/bbl on a gasoline-equivalent basis without CCS, and CO2 atmospheric releases from plants with CCS are negative. Those results point to the importance of that option in the U.S. energy strategy.
The important influence of CO2 price on fuel price is shown in Figure 5.6. In reading the graph, it is important to note that it shows the breakdown of all costs, including negative costs such as credit from electricity generation or carbon uptake. These negative costs must be subtracted from the positive ones in order to obtain the actual costs. For example, the cost of biomass-to-liquid fuel with CCS is $151/bbl – $37/bbl = $114/bbl. CO2 emissions for corn grain ethanol are slightly lower than for gasoline. In contrast, CO2 emissions of cellulosic ethanol without CCS are close to zero.
Figure 5.6 shows that a CO2 price of $50 per tonne significantly increases the costs of the fossil-fuel options, including the costs of petroleum-based gasoline. The large amount of CO2 vented in the coal-to-liquids process without CO2 storage almost doubles the cost of product once a carbon price of $50 per tonne of CO2 is imposed. The carbon price brings the cost of biochemical conversion options down to about $110/bbl.
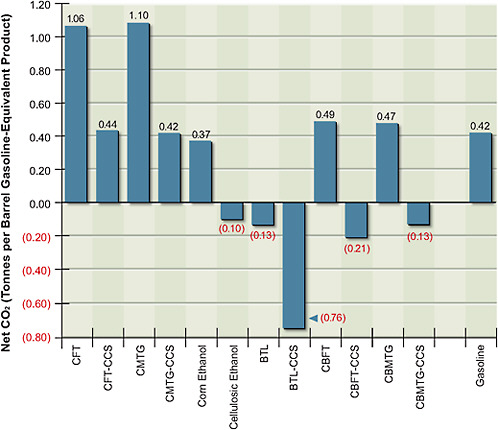
FIGURE 5.5 Estimated total carbon dioxide emissions over the life cycle of alternative fuels production—from the mining and harvesting of resources to the conversion to and consumption of fuels.
Note: BTL = biomass-to-liquid fuel; CBFT = coal-and-biomass-to-liquid fuel, Fischer-Tropsch; CBMTG = coal-and-biomass-to-liquid fuel, methanol-to-gasoline; CCS = carbon capture and storage; CFT = coal-to-liquid fuel, Fischer-Tropsch; CMTG = coal-to-liquid fuel, methanol-to-gasoline.
Inclusion of a carbon price does not increase the total costs of all thermochemical pathways. For example, thermochemical conversion of biomass costs about $150/bbl of gasoline equivalent with CCS, but with the carbon price and CCS, the produced fuels become competitive with petroleum-based fuels at about $115/bbl of gasoline equivalent ($100/bbl of crude oil equivalent). In general, if a pathway takes more CO2 from the atmosphere than it releases in other parts of its
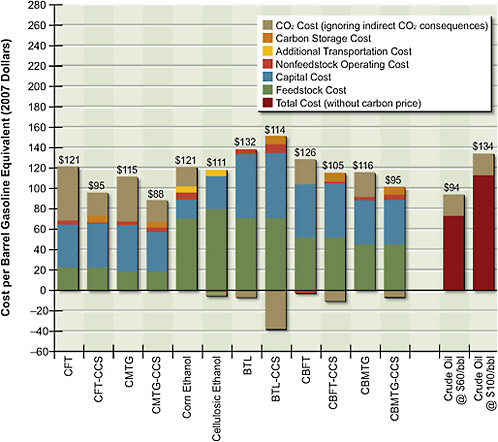
FIGURE 5.6 Cost of alternative liquid fuels produced from coal, biomass, or coal and biomass with a $50/tonne CO2price. Negative cost elements must be subtracted from the positive elements; the number at the top of each bar indicates the net costs.
Note: BTL = biomass-to-liquid fuel; CBFT = coal-and-biomass-to-liquid fuel, Fischer-Tropsch; CBMTG = coal-and-biomass-to-liquid fuel, methanol-to-gasoline; CCS = carbon capture and storage; CFT = coal-to-liquid fuel, Fischer-Tropsch; CMTG = coal-to-liquid fuel, methanol-to-gasoline.
life cycle, the inclusion of a carbon price reduces the pathway’s total cost of producing liquid fuel. Note that these estimates are all based on costs for small gasification units operating at a feed rate of 4,000 dry tons per day. If larger units were deployed in regions where potential biomass availability is large—for example, 10,000 dry tons per day—the result could be significantly lower costs.
Costs and Supply
As previously noted, the cost estimates for biochemical conversion and thermochemical conversion are based on only one biomass feedstock, Miscanthus. Moreover, Figures 5.4 to 5.6 do not show how much fuel could be produced at the estimated costs. To provide a more complete picture of alternative liquid fuels, the supply function from Figure 5.3 for all biomass feedstocks has been combined with the conversion-cost estimates. (The potential supply of gasoline and diesel from coal-to-liquids technology is discussed in the section below titled “Deployment of Alternative Transportation Fuels.”) The results are presented in Figures 5.7 and 5.8.
Figure 5.7 shows the potential gasoline-equivalent supply of ethanol from biochemical conversion of lignocellulosic biomass and corn grain, with technology deployable in 2020. The supply of grain ethanol satisfies the current legislative requirement to produce 15 billion gallons of ethanol per year in 2022. Figure 5.7
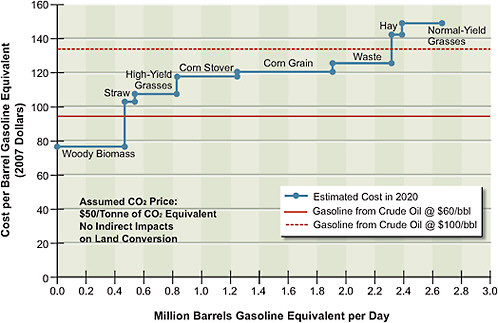
FIGURE 5.7 Estimated supply of cellulosic ethanol plus corn grain ethanol at different price points in 2020. The red solid and dotted lines show, for comparison, the supply of crude oil at $60 and $100 per barrel.
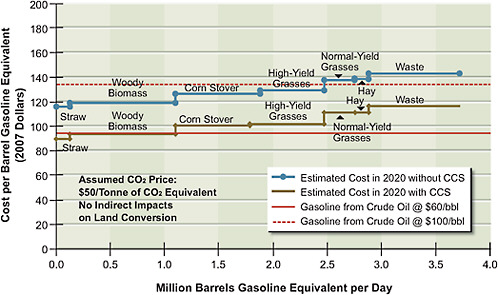
FIGURE 5.8 Estimated supply of gasoline and diesel produced by thermochemical conversion via Fischer-Tropsch, with or without CCS, at different price points in 2020.
shows potential supply and not the committee’s projected penetration of cellulosic ethanol in 2020. This is because it does not incorporate lags in implementation of the technology that will result because of the time required to obtain permits for and build the infrastructure to produce and transport these alternative liquid fuels. The estimated supply of synthetic gasoline and diesel derived from coal and biomass as feedstocks is shown in Figure 5.8. Two different supply functions are plotted, one with CCS and the other without CCS. They show that if the CCS technologies are viable and a price of $50 per tonne of CO2 is implemented, then for each feedstock it will be less costly to use CCS than to release the CO2 into the atmosphere.
Either of the production processes underlying Figures 5.7 or 5.8 would use the same supplies of biomass. Therefore the quantities cannot be added. If all of the production (in addition to ethanol produced from corn grain) were based on cellulosic conversion, the quantities shown in Figure 5.7 would be applicable. If all production were based on thermochemical conversion co-fed with biomass and coal, then the quantities shown in Figure 5.8 would be applicable. Most likely, some of the production would be based on cellulosic processes and some based
on thermochemical processes, so the actual potential supply function would lie between the two sets of supply functions shown in Figures 5.7 and 5.8. If corn grain ethanol (shown in Figure 5.7) has not been phased out by 2020, it would add about 0.67 million barrels per day of gasoline-equivalent production to the supply.
To put the results in perspective, the gasoline and diesel used by light-duty vehicles (LDVs) in the United States in 2008 was estimated to be about 9 million barrels of oil equivalent per day (1 bbl of crude oil produces about 0.85 bbl of gasoline equivalent). Total liquid fuels used in the United States was 21 million barrels per day, 14 million of which were used for transportation and 12 million of which were imported. Thus the 2 million barrels of gasoline equivalent of ethanol produced from cellulosic biomass and the 0.7 million barrels of gasoline equivalent of ethanol produced from corn grain have the potential to replace about 30 percent of the U.S. petroleum-based fuel consumed by LDVs, or almost 20 percent of all transportation fuels.
The potential supply of gasoline or diesel fuel from thermochemical conversion of a combination of biomass and coal (with CCS) is greater than with biochemical conversion of biomass alone. Moreover, the costs of thermochemical conversion of combined coal and biomass are lower than those of either biochemical or thermochemical conversion of biomass alone. The cost differences occur because coal is a lower-cost feedstock than is biomass. In addition, co-feeding coal and biomass allows a larger plant to be built and reduces capital costs per volume of product.
Using 60 percent coal and 40 percent biomass on an energy basis, almost 4 million barrels per day of gasoline equivalent—and thus of oil—can potentially be displaced from transportation. This would amount to 60 billion gallons of gasoline equivalent per year, or almost 45 percent of the gasoline and diesel used by LDVs in 2008. (The calculation assumes that all of the 550 million dry tons of cellulosic biomass sustainably grown for fuel will be used for coal-and-biomass-to-liquid fuel production. Thus the estimates represent the maximum potential supply.)
Findings: Costs and Supply
Alternative liquid transportation fuels from coal and biomass have the potential to play an important role in helping the United States to address issues of energy security, supply diversification, and greenhouse gas emissions with technologies that are commercially deployable by 2020.
-
With CO2emissions similar to those from petroleum-based fuels, a substantial supply of alternative liquid transportation fuels can be produced with thermochemical conversion of coal with geologic storage of CO2 at a gasoline-equivalent cost of $70/bbl.
-
With CO2emissions substantially lower than those from petroleum-based fuels, up to 2 million barrels per day of gasoline-equivalent fuel can technically be produced with biochemical or thermochemical conversion of the estimated 550 million dry tons of biomass available in 2020 at a gasoline-equivalent cost of about $115–140/bbl. Up to 4 million barrels per day of gasoline-equivalent fuel can be technically produced if the same amount of biomass is combined with coal (60 percent coal and 40 percent biomass on an energy basis) at a gasoline-equivalent cost of about $95–110/bbl. However, the technically feasible supply does not equal the actual supply inasmuch as many factors influence the market penetration of fuels.
DEPLOYMENT OF ALTERNATIVE TRANSPORTATION FUELS
The discussion in this chapter thus far has addressed the potential supply of alternative transportation fuels from technologies ready to be commercially deployed by 2020; potential supply, however, does not translate into what will be available at that time. The rates at which alternative liquid fuels can penetrate the market will depend on many variables. In addition to technological readiness, they include such factors as oil price, carbon taxes, the construction environment, and labor availability. To illustrate the lag between the time when technology becomes commercially deployable and the time when significant market penetration of its product occurs, the committee developed a few plausible scenarios.
Cellulosic Ethanol
Regarding biochemical conversion to cellulosic ethanol, the committee took into account the current activities with demonstration plants, the announced commercial plants, the DOE road map, and the rate of construction of grain ethanol plants. It assumed that a capacity of 1 billion gallons per year of cellulosic ethanol would be achievable by 2015 and that the capacity build beyond 2015 would
follow one of two scenarios. The first tracks the maximum capacity build experienced with grain ethanol (about a 25 percent yearly increase in capacity over a 6-year period); the second scenario is an aggressive capacity build rate that is approximately twice that achieved for grain ethanol. The two scenarios project 7–12 billion gallons of cellulosic ethanol per year (about 0.3–0.5 million barrels of gasoline equivalent per day) by 2020. Continued aggressive capacity build could conceivably achieve the Renewable Fuel Standard’s8 mandated capacity of 16 billion gallons of cellulosic ethanol per year by 2022, but this would be a stretch. Continued aggressive capacity build could yield 30 billion gallons of cellulosic ethanol per year by 2030 and up to 40 billion gallons per year of cellulosic ethanol by 2035. The latter would consume about 440 million dry tons of biomass annually and replace 1.7 million barrels per day of petroleum-based fuels.
Coal-to-Liquid Fuels with CCS
If commercial demonstrations of coal-to-liquids fuel production with CCS were begun immediately and CCS were proven viable and safe by 2015, commercial plants could be starting up before 2020. The subsequent growth rate could be about two to three plants per year. This scenario would reduce dependence on imported oil, but it would not reduce CO2 emissions from transportation. At a build-out rate of two plants (at 50,000 bbl/d of fuel) per year, 2 million bbl/d of liquid fuels would be produced from 390 tons of coal annually by 2035, at a cost of about $200 billion. At a build-out rate of three plants per year, 3 million bbl/d of liquid fuels would be produced from 580 million tons of coal each year. The latter case would replace approximately one-third of the current U.S. oil use in light-duty transportation and increase U.S. coal production by 50 percent. At a build-out rate of three plants starting up per year, five to six plants would be under construction at any one time.
Coal-and-Biomass-to-Liquid Fuels
The technology for co-fed biomass and coal plants is close to being developed, and several commercial plants without CCS have in fact started to co-feed bio-
mass. Although this will allow them to acquire some operational experience and reduce cost, gaining experience with CCS in particular is critical, as it will probably be required. Because coal and biomass plants are much smaller than coal-to-liquid fuel plants (at 10,000 bbl/d of fuel, a coal-and-biomass-to-liquid fuel plant size is one-fifth the size of a coal-to-liquid fuel plant), biomass feed rates are similar to those of cellulosic ethanol plants. Thus, penetration rates should in principle closely follow the cellulosic plant build out. But most likely the coal and biomass build out will be much slower than the aggressive rate of building cellulosic plants just presented because of more complex plant design and the need to site the plants near both biomass and coal production.
Thus, the committee assumed that penetration rates of the coal-and-biomass-to-liquid fuel plants will be slightly less than that of the cellulosic ethanol buildout case that follows the experience of grain ethanol (which has experienced a 25 percent average annual growth rate). At a 20 percent average annual growth rate until 2035, when 280 plants would be in place, 2.5 million bbl/d of gasoline equivalent would be produced. This would consume about 300 million dry tons of biomass (less than the projected biomass availability) and about 250 million tons of coal per year. The analysis shows that capacity growth rates would have to exceed historical rates considerably if 550 million dry tons per year of biomass were to be converted to liquid fuels in 2030.
Findings: Coal-and-Biomass-to-Liquid Fuels
If commercial demonstration of cellulosic-ethanol plants is successful and commercial deployment begins in 2015, and if it is assumed that capacity will grow by 50 percent each year, cellulosic ethanol with low CO2life-cycle emissions can replace up to 0.5 million barrels of gasoline equivalent per day by 2020 and 1.7 million barrels per day by 2035.
If commercial demonstration of coal-and-biomass-to-liquid fuel plants with carbon capture and storage is successful and the first commercial plants start up in 2020, and if it is assumed that capacity will grow by 20 percent each year, coal-and-biomass-to-liquid fuels with low CO2life-cycle emissions can replace up to 2.5 million barrels of gasoline equivalent per day by 2035.
If commercial demonstration of coal-to-liquid fuel plants with carbon capture and storage is successful and the first commercial plants start up in 2020, and if
it is assumed that capacity will grow by two to three plants each year, coal-to-liquid fuels with CO2life-cycle emissions similar to those of petroleum-based fuels can replace up to 3 million barrels of gasoline equivalent per day by 2035. That option would require an increase in U.S. coal production by 50 percent.
The deployment of alternative liquid transportation fuels aimed at diversifying the U.S. energy portfolio, improving energy security, and reducing environmental impacts by 2035 would require aggressive large-scale demonstration in the next few years and strategic planning to optimize the use of coal and biomass to produce fuels and to integrate them into the transportation system. Aggressive development and demonstration of cellulosic-biofuel and thermochemical-conversion technologies with CCS are necessary to advance these technologies and to address challenges identified in the commercial demonstration programs. Given the magnitude of U.S. liquid-fuel consumption (14 million barrels of crude oil per day in the transportation sector) and the scale of current petroleum imports (about 56 percent of the petroleum used in the United States is imported), a business-as-usual approach is insufficient to address the need to find alternative liquid transportation fuels, particularly because development and demonstration of technology, construction of plants, and implementation of infrastructure require 10–20 years per cycle. An assessment of the current government and industry programs would determine their adequacy to meet the commercialization timeline required to reduce U.S. oil use and CO2 emissions over the next decade.
Developing detailed scenarios of market penetration rates of biofuels, coal-to-liquid fuels, and associated biomass and coal supply options would help clarify hurdles and challenges to achieving substantial effects on U.S. oil use and CO2 emissions. Such analysis will provide policy makers and business leaders with the information needed to establish enduring policies and investment plans for accelerating the development and penetration of alternative-fuels technologies.
A potential optimal strategy for producing biofuels in the United States could be to locate thermochemical conversion plants that use coal and biomass as a combined feedstock in regions where biomass is abundant and locate biochemical-conversion plants in regions where biomass is less concentrated. Thermochemical plants require a larger capital investment per barrel of product than biochemical conversion plants require and thus benefit to a greater extent from economies of scale. This strategy could maximize the use of cellulosic biomass and minimize the costs of fuel products. An assessment of the spatial distribution of potential
U.S. biomass supply would allow determination of the optimal size of conversion plants for particular locations in relation to the road network and the costs and greenhouse gas effects of feedstock transport. The assessment could be conducted by the U.S. Department of Energy and the U.S. Department of Agriculture and the information could be combined with the logistics of coal delivery to such plants to develop an optimal strategy for using U.S. biomass and coal resources for producing sustainable biofuels.
ENVIRONMENTAL IMPACTS BEYOND GREENHOUSE GAS EMISSIONS
Biomass Supply
Although greenhouse gas emissions have been the central environmental focus regarding biomass production for alternative liquid fuels, other key effects must also be considered. On the one hand, lignocellulosic biomass feedstocks offer distinct advantages over food crop feedstocks with respect to water-use efficiency, nutrient and sediment loading in waterways, enhancement of soil fertility, emissions of criteria pollutants, and safeguarding habitat for wildlife and other species, especially those that provide biocontrol services for crop production. On the other hand, many of the traits of dedicated fuel crops have been shown to contribute to their invasiveness.
Biochemical Conversion
The biochemical conversion of cellulosic biomass into ethanol or other biofuels requires process water for cooling, heating, and mixing with reagents that are associated with hydrolysis and fermentation. The amount of water required is estimated at 2–6 gallons per gallon of ethanol produced; the lower levels would be approached if the plant’s design included the recycling of process water. The processing of cellulosics into ethanol also results, in principle, in a residual water stream that needs to undergo wastewater treatment. However, an efficient process will ferment most of the feedstock’s sugars into ethanol, leaving only low amounts of organic residuals.
Air emissions resulting from bioprocessing include CO2, water vapor, and possibly sulfur or nitrogen. Fermentation processes release CO2 as a result of
microbial metabolism. Water vapor is also released, particularly if the lignin coproduct is dried prior to being shipped from the plant for use as boiler fuel at an off-site power-generation facility. The sulfur and nitrogen content of the fermentation residues is typically low, unless chemicals are used in the pretreatment in the biomass materials. Such chemicals, however, can be recovered.
Thermochemical Conversion
Coal-to-liquid fuel plants can be configured to minimize their impacts on the environment, given that the clean-coal technologies that have been developed for the electric power industry can also be used in coal-to-liquid applications. Coal-to-liquid fuel plants need to produce clean synthesis gas from coal using gasification and gas cleaning technologies. As a result, emissions of criteria pollutants and toxics such as sulfur oxides, nitrogen oxides, particulates, and mercury will be low.
The sulfur compounds in the coal are converted into elemental sulfur, which can be sold as a byproduct. The ammonia in the synthesis gas can either be recovered and sold as a fertilizer or sent to wastewater treatment, where it is absorbed by bacteria. All of the mercury, arsenic, and other heavy metals in the syngas are adsorbed on activated charcoal. The coal’s mineral matter (ash), which is exposed to extremely high temperatures during gasification, becomes vitrified into slag. This slag is nonleachable and finds use in cement or concrete. Nitrogenoxide emissions from existing conversion technologies are only about 3 parts per million.
Water usage in thermochemical conversion plants depends primarily on the water-use philosophy implicit in the plant design. For the conversion of coal and combined coal and biomass to transportation fuels with all water streams recycled or reused, the major consumptive use of water would generally be for cooling, hydrogen, and solids handling. If water availability were not limited—say, because of ready access to rivers—conventional forced or natural draft cooling towers would be used. In arid areas, where water is indeed limited, air-cooling would be used to the maximum degree possible. Depending on the degree of air-cooling, water consumption could range from about 1 to 8 barrels of water per barrel of product. For coal-to-liquid fuel plants, additional environmental impacts will be associated with the mining of coal, as discussed in the reports Evolutionary and Revolutionary Technologies for Mining (NRC, 2002) and Coal Research and Development to Support National Energy Policy (NRC, 2007).
BARRIERS TO DEPLOYMENT
Successful development of an industry to supply alternative liquid transportation fuels faces some technological and sociological challenges. These challenges are not trivial, but they can be successfully overcome.
Challenge 1
-
Developing a systems approach through which farmers, biomass integrators, and those operating biofuel-conversion facilities can develop a well-organized and sustainable cellulosic-ethanol industry that will address multiple environmental concerns (for example, biofuel production; soil, water and air quality; carbon sequestration; wildlife habitat; rural development; and rural infrastructure) without creating unintended consequences through piecemeal development efforts.
-
Determining the full greenhouse gas life-cycle signatures of various biofuel crops.
-
Certifying the greenhouse gas benefits for different potential biofuel scenarios.
In other words, failure to link the critical environmental, economic, and social needs and address them as an integrated system could reduce the availability of biomass for conversion to levels significantly below the 550 million tons technically deployable in 2020.
Challenge 2
For the thermochemical conversion of coal, or of combined coal and biomass, to have any significant impact on reducing U.S. reliance on crude oil and on reducing CO2 emissions over the next 20–30 years, CCS will have to be shown to be safe as well as economically and politically viable. The technological viability of CO2 capture is already proven, although commercial-scale demonstration plants are now needed to quantify and improve costs and performance. Additional programs will be required to help resolve storage and regulatory issues associated with geologic CO2 storage approaching a scale of gigatonnes per year. In the analyses presented in this study, the viability of CCS was assumed to have been demonstrated by 2015 so that integrated coal-to-liquid fuel plants could start up by 2020. This assumption is ambitious and will require focused and aggressive government
action to make it happen. But uncertainties about the regulatory environment, especially those arising from concerns of the general public, have the potential to raise storage costs above those cited in this study. Meanwhile, ultimate requirements for selection, design, monitoring, carbon accounting procedures, liability, and associated regulatory frameworks have yet to be developed, creating the possibility of delay in initiating demonstration projects and, later, in licensing individual commercial projects. Large-scale demonstrations and establishment of procedures for operation and long-term monitoring of CCS have to be actively pursued in the next few years if thermochemical conversion of biomass and coal is to be ready for commercial deployment by 2020.
Challenge 3
Cellulosic ethanol is in the early stages of commercial development. A few commercial demonstration plants are expected to begin operations over the next several years, and most process improvements will likely come from evolutionary developments, knowledge gained through commercial experience, and increases in scale of operation. Incremental improvements of biochemical conversion technologies can be expected to reduce nonfeedstock process costs by up to 40 percent by 2030. It will take focused and sustained industry and government action to achieve those cost reductions, but some key technical challenges remain:
-
Developing more efficient pretreatment to free up cellulose and hemicellulose and to enable more efficient downstream technology conversion. Improved pretreatment is not likely to reduce product cost substantially because the pretreatment cost is small relative to other costs.
-
Creating better enzymes, not subject to end-product inhibition, for facilitating the conversion process.
-
Maximizing solids loading in the reactors.
-
Engineering organisms capable of fermenting the sugars in a toxic biomass hydrolysate and producing high concentrations of the final toxic product biofuel; improving microorganism tolerance to toxicity is a key issue.
Challenge 4
If ethanol is to be used in large quantities in LDVs, an expanded ethanol transportation and distribution infrastructure will be required. Because ethanol cannot be
transported in pipelines used for petroleum transport, as discussed earlier in this chapter, it is currently transported by rail or barge. But if cellulosic biomass were dedicated to thermochemical conversion by FT or MTG, the resultant fuels would be chemically equivalent to conventional gasoline and diesel. They could thus be transported via existing pipelines, and the infrastructural challenge associated with ethanol would be minimized.
Challenge 5
The committee’s analyses provide a snapshot of the potential costs of liquid fuels—from biomass by biochemical or thermochemical conversion, and from combined biomass and coal by thermochemical conversion. But the costs of fuels are dynamic, fluctuating as a result of externalities such as the costs of feedstocks, labor, and construction; the economic environment; and government policies. With the wide variation in most commodity prices, especially for oil, investors will need to have confidence that policies—including carbon caps, carbon price, mandated greenhouse gas reductions, or tariffs on imported oil—will ensure that alternative liquid transportation fuels can compete with fuels refined from crude oil. The price of carbon emissions, or the existence of fuel standards that require specified reductions in fuels’ life-cycle greenhouse gas emissions, will affect the relative economic choices.
TECHNOLOGIES READY FOR DEPLOYMENT BEYOND 2020
Algal Biodiesel
Biodiesel refers to diesel fuel made by transesterifying oil from biological sources. A potential biodiesel feedstock that is not a commodity crop is algae, such as algal glycerolipids, which can be transesterified to produce fatty acid methyl (or ethyl) esters. Cellular lipids can also be converted via a catalytic hydrocracking process into a mixture of alkanes suitable for use as a jet fuel or gasoline ingredient; certain algae, such as Botryococcus, produce long-chain hydrocarbons that are potentially usable as a fuel after hydrocracking to reduce the chain length of the molecules. In most production schemes, the algal oil is extracted from the harvested algae.
Recent reevaluation suggests that current costs are well over $4/gal and that much more progress is needed if this technology is to have an impact in the
foreseeable future (Pacheco, 2006). Many of the impediments are engineering challenges associated with how and where to grow the algae to achieve needed productivity. Because of the metabolic burden associated with the biosynthesis of high-energy lipids, production strains that accumulate high levels of oil tend to grow and reproduce more slowly than strains that do not. As a consequence, open cultures are subject to contamination by undesirable species unless the production strain is able to grow in specialized conditions that restrict the growth of those other species (for example, high-alkalinity environments).
Alternatively, production strains selected for high growth rates and high biomass yields without regard for oil content can often compete satisfactorily with contaminating strains, but the chemical composition of the algae would be better suited for anaerobic digestion than liquid fuel production. The use of closed photobioreactors can significantly lower the risk of culture contamination, although the capital costs of such systems are high.
Algal biodiesel has properties similar to those of biodiesel made from vegetable oil, except that algal biodiesel has better cold-weather properties. The energy content per gallon of biodiesel is about 93 percent that of petroleum-based diesel fuel, and it has a cetane number between 50 and 60, with 55 being typical. Also, it is somewhat more viscous. Biodiesel can be distributed by existing infrastructure and used in unmodified diesel-engine vehicles.
Biobutanol
Butanol is a four-carbon-atom alcohol—as opposed to ethanol, which is a two-carbon-atom alcohol. Biobutanol, the name given to butanol that has been made from biomass, is another potential entrant into the automotive biofuel market, and several technologies for producing it are in the R&D stage. The one receiving the most attention is the acetone-butanol-ethanol process. As currently envisioned, it involves the biochemical conversion of sugars or starches (from sugar beets, sugar cane, corn, wheat, or cassava) into biobutanol using a genetically engineered microorganism, Clostridium beijernickii BA101. The midterm goal is to start with cellulose, but that goal awaits the demonstration of economic success in converting cellulose and hemicelluloses into sugars.
Biobutanol has many attractive features as a fuel. Its energy content is close to that of gasoline, it has a low vapor pressure, it is not sensitive to water, it is less hazardous to handle and less flammable than gasoline is, and it has a slightly higher octane than gasoline has. Thus it is likely to be compatible with the exist-
ing distribution system and can substitute for gasoline directly. Its main drawback to date is the high cost of production. To reduce that cost and help initiate market entry, DuPont and BP have joined forces to retrofit an existing bioethanol plant to produce biobutanol using DuPont-modified biotechnology (Chase, 2006). Moreover, an improved next-generation bioengineered organism is projected to be available within the next few years.
Hydrocarbon Fuels from Biomass
The growing biofuel industry is based on well-established technology for producing ethanol via fermentation and distillation. This technology is energy-intensive, however, with approximately 60 percent of the product’s fuel value consumed in these two processing steps (Katzen et al., 1981; Shapouri et al., 2002). In addition, fuel ethanol is expensive to distribute, as it cannot be added to gasoline prior to pipeline transport. At an estimated 13–18¢/gal, the cost of ethanol-fuel transportation is as much as six times that of transporting traditional petroleum-based fuels (GAO, 2007). Therefore approaches to developing hydrocarbon fuels produced directly from biomass, and that are analogous to fuels produced from petroleum, are being explored (Huber et al., 2006). Other proposed approaches include a hybrid hydrogen-carbon process for producing liquid hydrocarbons (Agrawal et al., 2007) and a catalytic strategy to produce dimethyl furan from carbohydrates (Román-Leshkov et al., 2007).
Gasoline Blend Stock
One approach produces straight-chain hydrocarbons, mostly hexane, via aqueous-phase hydrogenation of biomass-derived sugars followed by dehydration. The combination of reactions is exothermic and in theory could consume no net hydrogen. Because the reactants are dissolved in water, the hydrocarbons produced form a separate phase, and distillation is not required. This process, compared with the fermentation and distillation steps used in ethanol production, has the potential for higher energy efficiency and shorter residence times, but considerable development is required to confirm that this potential can be realized in a commercially viable process (Huber et al., 2005).
The product, consisting of linear hydrocarbons, can be isomerized in a conventional refining process to form branched hydrocarbons with higher octane, which are therefore more suitable for gasoline blending. Also, conventional refinery alkylation technology can be used to process the low-boiling straight-chain
hydrocarbons to increase octane and boiling point to the extent needed for gasoline blending. Of course, if this production of hydrocarbons from biomass were widely commercialized, refining capability for isomerization and alkylation would likely have to be increased.
Diesel Fuel Components
Another approach to bio-hydrocarbon fuels being studied produces high-cetane diesel fuel material (Huber et al., 2005). In this process, sugars are first dehydrated and then hydrogenated to form cyclic oxygenated molecules that can undergo aldol condensation (self-addition) to form larger oxygenated molecules that remain soluble in water. The condensation products are then themselves hydrogenated and dehydrated to form mostly straight-chain hydrocarbons ranging from 7 to 15 carbon atoms per molecule. The final hydrogenation and dehydration reactions in this sequence are carried out in a four-phase reactor, with the phases being water with dissolved oxygenated hydrocarbon reactants, gaseous hydrogen, a solid catalyst, and hydrocarbons for reducing coke formation on the catalyst. The process can be modified to produce oxygenated compounds in the diesel-fuel boiling range that are soluble in the diesel fuel.
Status
Although the two processes described in this section have been shown to be feasible in the laboratory with pure feedstocks, much R&D remains before commercial applications can be undertaken. The concepts need to be tested using biomass-derived feedstocks with reactors that can be scaled for commercial operation. Based on work thus far, the keys to success in these processes appear to be the achievement of sufficient yield of the hydrocarbon product, development of highactivity catalysts with long-term stability, and minimization of coking reactions.
Bacteria- and Yeast-Based Direct Routes to Biofuels
With the rapid growth of synthetic biology and the enhanced ability to engineer organisms’ metabolic pathways so as to produce specific chemical products, new approaches to renewable fuel production are emerging (Savage, 2007). They include using well-established recombinant DNA techniques to insert existing genes into microorganisms to make specific fuel precursors or even to directly synthesize hydrocarbon fuel components. Another approach involves redesigning
genes, with computer assistance, to perform specific reactions and then synthesizing the desired genes for insertion into microbes. Yeasts can also be engineered to produce larger amounts of lipids, which with additional metabolic engineering can be converted to useful products—potentially, fuels. Using these techniques, it is possible that properly designed hydrocarbon products in either the diesel or the gasoline range would not require significant refining and could fit directly into the existing infrastructure.
Although none of these processes is approaching commercial production at this point, the level of activity and the current rate of progress could change that status in the not-too-distant future. Several companies are employing synthetic biology to create bacteria that produce increased amounts of fatty acids or other lipids that are then converted to hydrocarbons of virtually any length or structure desired. Moreover, the hydrocarbons phase-separate from the growth medium, thereby markedly reducing separation costs. The feedstock for the bacteria is renewable sugars, which can be obtained from sugar cane, grain, or cellulosic biomass (LS9, 2008). It is difficult to project the future of these and other nascent developments, but they deserve careful watching.
Technologies to Improve Biochemical Conversion
Significant advances are being made in the areas of genomics, molecular breeding, synthetic biology, and metabolic and bioprocess engineering that will likely enable innovation and advancement in the development of alternative transportation fuels. These and related technologies have the potential to greatly accelerate the creation of dedicated or dual-purpose energy crops as well as of microorganisms useful both for feedstock-conversion processes and biofuel production.
Genomics
The sequencing of full genomes continues to become faster and less costly, thus allowing energy crops such as tree species, perennial grasses, and nonedible oil seeds (castor and jatropha, for example) to be sequenced. The resulting data are extremely important for improving overall yields, for enabling improved nutrient and water utilization, and for understanding and manipulating biochemical pathways to enhance the production of desired products.
The sequencing data also have other uses. They can be used to target specific genes for downregulation by classical methods such as antisense and RNA interference, but also via complete inactivation using new and evolving procedures for
homologous recombination-based gene disruption. In addition, rapid sequencing of breeding populations of energy crops can enable marker-assisted selection to accelerate the breeding of energy crops in ways previously not possible. And the rapid and inexpensive sequencing of fermentative and photosynthetic microorganisms in particular is redefining and shortening the timelines associated with strain-development programs for converting sugars, lignocellulosic materials, and CO2 into alternative liquid fuels.
Strains generated through classical mutagenesis that have improved biocatalytic properties can now be analyzed at the molecular level to determine the specific genetic changes that result in the improved phenotype, allowing those changes to be implemented in other strains. In addition, “metagenome” sequence data, obtained by randomly sequencing DNA isolated from environmental samples, are providing vast numbers of new gene sequences that can be used to genetically engineer improved crops and microorganisms.
Synthetic Biology
Improved technologies for synthesizing megabase DNA molecules are being developed that will allow the introduction of entirely new biochemical pathways into energy crops and biofuel-producing microorganisms. These technologies could have a great impact on scientists’ ability to generate plants and microorganisms with desired traits. For example, it is becoming conceivable that large portions of microorganisms’ chromosomes, or even their complete chromosomes, can be replaced in ways that focus most of the cells’ biochemical machinery on producing “next-generation” biofuel molecules boasting both cost and product advantages. Significant hurdles, however, could occur in maintaining the purity of such cultures and in dealing with mutants that gain competitive advantage by producing less of the desired chemicals.
Metabolic and Bioprocess Engineering
In addition to genetic manipulation, new bioengineering technologies are coming on line that will lower the cost of biofuel formation and recovery. While synthetic biology can now provide synthetic DNA for transferring heterologous genes into suitable host cells, metabolic engineering is the enabling technology for constructing functional and even optimal pathways for microbial fuel biosynthesis. This field has matured in only a few years and has an impressive record of accomplishments, many already in industrial practice (for example, biopolymers, alcohols,
1,3 propane-diol, oils, and hydrocarbons). Microbial strains have been developed that secrete hydrophobic fuels, similar to constituents of diesel and gasoline, into the culture medium. These fuels can be separated from the aqueous phase without distillation, thereby reducing the energy inputs and facilitating continuous production.
By taking a systems view, metabolic engineering has developed tools for overall biosystems optimization. They are now facilitating the construction of biosynthetic pathways and eliciting novel multigenic cellular properties of critical importance to biofuels production, such as tolerance to fuel toxicity. In the bioprocessing area, the successful development of membrane-based alcohol separations would greatly reduce energy costs from those of the typically used distillation process. Gas stripping, liquid-liquid extractions of secreted fuel molecules, and new adsorbent materials are also being developed that will allow continuous production modes for fermentation-based products. The photosynthetic production of biofuels—the development of low-cost photobioreactors and associated recovery systems for algal biofuel production—is another area of substantial interest that could have major benefits for overall-process economics.
OTHER TRANSPORTATION-FUEL OPTIONS READY FOR DEPLOYMENT BY 2020 AND 2035
So far in this chapter, the committe has focused strictly on certain liquid fuels and considered only biomass and coal as feedstocks, but in this section it explores the advantages and disadvantages of other known transportation-fuel options. The first to be considered is compressed natural gas (CNG). Thereafter, other liquid fuels that can be produced from syngas, including gas-to-liquid (GTL) diesel, dimethyl ether, and methanol, are described. Finally, the technology implications of using hydrogen in fuel-cell-powered vehicles for transportation are discussed.
The earlier sections discussed how coal, biomass, or combined coal-and-biomass gasification produces syngas, which can be converted to diesel and gasoline or to methanol, which can be converted to gasoline. Syngas can also be produced by reforming natural gas. Only if large supplies of inexpensive domestic natural gas were available—for example, from natural-gas hydrates—would the United States be likely to use natural gas as a feedstock for transportation-fuel production. Methanol can be produced from coal synthesis gas and used as a transportation fuel, but the committee judges that the best approach is to convert
synthesis gas to methanol and use methanol-to-gasoline technology to produce gasoline, which fits directly into the existing U.S. fuel-delivery infrastructure. Hydrogen has the potential to reduce U.S. greenhouse gas emissions and oil use, as discussed in two National Research Council reports, Transitions to Alternative Transportation Technologies—A Focus on Hydrogen (NRC, 2008) and The Hydrogen Economy: Opportunities, Costs, Barriers, and R&D Needs (NRC, 2004). It is a long-term option, nonetheless.
Compressed Natural Gas
In 2007, the main uses for natural gas in the United States were electric power generation (30 percent) and industrial (29 percent), residential (20 percent), and commercial (13 percent) use. Only 0.1 percent was used in vehicles (EIA, 2008a). But natural gas is the cleanest and most efficient hydrocarbon fuel—it is environmentally superior to coal for electric power generation—and for similar reasons it could be a sound choice for transportation fuels.
Natural gas consumption levels in 2008 were satisfied mainly by domestic production (Chapter 7 on fossil fuels includes estimates of U.S. natural gas resources). However, a switch to natural gas for a large segment of U.S. transportation use would most likely trigger its increased importation. Even if natural gas were to be used for transportation rather than electricity generation, there is a potential to supply only about one-fifth to one-fourth of U.S. transportation needs from North American natural gas reserves, and only with investment in the distribution infrastructure. In any case, the technologies for producing transportation fuels from natural gas will be ready for deployment by 2020.
In 2008, there were more than 150,000 natural gas vehicles (NGVs) and 1,500 NGV fueling stations in the United States. Natural gas is sold in gasoline-equivalent gallons; each gasoline-equivalent gallon of natural gas has the same energy content (124,800 Btu) as a gallon of gasoline. NGVs are more expensive to purchase than are hybrid or gasoline vehicles. The Civic GX NGV has a manufacturer’s suggested retail price of $24,590, compared to $22,600 for the company’s hybrid sedan and $15,010 for its regular sedan (Rock, 2008).
Of all the fossil fuels, natural gas produces the least amount of CO2 when burned because it contains the lowest carbon-to-hydrogen ratio. It also releases lesser amounts of criteria air pollutants. NGVs emit unburned methane, which has a higher greenhouse forcing potential than does CO2, but this might be offset by the substantial reduction in CO2 emissions. When compared with gasoline-
powered vehicles, dedicated NGVs have lower exhaust emissions of carbon monoxide, nonmethane organic gases, nitrogen oxides, and carbon dioxide.
Natural-gas engines are more fuel efficient than gasoline engines are, and CNG in the past has had a low price (about 80 percent that of gasoline on a gasoline-equivalent gallon basis). Also, transport and distribution are relatively inexpensive because infrastructures already exist for delivery both to households and to industries (Yborra, 2006). Despite these advantages, however, NGVs still face many hurdles. The two main hurdles are insufficient numbers of refueling stations and inconvenient onboard CNG tanks, which take up most of the trunk space.
An NGV market can be analyzed using the vehicle-to-refueling-station index, or VRI, defined as the ratio of number of NGVs (in thousands) to the number of natural gas refueling stations. According to Yeh (2007), “Using techniques including consumer preference surveys and travel time/distance simulations, it has been found out that the sustainable growth of alternative fuel vehicles (AFVs) during the transition from initial market development to a mature market requires [that] the number of alternative-fuel refueling stations be a minimum of 10 to 20 percent of the number available for conventional gasoline stations.” A thriving NGV market tends to have an index of 1; this gives rise to a problem: new stations are not being opened because of the lack of users, but few people use NGVs because of the lack of refueling stations.
A key disadvantage of NGVs is their limited range. While the average gasoline or diesel vehicle can go 400 miles on a tank full of fuel, the range of an NGV is only 100–150 miles, depending on the natural gas compression. Given this fact, together with the shortage of refueling stations, the current prevalent choice is to use a bi-fuel NGV that can run both on natural gas and on gasoline. The problems associated with bi-fuel engines include slightly less acceleration and about 10 percent power loss compared with a dedicated NGV, given that bi-fuel engines are not optimized to work on natural gas. Further, warranties on new gasoline vehicles are strongly reduced if they are converted into bi-fuel NGVs. But perhaps the most important barrier to NGVs could be the public perception that compressed natural gas is a dangerous “explosive” to have on board one’s vehicle and that self-service refueling with a high-pressure gas may be too risky to offer to the general public.
About 22 percent of all new transit-bus orders are for natural-gas-powered vehicles. Therefore buses, together with corporate-fleet cars that stay in town,
have been the main markets for NGVs. Both of these uses have occurred mainly in response to the Clean-Fuel Fleet Program set up by the U.S. Environmental Protection Agency to reduce air pollution.
Synthetic Diesel Fuel
The GTL process for producing synthetic diesel fuel is similar to the indirect liquefaction of coal. Instead of syngas production via the gasification of coal, however, syngas is produced by the steam reforming of natural gas. The synthesis gas can then be converted to an olefinic distillate, called synthol light oil, and wax using a catalytic modification of the FT process discussed earlier. The olefinic distillate and wax are hydrocracked to produce high-quality diesel, as well as naphtha and other streams that form the basis of specialty products such as synthetic lubricants.
Although it is technically difficult, the naphtha can also be upgraded to gasoline. Naphtha is an ideal feedstock for manufacture of chemical building blocks (for example, ethylene), and GTL diesel provides high-quality automotive fuel or blending stock (Johnson-Matthey, 2006) like coal-to-liquids technology. GTL is an option for producing diesel from “stranded” natural gas, such as that which exists in the Middle East and Russia. However, a couple of GTL plants would produce enough naphtha to swamp the chemical market for this material.
Hypothetically, there are several advantages to converting natural gas into GTL diesel rather than into CNG. All diesel vehicles can run on GTL diesel, which gives gas producers access to new market opportunities. Vehicle driving range for diesel is much higher than for compressed natural gas because of diesel’s higher energy density. Engine efficiency and performance are not compromised by the adjustment to GTL diesel fuel. GTL diesel can be shipped in normal tankers and unloaded at ordinary ports (The Economist, 2006).
Currently, there are several commercial GTL plants. Sasol in Nigeria and Qatar, as well as Shell in Malaysia and Qatar, produce GTL diesel fuel; a number of companies, including World GTL and Conoco Phillips, have plans to build GTL plants in the next several years. Because the economics of GTL plants are very closely tied to the natural gas price, viability depends in large part on inexpensive stranded gas. GTL diesel is viewed mainly as an alternative to liquified natural gas for monetizing large natural gas accumulations such as the one in Qatar. The high cost to produce GTL diesel makes its development in the United States unlikely unless an abundant and inexpensive source of natural gas is found (for example, natural gas hydrates).
Methanol
Methanol, an alcohol, is a liquid fuel that can be used in internal-combustion engines to power vehicles. During the late 1980s, it was seen as a route to diversifying the fuels for the U.S. transportation system; natural gas from remote fields around the world would be converted into methanol and transported to the United States. This strategy was seen by energy planners as a way to convert what was, at that time, cheap remote natural gas (on the order of $1 per thousand cubic feet) into a marketable product. Currently, however, while methanol is produced primarily from natural gas, it is used principally as a commodity chemical.
Methanol has a higher octane rating than gasoline does and is therefore a suitable neat fuel for internal-combustion engines (for example, in racing cars). In practical terms, the penetration of methanol into a transportation system for LDVs that are fueled primarily by gasoline would require flexible-fuel vehicles that could run on a mixture of gasoline and methanol. Further, the use of a mixture of 85 percent methanol (M85) and gasoline would avoid the cold-start problem caused by methanol’s low volatility. However, methanol has about half the energy density of gasoline, which affects the driving range that a vehicle can achieve on a full tank of the fuel.
Other drawbacks of methanol include its corrosive, hydrophilic, and toxic nature and its harmfulness to human health in particular if ingested, absorbed through the skin, or inhaled. Methanol could thus potentially create environmental, safety, health, and liability issues for fuel station owners. In addition, introducing a new fuel such as methanol on a large scale would require the construction of a new distribution system and the use of flexible-fuel vehicles that could run on a mixture of gasoline and methanol. One means of avoiding these infrastructural barriers would be to convert the methanol to gasoline using the MTG process.
Dimethyl Ether
Dimethyl ether (DME) is a liquid fuel with properties similar to that of liquefied petroleum gas (LPG). It produces lower CO and CO2 emissions when burned, compared to gasoline and diesel, because of its modest carbon-to-hydrogen ratio. Because DME contains oxygen, it also requires a lower air-to-fuel ratio than do gasoline and diesel. DME has a thermal efficiency higher than that of diesel fuel (Kim et al., 2008), which could enable a higher-efficiency engine design. The presence of oxygen in the structure of DME also minimizes soot formation (Arcoumanis et al., 2008). Other exhaust emissions, such as unburned hydrocar-
bons, nitrogen oxides, and particulate matter, are also reduced. In fact, because DME meets and surpasses the California Air Resources Board emissions standards for automotive fuel, it is considered an ultraclean fuel.
At present, the preferred route and more cost-effective method for producing DME are through the dehydrogenation of methanol from synthesis gas, which is a mixture of CO and H2. The basic steps for producing DME are as follows:
-
Syngas production either by steam reforming of natural gas or by the partial oxidation of coal, oil residue, or biomass.
-
Methanol synthesis using copper-based or zinc oxide catalysts.
-
Methanol dehydrogenation to DME using a zeolite-based catalyst.
The produced DME fuel is not suitable for spark-ignition engines because of its high cetane number, but it can run a diesel engine with little modification. DME has properties similar to those of GTL diesel, including good cold-flow properties, low sulfate content, and low combustion noise (Yao et al., 2006; Arcoumanis et al., 2008; Kim et al., 2008).
The principal advantage of using DME as an automotive fuel is that it is clean burning and easy to handle and store. But as with other potential alternative fuels, the primary challenge facing the use of DME is the lack of an infrastructure for distribution. Other disadvantages include low viscosity, poor lubricity, a propensity to swell rubber and cause leaks, and lower heating value compared with conventional diesel.
Hydrogen
Hydrogen, like electricity, is an energy carrier that can be generated from a wide variety of sources, including nuclear energy, renewable energy, and fossil fuels. Hydrogen also can be made from water via the process of electrolysis, although this appears to be more expensive than reforming natural gas. Used in vehicles, both hydrogen and electricity make efficient use of energy compared with liquid-fuel options on a well-to-wheel basis. As generally envisioned, hydrogen would generate electricity in a fuel cell, and the vehicle would be powered by an electric motor.9 Developments in battery technology that might make plug-in hybrid-
electric and all-electric vehicles feasible will be discussed in several forthcoming National Research Council reports.
Hydrogen fuel-cell vehicle (HFCV) technology has progressed rapidly over the last several years, and large numbers of such vehicles could be introduced by 2015. Current HFCVs are very expensive because they are largely hand built. For example, in 2008, Honda released a small number of HFCVs named FCX Clarity which cost several hundred thousands of dollars to produce (Fackler, 2008). However, technological improvements and economies of scale brought about by mass production should greatly reduce costs.
This section provides a synopsis of the National Research Council report Transitions to Alternative Transportation Technologies—A Focus on Hydrogen (NRC, 2008), which concluded that the maximum practical number of HFCVs that could be operating in 2020 would be about 2 million, among 280 million LDVs in the United States. By about 2023, as costs of the vehicles and hydrogen drop, HFCVs could become competitive on a life-cycle basis. Their number could grow rapidly thereafter to about 25 million by 2030, and by 2050 they could account for more than 80 percent of new vehicles entering the U.S. LDV market. Those numbers are not predictions but rather a scenario-based estimate of the maximum penetration rate assuming that technical goals are met, that consumers readily accept HFCVs, and that policy instruments are in place to drive the introduction of hydrogen fuel and HFCVs through the market transition period.
The scenario would require that automobile manufacturers increase production of HFCVs even while they cost much more than conventional vehicles do and that investments be made to build and operate hydrogen fueling stations even while the market for hydrogen is very small. Substantial government actions and assistance would be needed to support such a transition to HFCVs by 2020 even with continued technical progress in fuel-cell and hydrogen-production technologies.
A large per-vehicle subsidy would be needed in the early years of the transition, but the number of vehicles per year would be low (Box 5.1) (NRC, 2008). Subsidies per vehicle would decline with fuel-cell costs, which are expected to drop rapidly with improved technology and economies of scale. By about 2025, an HFCV would cost only slightly more than an equivalent gasoline vehicle. Annual expenditures to support the commercial introduction of HFCVs would
|
BOX 5.1 Projected Costs of Implementing Hydrogen Fuel-Cell Vehicles According to a scenario developed in NRC (2008), By 2023 (break-even year):
By 2050:
|
increase from about $3 billion in 2015 to $8 billion in 2023, at which point more than 1 million HFCVs could be joining the U.S. fleet annually. The cost of hydrogen also would drop rapidly, and because the HFCV would be more efficient it would cost less per mile to drive than would a gasoline vehicle in about 2020. Combining vehicle and driving costs suggests that the HFCV would have lower life-cycle costs starting in about 2023. After that, there would be a net payoff to the country, which cumulatively would balance the prior subsidies by about 2028.
Substantial and sustained R&D programs will be required to reduce the costs and improve the durability of fuel cells, develop new onboard hydrogen-storage technologies, and reduce hydrogen production costs. Needed R&D investments are shown in Box 5.1. These programs would have to continue after 2023 to reduce costs and to further improve performance, but the committee did not estimate the necessary funding.
The 2008 National Research Council study determined the consequent
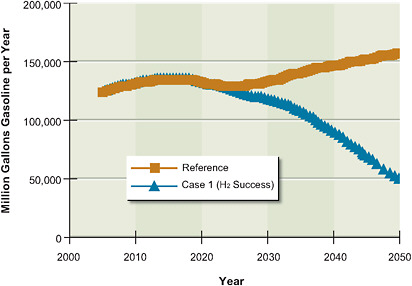
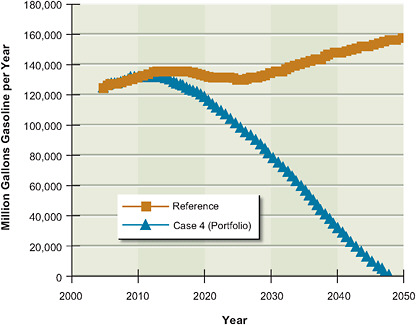
reductions in U.S. oil consumption and greenhouse gas emissions that could be expected in this scenario. HFCVs can yield large and sustained reductions in U.S. oil consumption and greenhouse gas emissions, but several decades will be needed to realize those potential long-term benefits. Figure 5.9 (on facing page) compares the oil consumption that would be required in this scenario with a reference case based on Energy Information Administration high oil-price projections, which include the recent increases in corporate average fuel economy standards. By 2050, HFCVs could reduce oil consumption by two-thirds. Greenhouse gas emissions would follow a similar trajectory if hydrogen produced from coal in large central stations were accompanied by carbon separation and sequestration.
The study then compared those reductions with the potential impact of alternative vehicle technologies (including conventional hybrid-electric vehicles) and biofuels oil consumption and greenhouse gas emissions. Over the next two decades, those approaches could deliver much greater reductions in U.S. oil use and greenhouse gas emissions than could HFCVs, but hydrogen offers greater longer-term potential. Thus, the greatest benefits will come from a portfolio of research and development in technologies that would allow the United States to nearly eliminate oil use in LDVs by 2050 (see Figure 5.10 on facing page). Achieving that goal would require substantial new energy-security and environmental-policy actions in addition to technological developments. Broad policies aimed at reducing oil use and greenhouse gas emissions will be useful, but they are unlikely to be adequate to facilitate the rapid introduction of HFCVs.
REFERENCES
Agrawal, R., N.R. Singh, F.H. Ribeiro, and W.N. Delgass. 2007. Sustainable fuel for the transportation sector. Proceedings of the National Academy of Sciences USA 104: 4828-4833.
Arcoumanis, C., C. Bae, R. Crookes, and E. Kinoshita. 2008. The potential of di-methyl ether (DME) as an alternative fuel for compression-ignition engines: A review. Fuel 87:1014-1030.
Chase, R. 2006. DuPont, BP join to make butanol: They say it outperforms ethanol as a fuel additive. USA Today, June 26.
DOE (U.S. Department of Energy). 2007. DOE selects six cellulosic ethanol plants for up to $385 million in federal funding. Available at http://www.energy.gov/print/4827.htm. Accessed October 16, 2008.
DOE/EERE (U.S. Department of Energy/Office of Energy Efficiency and Renewable Energy). 2007. Biomass Program 2007 Accomplishments Report. Available at www1.eere.energy.gov/biomass/pdfs/program_accomplishments_report.pdf. Accessed February 10, 2009.
Economist, The. 2006. Arabian alchemy. Vol. 379, Issue 8480, 00130613, June 3.
EIA (Energy Information Administration). 2008a. Natural gas consumption by end use. Available at http://tonto.eia.doe.gov/dnav/ng/ng_cons_sum_dcu_nus_m.htm. Accessed December 4, 2008.
EIA. 2008b. What are biofuels and how much do we use? Available at http://tonto.eia.doe.gov/energy_in_brief/biofuels_use.cfm. Accessed April 7, 2009.
EIA. 2009. Coal resources, current and back issues. Available at www.eia.doe.gov/cneaf/coal/reserves/reserves.html#_ftp/. Accessed July 30, 2009.
Fackler, M. 2008. Latest Honda runs on hydrogen, not petroleum. New York Times, June 17, 2008. Available at www.nytimes.com/2008/06/17/business/worldbusiness/17fuelcell.html?_r=1&oref=slogin. Accessed April 7, 2009.
Fargione, J., J. Hill, D. Tilman, S. Polasky, and P. Hawthorne. 2008. Land clearing and the biofuel carbon debt. Science 319:1235-1238.
Farrell, A., R. Plevin, B. Turner, A. Jones, M. O’Hare, and D. Kammen. 2006. Ethanol can contribute to energy and environmental goals. Science 311:506-508.
GAO (U.S. Government Accountability Office). 2007. Biofuels: DOE Lacks a Strategic Approach to Coordinate Increasing Production with Infrastructure Development and Vehicle Needs. Washington, D.C.: GAO.
Heggenstaller, A.H., R.P. Anex, M. Liebman, D.N. Sundberg, and L.R. Gibson. 2008. Productivity and nutrient dynamics in bioenergy double-cropping systems. Agronomy Journal 100:1740-1748.
Hill, J., E. Nelson, D. Tilman, S. Polasky, and D. Tiffany. 2006. Environmental, economic, and energetic costs and benefits of biodiesel and ethanol biofuels. Proceedings of the National Academy of Sciences USA 103:11206-11210.
Huber, G. W., J.N. Chheda, C.J . Barrett, and J.A. Dumesic. 2005. Production of liquid alkanes by aqueous-phase processing of biomass-derived carbohydrates. Science 308:1446-1450.
Huber, G. W., S. Ibora, and A. Corma. 2006. Synthesis of transportation fuels from biomass: Chemistry, catalysts, and engineering. Chemical Review 106:4044-4098.
Jensen, T.H. 2008. Race for key biofuel breakthrough intensifies. Reuters, June 2, 2008. Available at www.reuters.com/article/reutersEdge/idUSL0248503420080602. Accessed April 7, 2009.
Johnson-Matthey. 2006. Reducing emissions through gas to liquids technology. Available at http://ect.jmcatalysts.com/pdfs/Reducingemissionart p2-3.pdf. Accessed October 20, 2008.
Katzen, R., W.R. Ackley, Jr., G.D. Moon, J.R. Messick, B.F. Brush, and K.F. Kaupisch. 1981. Low-energy distillation systems. In Fuels from Biomass and Wastes, D.L. Klass and G.H. Emert, eds. Ann Arbor, Mich.: Ann Arbor Science Publishers.
Kim, M.Y., S.H. Yoon, B.W. Ryu, and C.S. Lee. 2008. Combustion and emission characteristics of DME as an alternative fuel for compression ignition engines with a high pressure injection system. Fuel 87:2779-2786.
Kreutz, T.G., E.D. Larson, G. Liu, and R.H. Williams. 2008. Fischer-Tropsch fuels from coal and biomass. In 25th Annual International Pittsburgh Coal Conference, Pittsburgh, Pa.
Larson, E.D., G. Fiorese, G. Liu, R.H. Williams, T.G. Kreutz, and S. Consonni. 2008. Coproduction of synthetic fuels and electricity from coal + biomass with zero carbon emissions: An Illinois case study. Energy Procedia 1:4371-4378.
LS9. 2008. Renewable Petroleum Technology. Available at www.ls9.com/technology/. Accessed May 1, 2008.
NAS-NAE-NRC (National Academy of Sciences-National Academy of Engineering-National Research Council). 2009. Liquid Transportation Fuels from Coal and Biomass: Technological Status, Costs, and Environmental Impacts. Washington, D.C.: The National Academies Press.
NRC (National Research Council). 2002. Evolutionary and Revolutionary Technologies for Mining. Washington, D.C.: The National Academies Press.
NRC. 2004. The Hydrogen Economy: Opportunities, Costs, Barriers, and R&D Needs. Washington, D.C.: The National Academies Press.
NRC. 2007. Coal Research and Development to Support National Energy Policy. Washington, D.C.: The National Academies Press.
NRC. 2008. Transitions to Alternative Transportation Technologies—A Focus on Hydrogen. Washington, D.C.: The National Academies Press.
Pacheco, M. 2006. Potential of biofuels to meet commercial and military needs. Presentation to the NRC Committee on Assessment of Resource Needs for Fuel Cell and Hydrogen Technologies.
Rock, B. 2008. An overview of 2007 American 2007 natural gas vehicles. Available at www.helium.com/items/451632-an-overview-of-2007-American-2007-natural-gas-vehicles. Accessed September 2, 2008.
Román-Leshkov, Y., C.J. Barrett, Z.Y. Liu, and J.A. Dumesic. 2007. Production of dimethylfuran for liquid fuels from biomass-derived carbohydrates. Nature 447:982-985.
Savage, N. 2007. Better biofuels. Technology Review 110:1.
Shapouri, H., J.A. Duffield, and M. Wang. 2002. The Energy Balance of Corn Ethanol: An Update. Agricultural Economic Report No. 814. U.S. Department of Agriculture, Office of the Chief Economist, Office of Energy Policy and New Uses.
Yao, M., Z. Chen, Z. Zheng, B. Zhang, and Y. Xing. 2006. Study on the controlling strategies of homogeneous charge compression ignition combustion with fuel of dimethyl ether and methanol. Fuel 85:2046-2056.
Yborra, S. 2006. Taking a second look at the natural gas vehicle. American Gas (Aug./Sept.):32-36.
Yeh, S. 2007. An empirical analysis on the adoption of alternative fuel vehicles: The case of natural gas vehicles. Energy Policy 35:5865-5875.


