
2
Key Findings
This chapter presents eight key findings from the AEF Committee’s detailed analysis of existing and new energy-supply and end-use technologies presented in Part 2 of this report. These findings identify options for the accelerated deployment of these technologies during the next two to three decades, and they also identify needs for supporting research, development, and demonstration. Pursuing such options would, in the committee’s judgment, hasten the transformation of the U.S. energy system, as described in Chapter 1.
By “accelerated,” the committee means deployment of technologies at a rate that would exceed the “reference scenario” deployment pace (Box 2.1) but at a less dramatic rate than an all-out or “crash” effort, which could require disruptive economic and lifestyle changes that would be challenging to initiate and sustain. By contrast, accelerated technology deployments could likely be achieved without substantial disruption, although some changes in the behavior of businesses and consumers would be needed. Moreover, many of these changes could involve new costs and higher prices for end users.
The accelerated-deployment options identified in this chapter are based on the committee’s judgments regarding two important factors: (1) the readiness of evolutionary and new technologies for commercial-scale deployment and (2) the pace at which such technologies could be deployed without the disruptions associated with a crash effort. In estimating these factors, the committee considered the maturity of a given technology together with the availability of the necessary raw materials, human resources, and manufacturing and installation capacity needed to support its production, deployment, and maintenance. In some cases, estimates of the evolution of manufacturing and installation capacity were based on the documented rates of deployments of specific technologies from the past.
|
BOX 2.1 Reference Scenarios The statement of task for this study (Box 1.1) called for the development of a reference scenario “that reflects a projection of current economic, technology cost and performance, and policy parameters into the future.” The AEF Committee decided to meet this requirement by adopting the Energy Information Administration’s (EIA’s) reference case for U.S. energy supply and consumption, which is the most commonly cited scenario for the U.S. energy system. It provides estimates of past, current, and future energy supply and consumption parameters by assuming that current energy policies remain unchanged and then extrapolating economic growth rates and technology-development trends into the future. In other words, the EIA reference case represents a business-as-usual and policy-neutral projection. The EIA updates this reference case annually and presents it in the agency’s Annual Energy Outlook reports. In this study, the committee uses the 2008 update (EIA, 2008), which reflects U.S. energy supply and consumption through 2007 and future projections through 2030, as its primary reference scenario. However, in limited cases the 2009 update (EIA, 2009a) was used, and explicitly noted in this report, when it was considered to be more indicative of current conditions. The EIA’s Annual Energy Outlook reports can be accessed at www.eia.doe.gov/oiaf/aeo/. Selected energy supply and consumption estimates from the 2008 update are shown in the three tables that follow. TABLE 2.1.1 Reference Scenario Estimates of Electricity Consumption and Supply |
FINDING 1:
TECHNOLOGY DEPLOYMENT OPTIONS
With a sustained national commitment, the United States could obtain substantial energy efficiency improvements, new sources of energy, and reductions in greenhouse gas emissions through the accelerated deployment of existing and emerging energy-supply and end-use technologies, as described in some detail in Findings 2–5 in this chapter. Many energy efficiency and energy-supply technologies are ready for deployment now. But some emerging technologies will first require demonstration, either to prepare them for widespread commercial deployment starting about 2020 or to assess their readiness for deployment.
The U.S. energy system encompasses a large and complex installed base of energy-supply and end-use technologies. Transforming this system to increase sustainability, promote economic prosperity, improve security, and reduce environmental impacts as envisioned in Chapter 1 will require sustained national efforts to change the ways in which energy is produced, distributed, and used. The good news from the AEF Committee’s assessment is that there are many practical options for obtaining energy savings, new supplies of energy, and reductions in greenhouse gas emissions through widespread and sustained deployments of existing and emerging energy-supply and end-use technologies. The most important of these options are described in Findings 2–5.
The United States cannot continue to muddle along on its current course if it hopes to transform its energy system. Indeed, both the public and the private sectors will have to be mobilized to achieve the necessary deployments in the decades ahead. Moreover, there is no “silver bullet” technology that can be deployed to overcome U.S. energy challenges. Contributions will be needed from the full array of currently available and emerging technologies:
-
Numerous energy-supply and end-use technologies—energy efficiency, certain renewable-energy sources, and transmission and distribution (T&D) technologies—which can be deployed now and at relatively rapid rates with the appropriate mix of incentives.1
-
Evolutionary nuclear energy technologies, already being deployed in some other countries, which are ready for deployment in the United States. However, their commercial viability in the United States will first need to be demonstrated.
-
Some emerging technologies, such as carbon capture and storage (CCS), for which sustained programs of development and commercial-scale demonstration will be needed during the next decade to ready the most promising among them for widespread deployment starting around 2020.
Expanding the deployment of coal with CCS, renewable energy, and evolutionary nuclear energy technologies may require continuing strong financial and regulatory pushes and new policy initiatives.2 But many of the technologies identified in this report will require decades-long lead times for development, demonstration, and deployment. Therefore it is imperative that these activities be started immediately even though some will be expensive and not all will be successful: some may fail, prove uneconomic, or be overtaken by better technologies. Some failures are an inevitable part of learning and development processes. Long-term success requires that we stay the course and not be distracted by the inevitable short-term disappointments. To help ensure that the potential benefits outweigh the risks, investments in new technology demonstrations must be carefully chosen so as to produce results that usefully inform the deployment decision-making process.
Although it is beyond the committee’s charge to recommend policy actions, it notes that the effective transformation of the energy system will require long-term investment in new energy technologies, policies that encourage such investment, and acceptance of the inevitable disappointments that will punctuate our long-term success.
|
2 |
In addition to the incentives listed in Footnote 1, other possible actions include expanding renewable-energy portfolio standards to promote the deployment of renewable energy and providing federal loan guarantees to promote construction of a handful of evolutionary nuclear plants. Some of these actions are already under way. |
FINDING 2:
ENERGY SAVINGS FROM IMPROVED EFFICIENCY
The deployment of existing energy efficiency technologies is the nearest-term and lowest-cost option for moderating our nation’s demand for energy, especially over the next decade. The committee judges that the potential energy savings available from the accelerated deployment of existing energy-efficiency technologies in the buildings, transportation, and industrial sectors could more than offset the Energy Information Administration’s projected increases in U.S. energy consumption through 2030.
The deployment of energy efficiency technologies3—especially of mature technologies in the buildings, transportation, and industrial sectors—is the nearest-term and lowest-cost option for extending domestic supplies of energy. Many energy efficiency savings can be obtained almost immediately by deploying currently available technologies. In contrast, providing new energy supplies typically takes many years. Moreover, energy efficiency has broader societal benefits beyond saving energy. Society is giving more attention to the environment and other externalities as exemplified, for example, by concerns about the impacts of carbon dioxide (CO2) emissions on global climate change. Laws and regulations, from the Endangered Species Act to the Clean Air Interstate Rule, inevitably slow the development of new energy supplies. In contrast, efficiency involves few emissions, endangers no species, and does not destroy scenic vistas.
To achieve such benefits, however, the efficiency savings must translate into actual reductions in energy consumption. This has been a particular issue in the transportation sector, where efficiency improvements that could have been used to raise vehicle fuel economy were instead offset by higher vehicle power and increased size.
Efficiency savings are realized at the site of energy use—that is, at the residence, store, office, factory, or transportation vehicle. The efficiency supply curves shown later in this chapter demonstrate that many energy efficiency investments cost less than delivered electricity, natural gas, and liquid fuels; in some cases, those costs are substantially less. In the electricity sector, many efficiency investments even cost less than transmission and distribution costs, which are typically
|
3 |
As noted in Chapter 1, the committee draws a sharp distinction between energy efficiency and energy conservation. Conservation can be an important strategy for reducing energy use, but it generally does not involve technology deployment and is therefore not addressed in this report. |
4–6μ/kWh for a residential customer and about half that for large commercial and industrial customers. Chapter 4 also shows that many energy efficiency projects with a rate of return of 10 percent or more could be undertaken by industry. Although most companies do not consider this rate of return attractive, it is nevertheless an attractive investment for society.
The greatest capability for energy efficiency savings is in the buildings sector, which accounted for about 70 percent of electricity consumption in the United States in 2007 (2700 TWh out of approximately 4000 TWh in total). Improvements in the energy efficiency of residential and commercial buildings—through the accelerated deployment of efficient technologies for space heating and cooling, water heating, lighting,4 computing, and other uses—could save about 840 TWh per year by 2020 (Figure 2.1), which exceeds the EIA’s projected increase in electricity demand of about 500 TWh for residential and commercial buildings by the year 2020 (EIA, 2008) (see Table 2.1.1 in Box 2.1). Further continuous improvements in building efficiency could save about 1300 TWh of electricity per year by 2030 (Figure 2.1), which also exceeds the EIA-projected reference scenario increase in electricity demand of about 900 TWh per year. In addition, improvements in building efficiency could save 2.4 quads of natural gas annually by 2020 and 3 quads of natural gas annually by 2030 (Figure 2.2).
There are many examples of cost-effective efficiency investments that could be made in the buildings sector to save energy. For example, an approximate 80 percent increase in energy efficiency—translating to nearly a 12 percent decrease in overall electricity use in buildings—could be realized immediately by replacing incandescent lamps with compact fluorescent lamps or light-emitting diodes. Energy savings between 10 and 80 percent could be realized by replacing older models of such appliances as air conditioners, refrigerators, freezers, furnaces, and hot water heaters with the most efficient models. Such replacements would not occur as quickly as replacing lamps because it is usually cost-effective to replace appliances only when they near the end of their service lives. The same is true for motor vehicles. Buildings last decades, so the energy savings benefits of new buildings will take decades to realize. However, there are cost-effective retrofits that could be installed immediately.
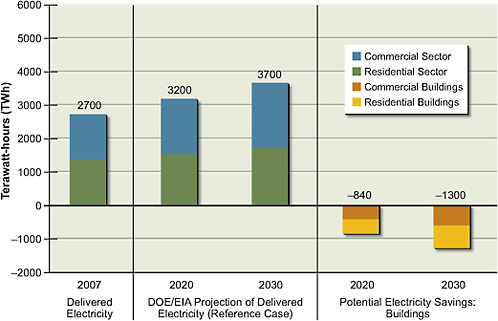
FIGURE 2.1 Estimates of potential energy savings in commercial and residential buildings in 2020 and 2030 (relative to 2007) compared to projected delivered electricity. The commercial and residential sectors are shown separately. Current (2007) U.S. delivered electricity in the commercial and residential sectors, which is used primarily in buildings, is shown on the left, along with projections for 2020 and 2030. To estimate savings, an accelerated deployment of technologies as described in Part 2 of this report is assumed. Combining the projected growth with the potential savings results in lower electricity consumption in buildings in 2020 and 2030 than exists today. The industrial and transportation sectors are not shown. Delivered energy is defined as the energy content of the electricity and primary fuels brought to the point of use. All values have been rounded to two significant figures.
Sources: Data from Energy Information Administration (2008) and Chapter 4 in Part 2 of this report.
In fact, the full deployment of cost-effective5 energy efficiency technologies in buildings alone could eliminate the need to build any new electricity-generating plants in the United States—except to address regional supply imbalances, replace obsolete power-generation assets, or substitute more environmentally benign electricity sources—assuming, of course, that these efficiency savings would not be used to support greater electricity use in other sectors.
|
5 |
See the section titled “Energy Efficiency” in Chapter 3 for a definition of “cost-effective.” |
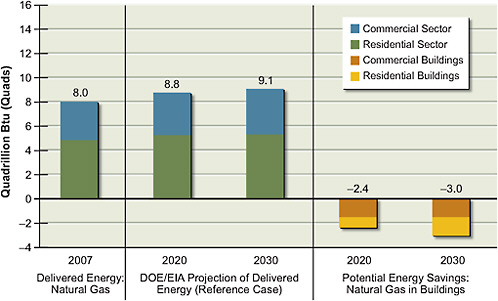
FIGURE 2.2 Estimates of potential natural gas savings in commercial and residential buildings in 2020 and 2030 (relative to 2007) compared to delivered energy from natural gas. The commercial and residential sectors are shown separately. Current (2007) US. delivered energy from natural gas in the commercial and residential sectors, which is used primarily in buildings, is shown on the left, along with projections for 2020 and 2030. To estimate savings, an accelerated deployment of technologies as described in Part 2 of this report is assumed. Combining the projected growth with the potential savings results in lower natural gas consumption in buildings in 2020 and 2030 than exists today. The industrial and transportation sectors are not shown. Delivered energy is defined as the energy content of the electricity and primary fuels brought to the point of use. All values have been rounded to two significant figures.
Sources: Data from Energy Information Administration (2008) and Chapter 4 in Part 2 of this report.
Opportunities for achieving substantial energy savings exist in the industrial and transportation sectors as well. For example, deployment of energy efficiency technologies in industry could reduce energy use in manufacturing by 4.9–7.7 quads per year (14–22 percent) in 20206 relative to the EIA reference case projection (Figure 2.3). Most of these savings would occur in the pulp and paper, iron
|
6 |
These identified savings would provide industry with an internal rate of return on its efficiency investments of at least 10 percent or exceed the company’s cost of capital by a risk premium. See Chapter 4 for additional discussion. |
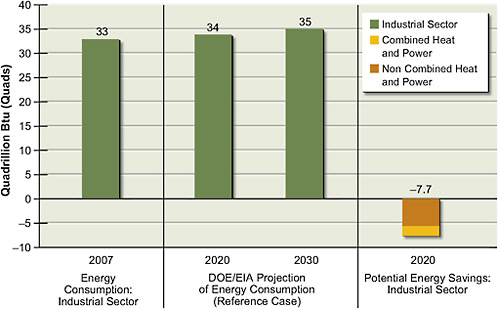
FIGURE 2.3 Estimates of potential energy savings in the industrial sector in 2020 (relative to 2007) compared to total delivered energy in the industrial sector. Current (2007) U.S. delivered energy in the industrial sector is shown on the left, along with projections for 2020 and 2030. To estimate savings, an accelerated deployment of technologies as described in Part 2 of this report is assumed. Combining the projected growth with the potential savings results in lower energy consumption in the industrial sector in 2020 (7.7 quads) than exists today. A more conservative scenario described in Chapter 4 could result in energy savings of 4.9 quads. The committee did not estimate savings for 2030. Delivered energy is defined as the energy content of the electricity and primary fuels brought to the point of use. All values have been rounded to two significant digits.
Sources: Data from Energy Information Administration (2008) and Part 2 of this report.
and steel, and cement industries. The increased use of combined heat and power in industry is estimated to contribute a large fraction of these potential savings—up to 2 quads per year in 2020.
In the transportation sector, energy savings can be achieved by increasing the efficiencies with which liquid fuels (especially petroleum) are used and by shifting the energy source for part of the light-duty vehicle (LDV) fleet from petroleum to electric power. Of course, the environmental impacts of such a fuel shift are dependent on how electricity (or hydrogen, if fuel-cell vehicles are produced) is generated. Moreover, electrification of LDVs will increase the overall demand for electricity. Shifting this electricity demand to off-peak times (e.g., at night),
through the use of demand-side technologies such as smart metering, may reduce the need for new power-plant construction and improve the utilization of current baseload power plants.
Improvements in the efficiency of today’s spark-ignition and diesel engine LDVs, combined with increased use of hybrid and other advanced vehicle technologies, could reduce these vehicles’ fuel consumption beyond 2020 to below that projected by the EIA (EIA, 2008). The EIA projection, which incorporates the increased fuel-economy standards mandated by the Energy Independence and Security Act (EISA) of 2007, equates to a 30 percent reduction in average fuel consumption (and a 40 percent increase in average fuel efficiency) in new LDVs in 2020 over today’s consumption.7 Exceeding this EIA projection is possible, but only if vehicle manufacturers focus on increasing vehicle fuel economy as opposed to their historic emphasis on increasing vehicle power and size. Figure 2.4 shows projections (described in Chapter 4) that illustrate how improvements in LDV fuel efficiency beyond that projected by the “no-change” reference scenario could further reduce total fuel consumption. These efficiency improvements, which include plug-in hybrid vehicles but not (fully) battery-electric vehicles or hydrogen fuel-cell vehicles, could reduce gasoline consumption by about 1.4 million barrels per day in 2020 and 5.6 million barrels per day in 2035. Of course, these fuel-efficient vehicles will have to be acceptable to consumers. Improvements are also possible in fuel consumption for freight shipping, but projected growth in airline travel is likely to offset improvements in aviation technologies.
Many energy efficiency technologies save money and energy. The cost of conserved energy (CCE) is a useful way to compare the cost of an energy efficiency technology to the cost of electricity and natural gas.8 The range of
|
7 |
The EIA (2008) reference case incorporates the EISA corporate average fuel economy (CAFE) standard of 35 miles per gallon (mpg) by 2020. The EIA reference case projects that the fuel economy of new vehicles will reach 36.6 mpg in 2030. As is noted in Chapter 1, the Obama administration recently announced a new national fuel efficiency policy that requires an average fuel economy standard of 35.5 mpg for new light-duty vehicles in 2016. |
|
8 |
CCE is defined as the levelized annual cost of an energy efficiency measure—that is, the cost of a new technology, or the incremental cost for a more efficient technology compared with a less efficient one—divided by the annual energy savings in kilowatt-hours or British thermal units over the lifetime of the measure. (The levelized annual costs do not include the costs for public policies and programs aimed at stimulating adoption of energy efficiency measures.) The CCE is expressed here in cents per kilowatt-hour (¢/kWh) for electricity efficiency measures and dollars per million British thermal units ($/million Btu) for natural gas efficiency measures. The CCEs presented in this report were computed using a real discount rate of 7 percent. |
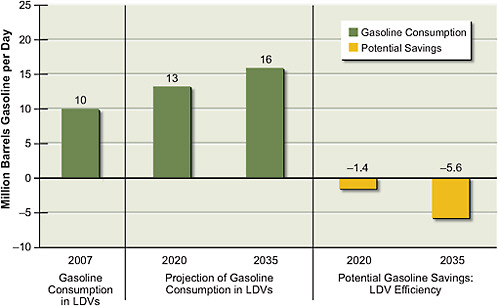
FIGURE 2.4 Estimates of potential for gasoline consumption reduction in the U.S. light-duty vehicle (LDV) fleet in 2020 and 2035 (relative to 2007). Current (2007) U.S. gasoline consumption in LDVs is shown on the left. This consumption estimate, which was developed by the committee, includes gasoline-equivalent diesel fuel consumption in LDVs as well as fuel consumption in LDVs between 8,500 and 10,000 lb weight (the new Environmental Protection Agency upper limit on light trucks). Projected gasoline consumption in LDVs in 2020 and 2035 is shown by the middle set of bars. The projected consumption shown is an illustrative, no-change baseline scenario, where any efficiency improvements in powertrain and vehicle are offset by increases in vehicle performance, size, and weight. This baseline is described in more detail in Chapter 4 in Part 2 of this report. To estimate savings, an accelerated deployment of technologies as described in Part 2 of this report is assumed. Specifically, fuel efficiency improvements result from an optimistic illustrative scenario in which the corporate average fuel economy (CAFE) standards of the Energy Independence and Security Act of 2007 are met in 2020. This scenario assumes that fuel economy for new LDVs continues to improve until it reaches, in 2035, double today’s value. Combining the projected growth in vehicle fleet size with the potential efficiency savings results in only slightly higher gasoline consumption in vehicles in 2020 and 2035 than exists today. A more conservative illustrative scenario, which results in savings of 1.0 and 4.3 million barrels of gasoline per day in 2020 and 2035, respectively, is also shown in Part 2 of this report. Beyond 2020, a 1 percent compounded annual growth in new vehicle sales and annual mileage per vehicle, combined, is assumed. Gasoline consumption can be further reduced if vehicle use (vehicle miles traveled) is reduced. All values have been rounded to two significant figures.
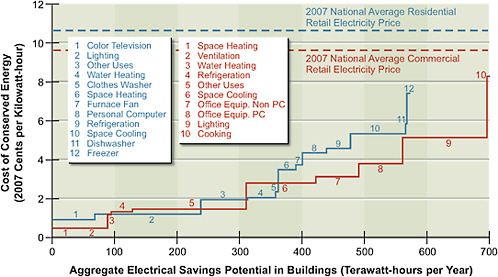
FIGURE 2.5 Estimates of the cost of conserved energy (CCE) and energy savings potential for electricity efficiency technologies in buildings in 2030. The CCEs for potential energy efficiency measures (numbered) are shown versus the ranges of potential energy savings for these measures. The total savings potential is 567 TWh per year in the residential sector and 705 TWh per year in the commercial sector. Commercial buildings (red solid line) and residential buildings (blue solid line) are shown separately. For comparison, the national average 2007 retail price of electricity in the United States is shown for the commercial sector (red dashed line) and the residential sector (blue dashed line). For many of the technologies considered, on average the investments have positive payback without additional incentives. CCEs include the costs for add-ons such as insulation. For replacement measures, the CCE accounts for the incremental cost—for example, between purchasing a new but standard boiler and purchasing a new high-efficiency one. CCEs do not reflect the cost of programs to drive efficiency. All costs are shown in 2007 dollars. Sources: Data from Brown et al. (2008) and Chapter 4 in Part 2 of this report.
CCE for electricity savings from commercial and residential buildings is shown in Figure 2.5. The range of CCE for electricity savings from commercial buildings is 0.5–8.4μ/kWh, with a weighted average of 2.7¢/kWh. However, nearly all of the efficiency savings are achievable at a CCE of 5¢/kWh or less. The range of CCE for electricity savings from residential buildings is 0.9–7.4¢/kWh, with a weighted average of 2.7¢/kWh. More than 80 percent of the potential savings are achievable at a CCE of 5¢/kWh or less. For comparison purposes, the average retail price of electricity in the residential and commercial sectors in 2007 was about
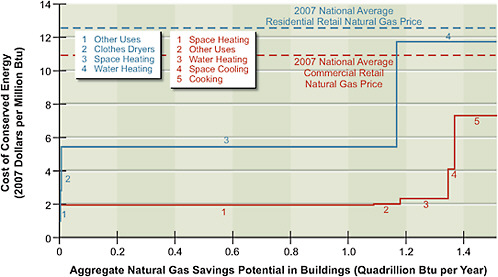
FIGURE 2.6 Estimates of the cost of conserved energy (CCE) and energy savings potential for natural gas efficiency technologies in buildings in 2030. The CCEs for potential energy efficiency measures (numbered) are shown versus the ranges of potential energy savings for these measures. The total savings potential is 1.5 quads per year in the residential sector and 1.5 quads per year in the commercial sector. Commercial buildings (red solid line) and residential buildings (blue solid line) are shown separately. For comparison, the national average 2007 retail price of natural gas in the United States is shown for the commercial sector (red dashed line) and the residential sector (blue dashed line). For many of the technologies considered, on average the investments have positive payback without additional incentives. CCEs include the costs for add-ons such as insulation. For replacement measures, the CCE accounts for the incremental cost—for example, between purchasing a new but standard boiler and purchasing a new high-efficiency one. CCEs do not reflect the cost of programs to drive efficiency. All costs are shown in 2007 dollars.
Sources: Data from Brown et al. (2008) and Chapter 4 in Part 2 of this report.
10¢/kWh.9 In other words, it is substantially cheaper for a customer to save electricity rather than purchase electricity, even if these savings require up-front costs.
The range of CCE for natural gas savings from commercial and residential buildings is shown in Figure 2.6. The range of CCE from commercial buildings is $1.9–7.4/million Btu, with a weighted average of $2.5/million Btu. Nearly 80 per-
|
9 |
The figures were 10.65¢/kWh for residential and 9.65¢/kWh for commercial; see http://www.eia.doe.gov/cneaf/electricity/epa/epat7p4.html. |
cent of the potential savings are achievable at a CCE of $2/million Btu. The range of CCE for natural gas savings from residential buildings is $1.1–11.8/million Btu, with a weighted average of $6.9/million Btu or less. Nearly 80 percent of the potential savings are achievable at a CCE of $5/million Btu or less. For comparison purposes, the retail price of natural gas in 2007 was about $12.7/million Btu in the residential sector and $11/million Btu in the commercial sector. Again, it is substantially cheaper for a customer to save natural gas rather than purchase natural gas, even if these savings require up-front costs.
The energy efficiency savings identified in this report are highly cost-effective with short payback periods. Substantially greater energy efficiency savings could likely be obtained with a more aggressive mix of policies, regulations, and incentives to encourage an even wider deployment of energy efficiency technologies. However, it should be noted that businesses and consumers have historically been resistant to making even modest up-front investments in such technologies (Box 2.2). New approaches may be required to break these patterns.
FINDING 3:
OPTIONS FOR INCREASING ELECTRICITY SUPPLIES AND CHANGING THE SUPPLY MIX
The United States has many promising options for obtaining new supplies of electricity and changing its supply mix during the next two to three decades, especially if carbon capture and storage and evolutionary nuclear energy technologies can be deployed at required scales. However, the deployment of these new supply technologies is very likely to result in higher consumer prices for electricity.
The U.S. supply of electricity in 2007, about 4000 TWh,10 was obtained from the following sources (EIA, 2009b):11
-
2000 TWh from coal-fired power plants
-
810 TWh from nuclear power plants
|
10 |
This estimate is for electricity supplied to the grid. The electricity delivered to the consumer is slightly lower because of losses in the transmission and distribution system. In 2007, these losses were estimated to be about 9 percent based on sales of electricity. |
|
11 |
These numbers have been rounded from the EIA estimates. |
|
BOX 2.2 Energy Efficiency and the Behavioral Gap A key finding of the present report is that there are substantial opportunities to reduce energy use through the widespread deployment of energy efficiency technologies in the buildings, transportation, and industrial sectors. The costs of deploying many of these technologies are much less than the costs to purchase energy; in fact, in these cases deployment saves money as well as energy. In spite of such advantages, many consumers are reluctant to make the necessary investments to deploy these technologies. Why the apparent dichotomy persists is the subject of ongoing research, which has already identified several reasons. One reason for the behavioral gap between economically optimal technology choices and actual choices is the low salience of energy efficiency for consumers. That is, consumers in this case do not reflect the neoclassical economic model of the optimizing consumer. Although real-world consumers may recognize that purchasing an energy-efficient technology would be economically beneficial, the net benefits are usually so small relative to family budgets that individuals do not take the time to gather and analyze the requisite information. Another reason for the gap has to do with the difficulty of changing consumers’ purchasing and use habits. Preferences learned from parents, neighbors, and friends may change only very slowly, if at all. Also, most consumers do not calculate life-cycle costs when making purchases; instead, they focus primarily on first-purchase costs. Producers who understand this bias may be reluctant to design and market energy-efficient products unless forced to do so by governmental regulation. Part of the behavioral gap is also based on economic-incentive issues—e.g., landlords of residential rental units are not motivated to pay for technologies that are more efficient when their tenants pay the utility bills. There are also historical path dependencies. For example, many existing building codes were developed when energy costs were not seen as important; these codes were optimized for safety, not for minimum life-cycle costs. Consumers also pay attention to product characteristics that tend to be ignored by analysts. They resisted buying early-generation compact fluorescent lamps, for instance, because they did not like the color of the light produced. Continuing research is needed to more fully understand these and other reasons for the behavioral gap and to devise appropriate strategies for closing it. |
-
690 TWh from natural-gas-fired power plants
-
320 TWh from renewable-energy sources, mostly hydropower (250 TWh), wind (34 TWh), geothermal (15 TWh), and biopower (8.7 TWh)
-
180 TWh from combined-heat-and-power plants, fed primarily by natural gas and coal
-
57 TWh from oil-fired power plants.
Through the deployment of new technologies and the repowering of current assets, the United States has many promising options both for increasing its electricity supply and for changing its electricity-supply mix. These estimates of new electricity supplies using different energy sources and technologies were derived independently and should not be added to obtain a total new supply estimate. As noted in Chapter 1, the AEF Committee has not conducted an integrated assessment of how these energy-supply technologies would compete in the marketplace or of how that competition and other external factors would affect deployment success.
Renewable-energy sources (Figure 2.7) could provide about an additional 500 TWh of electricity per year by 2020 and about an additional 1100 TWh per year by 2035 through new deployments in favorable locations. These levels exceed the amounts of new electricity supplies that are likely to be available from new nuclear-power generation or new coal-power generation with CCS in 2020 or from new nuclear power generation in 2035. However, expansion of transmission capabilities would be required to transport new electricity supplies from renewable resources to demand centers and regional energy markets. Backup supplies of electricity, or the capability to store energy during times when electricity production exceeds demand, would be needed when renewable sources were unavailable. Given current cost structures for renewable energy (discussed later in this chapter), policies such as renewable portfolio standards and tax credits would likely need to be continued, and possibly expanded, to obtain these new supplies.
Coal-fired plants with CCS (Figure 2.8) could provide as much as 1200 TWh from repowering and retrofit of existing plants and as much as 1800 TWh from new plants. In combination, the entire existing coal power fleet (which currently delivers about 2000 TWh of electricity per year) could be replaced by CCS coal power by 2035. However, successful commercial-scale demonstrations of CCS technologies would be required during the coming decade to realize this potential. (A brief discussion of CCS demonstration needs and constraints is provided under Finding 6; additional information is
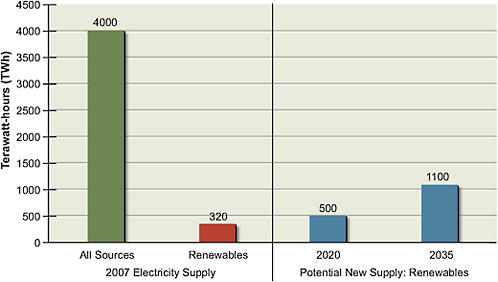
FIGURE 2.7 Estimates of potential new electricity supply from renewable sources in 2020 and 2035 (relative to 2007) compared to current supply from all sources. The total electricity supplied to the U.S. grid in 2007 is shown on the left (in green). The supply generated by renewable sources (including conventional hydropower) is shown in red. Potential new supply shown is in addition to the currently operating supply. To estimate future supply, an accelerated deployment of technologies as described in Part 2 of this report is assumed. Potential new electricity supply does not account for future electricity demand or competition among supply sources. All values have been rounded to two significant figures.
Sources: Data from Energy Information Administration (2008) and Part 2 of this report.
available in Chapter 7 in Part 2 of this report.) In addition, it will be necessary to assess the full implications, including the environmental externalities, of any very large expansion in coal production and use. Given the projected costs of CCS, the widespread deployment of CCS technologies will likely require new governmental policies that provide a regulatory or CO2 price push. These deployments would reduce the environmental impacts of electricity generation and thereby provide indirect economic benefits to consumers, though such benefits are difficult to quantify.
Nuclear plants (Figure 2.9) could provide an additional 160 TWh of electricity per year by 2020 and about 850 TWh by 2035 through the modification of current plants to increase power output (referred to as “uprating”)
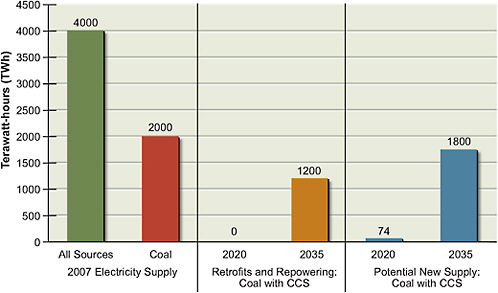
FIGURE 2.8 Estimates of potential electricity supply, in 2020 and 2035 (relative to 2007) compared to supply from all sources, from new coal-fired plants with carbon capture and storage (CCS) and from plants retrofitted or repowered to add CCS. The total electricity supplied to the U.S. grid in 2007 is shown on the left (in green). The supply generated by coal is shown in red. To estimate future supply, an accelerated deployment of technologies as described in Part 2 of this report is assumed. The potential supply from new coal plants built with CCS is shown in blue; the potential supply from retrofitting and repowering currently operating plants to add CCS is shown in orange. Potential new supply with CCS and potential retrofits with CCS compete for the same CO2storage sites and other enabling elements. The simultaneous realization of both estimates of potential 2035 deployment is not anticipated because of this competition. Over the next decade CCS technologies will need to be successfully demonstrated to achieve the potential supply shown from coal plants with CCS in 2035. A strong policy push will also be required to realize the 2020 supply estimate. The AEF Committee assumed an average capacity factor of 85 percent for coal plants with CCS. Potential new electricity supply does not account for future electricity demand, fuel availability or prices, or competition among supply sources. All values have been rounded to two significant figures.
Sources: Data from Energy Information Administration (2008) and Chapter 7 in Part 2 of this report.
and through new-plant construction. These amounts would be in addition to the 800 TWh produced by currently operating plants and do not account for possible plant retirements, which are shown by the negative 2035 supply estimate in Figure 2.9. The original (40-year) operating licenses of current plants are now beginning to expire. For the majority of these plants, license extensions
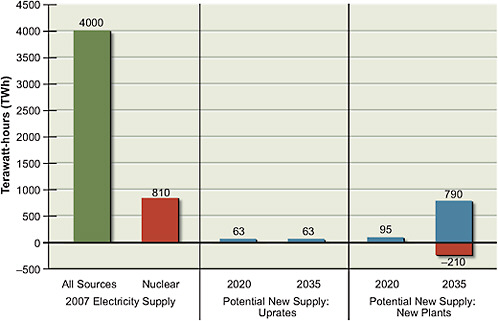
FIGURE 2.9 Estimates of potential new electricity supply from nuclear power in 2020 and 2035 (relative to 2007) compared to supply from all sources. The total electricity supplied to the U.S. grid in 2007 is shown on the left (in green). The supply generated by nuclear power is shown in red. Over the next decade, the first few nuclear plants will need to be constructed and operated successfully to achieve the potential supply shown from nuclear power in 2035. To estimate supply, an accelerated deployment of technologies as described in Part 2 of this report is assumed. Current plants are assumed to be retired at the end of 60 years of operation, resulting in a reduced electricity supply from nuclear power in 2035 (shown by the negative valued red bar). However, operating license extensions to 80 years are currently under consideration, and it is possible that many of these plants may not be retired by 2035. The AEF Committee assumed an average capacity factor of 90 percent for nuclear plants. Potential new electricity supply does not account for future electricity demand, fuel availability or prices, or competition among supply sources. All values have been rounded to two significant figures.
Sources: Data from Energy Information Administration (2008) and Part 2 of this report.
for an additional 20 years (to allow for a total of 60 years of operation) have been approved or are being processed. This will allow more electricity to be generated over the operating life of each of these plants. The negative 2035 supply estimate shown in Figure 2.9 illustrates potential supply losses resulting from the retirement of plants when these 60-year licenses expire; however, it is possible that some plants will receive license extensions for up to an additional 20 years (to allow for a total of 80 years of operation), decreasing these potential supply
losses. A discussion of nuclear-plant demonstration needs and constraints is included under Finding 6; additional information is provided in Chapter 8 in Part 2 of this report. Existing federal loan guarantees (described in Chapter 8) will probably be essential for constructing at least some of the first few new nuclear plants in the United States.
Natural gas generation of electricity could be expanded to meet a substantial portion of U.S. electricity demand—if there were no concerns about the behavior of world natural gas markets and prices and about further increasing CO2 emissions and U.S. import dependence. In fact, lower capital cost and shorter construction times favor natural gas over coal or nuclear power plants for new electric-power generation (see Figure 1.10). But it is not clear whether natural gas supplies at competitive prices would be adequate to support substantially increased levels of electricity generation. The role of natural gas will likely depend on the demand for electricity, the magnitude of growth in domestic natural gas production, the demand for natural gas for other uses (e.g., as an industrial feedstock or for space heating), and controls on CO2 emissions. If growth in new domestic natural gas production were sufficient to offset declines in production from existing fields and could be sustained for extended periods, domestic resources could be used to support expanded electricity production. If domestic supplies could not be increased, liquefied natural gas imports would be needed, thereby exposing the U.S. market to increased import dependence and to international prices. Increased import dependence has important energy-security implications, as discussed in Chapter 1.
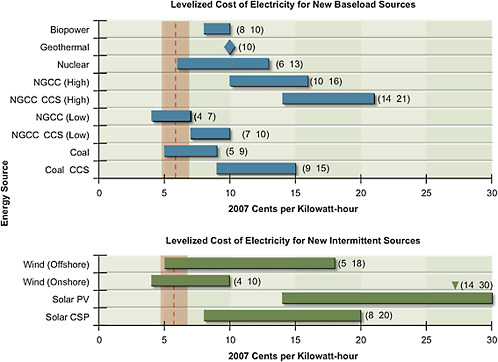
Although the potential picture with these new supplies is promising, they will likely result in higher electricity prices.12 Estimates of the levelized cost of electricity (LCOE; Box 2.3) for new baseload and intermittent electricity generation in 2020 are shown in Figure 2.10. Descriptions of the methods and assumptions that were used to estimate these LCOEs are provided in Annex 3.A in Chapter 3 and in the Part 2 chapters. It is important to recognize that estimating future costs is notoriously difficult. The estimates are strongly dependent on the judgments of the experts who make them and are based on a necessarily lim-
|
12 |
The deployment of new generating capacity, whether from an existing or a new technology, generally results in an increase in the cost of electricity. This is because the embedded costs (i.e., the “book values”) of existing generating assets are typically at least an order of magnitude less than those of the new generating assets (whether for replacement or supplementation). |
|
BOX 2.3 Levelized Cost of Electricity The levelized cost of electricity (LCOE) is defined as the average cost of generating a unit of electricity over the generating facility’s service life. The LCOE is computed by dividing the present value of the estimated full life-cycle costs of the generating facility by its estimated lifetime electricity production. The result is usually expressed in terms of cents per kilowatt-hour. The full life-cycle costs of the generating facility include:
Facility lifetime is typically taken to be between 20 and 40 years, depending on the generating technology. The LCOE is less than the cost of electricity to the consumer (i.e., less than the retail price) because it does not include the costs of transmission and distribution or the electricity generator’s profit. These additional costs can typically add several cents per kilowatt-hour to the wholesale cost of electricity. |
ited understanding about how future events might unfold. Consequently, such estimates usually have large uncertainties. Given these uncertainties and the particular methodologies used to estimate LCOEs in this report, differences in LCOEs of 2¢/kWh or less are probably not significant.13
Figure 2.10 shows both that there is a range of LCOE values for each technology and that the ranges for many different technologies are overlapping. For comparison purposes, consider that the EIA-estimated average wholesale price of electricity14 in 2007 was about 6¢/kWh and is forecast to
|
13 |
It was difficult to obtain consensus within the committee about how to estimate LCOEs for different technologies on exactly comparable bases given the large number of assumptions that had to be made about costs, performance, and expected lifetimes for each technology. Consequently, the estimates shown in Figure 2.10 should be considered approximations. |
|
14 |
The wholesale price of electricity represents the price of electricity supplied at the busbar. It does not include the prices for transmission and distribution. As noted previously, the average retail price for electricity in 2007 was about 10¢/kWh. |
remain at that level through 2030 under the agency’s reference case projection (EIA, 2008). The LCOEs for most new electricity sources in 2020 shown in Figure 2.10 are higher than the EIA-projected wholesale cost. The clear exceptions are coal without CCS, some biopower for baseload generation, and onshore wind for intermittent generation. The cost for electricity from natural gas strongly depends on gas prices as shown in Figure 2.10. However, biopower can provide limited new supplies of electricity, and wind power can have large electrical-transmission and distribution costs because power generation sources are spatially distributed. Additionally, generation of electricity using natural gas and coal without CCS might not be environmentally acceptable, and the price for electricity from natural gas could increase substantially, of course, if there were large price increases for this fuel.
The LCOEs shown in Figure 2.10 represent what the AEF Committee judges to be reasonable cost ranges based on available information. Actual LCOEs could be different from those shown in the figure, however, for reasons such as unanticipated future changes in fuel prices, higher- or lower-than-expected costs for deploying and operating new technologies, costs arising from deployments at particular locations, and other regional cost differences. Obviously, the LCOEs for some technologies would be affected more than others by these factors; natural gas combined cycle (NGCC) plants, for example, utilize natural gas as a fuel, and recent prices for this fuel have been volatile. On the other hand, fuel costs for nuclear plants are only a small part of electricity generation costs. Wind, solar, hydro, and geothermal power have no fuel charges and their deployment costs are well established, especially for onshore wind and solar. Still, the potential outputs of solar arrays and wind turbines can vary greatly because of local conditions, so these technologies will have site-dependent cost impacts.
The overlapping LCOE estimates shown in Figure 2.10 make it difficult to pick winners and losers, suggesting the need to proceed on parallel tracks for demonstrating and deploying technologies. The results for electricity from natural gas strengthen this conclusion: given the low and high prices of natural gas in recent years, the LCOE for NGCC can be one of the lowest-cost—or one of the highest-cost—sources of electricity, as shown in Figure 2.10. Given the variability of fuel prices over the decades-long lives of these plants, it is impossible to be confident that a particular technology will have the lowest cost or even a reasonably low cost. Although the committee, along with most observers, concluded that over the 30-year life of an NGCC plant the price of
natural gas would be likely to rise, the year-to-year variations could also be large because of changes in the balance between demand and supply.
Figure 2.10 indicates that the LCOE range for nuclear plants is comparable with those for coal with CCS and certain renewable-energy sources, such as offshore wind and concentrating solar power. The bottom of the LCOE range for nuclear is for plants built with federal loan guarantees. At present, such guarantees are available only for the first few plants. The bottom of the LCOE range for wind, corresponding to class 7 wind sites, extends below the range for nuclear. However, nuclear and fossil-fuel electricity generation provide baseload power, whereas most renewable sources provide intermittent power, which reduces their value in the electricity system. The costs of integrating intermittent renewables such as wind and solar into the grid are generally low if they provide less than about 20 percent of total electricity generation (see Chapter 6), except when expensive transmission capacity must be added to bring power to demand centers.
FIGURE 2.10 Estimates of the LCOE at the busbar for new baseload and intermittent generating sources in 2020. The horizontal bars represent the AEF Committee’s judgments regarding plausible ranges of costs, given the uncertainties in fixed costs for each technology. Baseload electric power includes generating options with capacity factors above 75 percent; intermittent electric power includes generating options with capacity factors between about 25 and 40 percent. The vertical shaded bar shows the approximate range of average U.S. wholesale electricity prices across NERC regions in 2007; the dashed vertical line shows the average value in 2007, which was 5.7¢/kWh. Coal prices are assumed to be $1.71/GJ. Natural gas prices are shown for two cases: $6/GJ (low price case) and $16/GJ (high price case). The lower LCOE for nuclear power (6–8¢/kWh) includes federal loan guarantees. When installed at the point of energy use, such as on a residential rooftop, PV competes with the retail cost of electricity rather than with wholesale electricity prices. The cost estimates for different generating technologies were derived independently, with transmission and distribution costs not included explicitly in the estimates. These transmission and distribution costs are likely to be significant, however, for example, when installations are located far from load centers. Intermittent technology costs do not account for plants that must be kept available to assure adequate power supplies when the intermittent source is unavailable. All costs are in 2007 dollars. Estimated costs should be considered approximations.
Note: CCS = carbon capture and storage; CSP = concentrating solar power; LCOE = levelized cost of electricity; NERC = North American Electric Reliability Corporation; NGCC = natural gas combined cycle; PV = photovoltaics.
Sources: Data from Energy Information Administration (www.eia.doe.gov/cneaf/electricity/wholesale/wholesalet2.xls) and Part 2 of this report.
Figure 2.10 also shows that solar photovoltaic (PV) technologies are a higher-cost option for generating electricity than most other renewables. However, when installed at the point of energy use, such as on a residential rooftop, PV competes with the retail cost of electricity and are therefore more cost competitive for a purchasing customer. Additional R&D work on this technology, particularly to find new materials and manufacturing methods to lower these costs, will be necessary if it is to be more cost competitive and, as a result, more widely deployed.
Although the LCOE is generally informative for assessing technology costs, many other factors will also influence technologies’ competitiveness in the marketplace. Some of these factors have already been mentioned: fuel prices over the life of the generating asset, environmental regulations, costs of competing technologies, and, for technologies that are not yet commercial, uncertainties in construction and operation costs.
The deployment of new electricity-supply technologies will have a range
of impacts beyond higher costs. They could include, for example, increased water consumption, especially for large baseload generating plants (see Chapters 7 and 8); health effects from pollutant emissions; and the siting and construction of facilities that are sometimes viewed as undesirable. Such facilities include electricity transmission lines, CO2 pipelines, coal and uranium mines as well as coal and nuclear power plants, and waste-disposal facilities for mine tailings, fly ash, and used nuclear fuel. Even renewable-energy facilities such as wind plants could be difficult to site because of potentially degraded vistas and other environmental impacts. These kinds of deployment challenges should not be underestimated.
FINDING 4:
MODERNIZING THE NATION’S POWER GRID
Expansion and modernization of the nation’s electrical transmission and distribution systems (i.e., the power grid) are urgently needed to enhance reliability and security, accommodate changes in load growth and electricity demand, and enable the deployment of new energy efficiency and supply technologies, especially to accommodate future increases in intermittent wind and solar energy.
The nation’s electrical transmission and distribution systems require expansion and modernization for several reasons:
-
Increasing congestion threatens reliability and prevents the efficient transmission of electricity to areas where it is needed.
-
Transmission systems are subject to cascading failures—resulting, for example, from human error, natural disasters, and terrorist attacks—that can lead to widespread and lengthy outages.
-
Current systems have limited ability to accommodate new sources of electricity supply, especially intermittent sources, and sophisticated demand-side technologies such as advanced electricity metering technologies, sometimes referred to as “smart meters.”
Modernization of these systems would have a number of economic, national security, and social benefits, among them:
-
Reduced need for new transmission lines because systems could be operated more efficiently.
-
Improved reliability and more rapid recovery from system disturbances.
-
Ability to accommodate an expanded generation base, especially from intermittent wind and solar energy and from generation sources that are located at a distance from load-demand centers, which would help meet projected growth in future demand and deliver power to areas where it is needed.
-
Ability to provide real-time electricity price information that could motivate consumers to use electricity more efficiently, thereby moderating future growth in electricity demand.
Some near-term expansion and modernization options include the deployment of modern power electronics and sensors, advanced control technologies, higher-capacity conductors, dispatchable energy storage, and other “smart” technologies.15 Over the long term, new power storage and load-management strategies must be developed to accommodate the intermittent nature of solar and wind power.
The technologies needed to modernize and, where necessary, expand the transmission and distribution system are largely available now. Installing these technologies concurrently—that is, expanding and modernizing these systems simultaneously—would offer substantial cost savings. The committee estimates (see Chapter 9) that it would cost (in 2007 dollars) $175 billion for expansion and $50 billion for modernization of the transmission system when they are done concurrently, compared to $175 billion for expansion and $105 billion for modernization when done separately—a cost savings of $55 billion with simultaneous expansion and modernization. The committee also estimates that it would cost $470 billion for expansion and $170 billion for modernization of the distribution system when they are done concurrently, compared to $470 billion for expansion and $365 billion for modernization when done separately—a cost savings of $195 billion.
FINDING 5:
CONTINUED DEPENDENCE ON PETROLEUM
Petroleum will continue to be an indispensable transportation fuel during the time periods considered in this report, but maintaining current rates of domestic petroleum production will be challenging. There are limited options for replacing petroleum or reducing petroleum use before 2020, but there are more substantial longer-term options that could begin to make contributions in the 2030–2035 timeframe. The options include increasing vehicle efficiency, replacing imported petroleum with other liquid fuels produced from biomass and coal that have CO2emissions similar to or less than that of petroleum-based fuels, and electrifying the light-duty vehicle fleet.
The United States consumed about 21 million barrels of liquid fuels16 per day in 2007. Domestic consumption of liquid fuels is projected to increase to about 22 million barrels per day in 2020 and about 23 million in 2030 (EIA, 2008). In 2007, about 14 million barrels of liquid fuels per day were used in the transportation sector, of which about 9 million barrels were consumed by LDVs.
The best near-term option for reducing dependence on imported petroleum is through greater vehicle efficiency. The EISA requires a 40 percent increase in fuel economy for new LDVs by 2020. This could eventually result in a savings of about 1.4 billion barrels of gasoline per year (60 billion gallons of gasoline per year or about 164 million gallons of gasoline per day) when these fuel economy standards are fully realized in the on-the-road fleet. As noted previously, the Obama administration recently announced a new policy that requires an average fuel economy standard of 35.5 miles per gallon for new LDVs in 2016. As explained in Chapter 4, further efficiency gains are projected after 2020.
Reducing dependence on imported petroleum by substituting domestically produced liquid fuels would seem to be a good strategy, but the near-term options are limited. Just maintaining current rates of domestic petroleum production (about 5.1 million barrels per day in 2007) over the next two to three decades will be challenging. Petroleum production in current fields is declining, and it will be difficult to increase domestic production even with favorable developments in technology, prices, and access to new resources. Nevertheless, continued devel-
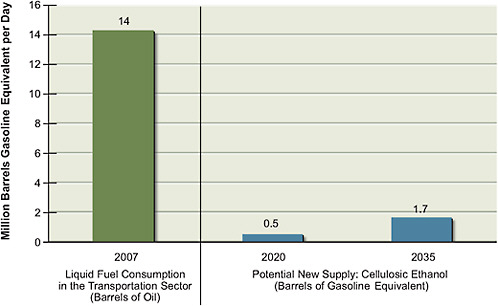
FIGURE 2.11 Estimates of the potential cellulosic ethanol supply in 2020 and 2035 (relative to 2007) compared to total liquid fuel consumption. The current (2007) U.S. liquid fuel consumption, in barrels of oil, for transportation is shown on the left (in green). To estimate supply, an accelerated deployment of technologies (as described in Part 2 of this report) and the availability of 500 million dry tonnes per year of cellulosic biomass for fuel production are assumed after 2020. Potential liquid fuel supplies are estimated individually for each technology, and estimates do not account for future fuel demand, competition for biomass, or competition among supply sources. Potential supplies are expressed in barrels of gasoline equivalent. One barrel of oil produces about 0.85 barrels of gasoline equivalent of gasoline and diesel. All values have been rounded to two significant figures.
Sources: Data from Energy Information Administration (2008) and Chapter 5 in Part 2 of this report.
opment of domestic resources will be essential to help prevent increases in U.S. import dependence.
Substituting other domestically produced liquid fuels could further reduce petroleum imports. Ethanol is already being made from corn grain in commercial quantities in the United States, but corn ethanol is likely to serve only as a transition fuel to more sustainable biofuels production, given the social and environmental concerns about using corn for fuel. The most promising substitutes before 2020 are cellulosic ethanol (Figure 2.11) and fuels produced from coal (coal-to-liquid fuels; Figure 2.12) and mixtures of coal and biomass (biomass-and-coal-to-
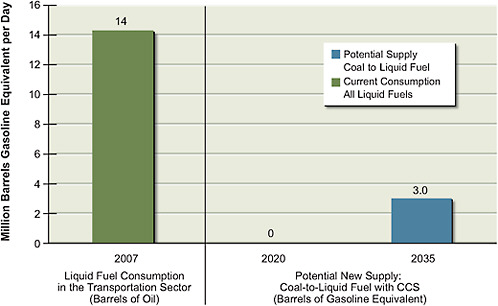
FIGURE 2.12 Estimates of the potential liquid fuel supply from conversion of coal to liquid fuels in 2020 and 2035 (relative to 2007) compared to total liquid fuel consumption. The current (2007) U.S. liquid fuel consumption, in barrels of oil, for transportation is shown on the left (in green). To estimate supply, an accelerated deployment of technologies as described in Part 2 of this report is assumed for coal-to-liquid fuel (CTL) with carbon capture and storage (CCS). It is assumed that CTL without CCS would not be deployed. There is uncertainty associated with the technical potential for CCS. CCS technologies will need to be successfully demonstrated over the next decade if they are to be used for liquid fuel production in 2035. The volume of liquid fuel estimated to be available in 2020 and 2035 depends primarily on the rate of plant deployment. Potential liquid fuel supplies are estimated individually for each technology, and estimates do not account for future fuel demand or competition among supply sources. Potential supplies are expressed in barrels of gasoline equivalent. One barrel of oil produces about 0.85 barrels of gasoline equivalent of gasoline and diesel. All values have been rounded to two significant figures.
Sources: Data from Energy Information Administration (2008) and Chapter 5 in Part 2 of this report.
liquid fuels; Figure 2.13). Cellulosic ethanol is in the early stages of demonstration, but coal-to-liquid fuels are being commercially produced today (but without geologic storage of CO2) outside the United States. Coal-to-liquid fuels technologies could be deployed domestically, but these technologies would have to be integrated with CCS to produce fuels with CO2 emissions similar to or less than those from petroleum-based fuels.
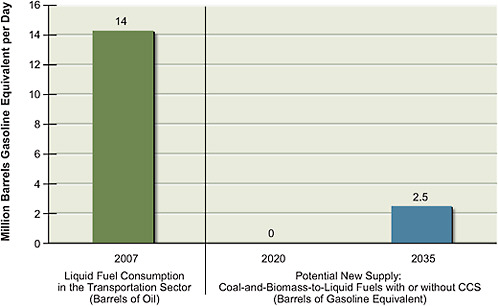
FIGURE 2.13 Estimates of the potential liquid fuel supply from conversion of coal and biomass to liquid fuels in 2020 and 2035 (relative to 2007) compared to total liquid fuel consumption. The current (2007) U.S. liquid fuel consumption, in barrels of oil, for transportation is shown on the left (in green). To estimate supply, an accelerated deployment of technologies as described in Part 2 of this report is assumed. A mix of 60 percent coal and 40 percent biomass (on an energy basis) is assumed as well. The volume of liquid fuels estimated to be available in 2020 and 2035 depends primarily on the rate of plant deployment and also assumes availability of 500 million dry tonnes per year of cellulosic biomass for fuel production after 2020. The supply of cellulosic ethanol estimated in Figure 2.11 cannot be achieved simultaneously with this coal-and-biomass-to-liquid fuel (CBTL) supply, as the same biomass is used in each case. There is uncertainty associated with the technical potential for carbon capture and storage (CCS). CCS technologies will need to be successfully demonstrated over the next decade if they are to be used for liquid fuel production in 2035. Potential liquid fuel supplies are estimated individually for each technology, and estimates do not account for future fuel demand, competition for biomass, or competition among supply sources. Potential supplies are expressed in barrels of gasoline equivalent. One barrel of oil produces about 0.85 barrels of gasoline equivalent of gasoline and diesel. All values have been rounded to two significant figures.
Sources: Data from Energy Information Administration (2008) and Chapter 5 in Part 2 of this report.
Beyond 2020, more advanced biofuels—with higher energy content and greater compatibility with the existing transportation-fuel infrastructure—might become available. However, additional research, development, and demonstration will be required to ready these technologies for widespread commercial deployment.
By 2035, cellulosic ethanol and coal-and-biomass-to-liquid fuels with CCS could replace 1.7–2.5 million barrels per day of gasoline equivalent—about 12–18 percent of the current liquid fuel consumption in the transportation sector—with near-zero life-cycle CO2 emissions. Coal-to-liquid fuels with CCS could replace 2–3 million barrels per day of gasoline equivalent (the 2 million barrels per day estimate assumes that some coal is diverted to produce coal-and-biomass-to-liquid fuels)—about 14–21 percent of current liquid fuels consumption in the transportation sector—and would have life-cycle CO2 emissions similar to those of petroleum-based fuels (Figures 2.11–2.13). However, commercial demonstration of these technologies would have to be started immediately and pursued aggressively to achieve that level of production by 2035. In addition, the annual harvesting of up to 500 million dry tonnes (550 million dry tons) of biomass and an increase in U.S. coal extraction by 50 percent over current levels would be required to provide the necessary feedstock supply for this level of liquid fuel production.
These expanded levels of liquid fuel production could have a range of environmental impacts on land, water, air, and human health. Moreover, the production of liquid fuel from coal would increase CO2 emissions to the atmosphere unless conversion plants were equipped with CCS. Although CO2 from the off-gas streams of conversion plants could be readily captured using commercially available technologies, engineered geologic storage of captured CO2 has not yet been demonstrated at the needed scales. Additional discussion of CCS technologies is provided under Finding 6.
Coal-to-liquid fuel production, with or without CCS, is the least expensive option for producing alternative liquid fuels (less than or equal to $70 per barrel; see Figure 2.14), although such production raises important health and environmental issues, as noted above. Deploying cellulosic ethanol would be economically competitive only with petroleum prices above about $115 per barrel.
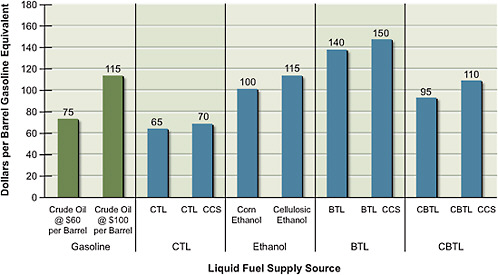
FIGURE 2.14 Estimated gasoline-equivalent costs of alternative liquid fuels. For comparison, the costs of gasoline at crude oil prices of $60 per barrel and $100 per barrel are shown on the left. Estimated costs assume that a zero price is assigned to CO2emissions. Liquid fuels would be produced using biochemical conversion to produce ethanol from Miscanthus or using thermochemical conversion via Fischer-Tropsch or methanol-to-gasoline. All costs are in 2007 dollars and are rounded to the nearest $5. Note: BTL = biomass-to-liquid fuel; CBTL = coal-and-biomass-to-liquid fuel; CCS = carbon capture and storage; CTL = coal-to-liquid fuel.
Additional reductions in petroleum imports would be possible by increasing the electrification of the vehicle fleet. The widespread deployment of electric and/or hydrogen fuel cell vehicles between 2035 and 2050 could lead to further and possibly substantial long-term reductions in liquid fuel consumption in the transportation sector. The National Research Council (2008), for example, estimated the potential reduction in petroleum use in 2050 from the deployment of hydrogen fuel-cell LDVs under a best-case scenario to be about 70 percent below the projected petroleum consumption of a fleet of comparable gasoline-fueled vehicles. The LDV fleet turns over every one to two decades, so the introduction of higher-efficiency vehicles would have relatively low impacts on petroleum use and CO2 emissions from the transportation sector until sometime after the 2020–2030 period.
FINDING 6:
REDUCING GREENHOUSE GAS EMISSIONS
Substantial reductions in greenhouse gas emissions from the electricity sector are achievable over the next two to three decades. They can best be realized through a portfolio approach involving the widespread deployment of multiple technologies: energy efficiency; renewable energy; coal, natural gas, and biomass with carbon capture and storage; and nuclear. However, to enable this portfolio approach, the viability of the following two technologies must be demonstrated during the next decade to make them ready for widespread commercial deployment starting around 2020: (1) the technical and commercial viability of CCS for sequestering CO2from electricity production and (2) the commercial viability of evolutionary nuclear plants in the United States. Achieving substantial greenhouse gas reductions in the transportation sector over the next two to three decades will also require a portfolio approach involving the widespread deployment of energy efficiency technologies, alternative liquid fuels with low life-cycle CO2emissions, and light-duty-vehicle electrification technologies.
As noted in Chapter 1, the United States emits some 6 billion tonnes (6 gigatonnes) of CO2 into the atmosphere each year (see Figure 1.3); about 5.6 gigatonnes are attributable to the energy system. The potential for reducing greenhouse gas emissions from this system before 2020 is limited, but the potential for reducing emissions after 2020 is significant, especially in the electricity sector, if certain technologies can be successfully deployed at commercial scales.
Electricity is produced in stationary facilities, which in principle makes it easier to effectively monitor and control their greenhouse gas emissions. The options for reducing the electricity sector’s emissions are apparent from an inspection of Figure 2.15, which provides estimates of life-cycle CO2-equivalent17 (denoted CO2-eq) emissions per kilowatt-hour of electricity produced. Coal and natural gas plants are by far the largest emitters of greenhouse gases from electricity generation. In fact, their CO2-eq emissions are far higher than those of any of the other technologies represented. As shown in Figure 1.8, coal and natural gas plants collectively supplied about 70 percent of electricity demand in 2007.
Achieving substantial reductions in CO2 emissions from the U.S. electricity
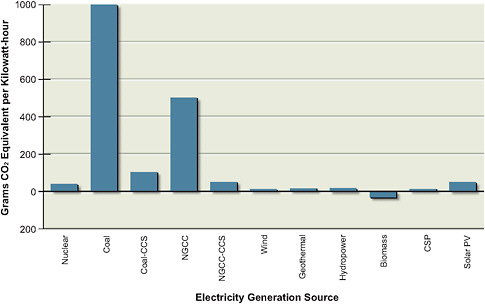
FIGURE 2.15 Estimated greenhouse gas emissions from electricity generation. Estimates are in units of grams of CO2-equivalent (CO2-eq) emissions per kilowatt-hour of electricity produced. Estimates for all technologies (with the exception of coal, coal-CCS, NGCC, and NGCC-CCS) are life-cycle estimates, which include CO2-eq emissions due to plant construction, operation, and decommissioning, levelized across the expected output of electricity over the plant’s lifetime. For coal, coal-CCS, NGCC, and NGCC-CCS, only emissions from the burning of the fossil fuels are accounted for. A 90 percent capture fraction is assumed for CCS technologies. Negative CO2-eq emissions mean that on a net life-cycle basis, CO2is removed from the atmosphere. For example, the negative CO2emissions for biopower result from an estimate that the sequestration of biomass carbon in power-plant char and the buildup of carbon in soil and roots will exceed the emissions of carbon from biofuel production. The life-cycle CO2emission from biofuels includes a CO2credit from photosynthetic uptake by plants, but indirect greenhouse gas emissions, if any, as a result of land-use changes are not included.
Note: CCS = carbon capture and storage; CSP = concentrating solar power; NGCC = natural gas combined cycle; PV = photovoltaics.
Sources: Data from Part 2 of this report and from NAS-NAE-NRC (2009a).
sector will be possible only if existing coal plants and natural gas plants are retrofitted or repowered with CCS technologies or are retired.18 However, retrofitting these plants will require diversion of some of their energy input to capturing and
compressing CO2. Limitations of existing boilers and turbines could mean that reductions of emissions to something like those of natural gas power plants without CCS, about half that of a typical coal plant, would be more likely to be implemented than the 90 percent reduction that is technically possible. Achieving more substantial reductions in emissions will require more extensive retrofitting of existing coal plants; their replacement with new coal plants (which have higher greenhouse gas-capture efficiencies) or with some combination of renewable-energy and nuclear-energy sources; or reductions in energy use.
Consequently, achieving substantial reductions in CO2 emissions from the electricity sector is likely to require a portfolio approach involving the accelerated deployment of multiple technologies: energy efficiency; renewables; coal and natural gas with CCS; and nuclear. However, the following two kinds of demonstrations must be carried out during the next decade if we are to more fully understand the range of available options:
-
Assess the viability of CCS for sequestering CO2from coal- and natural-gas-fired electricity generation. This will require the construction of a suite (~15–20) of retrofitted and new demonstration plants with CCS, featuring a variety of feedstocks (diverse coal types and natural gas); generation technologies (ultrasupercritical pulverized coal, oxyfuel, integrated gasification combined cycle, natural gas combined cycle); carbon capture strategies (pre- and post-combustion); and geologic storage locations (enhanced oil recovery sites, coal seams, deep saline formations). A few retrofits of existing natural gas plants and new gas plants with CCS should be included among the demonstrations to prepare for the possibility that optimistic forecasts of domestic natural gas availability and price prove correct. The commercial-scale demonstration of CCS would also enable the integration of this technology into plants that produce liquid fuels from coal and biomass.
-
Demonstrate the commercial viability of evolutionary nuclear plants in the United States by constructing a suite of about five plants in this country during the next decade. Evolutionary plants are already in operation and are being built in some other countries, so there are no technological impediments to their construction in the United States. However, plant construction requires multi-billion-dollar investments—very large for the size of nuclear plant owner-operators in the United States. The long lead times (6–10 years) required for planning, licens-
-
ing, and constructing these plants adds additional uncertainty, which can be reflected in the risk premiums for investments in first plants. The successful construction of a suite of evolutionary plants on budget and on schedule in the United States would demonstrate the commercial viability of this technology and enable its wider deployment after about 2020. This is an important option for meeting the projected national need for non-CO2-emitting electricity generation technologies.
The failure to successfully demonstrate the viability of these technologies during the next decade will greatly restrict options to reduce CO2emissions from the electricity sector. In particular, such a failure would remove the options of retrofitting and repowering existing coal and natural gas power plants with CCS, of replacing existing plants with new coal or natural gas plants with CCS units, and of deploying new nuclear plants. The failure to demonstrate the viability of these technologies could also prompt a major shift to natural gas for electricity generation; that is because gas plants can be built relatively quickly and inexpensively and their electricity prices could be more attractive than those of other low-carbon supply technologies such as renewables with energy storage. Unless optimistic forecasts of natural gas availability and price prove correct, however, such a shift could create the same kind of dependence on imports of LNG from outside North America that now exists for petroleum. Moreover, an electric power generation system dominated by natural gas plants without CCS would still emit significant quantities of CO2 compared to renewable and nuclear technologies (Figure 2.15).
It will take decades to achieve deep reductions in CO2 emissions from the electricity sector. Building large quantities of new generation of any technology requires learning, licensing, permitting, and public acceptance. The urgency of getting started on these demonstrations to clarify future deployment options cannot be overstated.
Reducing greenhouse gas emissions from the liquid-fuels-based transportation sector will also require a portfolio approach because these emissions occur in millions of mostly nonstationary sources. As shown in Figure 2.16, the deployments of some alternative liquid fuels—cellulosic ethanol, biomass-to-liquids with or without CCS, and biomass-and-coal-to-liquids with CCS—are estimated to have zero or negative CO2-eq emissions: that is, their production and use do not contribute to atmospheric CO2 and might even result in net removal of CO2 from the atmosphere. The other liquid-fuel options shown in Figure 2.16 have CO2-eq emissions that are roughly equal to, or exceed, CO2-eq emissions from gasoline
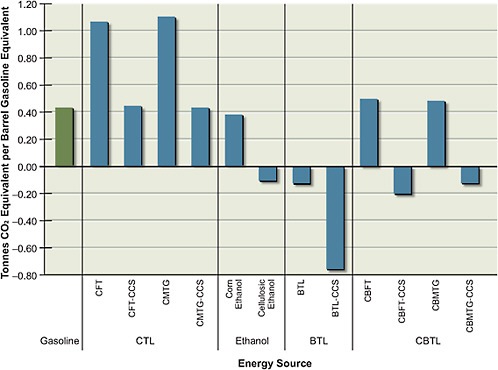
FIGURE 2.16 Estimated net life-cycle CO2-equivalent (CO2-eq) emissions for production, transportation, and use of alternative liquid transportation fuels. Emissions are shown in units of tonnes of CO2equivalent per barrel of gasoline equivalent produced from biomass, coal, or a combination of coal and biomass. For comparison, the CO2-eq emissions for gasoline are shown on the left. Negative CO2-eq emissions mean that on a net life-cycle basis, CO2is removed from the atmosphere; for example, the negative CO2emissions for BTL and cellulosic ethanol result from an estimate that the sequestration of biomass carbon in power-plant char or the buildup of carbon in soil and roots will exceed the emissions of carbon in biofuel production. Growing perennial crops for cellulosic fuels provides CO2benefits because these crops store carbon in the root biomass and the associated rhizosphere, thereby increasing soil carbon sequestration. The precise value of CO2-eq emissions from CBTL depends on the ratio of biomass to coal used. Indirect land-use effects on CO2emissions are not included.
Note: BTL = biomass-to-liquid fuel; CBFT = coal-and-biomass-to-liquid fuel, Fischer Tropsch; CBMTG = coal-and-biomass-to-liquid fuel, methanol-to-gasoline; CBTL = coal-and-biomass-to-liquid fuel; CCS = carbon capture and storage; CFT = coal-to-liquid fuel, Fischer-Tropsch; CMTG = coal-to-liquid fuel, methanol-to-gasoline; CTL = coal-to-liquid fuel.
Sources: Data from Chapter 5 in Part 2 of this report and from NAS-NAE-NRC (2009b).
produced with petroleum. As noted under Finding 5, however, alternative liquid fuels can only substitute for a portion of petroleum use. Moreover, geologic storage of CO2 from coal-to-liquid fuel and coal-and-biomass-to-liquid fuel production would have to be demonstrated to be safe and commercially viable by 2015 for these fuels to be produced in quantity starting around 2020.
Further reductions in greenhouse gas emissions from the transportation sector will have to be achieved through greater vehicle efficiency and, if greenhouse gas emissions from the electricity sector can be reduced, through electrification of the LDV fleet (as discussed under Finding 5). However, substantial reductions in emissions via these pathways are not likely to occur until late in the 2020–2035 period or beyond. As is the case for liquid fuel supply, the widespread deployment of electric or hydrogen fuel-cell vehicles between 2035 and 2050 holds some hope for more substantial long-term reductions in greenhouse gas emissions in the transportation sector, again depending on how the electricity and hydrogen are generated. As noted previously, the National Research Council (2008) estimated the potential reduction in petroleum use in 2050 from the deployment of hydrogen fuel-cell LDVs under the best-case scenario to be about 70 percent below the projected petroleum consumption of a fleet of comparable gasoline-fueled vehicles.
FINDING 7:
TECHNOLOGY RESEARCH, DEVELOPMENT, AND DEMONSTRATION
To enable accelerated deployments of new energy technologies starting around 2020, and to ensure that innovative ideas continue to be explored, the public and private sectors will need to perform extensive research, development, and demonstration over the next decade. Given the spectrum of uncertainties involved in the creation and deployment of new technologies, together with the differing technological needs and circumstances across the nation, a portfolio that supports a broad range of initiatives from basic research through demonstration will likely be more effective than targeted efforts to identify and select technology winners and losers.
As discussed in some detail in Part 2 of this report, the next decade offers opportunities to gain knowledge and early operating experience that in turn could enable widespread deployments of new energy-supply technologies beginning around 2020. These technology-development opportunities include:
-
The full range of energy efficiency technologies in the buildings, transportation, and industrial sectors.
-
Coal and natural gas with CCS (see Finding 6 and Chapter 7 for details).
-
Integrated gasification combined cycle, ultrasupercritical pulverized coal, and oxyfuel plants to improve the efficiency and performance of coal-generated electricity, pursued in coordination with research, development, and demonstrations on advanced materials and CCS technologies (see Chapter 7).
-
Thermochemical conversion of coal and coal-and-biomass mixtures to liquid fuels, integrated with CCS, at commercial scale. If decisions to proceed with such demonstrations are made soon, and if CCS is shown to be safe and viable by about 2015, these technologies could be commercially deployable within a decade under favorable economic conditions (see Chapter 5).
-
Research and development on cellulosic-conversion methods, followed by demonstration of cellulosic ethanol production at commercial scale, to achieve proof of principle and prepare this technology for wide-spread deployment (see Chapter 5).
-
Advanced LDVs, including plug-in hybrids and battery-electric and fuel-cell vehicles. Demonstrations of on-the-road vehicles are critical to getting real-world data on performance and service lives (see Chapter 4).
R&D will help to ensure the success of future new-technology deployments and especially to ensure that the technology pipeline remains full in the decades ahead. Significant investments in R&D over the next decade, by the public and the private sector alike, will be required for bringing some of the technologies described in this report to the point that they are cost-effective and ready for widespread deployment. The needed areas of R&D include:
-
Advanced biosciences—genomics, molecular biology, and genetics—to develop biotechnologies for converting biomass to lipid, higher-alcohol, and hydrocarbon fuels that can be integrated directly into existing transportation infrastructures.
-
Advanced technologies for producing alternative liquid fuels from renewable resources—such as fuel production from CO2 feedstocks
-
(e.g., algae biofuels). Such fuels are needed to expand options for reducing petroleum use.
-
Advanced technologies for the production of biomass that provides sustainable yields, minimizes competition with food and feed crops, and offers substantial greenhouse-gas-reduction benefits.
-
Advanced PV materials and manufacturing methods to improve efficiencies and to lower costs. The deployed efficiency of current PV materials is greater than 10 percent, which is much higher than the field efficiency of plants for biomass. Although biomass is a compact form of chemical energy storage, its production requires a great deal of land and energy and it has to be harvested and processed to make electricity or liquid fuels, whereas the electricity from PV cells can be used directly.
-
Advanced batteries and fuel cells for LDVs.
-
Advanced large-scale storage for wind energy and electrical-load management.
-
Enhanced geothermal power.
-
Advanced technologies for extracting petroleum from shale and for harvesting natural gas from hydrates.
-
Alternative fuel cycles that would allow for greater utilization of the energy content of nuclear fuel and the minimization of very-long-lived radioactive waste from nuclear power generation.
-
Further exploration of geoengineering options.
R&D in other scientific fields that are not addressed in this report will likely provide important support for the development and deployment of new energy-supply and end-use technologies. For example, researchers’ efforts to better understand the interactions between patterns of energy use and climate systems—including, for example, the ecology of microbial systems—could support the development of more effective means to capture, store, and recycle CO2 from energy production. Additionally, social science research on how households and businesses make decisions could lead to more effective measures to encourage energy efficiency.
Finally, attractive technology options will likely emerge from innovation pathways that are essentially unforeseen today—some examples are cited in Part 2 of this report—underscoring the need for a continuing focus on and investments in basic research. Some breakthrough technologies are probably not even on the present horizon; in fact, they may not become apparent until the final time period
considered in this report (2035–2050) or later. However, it is very likely that some of the potential breakthrough technologies that are indeed visible on today’s horizon—for example, superconducting materials, second- and third-generation PV technologies, and advanced batteries—may begin to develop and have an important influence on technology trends during the first two time periods (2008–2020 and 2020–2035) considered in this study. Achieving such breakthroughs will require sustained federal support for basic scientific research, both in the physical and in the biological sciences, and private-sector “venture-backed” support for early-stage energy R&D.
The Department of Energy (DOE) has been the primary catalyst for basic energy research in the United States, primarily through its Office of Science. There are substantial opportunities in the years ahead for this office to increase the support of such activities and to ensure their coordination by partnering with the DOE’s energy offices and with other basic-research agencies such as the National Science Foundation.
FINDING 8:
BARRIERS TO ACCELERATED TECHNOLOGY DEPLOYMENT
A number of current barriers are likely to delay or even prevent the accelerated deployment of the energy-supply and end-use technologies described in this report. Policy and regulatory actions, as well as other incentives, will be required to overcome these barriers.
The assessments provided in the forgoing sections reflect the AEF Committee’s judgments about the potential contribution of new energy technologies if the accelerated-deployment options identified in this report are actively pursued. However, a number of potential barriers could influence these options and, in turn, affect the actual scale and pace of the implementation of the technologies. Some of the barriers are purely market driven: technologies must be clearly attractive to potential investors, purchasers, and users. They must also provide improvements, relative to existing technologies, in terms of performance, convenience, and cost attributes; of course, they must also meet relevant performance standards and regulations.
In the course of this study, the AEF Committee identified several policy and regulatory barriers to the deployment of the energy-supply and end-use technologies that were examined. Some of these barriers have already been identified in
this chapter, and additional ones are described in Part 2. But because the following barriers crosscut many of the technologies examined in this report, the committee considers them to be impediments to future deployment success:
-
Lack of private-sector investments for technology deployment, ranging from relatively low-cost energy efficiency devices to capital-intensive facilities, because of uncertainties about a technology’s return on investment, its viability and cost-effectiveness, the future costs of fuels, and other raw-material and construction costs. The mobilization of trillions of dollars of new capital between now and 2050 will be needed to transform our nation’s energy system, but such capital may be difficult to obtain from the private sector if the noted uncertainties are not attenuated. The current economic downturn further complicates matters: the limited availability of resources, especially capital, and the reduction in energy demand may be additional barriers to new-technology deployment.
-
The low turnover rate of the energy system’s capital-intensive infrastructure, which makes rapid change difficult. Failure to take advantage of windows of opportunity to deploy new technologies as infrastructure turns over could lock in older technologies for decades, and this difficulty is compounded by the long lead times for deploying new technologies, especially capital-intensive technologies. Thus, there is a premium on modifying or retrofitting existing infrastructure and on pushing new technologies to be ready for deployment when assets reach the end of their service lives. There are some technology “lock-ins,” however, that might not allow for future modification or improvements. Examples include new coal plants that cannot be easily retrofitted with CCS19 and new buildings that are not designed to use energy efficiently over their lifetimes.
-
Resource and supply barriers to technology deployment. They range, for example, from the limited availability of industrial capacity and skilled personnel for deploying the technologies to the availability of the biomass needed to expand the domestic production of liquid fuels.
-
Some of these barriers can be overcome with the right market and regulatory signals.
-
Uncertainties arising from the nature and timing of public policies and regulations related to carbon controls. There is no authoritative guidance on best available technologies for CCS that could be used to guide deployment. Such guidance might be similar to New Source Performance Standards developed under the Clean Air Act for criteria pollutants. The initial rates of deployment of reduced-carbon technologies (energy efficiency, renewable-energy sources, nuclear energy, and coal with CCS) can be accelerated by such guidelines, by a better alignment of incentives, and by some selected direct public investments.
-
Coupling the commercial deployment of energy-supply technologies with key supporting technologies. Examples include CCS both for electric-power generation and the production of transportation fuels; adequate dispatchable energy supplies or storage20 for advanced and expanded transmission and distribution systems; and advanced batteries for plug-in hybrid and battery-electric vehicles. Successful demonstration of the key supporting technologies will clearly be required, but so too will a better alignment of incentives and the resolution of a number of economic, legal, and policy questions.
-
The regional ownership and regulation of the transmission and distribution systems in the United States make it difficult to implement nation-wide modernizations. Although there are exceptions in some regions, the current regulatory system is not designed to adopt available and future innovations in the national transmission system because of fractured jurisdictions at the local, regional, and national levels, as well as an institutional culture that emphasizes quantity of service over reliability, quality, efficiency, and security. Additionally, the methods for assessing returns on private investment in the transmission system are unclear because, owing to the dispersed nature of electricity transmission, reliability and societal benefits extend beyond a single region.
-
The lack of energy efficiency standards for many products means that in many cases individual consumers must take the initiative to acquire
|
20 |
Dispatchable energy storage is a set of technologies for storing or producing electricity that can be deployed quickly (dispatched) into the grid when other power sources become unavailable. These technologies are described in Chapter 9. |
-
information about the costs and benefits of available energy efficiency technologies. Most consumers are unwilling or ill equipped to do so (see Box 2.2).
Overcoming these barriers will require a judicious mix of policies, regulations, and market incentives. A full analysis of the barriers, as well as of the means to overcome them, is beyond the scope of this AEF Phase I study. The National Academies will address many of these issues, however, in the project’s Phase II.
REFERENCES
Brown, R., S. Borgeson, J. Koomey, and P. Bremayer. 2008. U.S. Building-Sector Energy Efficiency Potential. Berkeley, Calif.: Lawrence Berkeley National Laboratory.
EIA (Energy Information Administration). 2008. Annual Energy Outlook 2008. DOE/EIA-0383(2008). Washington, D.C.: U.S. Department of Energy, Energy Information Administration.
EIA. 2009a. Annual Energy Outlook 2009. DOE/EIA-0383(2009). Washington, D.C.: U.S. Department of Energy, Energy Information Administration.
EIA. 2009b. Annual Energy Review 2008. DOE/EIA-0384(2008). Washington, D.C.: U.S. Department of Energy, Energy Information Administration.
NAS-NAE-NRC (National Academy of Sciences-National Academy of Engineering-National Research Council). 2009a. Electricity from Renewable Resources: Status, Prospects, and Impediments. Washington, D.C.: The National Academies Press.
NAS-NAE-NRC. 2009b. Liquid Transportation Fuels from Coal and Biomass: Technological Status, Costs, and Environmental Impacts. Washington, D.C.: The National Academies Press.
National Research Council. 2008. Transitions to Alternative Transportation Technologies—A Focus on Hydrogen. Washington, D.C.: The National Academies Press.


