
DIETARY REFERENCE INTAKES FOR PREGNANCY
TABLE B-1A Equations to Estimate Energy Requirement for Pregnant Women by Trimester
|
Estimated Energy Requirement (kcal/day) = Nonpregnant EER + Pregnancy Energy Deposition |
|
|
1st trimester |
EER = Nonpregnant (adolescent or adult) EER + 0 |
|
2nd trimester |
EER = Nonpregnant (adolescent or adult) EER + 340 |
|
3rd trimester |
EER = Nonpregnant (adolescent or adult) EER + 452 |
|
NOTE: EER = Estimated Energy Requirement. Use equations in Table B-1B to calculate non-pregnant EER. EER for adult women should be used for ages 19-50 years; EER for adolescent girls should be used for ages 9-18 years SOURCE: IOM, 2006. |
|
TABLE B-1B Equations to Calculate Estimated Energy Requirement (EER) for Nonpregnant Adolescents or Adult Women
|
14-18 Years of Age Estimated Energy Requirement (kcal/day) = Total Energy Expenditure + Energy Deposition EER = 135.3 − (30.8 × age [y]) + PA × [(10.0 × weight [kg]) + (934 × height [m])] + 25 |
|
19 Years and Older Estimated Energy Requirement (kcal/day) = Total Energy Expenditure EER = 354 − (6.91 × age [y]) + PA × [(9.36 × weight [kg]) + (726 v height [m])] |
|
NOTE: PA = Physical Activity Coefficient. Use equations in Table B-1C to calculate PA. SOURCE: IOM, 2006. |
TABLE B-1C Physical Activity Coefficients (PA values) for Use in EER Equations for Adolescents or Adult Women
|
|
Sedentarya (PAL 1.0-1.39) |
Low Activeb (PAL 1.4-1.59) |
Activec (PAL 1.6-1.89) |
Very Actived (PAL 1.9-2.5) |
|
14-18 Years of Age |
1.0 |
1.16 |
1.31 |
1.56 |
|
19 Years and Older |
1.0 |
1.12 |
1.27 |
1.45 |
|
NOTE: PAL = Physical Activity Level. aE.g., typical daily living activities (e.g., household tasks, walking to the bus). bE.g., typical daily living activities PLUS 30-60 minutes of daily moderate activity (e.g., walking at 5-7 km/h). cE.g., typical daily living activities PLUS at least 60 minutes of daily moderate activity. dE.g., typical daily living activities PLUS at least 60 minutes of daily moderate activity PLUS an additional 60 minutes of vigorous activity or 120 minutes of moderate activity. SOURCE: IOM, 2006. |
||||
TABLE B-2 Dietary Reference Intakes for Pregnant Women: Vitamins, Elements, Total Water, and Macronutrients in Alphabetical Order
|
Nutrient |
EARa |
ULd |
|
|
Biotin |
|||
|
14-18 y |
— |
30 μg/day |
— |
|
19-30 y |
— |
30 μg/day |
— |
|
31-50 y |
— |
30 μg/day |
— |
|
Boron |
|||
|
14-18 y |
— |
— |
17 mg/day |
|
19-30 y |
— |
— |
20 mg/day |
|
31-50 y |
— |
— |
20 mg/day |
|
Calcium |
|||
|
14-18 y |
— |
1,300 mg/day |
2.5 g/day |
|
19-30 y |
— |
1,000 mg/day |
2.5 g/day |
|
31-50 y |
— |
1,000 mg/day |
2.5 g/day |
|
Carbohydrate |
|||
|
14-18 y |
135 g/day |
175 g/day |
— |
|
19-30 y |
135 g/day |
175 g/day |
— |
|
31-50 y |
135 g/day |
175 g/day |
— |
|
Chloride |
|||
|
14-18 y |
— |
2.3 g/day |
3.6 g/day |
|
19-30 y |
— |
2.3 g/day |
3.6 g/day |
|
31-50 y |
— |
2.3 g/day |
3.6 g/day |
|
Choline |
|||
|
14-18 y |
— |
450 mg/day |
3.0 g/day |
|
19-30 y |
— |
450 mg/day |
3.5 g/day |
|
31-50 y |
— |
450 mg/day |
3.5 g/day |
|
Chromium |
|||
|
14-18 y |
— |
29 μg/day |
— |
|
19-30 y |
— |
30 μg/day |
— |
|
31-50 y |
— |
30 μg/day |
— |
|
Copper |
|||
|
14-18 y |
785 μg/day |
1,000 μg/day |
8,000 μg/day |
|
19-30 y |
800 μg/day |
1,000 μg/day |
10,000 μg/day |
|
31-50 y |
800 μg/day |
1,000 μg/day |
10,000 μg/day |
|
Fiber (Total) |
|||
|
14-18 y |
— |
28 g/day |
— |
|
19-30 y |
— |
28 g/day |
— |
|
31-50 y |
— |
28 g/day |
— |
|
Flouride |
|||
|
14-18 y |
— |
3.0 mg/day |
10 mg/day |
|
19-30 y |
— |
3.0 mg/day |
10 mg/day |
|
31-50 y |
— |
3.0 mg/day |
10 mg/day |
|
Nutrient |
EARa |
ULd |
|
|
Folatee |
|||
|
14-18 y |
520 µg/day |
600 µg/day |
800 µg/day |
|
19-30 y |
520 µg/day |
600 µg/day |
1,000 µg/day |
|
31-50 y |
520 µg/day |
600 µg/day |
1,000 µg/day |
|
Iodine |
|||
|
14-18 y |
160 µg/day |
220 µg/day |
900 µg/day |
|
19-30 y |
160 µg/day |
220 µg/day |
1,100 µg/day |
|
31-50 y |
160 µg/day |
220 µg/day |
1,100 µg/day |
|
Iron |
|||
|
14-18 y |
23 mg/day |
27 mg/day |
45 mg/day |
|
19-30 y |
22 mg/day |
27 mg/day |
45 mg/day |
|
31-50 y |
22 mg/day |
27 mg/day |
45 mg/day |
|
Linoleic acid |
|||
|
14-18 y |
— |
13 g/day |
— |
|
19-30 y |
— |
13 g/day |
— |
|
31-50 y |
— |
13 g/day |
— |
|
α-Linolenic Acid |
|||
|
14-18 y |
— |
1.4 g/day |
— |
|
19-30 y |
— |
1.4 g/day |
— |
|
31-50 y |
— |
1.4 g/day |
— |
|
Magnesiumf |
|||
|
14-18 y |
335 mg/day |
400 mg/day |
350 mg/day |
|
19-30 y |
290 mg/day |
350 mg/day |
350 mg/day |
|
31-50 y |
300 mg/day |
360 mg/day |
350 mg/day |
|
Manganese |
|||
|
14-18 y |
— |
2.0 mg/day |
9 mg/day |
|
19-30 y |
— |
2.0 mg/day |
11 mg/day |
|
31-50 y |
— |
2.0 mg/day |
11 mg/day |
|
Molybdenum |
|||
|
14-18 y |
40 µg/day |
50 µg/day |
1,700 µg/day |
|
19-30 y |
40 µg/day |
50 µg/day |
2,000 µg/day |
|
31-50 y |
40 µg/day |
50 µg/day |
2,000 ug/day |
|
Niacing |
|||
|
14-18 y |
14 mg/day |
18 mg/day |
30 mg/day |
|
19-30 y |
14 mg/day |
18 mg/day |
35 mg/day |
|
31-50 y |
14 mg/day |
18 mg/day |
35 mg/day |
|
Nickel |
|||
|
14-18 y |
— |
— |
1.0 mg/day |
|
19-30 y |
— |
— |
1.0 mg/day |
|
31-50 y |
— |
— |
1.0 mg/day |
|
Nutrient |
EARa |
ULd |
|
|
Pantothenic Acid |
|||
|
14-18 y |
— |
6.0 mg/day |
— |
|
19-30 y |
— |
6.0 mg/day |
— |
|
31-50 y |
— |
6.0 mg/day |
— |
|
Phosphorus |
|||
|
14-18 y |
1,055 mg/day |
1,250 mg/day |
3.5 g/day |
|
19-30 y |
580 mg/day |
700 mg/day |
3.5 g/day |
|
31-50 y |
580 mg/day |
700 mg/day |
3.5 g/day |
|
Potassium |
|||
|
14-18 y |
— |
4.7 g/day |
— |
|
19-30 y |
— |
4.7 g/day |
— |
|
31-50 y |
— |
4.7 g/day |
— |
|
Proteinh |
|||
|
14-18 y |
0.88 g/kg/day |
71 g/day |
— |
|
19-30 y |
0.88 g/kg/day |
71 g/day |
— |
|
31-50 y |
0.88 g/kg/day |
71 g/day |
— |
|
Riboflavin |
|||
|
14-18 y |
1.2 mg/day |
1.4 mg/day |
— |
|
19-30 y |
1.2 mg/day |
1.4 mg/day |
— |
|
31-50 y |
1.2 mg/day |
1.4 mg/day |
— |
|
Selenium |
|||
|
14-18 y |
49 µg/day |
60 µg/day |
400 µg/day |
|
19-30 y |
49 µg/day |
60 µg/day |
400 µg/day |
|
31-50 y |
49 µg/day |
60 µg/day |
400 µg/day |
|
Sodium |
|||
|
14-18 y |
— |
1.5 g/day |
2.3 g/day |
|
19-30 y |
— |
1.5 g/day |
2.3 g/day |
|
31-50 y |
— |
1.5 g/day |
2.3 g/day |
|
Thiamin |
|||
|
14-18 y |
1.2 mg/day |
1.4 mg/day |
— |
|
19-30 y |
1.2 mg/day |
1.4 mg/day |
— |
|
31-50 y |
1.2 mg/day |
1.4 mg/day |
— |
|
Vitamin Ai |
|||
|
14-18 y |
530 µg RAE/day |
750 µg RAE/day |
2,800 µg/day |
|
19-30 y |
550 µg RAE/day |
770 µg RAE/day |
3,000 µg/day |
|
31-50 y |
550 µg RAE/day |
770 µg RAE/day |
3,000 µg/day |
|
Vitamin B6 |
|||
|
14-18 y |
1.6 mg/day |
1.9 mg/day |
80 mg/day |
|
19-30 y |
1.6 mg/day |
1.9 mg/day |
100 mg/day |
|
31-50 y |
1.6 mg/day |
1.9 mg/day |
100 mg/day |
|
Nutrient |
EARa |
ULd |
|
|
Vitamin B12 |
|||
|
14-18 y |
2.2 μg/day |
2.6 μg/day |
— |
|
19-30 y |
2.2 μg/day |
2.6 μg/day |
— |
|
31-50 y |
2.2 μg/day |
2.6 μg/day |
— |
|
Vitamin C |
|||
|
14-18 y |
66 mg/day |
80 mg/day |
1,800 mg/day |
|
19-30 y |
70 mg/day |
85 mg/day |
2,000 mg/day |
|
31-50 y |
70 mg/day |
85 mg/day |
2,000 mg/day |
|
Vitamin D |
|||
|
14-18 y |
— |
5.0 μg/dayj |
50 μg/day |
|
19-30 y |
— |
5.0 μg/dayj |
50 μg/day |
|
31-50 y |
— |
5.0 μg/dayj |
50 μg/day |
|
Vitamin Ek |
|||
|
14-18 y |
12 mg/day |
15 mg/day |
8,00 mg/day |
|
19-30 y |
12 mg/day |
15 mg/day |
1,000 mg/day |
|
31-50 y |
12 mg/day |
15 mg/day |
1,000 mg/day |
|
Vitamin K |
|||
|
14-18 y |
— |
75 μg/day |
— |
|
19-30 y |
— |
90 μg/day |
— |
|
31-50 y |
— |
90 μg/day |
— |
|
Water (Total)l |
|||
|
14-18 y |
— |
3.0 L/day |
— |
|
19-30 y |
— |
3.0 L/day |
— |
|
31-50 y |
— |
3.0 L/day |
— |
|
Zinc |
|||
|
14-18 y |
10.5 mg/day |
12 mg/day |
34 mg/day |
|
19-30 y |
9.5 mg/day |
11 mg/day |
40 mg/day |
|
31-50 y |
9.5 mg/day |
11 mg/day |
40 mg/day |
|
NOTE: This table (taken from the DRI reports; see www.nap.edu) presents Recommended Dietary Allowances (RDA) in bold type or Adequate Intakes (AI) in ordinary type in Column 3. aEAR = Estimated Average Requirement. An EAR is the average daily nutrient intake level estimated to meet the requirements of half of the healthy individuals in a group. bRDA = Recommended Dietary Allowance. An RDA is the average daily dietary intake level sufficient to meet the nutrient requirements of nearly all (97-98 percent) healthy individuals in a group. It is calculated from an EAR. cAI = Adequate Intake. If sufficient scientific evidence is not available to establish an EAR, and thus calculate and RDA, an AI is usually developed. The AI for breast-fed infants is the mean intake. The AI for other life-stage groups and gender groups (except healthy breast-fed infants) is believed to cover the needs of all healthy individuals in the group, but a lack of data or uncertainty in the data prevents being able to specify with confidence the percentage of individuals covered by this intake. In the absence of a UL, extra caution may be warranted in consuming levels above recommended intakes. Members of the general population should be advised not to routinely exceed the UL. The UL is not meant to apply to individuals who |
|||
TABLE B-3 Acceptable Macronutrient Distribution Ranges
|
Macronutrient |
Range (percent of energy) |
|
|
4-18 y |
Adults |
|
|
Fat |
25-35 |
20-35 |
|
n-6 Polyunsaturated fatty acids* (linoleic acid) |
5-10 |
5-10 |
|
n-3 Polyunsaturated fatty acids* (α-linolenic acid) |
0.6-1.2 |
0.6-1.2 |
|
Carbohydrate |
46-65 |
46-65 |
|
Protein |
10-30 |
10-35 |
|
*Approximately 10 percent of the total can come from longer-chain n-3 or n-6 fatty acids. SOURCE: IOM, 2006. |
||
TABLE B-4 Additional Macronutrient Recommendations
|
Macronutrient |
Recommendation |
|
Dietary cholesterol |
As low as possible while consuming a nutritionally adequate diet |
|
Trans fatty acids |
As low as possible while consuming a nutritionally adequate diet |
|
Saturated fatty acids |
As low as possible while consuming a nutritionally adequate diet |
|
Added sugars* |
Limit to no more than 25% of total energy |
|
*Not a recommended intake. A daily intake of added sugars that individuals should aim for to achieve a healthful diet was not set. SOURCE: IOM, 2006. |
|
TABLE B-5 Estimated Healthy Eating Index-2005 Component and Total Scores, United States (1994-1996 and 2001-2002)
|
Component (maximum score) |
1994-1996 Score (95% CI) |
2001-2002 Score (95% CI) |
|
Total fruit (5) |
3.1 (3.0, 3.3) |
3.1 (2.9, 3.3) |
|
Whole fruit (5) |
4.5 (4.3, 4.7) |
3.4 (3.2, 3.7)* |
|
Total vegetables (5) |
3.6 (3.6, 3.7) |
3.2 (3.1, 3.4)* |
|
Dark green and orange vegetables and legumes (5) |
1.4 (1.4, 1.5) |
1.4 (1.2, 1.5) |
|
Total grains (5) |
5.0 (5.0, 5.0) |
5.0 (5.0, 5.0) |
|
Whole grains (5) |
1.2 (1.2, 1.2) |
1.0 (1.0, 1.1)* |
|
Milk (10) |
5.9 (5.7, 6.2) |
6.3 (6.0, 6.5)* |
|
Meat and beans (10) |
10.0 (9.9, 10.0) |
10.0 (10.0, 10.0) |
|
Oils (10) |
6.0 (5.8, 6.2) |
6.8 (6.5, 7.1)* |
|
Sodium (10) |
3.2 (3.1, 3.3) |
4.1 (3.9, 4.2)* |
|
Saturated fat (10) |
6.5 (6.4, 6.7) |
6.4 (6.1, 6.7) |
|
Calories from solid fat, alcohol, and added sugar (20) |
7.8 (7.5, 8.2) |
7.5 (6.9, 8.1) |
|
Total HEI-2005 score (100) |
58.2 (57.2, 59.2) |
58.2 (56.6, 59.9) |
|
NOTES: Excludes children under 2 years of age and breast-fed children. *Significantly different (p < 0.05). SOURCE: Nutrition Insight 37, USDA, available online at http://www.cnpp.usda.gov/Publications/NutritionInsights/Insight37.pdf [accessed April 16, 2009]. |
||
TRENDS IN ENERGY INTAKE AND MARKERS OF ENERGY DENSITY
As the prevalence of obesity rises among childbearing-aged women and women entering pregnancy, important shifts in diet and physical activity have also occurred. In a recent study, Nielsen and colleagues (2002) used nationally representative data from the 1977-1978 Nationwide Food Consumption Survey and the 1989-1991 and 1994-1996 Continuing Surveys of Food Intake by Individuals to investigate the trends in total energy intake and energy intake by meal pattern type (Figure B-1). Data were stratified by age but not sex. These investigators found that among U.S. adults aged 19-39 years, there was an 18 percent increase in total energy intake over the 20-year period (1856 to 2198 kcal/d). When separated into energy from meal pattern type, the major contributor to this overall increase in energy intake was a sharp 58 percent increase in energy from snacks (244-387 kcal/d). Additionally, the percent of total energy from key food groups, such as salty snacks, sweetened beverages, candy, pizza, French fries, cheeseburgers, and Mexican-style food, increased between survey years 1977-1978 and 1994-1996.
These authors further investigated trends in beverage intake using the aforementioned data sources plus the 1999-2001 nationally-representative NHANES. For all age groups, including adults aged 19 to 39 years, sweet-
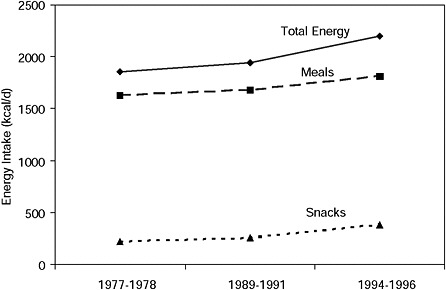
FIGURE B-1 Trends in energy intake and meal pattern type, U.S. adults aged 19-39 years.
SOURCE: Nielsen et al., 2002.
ened beverage intake increased and milk consumption decreased between survey years 1977-1978 and 1999-2001 (Figure B-2) (Nielsen and Popkin, 2004). Specifically, energy from soft drinks nearly tripled (2.8 to 7.0 percent [approximately 50 to 144 kcal per person per day]), energy from fruit drinks doubled (1.1 to 2.2 percent [from 20 to 45 kcal per person per day]), and energy from milk decreased (8.0 to 5.0 percent [from 143 to 99 kcal per person per day]).
Taken together, these findings illustrate an increase in consumption of foods of low nutrient density in the general population. This has special implications for pregnancy and lactation, which require modest increases in energy intake but proportionally greater increases in vitamin and mineral intake.
The U.S. Dietary Guidelines represent federal nutrition policy. The recommendations of the Dietary Guidelines are interpreted for use by healthy Americans over 2 years of age in MyPyramid (available online: http://www.MyPyramid.gov [accessed October 16, 2008]). The current MyPyramid recommends that females aged 14-18 years and 31-50 years consume 8 combined servings of fruits and vegetables, while 9 combined servings is recommended for females aged 19-30 years. MyPyramid also makes more specific recommendations about types of vegetables, including dark green and orange vegetables, and legumes to ensure consumption of the variety of nutrients available from these foods. When the Guenther et al. (2006) exam-
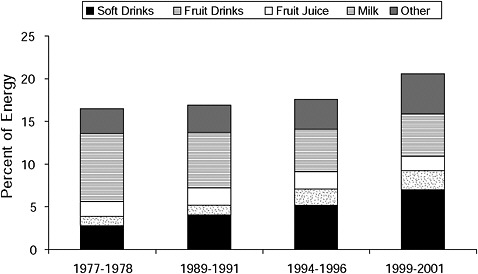
FIGURE B-2 Trends in U.S. beverage consumption 1977-2001: percent of total energy intake.
SOURCE: Nielsen and Popkin, 2004.
ined sub-groups of vegetables, mean intakes for childbearing-aged women were below the recommended amounts for all subgroups except for starchy vegetables (Figure B-3). These data clearly illustrate that childbearing-aged women failed to meet recommendations for fruits and vegetables.
Another method of quantifying the overall quality of American’s diets is through the use of the Healthy Eating Index-2005 (HEI-2005), a tool designed to measure compliance of diets with the key, diet-related recommendations of the 2005 Dietary Guidelines for Americans (HHS/USDA, 2005). The HEI-2005 has 12 components, as seen in Table B-5 (Guenther et al., 2006). For most components, higher intakes result in higher scores. Note, however, that for three components, saturated fat, sodium, and calories from solid fats, alcoholic beverages, and added sugars (SoFAAS), lower intake levels result in higher scores because lower intakes are more desirable. Monitoring changes in the HEI-2005 scores can provide a method for nutrition surveillance in the population.
In a recent analysis, trends in the HEI-2005 scores and its components were published for all Americans two years of age and older (subgroups of the population were not studied). From 1994-1996 to 2001-2002, there was little change in either overall HEI-2005 score or its components. The average HEI-2005 score was 58.2 out of 100 possible points in both time periods. American’s diets consistently met recommendations for the groups “Total Grains” and “Meat and Beans,” but were far below the maximum
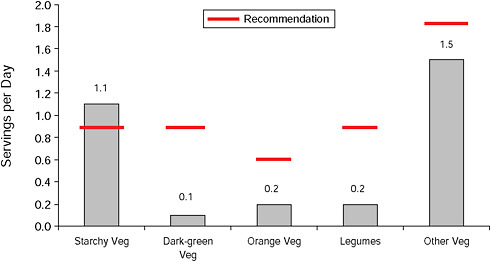
FIGURE B-3 Mean daily intakes of vegetables by subtype among U.S. females 19-30 years of age.
SOURCE: Guenther et al., 2006.
score for the groups, “Dark Green and Orange Vegetables” and “Legumes” as well as whole grains. Intakes from SoFAAS were well below the recommendations, as reflected in low scores on these components. From 1994-1996 to 2001-2002 the HEI-2005 score declined for the groups “Whole Fruit,” “Total Vegetables,” and “Whole Grains” while the score for the groups “Milk,” “Oils,” and “Sodium” improved.
Some of these dietary pattern changes may be a result of the trend toward obtaining a greater proportion of food outside the home. Self-reported dietary data from national surveys was used to show that the percentage of total energy intake obtained from foods consumed at home decreased from 77 in 1977-1978 to 65 percent from 1994-1996 (Figure B-4) (Nielsen et al., 2002). The amount of energy obtained from foods consumed from restaurants, including fast food establishments, doubled from 9 to 21 percent during this same period.
The aforementioned analysis relied on dietary intake data obtained from surveys. There is no “gold standard” method of assessing dietary intakes in individuals, and all self-reported dietary intake data have inherent biases. Therefore food supply data, collected directly from food producers and distributors, are often used to examine trends in American dietary patterns. The estimates are adjusted for spoilage, cooking losses, plate waste, and other food losses accumulated throughout the marketing system and
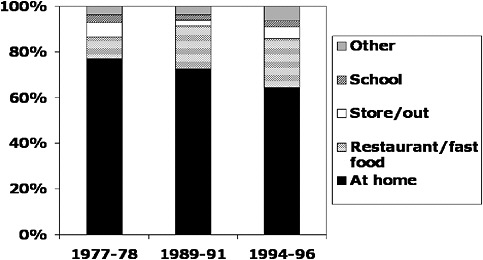
FIGURE B-4 Trends in energy intake (percent energy) by location, Americans aged 2+ years.
SOURCE: Nielsen et al., 2002.
the home. Analysis of trends in food supply data provide the same conclusions regarding trends in increasing energy intake and overall diet quality of Americans as self-reported survey data.
The most recent loss-adjusted annual per capita food supply data analyses by the USDA’s Economic Research Service suggests a 12 percent increase in total energy intake (~300 kcal per person per day) from 1985 to 2000 (USDA, 2002; available online: http://www.ers.usda.gov/publications/FoodReview/DEC2002/frvol25i3a.pdf [accessed April 16, 2009]) (Figure B-5). Of the 300-kcal increase, grains (mainly refined grains) accounted for 46 percent; added fats, 24 percent; added sugars, 23 percent; fruits and vegetables, 8 percent of the increase. At the same time, energy intake from the meat and dairy groups together declined by 1 percent. When the per capita food supply data in 2000 was compared with the 1992 Food Guide Pyramid recommendations as a marker of overall diet quality, intakes exceeded recommendations for grains, meats, added fats, and added sugars, and fell below recommendations for dairy, fruits, and non-starchy vegetables (USDA, 2002; available online: http://www.ers.usda.gov/publications/FoodReview/DEC2002/frvol25i3a.pdf [accessed April 16, 2009]).
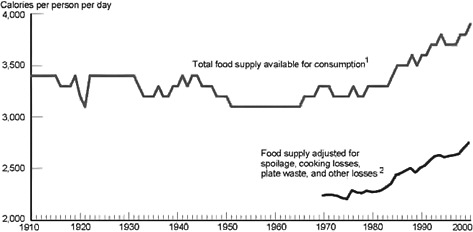
FIGURE B-5 Energy from the U.S. per capita food supply (adjusted for losses).
1Rounded to the nearest hundred.
2Not calculated for years beyond 1970.
SOURCE: USDA, 2002; available online at http://www.ers.usda.gov/publications/FoodReview/DEC2002/frvol25i3a.pdf [accessed April 16, 2009].
REFERENCES
Guenther P. M., K. W. Dodd, J. Reedy and S. M. Krebs-Smith. 2006. Most Americans eat much less than recommended amounts of fruits and vegetables. Journal of the American Dietetic Association 106(9): 1371-1379.
HHS/USDA (U.S. Department of Health and Human Services/United States Department of Agriculture). 2005. Dietary Guidelines for Americans, 2005. 6th Edition. Washington, DC: Government Printing Office.
IOM (Institute of Medicine). 2006. Dietary Reference Intakes: The Essential Guide to Nutrient Requirement. Washington, DC: The National Academies Press.
Nielsen S. J. and B. M. Popkin. 2004. Changes in beverage intake between 1977 and 2001. American Journal of Preventive Medicine 27(3): 205-210.
Nielsen S. J., A. M. Siega-Riz and B. M. Popkin. 2002. Trends in energy intake in U.S. between 1977 and 1996: similar shifts seen across age groups. Obesity Research 10(5): 370-378.
Websites:
http://www.cnpp.usda.gov/Publications/NutritionInsights/Insight37.pdf
http://www.ers.usda.gov/publications/FoodReview/DEC2002/frvol25i3a.pdf


