
1
Introduction
The uses of energy have evolved as humans have changed patterns of energy consumption. Although renewable resources such as wind, water, and biomass were the first sources of energy tapped to provide heat, light, and usable power, it was the energy stored in fossil fuels and, more recently, nuclear power that fueled the tremendous expansion of the U.S. industrial, residential, and transportation sectors during the 20th century. But as fossil-fuel consumption has increased, a result of population growth and growth in our standard of living, so have the concerns over energy security and the negative impacts of greenhouse gases on the environment. Volatilities in foreign energy markets affecting fuel prices and availability have long raised the issue of domestic energy security. In addition, recent concerns over the limited supply of fossil fuels and the greenhouse gases released by fossil-fuel combustion have spurred efforts to utilize renewables resources—wind, sunlight, biomass, and geothermal heat—to meet U.S. energy demands. At this time, renewable sources of energy, or renewables, have enormous potential to reduce the negative impacts of energy use and to increase the domestic resource base. The fundamental challenge is collecting the energy in renewable resources and converting it to usable forms at the scales necessary to allow renewables to contribute significantly to domestic energy supply.
A central issue for future U.S. energy systems is the role that renewable resources will play in electricity generation. Renewable electricity presents a significant opportunity to provide domestically produced, low carbon dioxide (CO2)–emitting power generation and concomitant economic opportunities. Although renewable electricity generation has increased over the past 20 years, the percentage of U.S. electricity generation from non-hydroelectric renewable
sources remains small. Though continued technological advances are critical, economic, political, and deployment-related factors and public acceptance also are key factors in determining the contribution of renewable electricity. Meeting the opportunity that renewables offer to improve the environment and energy and economic security will require a huge scale-up in deployment and increased costs over current fossil-fuel generating technologies. Additional requirements include the capacity to more efficiently manufacture and deploy equipment for the generation of electricity from renewables and policies that have a positive impact on the competitiveness of renewables and the ease of integration of renewables into the electricity markets.
BACKGROUND
Recent History
Box 1.1 outlines a history of major policy milestones for renewables. Martinot et al. (2005) separate the history of non-hydropower renewables policy into three distinctive phases. In response to the oil crisis and price shocks in the late 1970s, significant federal research funding was directed toward development of multiple alternative sources of energy and toward renewable resources in particular. The PURPA era was inaugurated with the passage of the Public Utility Regulatory Policies Act (PURPA) of 1978, which required public utilities to purchase power from qualifying renewable and combined heat and power facilities. In addition, state tax incentives, such as those offered in California and Colorado, provided further impetus to increase the use of renewables.
A period of stagnation followed the late 1970s. Progress in the development of renewables slowed as energy prices declined. Financial incentives were cut, and the electric power sector entered a period of restructuring. The mid-1980s saw a decrease in real prices for natural gas (Figure 1.1), which spurred considerable growth in the development of natural-gas-fired electricity generation plants. In addition, the annual growth in electricity demand slowed from an average of 6 percent during the 1960s and 1970s to less than 3 percent in the 1980s (EIA, 2008a). This drop reduced the price for renewables paid under PURPA. Martinot et al. (2005) note that this period lasted from about 1990 to 1997, and only a very small amount of non-hydroelectric renewables development occurred during that period.
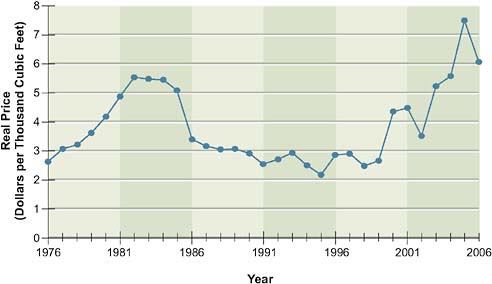
FIGURE 1.1 Average price for natural gas for the electric power sector.
Source: EIA, 2008a.
Era of Strong Growth
Since the late 1990s, renewables have begun an era of strong growth in the United States, albeit from a small base. The amount of electricity produced from wind in particular began to increase, owing to advances in technology as well as favorable policies. Wind power electricity generation increased at a compounded annual growth rate of more than 20 percent from 1997 and 2006 and of more than 30 percent from 2004 to 2006 (EIA, 2008a). Solar photovoltaics (PV) have also seen similar growth rates in generation capacity in the United States. In 2008, non-hydropower renewables accounted for 3.4 percent of total electricity generation, up from 2.5 percent in 2007 (EIA, 2009). More details on the electricity capacity and the generation contributions from individual renewables are presented below in this chapter.
State Policies
Renewable Portfolio Standards
The generation of electricity from renewables has increased in part because of the effects of state-based policies adopted during the restructuring of many domestic electricity markets. One prominent policy mechanism for increasing the level of
renewable electricity generation is the renewables portfolio standard (RPS), also known as the renewable energy standard. Typically, an RPS requires a specific percentage as the minimum share of the electricity produced (or sold) in a state that must be generated by some collection of eligible renewable technologies. The policies vary in a number of ways, such as the sources of renewables included; the form, timeline, and stringencies of the numerical goals; the extent to which utility-scale and end-use types of renewables are specified; and whether the goals include separate targets for particular renewable technologies.
As of 2008, 27 states and the District of Columba had RPSs, and another 6 states had voluntary programs (Figure 1.2). Wiser and Barbose (2008) estimate that full compliance with those RPSs will require an additional 60 GW of new
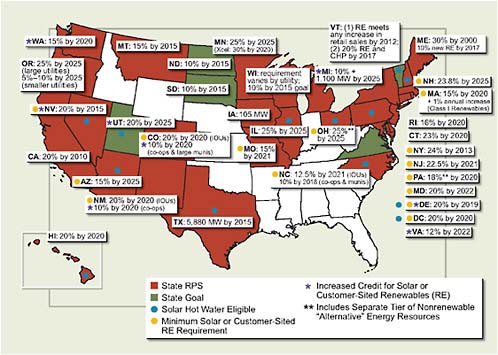
FIGURE 1.2 Map of state renewable portfolio standards.
Source: Database of State Incentives for Renewables and Efficiency, available at http://www.dsireusa.org. Courtesy of N.C. Solar Center at North Carolina State University and the Interstate Renewable Energy Council.
renewable electricity capacity by 2025. The actual RPS mandates vary from state to state. Maryland’s RPS, for example, requires 9.5 percent renewable electricity by 2022, whereas California’s requires 20 percent by 2010. Maine’s original RPS required that 30 percent of all electricity be generated from renewable resources by 2000 and was later extended to require that new renewable energy capacity increase by 10 percent. Table D.1 in Appendix D shows details of these standards, including the timing for compliance, each standard’s stringency, and the types of renewables covered. One element that varies among different standards is how each standard applies to specific sources of renewable energy.1 Figure 1.3 shows the RPSs with specific requirements for electricity generation from solar and other distributed renewable resources.
Because of the variability in RPSs and the fact that they do not involve a direct cost, in contrast to the federal renewables production tax credits (PTCs; discussed below in the section titled “Federal Policies”), it is difficult to formulate a general assessment of the performance and electricity price impacts of state RPSs (Rickerson and Grace, 2007; Wiser and Barbose, 2008). Of the states that could be evaluated, Wiser and Barbose (2008) estimated that 9 of 14 were meeting their RPS requirements. However, state RPS policies are relatively recent and still evolving, and so experience with compliance remains limited. Two studies that have modeled the effectiveness of RPSs are Palmer and Burtraw (2005) and Dobesova et al. (2005). Palmer and Burtraw (2005) found that a national RPS was more cost-effective in promoting renewables than was a PTC or a carbon cap-and-trade policy that allocated allowances to all generators, including generators using renewables, on the basis of production costs. That study also found that the cost of implementing an RPS rose substantially when the standard for percentage of energy generated from renewables increased from 15 percent to 20 percent. Dobesova et al. (2005) found that under the Texas RPS the cost per ton of CO2 emissions reduced was approximately the same as that with a pulverized coal plant with carbon capture and storage (CCS) or with a natural gas combined cycle plant with CCS, and was less cost-effective compared to an integrated coal gasification combined cycle plant with CCS (although the panel notes that no pulverized coal plants with CCS have been constructed and that cost estimates for
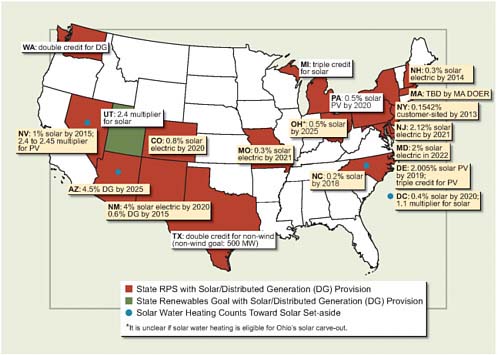
FIGURE 1.3 Solar and distributed generation requirements within state renewables portfolio standards.
Source: Database of State Incentives for Renewables and Efficiency, available at www.dsireusa.org. Courtesy of N.C. Solar Center at North Carolina State University and the Interstate Renewable Energy Council.
such facilities are thus highly speculative). Chapter 4 provides more details on the economic impacts of and market compliance strategies for RPSs.
Other State Policies
Other examples of state policies affecting renewable electricity generation include public benefit funds, net metering, green power purchasing agreements, tax credits, rebates, low-interest loans, and other financial incentives. Public benefit funds typically collect a small surcharge on electricity sales and specify that the funds so raised must be used for renewables. In 2004 such funds were investing more than $300 million annually in renewable energy and are expected to collect more than
$4 billion for renewable energy cumulatively by 2017. An example from California is the program to subsidize rooftop PV systems for households and businesses, supported by the state’s public benefit fund. Through California’s Solar Initiative program, PV projects yielding 300 MW have been funded in 2007 and 2008 at a cost to California of $775 million in incentives, resulting in a total estimated project value of almost $5 billion considering private investments (CPUC, 2009). Net metering policies enable two-way power exchanges between a utility and individual homes and businesses—excess electricity generated by small renewable power systems installed in residences and businesses can be sold by the systems’ owners back to the grid. Between 1996 and 2004, net metering policies were enacted in 33 states, bringing the total number of states with net metering to 39. Voluntary green power purchases allow consumers through a variety of state and utility programs to purchase electricity that comes from renewable resources. Between 1999 and 2004, more than 500 utilities in 34 states began to offer their retail customers the option to buy green power. Mandates that required utilities to offer green power products were enacted in 8 states between 2001 and 2007.2
Federal Policies
Production and Investment Tax Credits
Federal policies also contributed to the strong growth of renewables from the late 1990s onward. The major incentive for increasing electricity generation from renewable resources, particularly wind power, is the federal renewable electricity production tax credit. The PTC currently (in 2009) provides a 2.1¢ tax credit (originally passed as a 1.5¢ credit adjusted for inflation) for every kilowatt-hour of electricity generated in the first 10 years of the life of a private or investor-owned renewable electricity project. Originally established in the Energy Policy Act of 1992 for wind and closed-loop biomass plants brought on line between 1992 and 1993, respectively, the PTC was extended to January 1, 2002, and expanded to include poultry waste facilities in the Tax Relief Extension Act of 1999. The Economic Security and Recovery Act of 2001 included a 2-year extension of the PTC to 2004, and it was again extended in the Energy Policy Act of 2005 to apply through December 31, 2007. The PTC was extended further by the
|
2 |
For information on the DOE Energy Efficiency and Renewable Energy (EERE) Green Power Network, see http://apps3.eere.energy.gov/greenpower. |
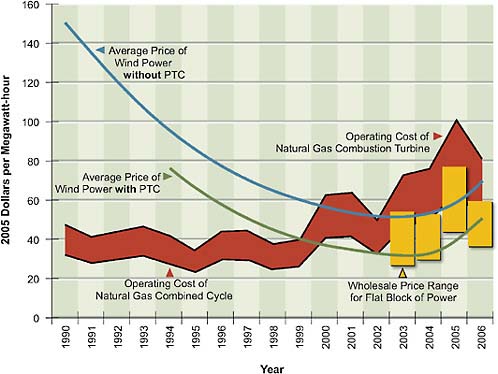
FIGURE 1.4 Impacts of the production tax credit on the price of wind power compared to costs for natural-gas-fired electricity.
Source: Wiser, 2008.
Tax Relief and Health Care Act of 2006 to apply through the end of 2008. The impact of the PTC on the competitiveness of wind power is shown in Figure 1.4.
Congress most recently extended the PTC and expanded incentives in the Emergency Economic Stabilization Act of 2008 and the American Recovery and Reinvestment Act (ARRA) of 2009. The 2008 bill added an 8-year extension (until 2016) of the 30 percent solar investment tax credit for commercial and residential installations and approved $800 million in bonds to help finance energy efficiency projects. The 2008 and 2009 bills together extend the PTC for wind through 2012 and the PTC for municipal solid waste, qualified hydropower, biomass, geothermal, and marine and hydrokinetic renewable energy facilities through 2013. Because of concerns that the current slowdown in business activity will reduce the capabilities of projects to raise investment capital, the ARRA
allows owners of non-solar renewable energy facilities to elect a 30 percent investment tax credit rather than the PTC.
In contrast to the costs for RPSs, the costs of the PTC and other tax incentives for renewables are more straightforward to estimate, although there is some variability in the estimates.3 The EIA estimates that the total federal subsidy and support for wind power in fiscal year 2007, primarily through the PTC, was $724 million, or approximately 2.3¢/kWh (EIA, 2008b). The estimate of the cost of the PTC alone ranges from $530 million to $660 million (EIA, 2008b). The Government Accountability Office (GAO) estimates that, from fiscal year 2002 through fiscal year 2007, revenue of $2.8 billion was foregone by the U.S. Treasury because of the Clean Renewable Energy bond tax credits, the exclusion of interest on energy facility bonds, and the new technology tax credits for renewable electricity production (the PTC) and renewable energy investment (GAO, 2007). The largest proportion of this expenditure was for the PTC and the much smaller renewable energy investment tax credit.
A study by GE Energy Financial Services examined the lifetime tax costs and revenues for the U.S. Treasury from the 5.2 GW of new wind power that came on line in 2007 (Taub, 2008). The study looked at both the costs of the PTC and the value of the accelerated depreciation allowed for wind power projects, and it offset those costs with revenues from increases in property taxes and other sources. It found that the lifetime costs of the PTC for the 5.2 GW of wind renewable electricity had a net present value in 2007 of $2.5 billion, which was offset by the estimated net present value of $2.75 billion obtained from taxes on the project and related economic activity. The largest source of revenue for the federal government from its investment in renewable electricity is the tax on project income, whereby the lifetime revenue stream is reduced to include the effect of 5-year Modified Accelerated Cost Recovery System depreciation.4 Chapter 4 pro-
|
3 |
Note that if the RPS policy includes tradable renewable energy credits (RECs, discussed in more detail in Chapter 4) then the price of the RECs provides a measure of the subsidy to renewable generators from the RPS program that is somewhat analogous to the cost to taxpayers of the PTC. However, not all RPS programs include tradable RECs. It should be noted that the real cost to the economy of either type of policy (RPS or PTC) is more complicated than either the cost of RECs or the value of the PTC. |
|
4 |
Several renewable technologies (wind, solar, geothermal, and small biomass generators) are also eligible for accelerated depreciation, which allows depreciation of their capital costs over 5 years instead of the 20-year lifetime depreciation for most fossil generators (15 years for new nuclear). This benefit allows project owners to reduce the taxes on income in the early years of |
vides additional discussion of the PTC, including its impacts on new wind power generation.
Other Recent Initiatives
The ARRA offers other benefits for renewable electricity, including $2.5 billion for applied research, development, and deployment activities of the Department of Energy (DOE) Office of Energy Efficiency and Renewable Energy (EERE). This amount includes $800 million for the Biomass Program and $400 million for the Geothermal Technologies Program. Separate from the EERE portion is $400 million set-aside to establish the Advanced Research Projects Agency–Energy (ARPA–E) to support innovative energy research. The bill also includes $6 billion to support loan guarantees for renewable energy and electric transmission technologies, which is expected to guarantee more than $60 billion in loans. Finally, there is a significant focus on updating the nation’s electrical grid. The ARRA budgeted a total of $11 billion to modernize the nation’s electricity grid and required a study of the transmission issues facing renewable energy.
Current Policy Motivations
In the absence of a price on carbon, generating electricity from non-hydropower renewable resources generally is more expensive than generating electricity from coal, natural gas, or nuclear power at current costs. The exception recently has been wind power’s competitiveness with electricity generated using natural gas. But there are other reasons that policy makers would choose to encourage research on, and development and deployment of, renewables. Greenhouse gas emissions from the combustion of fossil fuels are a growing concern. When burned to generate electricity, fossil fuels such as coal and to a lesser extent natural gas release large amounts of CO2 and other greenhouse gases into the atmosphere. For example, according to the Energy Information Administration (EIA), energy-related CO2 emissions from fossil fuel use in the United States amounted to almost 6000 million metric tons in 2007 (EIA, 2008a). The concentration of these gases in the atmosphere has very likely led to the increase in global average temperatures observed in recent decades. Increasing atmospheric concentrations of
CO2 have been forecast to have a variety of impacts on the environment, including sea level rise, an increase in ocean acidification, and rapid changes in ecosystem ranges. In 2006, 69 percent of the electricity generated in the United States was produced by the combustion of fossil fuels (EIA, 2008a). Energy sources with low greenhouse gas emissions are an important component of strategies that aim to reduce or even maintain current levels of greenhouse gas emissions. Electricity generated from renewable resources in particular can contribute to this effort, because renewables can produce electricity without significant quantities of greenhouse gas emissions.
Another motivation for increasing the percentage of domestic electricity generated from renewables is energy security. Although 74 percent of the U.S. electricity generated from fossil fuels is produced from coal, an abundant resource in the United States, nearly all of the energy needed for the transportation sector is produced from oil (EIA, 2008a). Approximately 65 percent of the oil used in the United States is imported, often from politically unstable regions of the world (EIA, 2008a). Although this panel’s report does not address the transportation sector, it is worth noting that with the advent of technologies such as electric and plug-in hybrid vehicles and concepts for using electricity from renewable resources to produce chemical fuels such as hydrogen, renewable electricity from a variety of sources has the potential in the long run to contribute to fueling the transportation sector.5 Because the United States has some of world’s most abundant solar, wind, biomass, and geothermal resources, renewables may help to secure supplies of domestic energy for all sectors.
Future Policy Era
Given the confluence of concerns over climate change and domestic energy security, as well as volatilities in energy prices, it is likely that over the next few years the United States will enter a new era of energy-related policymaking, including development of policies that will directly or indirectly affect production of electricity from renewable resources. Such concerns motivated the passage of the above-mentioned Energy Independence and Security Act of 2007, which raised vehicle fuel economy standards for the first time in almost 30 years and mandated the use
|
5 |
The use of domestic biomass to produce alternative liquid fuels for transportation is the subject of the report by the Panel on Alternative Liquid Transportation Fuels (NAS-NAE-NRC, 2009b). The relationship of that panel to the Panel on Electricity from Renewable Resources is discussed later in this chapter and is also shown in Appendix A. |
of a large amount of biofuels for transportation; and the Emergency Economic Stabilization Act of 2008, which extended federal incentives for several kinds of renewable electricity and created additional incentives for solar and efficiency projects.
Several potential policy mechanisms might prove relevant to electricity generation from renewable resources. One such mechanism is a federal RPS, an approach that was considered for the Energy Independence and Security Act of 2007 but ultimately dropped from the legislation. There also have been recent initiatives with bipartisan support that have targeted U.S. greenhouse gas emissions. Policy options include a carbon tax or fee, under which electricity generators are required to pay a certain tax or fee per ton of CO2 released to the atmosphere, and a cap-and-trade scheme, in which the government issues permits and sets a cap on the total amount of CO2 that may be emitted. Under a cap-and-trade system, emitters could be allocated permits or required to purchase permits to cover their carbon emissions. Those who would need to increase their emissions might purchase credits either from those who have decreased their emissions or through some other market. The method of allocating permits can have major impacts on the deployment of renewables. Another method of distributing permits is for them to be auctioned to emitters and other participants. Another possible policy is the state or federal adoption of a carbon portfolio standard, which would require that all electricity suppliers meet an overall constraint on their carbon emissions rate. A carbon portfolio standard allows individual emitters to purchase low-carbon energy from any source and to seek out the lowest price. The role that renewable energy will play in any carbon regulatory system is unclear. Issues to be resolved include how RPSs are designed and integrated into cap-and-trade systems, whether generators using renewables will be issued allowances, and whether carbon caps will be sufficiently powerful to increase the markets for renewable energy in the near, mid, or long term.
CURRENT STATUS OF RENEWABLE ELECTRICITY GENERATION
U.S. Electricity Generation
The U.S. electricity sector generated 4.16 million GWh in 2007, almost 90 percent of which came from a combination of coal (49 percent), natural gas (21 percent), and nuclear (19 percent) facilities. Preliminary estimates for 2008 show a slight
decline in total electricity generation to 4.12 million GWh (EIA, 2009). The compound annual growth rate for the 1999–2008 time period is about 1 percent (EIA, 2009).
The U.S. electricity sector’s primary suppliers are more than 3000 utilities that operate under different market structures, depending on local and regional regulations.6 In addition, more than 2000 other, non-utility, large power producers supply electricity to the grid. Traditionally, electricity was generated, transmitted, and distributed to users through vertically integrated utilities. However, efforts that began in the 1970s opened up electricity generation to more potential producers, and, since the early 1990s, many states have deregulated their electricity systems and have separated generation of electricity from its transmission and distribution. This shift has created different types of renewable electricity ownership structures and markets, which are described in more detail in Chapter 6. In general, the opening up of the electricity market can improve both the integration of renewables into the market and the ability to incorporate greater geographical diversity in the renewables mix.
In the late 1990s, the restructuring of the electricity sector led to a period of underinvestment in the electricity transmission system, principally due to uncertainty about the rate of return that would be allowed for investments in transmission (EPRI, 2004). This lapse created the present need to modernize the transmission and distribution system. It also has slowed the growth in transmission capacity needed to connect renewables. For example, California has 13,000 MW of potential solar projects waiting for approval to be connected to the grid as of January 2009 (AWEA/SEIA, 2009). As discussed above, the need to increase investment in the grid, including investments for renewables, began to be addressed in the ARRA of 2009.
U.S. Renewable Electricity
Renewables currently represent a small fraction of total U.S. electricity generation. The following statistics, including those for renewable electricity generation, come from the EIA (2008c). In total, renewable resources supplied 8.4 percent of
|
6 |
The electric power sector includes electric utilities, independent power producers, and large commercial and industrial generators of electricity. A smaller amount of total electricity (approximately 4 percent) is generated by end users in the commercial, industrial, and residential sectors. Most of the end-user-generated electricity is consumed on-site, though a small amount may be sold to the electricity grid. |
the total U.S. electricity generated, and non-hydroelectric renewables supplied 2.5 percent. Conventional hydroelectric power is the largest source of renewable electricity in the United States, generating 6.0 percent of the total electricity produced in 2007 by the U.S. electric power sector. Hydropower represents 71 percent of the electricity generated from renewable resources and in 2007 produced almost 250,000 GWh of electricity. Note that several state RPSs exclude hydropower as an acceptable renewable resource for meeting the state’s target. Biomass electricity generation (biopower) is the second largest source, generating 55,000 GWh in 2007, corresponding to 16 percent of generation from renewables.7 Biomass is unique because 52 percent of all biomass electricity generation comes from the industrial sector as opposed to the electric power sector.
Both hydropower and biomass have not grown much in terms of generation or generation capacity since 1990. Hydropower production, which is linked to widespread hydrologic conditions that can vary from year-to-year, dropped from a high of 356,000 GWh in 1997 to 216,000 GWh in 2001. Electricity generation from hydropower in 2007 was essentially the same as it was in 1992 (253,000 GWh), and hydropower generating capacity has remained generally constant since 1990. Electricity generation from biomass grew at an annual average rate of 1.1 percent from 1990 to 2006. Potential ecological concerns over existing hydropower plants, along with the 2007 Energy Independence and Security Act’s mandates for biofuels for transportation, have led to uncertainty about whether either hydropower or biopower will yield greatly increased electrical generation in the foreseeable future.
Wind technology has progressed over the last two decades, and wind power has accounted for an increasing fraction of electricity generation in the United States. Although it now represents only about 1 percent of total U.S. electricity generation, wind power has grown at a 14 percent compound annual growth rate from 1990 to 2006 and at a 23 percent compound annual growth rate from 1997 to 2006. In 2007, wind power supplied more than 32,000 GWh of electricity, almost 5,500 GWh more than it had the year before (EIA, 2008a). EIA’s preliminary estimate puts wind power electricity generation in 2008 at more than 52,000 GWh (EIA, 2009). An additional 5,200 MW of wind power generation capacity was installed in 2007, which represented 35 percent of all new generating capacity. Data for 2008 indicate that wind power generating capacity increased by more
than 8,400 MW, breaking the record set in 2007 for largest annual installed wind power capacity (AWEA, 2008, 2009).8 The growth in generating capacity was particularly strong in the western United States. Texas, the leader in U.S. wind power generation, added 2,760 MW of new capacity in 2008, for a total wind power generation capacity of 7,116 MW. Iowa more than doubled its wind capacity in 2008 by installing 1,517 MW on top of its 1,273 MW capacity existing at the end of 2007. Minnesota added 454 MW of new wind capacity, and Minnesota and Iowa were the states with the highest fraction of total electricity generation from wind power in 2007 (AWEA, 2008, 2009). However, there are issues that must be addressed related to the intermittency of wind as a renewable resource, such as the maintenance of a readily dispatchable source of power to compensate for times when wind power is not available. Issues related to intermittency and integrating renewables into the electricity grid are discussed further in later chapters, including Chapter 3 (technologies for grid integration), Chapter 4 (cost of renewables integration), and Chapter 6 (case studies of wind integration).
Concentrating solar power (CSP) and photovoltaic (PV) electricity generation by the electricity sector combined to supply 500 GWh in 2006 and 600 GWh in 2007, which constitutes 0.01 percent of total U.S. electricity generation. EIA data indicate that the compounded annual growth rate in net U.S. generation from solar was 1.5 percent from 1997 to 2007 (EIA, 2008a). That estimate, however, does not account for the growth in electricity generation by residential and other small PV installations, the sector that has displayed the highest growth rate for solar electricity.9 Including these other sources, installations of grid-tied and off-grid solar PV in the United States have grown at a compounded annual growth rate of about 30 percent from 2000 to 2008 (Cornelius, 2007; Sherwood, 2008; SERI, 2009), although the total on-grid and off-grid generation capacity in 2008 is still fairly small (~1,000 MW).10
|
8 |
If one assumes a 35 percent capacity factor—the fraction of time the technology is producing electricity or energy—the added total annual generation for 2008 would be more than 25,000 MWh. |
|
9 |
As noted by the EIA (2008a), electricity generation from CSP and PV was estimated for electric utilities, independent power producers, commercial electricity plants, and industrial plants only. |
|
10 |
For intermittent renewables such as solar and wind, quoting additions in generating capacity can be misleading since capacity factors—the fraction of time the technology is producing electricity or energy—can be low for renewables (approximately 10–25 percent for PV). However, for residential and other small PV installations that do not contribute electricity measured on the grid, capacity is a primary metric for assessing growth. |
Geothermal heat represents the other major source of renewable electricity, generating 14,800 GWh of electricity in 2007 in the United States. According to EIA estimates (EIA, 2008a), electricity production from geothermal sources was larger than that from wind power as recently as 2003. However, the growth in geothermal electricity generation has been relatively flat since 1990, and geothermal electricity generation is now smaller than wind- and biomass-based U.S. electricity generation.
International Renewable Electricity
Renewable resources such as hydropower and geothermal energy have long been a major component of many countries’ electricity sectors. Recently, electricity generation from solar and wind power has been expanding rapidly in parts of Europe and has also been emerging elsewhere. In particular, Germany and Spain have used aggressive feed-in tariffs to rapidly increase wind and solar electricity generation.11 Because the tariff is resource-specific, solar PV can be as profitable to electricity generators as wind power. From 1998 to 2006 in Germany, the share of electricity generation from renewable resources increased from 4 percent to 14 percent—7 percent from wind, 1 percent from solar, and 6 percent from hydropower (Luther, 2008). In 2006, Germany produced approximately 31,000 GWh of electricity from wind and 2,200 GWh from solar PV (IEA, 2008). Spain produces 18 percent of its electricity demand from renewable resources, including 9.7 percent from hydropower and 7.6 percent from wind. Wind power in Spain generated more than 23,000 GWh of electricity in 2006, increasing from 6,500 GWh in 2000 (IEA, 2008). Denmark has the highest fraction of electricity generation from wind, 18.2 percent in 2005, for a total of 6,600 GWh. The high fraction from wind is aided by the interconnection of Denmark’s power grid with that of Sweden, Norway, and Germany (Sharman, 2005): a large amount of available hydropower in Sweden and Norway can be adjusted rapidly to balance the variable output from Denmark’s wind turbines.12 The connection between these countries serves as an electricity sink at times of high wind generation and a source at
|
11 |
The feed-in tariff is an electricity pricing law under which renewable electricity generators are paid at a set rate over a given period of time (Mendonca, 2007). The rates are differentiated by facility size and resource, and are set by a federal agency to ensure profitable operations. |
|
12 |
Because much of Denmark’s electricity generation from wind replaces generation from hydropower, the benefits from reduced emissions of carbon and other pollutants are not as large as if wind power generation had replaced generation from fossil fuels. |
times of low wind generation. In Spain, integration into the electricity grid of a sizable fraction of wind power is supported by a large excess-generation capacity that protects system reliability and by large hydroelectric plants that provide 18 percent of all generation capacity.
The growth of electricity generated from renewable resources, in particular in Europe and Asia, indicates increasing interest in moving away from carbon-based energy sources. Countries also view renewables in terms of their economic potential. Although its focus is electricity generation from renewable resources in the United States, this panel recognizes international activities in renewable electricity as important sources of experience that can benefit U.S. applications. International activities are also important because several of the companies involved in the development of domestic renewables projects or supplying the components for such projects are international companies. Thus, decisions on where to install wind power projects or where to locate manufacturing facilities are global decisions. For example, the wind turbine manufacturer with the largest U.S. market share is GE, but its share has decreased from 60 percent in 2005 to 44 percent in 2007, with a concomitant increase in the market share held by foreign-owned companies (DOE, 2008). Because of the cost of shipping wind turbines and the expected growth in installed capacity, several major global vendors have established new manufacturing or assembly facilities in the United States in conjunction with an increasingly stable regulatory environment. In terms of global manufacturing, almost 16 percent of wind turbines in 2006 were built in the United States; only Denmark, Germany, and Spain had a larger share of the manufacturing base (IEA, 2008). Thus, it is important to recognize that renewable electricity projects in the United States must compete in an international market for skilled labor, equipment, materials, and capital.
Private Investments
Private investment is essential for the deployment of renewable electricity on a scale that would significantly reduce carbon emissions and increase domestic production of low-carbon sources. Although federal funds can help enable basic research and development, renewable electricity must compete in the electricity market and must attract private capital to expand significantly. In 2007, $150 billion was invested in renewables worldwide, by many financial sectors, mostly in wind and solar PV. Figure 1.5, which indicates the level of investment in wind, solar, and biofuels projects in the United States since 2001, shows a 34-fold
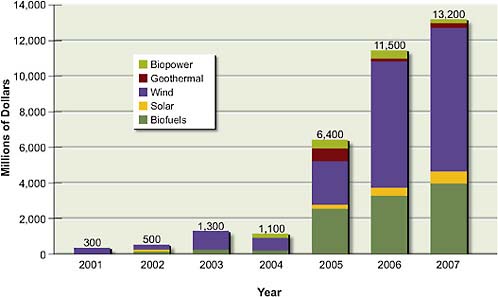
FIGURE 1.5 Annual private investments in wind, biofuels, and solar power.
Source: DOE/EERE, 2008.
increase in investment, as reported by DOE/EERE (2008). This quotes information collected by New Energy Finance. Annual U.S. private investments have increased from $300 million in 2001 to $12 billion in 2007 (DOE/EERE, 2008). The largest, in wind power, totaled almost $8 billion in 2007. One forecast has investment in wind increasing to a cumulative total of $65 billion over the period from 2007 to 2015 (Emerging Energy Research, 2007).
Among the groups financing the clean technologies sector, venture capital firms have shown an especially strong interest. Representing a small fraction of all private investment, venture capital firms typically invest in small companies with high growth potential, such as start-up companies that are either too small to raise capital in public markets or too immature to obtain bank loans. Venture capital firms hope for large financial returns and successful exit events by going public or selling to large firms within a timeframe typically of 3–7 years. Investment numbers vary widely depending on who performs the analysis, but all sources have
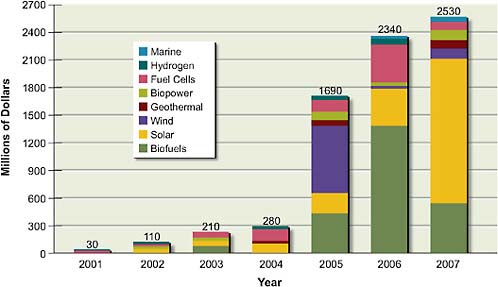
FIGURE 1.6 Annual venture capital investment in wind, biofuels, and solar.
Source: DOE/EERE, 2008.
reported a sharp increase in venture capital investment in renewables.13 Figure 1.6 shows that the venture capital investment in wind, solar, biofuels, and energy efficiency projects in the United States had increased 13-fold since 2001. According to the study by New Energy Finance, quoted by the DOE/EERE (2008), the two front-runners in recent years have been solar PV and energy efficiency technology companies, which each secured $1 billion in venture capital investment. This increasing trend of investment in clean energy projects continued in 2008, although recent constraints in credit have caused concern that investment capital for big renewable energy projects will tighten. A recent report by Dow Jones VentureSource found that, despite a 12 percent decrease in total venture capital investments in the second quarter of 2008, there was a strong increase in investment in energy and utility industries, with a total investment of $817 million, which represents an increase of 160 percent compared with the second quarter of 2007.14 Of
|
13 |
Investment keeps growing. Greentech Media. December 31, 2007. Available at http://www.greentechmedia.com/articles/the-green-year-in-review-444.html. |
|
14 |
Quarterly U.S. venture capital report. Dow Jones VentureSource. Available at http://www.venturecapital.dowjones.com. |
the $817 million, $650 million was invested in renewable energy projects, with a strong focus on solar PV projects.
Some financial experts see a potential downside to venture capital firms’ strong interest in renewable energy15—the timeframe in which start-ups can become profitable may not correlate well with the time required to make renewable energy companies commercially profitable. Programs such as the “entrepreneur-in-residence” program16 between DOE and Kleiner, Perkins, Caufield, and Byers have been established as part of an effort to prevent this potential obstacle to investment, by using venture capital firms to help move clean energy technologies out of the national energy laboratories. The venture capital firms provide the early-stage investments to new start-up companies that are assisted by technology experts from the national laboratories. The program’s objective is to increase the chances that new technologies will become commercially profitable.
REFERENCE CASE PROJECTION OF FUTURE RENEWABLE ELECTRICITY GENERATION IN THE UNITED STATES
Understanding how renewables fit into and compete in the wider electricity sector is critical for understanding the future of renewables and assessing the potential consequences of their large-scale deployment. One approach to understanding the electricity market—and thus gaining some perspective on the ability of renewable electricity technologies to compete with fossil-fuel and nuclear electricity—is offered by models, including energy-economic models. Such a perspective is important because the future of renewable electricity will depend largely on the ability of renewable electricity technologies to compete with fossil-fuel and nuclear electricity. It is also important to consider the extent to which a policy might affect energy demand. Models can demonstrate the potential impacts of demographic, economic, or regulatory factors on the use of renewable electricity within a framework that accounts for how such factors interrelate with use of all sources of electricity and with energy demand.
|
15 |
“Dirty side to clean energy investing: Renewable investments have tripled since 2002, but is quick cash really what the sector needs?” CNN Money, March 27, 2007. |
|
16 |
National Laboratory Entrepreneur-in-Residence Program: Questions and Answers. DOE Energy Efficiency and Renewable Energy (EERE). Available at http://www1.eere.energy.gov/site_administration/entrepreneur.html. |
However, such models are not predictors of the future, and hence the results of such models are not forecasts. Energy-economic models, as with all complex models, should not be confused with reality, or taken as prognosticators of the future (Holmes et al., 2009; NRC, 2007).
The EIA provides detailed projections of energy supply, demand, and prices through 2030, including for individual renewables within the electricity sector. Its most recent reference case is AEO 2009 Early Release (EIA, 2008d). The forecast is developed with the National Energy Modeling System (NEMS), an energy sector model with a high degree of detail that captures market feedbacks among various individual elements of the energy sector. AEO 2009 provides one scenario for the future of renewable electricity, albeit one used in a wide array of policy and technical settings. It assumes current policy conditions and thus does not take into account the potential for further energy- and climate-related initiatives. Updated annually, the EIA reference case is a moving reference, with the most recent forecast being more optimistic for renewables than was AEO 2008 (EIA, 2008d). It is important to note that the reference case estimate for renewable energy growth has changed significantly over the years, as Table 1.1 indicates.
In comparison with AEO 2008, AEO 2009 simulates an increase in the percentage of U.S. non-hydropower renewable electricity generation. As shown in Table 1.2, AEO 2008 estimated that by 2030 about 13 percent of all electricity generation would be from renewable resources, with only about 7 percent from non-hydropower renewables. AEO 2009 estimates that renewables will generate 14 percent of all U.S. electricity and that 8 percent will be generated from non-
TABLE 1.1 Predicted Annual Growth Rates of U.S. Non-hydropower Renewable Energy Generation
|
AEO Report Publication Year |
Years |
Predicted Annual Growth Rate (%) |
|
2003 |
2001–2025 |
2.1 |
|
2004 |
2002–2025 |
4.2 |
|
2005 |
2003–2025 |
3.6 |
|
2006 |
2004–2025 |
4.2 |
|
2007 |
2005–2030 |
3.4 |
|
2008 |
2006–2030 |
5.1 |
|
2009 |
2007–2030 |
6.4 |
|
Source: EIA AEO reports published each year between 2003 and 2009. See also http://invisiblegreenhand.blogspot.com/2007/12/eia-2008-annual-energy-outlook.html. |
||
TABLE 1.2 AEO 2009 Estimated Percentage of Overall U.S. Electricity Generation from Renewable Resources and Non-hydropower Renewable Resources, 2007–2030
|
|
2007 |
2010 |
2020 |
2030 |
|
Total from renewable resources |
8.5 (9.1) |
10.7 (10.7) |
13.3 (12.4) |
14.1 (12.6) |
|
Total from non-hydropower renewable resources |
2.5 (2.8) |
4.3 (3.9) |
6.7 (6.1) |
8.3 (6.8) |
|
Note: The values estimated by AEO 2008 are shown in parentheses. Source: EIA, 2008d,e. |
||||
hydropower renewables. Table 1.3 shows that AEO 2009 continues to see growth for both solar and wind, with solar growing at an annual average rate of more than 13 percent until 2030 and wind growing at almost 6 percent. Most of these values represent an increase over the estimates of AEO 2008, which simulated a smaller increase in the fraction of electricity generation from renewables and non-hydropower renewables. The main reason for the change in estimates between AEO 2008 and AEO 2009 is that additional state RPSs were taken into account in AEO 2009 that had not yet been passed when AEO 2008 was published. This difference demonstrates how reference case projections can change over time owing
TABLE 1.3 AEO 2009 Estimate of Electricity Generation from Renewable Resources (billion kilowatt-hours)
|
|
Year |
Annual Growth Rate 2007–2030 (%) |
|||
|
2007 |
2010 |
2020 |
2030 |
||
|
Conventional hydropower |
250 (260) |
270 (293) |
300 (301) |
300 (301) |
0.8 (0.6) |
|
Geothermal heat |
15 (16) |
18 (18) |
19 (24) |
21 (31) |
1.5 (2.9) |
|
Municipal waste |
16 (17) |
21 (22) |
22 (22) |
23 (22) |
1.5 (1.1) |
|
Biomass |
39 (41) |
56 (53) |
160 (135) |
230 (172) |
8.1 (6.4) |
|
Solar (photovoltaic plus thermal) |
1.3 (1.7) |
3.9 (2.4) |
18 (4.4) |
23 (7.7) |
13.3 (6.9) |
|
Wind |
32 (38) |
81 (74) |
94 (101) |
130 (124) |
6.2 (5.2) |
|
Total from renewable resources |
350 (380) |
450 (461) |
620 (587) |
730 (658) |
3.2 (2.5) |
|
Total from non-hydropower |
100 (110) |
180 (169) |
320 (286) |
430 (356) |
6.4 (5.1) |
|
Total electricity generation (all sources) |
4200 (4200) |
4200 (4300) |
4600 (4700) |
5200 (5200) |
0.9 (1.0) |
|
Note: Data from AEO 2008 are shown in parentheses. Source: EIA, 2008d,e. |
|||||
to changes in policy and other factors. In addition, although both AEO 2008 and AEO 2009 predict significant growth in electricity generation from biomass, mandates under the Energy Independence and Security Act of 2007 have led to uncertainty about whether such growth will occur if the majority of the biomass resource base is devoted to the production of liquid fuels.
Overall, AEO 2009 estimates that electricity generation will rise at an annual growth rate of 0.9 percent, down from the 1.0 percent growth rate projected in AEO 2008. Table 1.4 indicates that this increase will not occur evenly across the United States and that growth in generation capacity within a region may not be the same as growth in electricity demand. AEO 2009 does not give projections at the state level but shows aggregated renewable electricity generation by region as a result of individual state RPSs, as seen in Figure 1.7. A significant portion of the qualifying renewables capacity in the Midwest, Northeast, Southwest, and Pacific Northwest is expected to come from wind. In the Mid-America Interconnected Network, 11,000 MW of wind capacity is expected in 2030, up from 220 MW in 2006. The majority of the new biomass capacity between 2006 and 2030 is
TABLE 1.4 AEO 2009 Estimated Annual Average Electricity Growth Rates from 2007 to 2030 by Region
|
|
Growth in Electricity Demand (%) |
Growth in Electricity Generation (%) |
|
East Central Area Reliability Coordination (ECAR) |
0.7 (0.7) |
0.7 (0.6) |
|
Electric Reliability Council of Texas (ERCOT) |
1.1 (1.2) |
1.1 (1.1) |
|
Mid-Atlantic Area Council (MAAC) |
0.9 (0.8) |
1.0 (1.0) |
|
Mid-America Interconnected Network (MAIN) |
0.7 (0.6) |
1.0 (0.8) |
|
Mid-Continent Area Power Pool (MAPP) |
0.7 (0.6) |
1.6 (0.9) |
|
Northeast Power Coordinating Council/NewYork (NY) |
0.5 (0.5) |
0.4 (0.5) |
|
Northeast Power Coordinating Council/New England (NE) |
0.6 (0.6) |
1.0 (1.0) |
|
Florida Reliability Coordinating Council (FL) |
1.4 (1.6) |
1.5 (2.2) |
|
Southeastern Electric Reliability Council (SERC) |
0.9 (1.2) |
0.8 (0.9) |
|
Southwest Power Pool (SPP) |
0.9 (1.0) |
0.4 (0.9) |
|
Western Electricity Coordinating Council/Northwest Power Pool Area (NWP) |
1.0 (1.1) |
0.9 (1.4) |
|
Western Electricity Coordinating Council/Rocky Mountain Power Area, Arizona, New Mexico, Southern Nevada Power Area (RA) |
1.2 (1.5) |
1.4 (1.5) |
|
Western Electricity Coordinating Council/California (CA) |
0.9 (1.1) |
1.2 (0.9) |
|
Note: Data from AEO 2008 are shown in parentheses. Source: EIA, 2008d,e. |
||
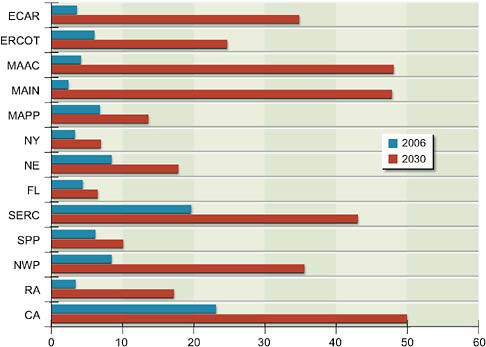
FIGURE 1.7 Regional growth in nonhydroelectric renewable electricity generation, 2006–2030, in gigawatt-hours. Acronyms are defined in Table 1.4.
Source: EIA, 2007.
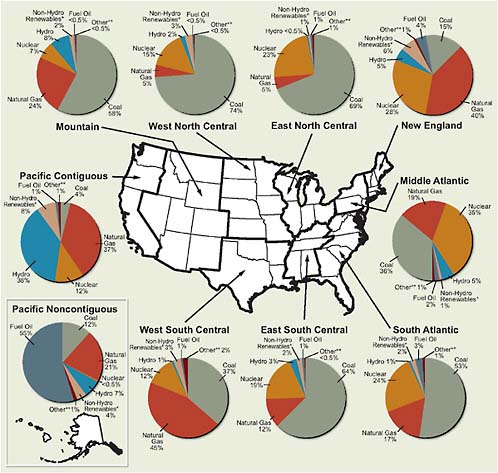
projected to come from the Mid-Atlantic region (EIA, 2008d). Investment in solar power is expected to grow most significantly in Texas and California, especially given California’s Solar Initiative (REPP, 2005). The regional distribution of the renewable resource base (see figures in Chapter 2) will be a guiding factor in the regional growth of renewable electricity generation. The existing regional variation in electricity generation can also be seen in Figure 1.8, which shows the different fuel mixes used for generating electricity in different parts of the country.
ISSUES OF SCALE
For electricity generation from renewable resources to fulfill a significant fraction of total U.S. electricity consumption, renewables need to be manufactured, deployed, and integrated into the electricity system on a much greater scale than they are today. Scaling up involves issues that go beyond the readiness of the
individual renewable technologies, namely, issues related to manufacturing capacities, raw materials availability, workforce training and certification, and a host of other factors, including environmental effects. Issues that are related to the need to greatly expand the scale of renewable deployment will be discussed throughout the report. The final chapter of this report (Chapter 7) provides a quantitative discussion of the manufacturing, implementation, economics, and environmental issues and impacts associated with an increased level of deployment of renewable electricity. In general, the panel considers it critical that the reader have a sense of the scale issues associated with potentially achieving an aggressive but attainable level of renewable electricity deployment.
APPROACH AND SCOPE OF THIS REPORT
The panel’s charge was to examine the technical potential for electric power generation from renewable resources such as wind, solar photovoltaic, geothermal, solar thermal, and hydroelectric power (see this report’s preface for the full statement of task). In keeping with the overall plan for the America’s Energy Future project (see Appendix A), the panel did not attempt to develop recommendations on policy choices but focused instead on characterizing the status of renewable energy technologies for power generation, especially technologies with initial deployment times of less than 10 years. In this report the panel also addresses the challenges of incorporating such technologies into the power grid; the potential for improvements in the electricity grid that could enable better and more extensive use of renewable technologies both in grid-scale applications and distributed at or near the customer’s point of use; and potential storage needs.
The panel organizes its report around broad topics that are relevant for each individual source. Thus, the body of the report is organized around the topics of the resource bases, technologies, economics, impacts, and deployment. By necessity, much of the discussion addresses the technology readiness, costs, and impacts of individual renewable electricity sources. In this regard, the report’s “story-line” could read like a puzzle, because each renewable (solar, wind, geothermal, biomass, and hydropower) has its own characteristic resource base, technology readiness, economics, and impacts. Solar electricity, for example, has the largest resource base and some well-developed technologies for tapping it but is still relatively expensive compared to other renewable electricity sources. However, the organization of the report emphasizes the degree to which these renewables share
some common considerations. The report’s discussion of the U.S. resource base (Chapter 2), technologies (Chapter 3), economics (Chapter 4), impacts (Chapter 5), and deployment (Chapter 6) is intended to present an integrated picture of renewables rather than snapshots of the individual renewable electricity sources. A quantitative discussion of issues related to accelerated deployment of renewables (Chapter 7) augments the more qualitative discussions presented in the preceding chapters.
The panel did not examine renewable energy for heating and hot water applications, which are considered in the upcoming report of the AEF Committee (NAS-NAE-NRC, 2009a). And although the panel devoted significant effort to considering the integration of renewables into the electricity grid, the full spectrum of issues and needs associated with the future of the electricity transmission and distribution systems falls under the purview of the Electric Power Transmission and Distribution subgroup of the AEF Committee (see Figure A.1 in Appendix A). The role that energy efficiency might play in the energy system and how efficiency might impact renewables are likewise not examined by this panel; they are addressed instead by the AEF Panel on Energy Efficiency in its upcoming report (NAS-NAE-NRC, 2009c). Similarly, the use of biofuels, such as corn and cellulosic ethanol, as alternative transportation fuels is not discussed by the present panel but instead is examined in the forthcoming report of the AEF Panel on Alternative Liquid Transportation Fuels (NAS-NAE-NRC, 2009b).
REFERENCES
AWEA (American Wind Energy Association). 2008. Wind Power Outlook 2008. Washington, D.C.
AWEA. 2009. Wind energy grows by record 8,300 MW in 2008. Press release, January 27. Washington, D.C.
AWEA/SEIA (AWEA/Solar Energy Industries Association). 2009. Green Power Superhighways: Building a Path to America’s Clean Energy Future. Washington, D.C.
Cornelius, C. 2007. DOE solar energy technologies program. Presentation at the first meeting of the Panel on Electricity from Renewable Resources, September, 18, 2007. Washington, D.C.
CPUC (California Public Utilities Commission). 2009. California Solar Initiative CPUC Staff Progress Report. San Francisco.
Dobesova, K., J. Abt, and L. Lave. 2005. Are renewables portfolio standards cost-effective emissions abatement policy? Environmental Science and Technology 39:8578-8583.
DOE (U.S. Department of Energy). 2008. Annual Report on U.S. Wind Power Installation, Cost and Performance Trends: 2007. Washington, D.C.
DOE/EERE (DOE/Energy, Efficiency, and Renewable Energy). 2008. Renewable Energy Data Book. Washington, D.C.
EEI (Edison Electric Institute). 2008. Different regions of the country use different fuel mixes to generate electricity. Preliminary 2007 data. Available at http://www.eei.org/ourissues/ElectricityGeneration/FuelDiversity/Documents/diversity_map.pdf.
EIA (Energy Information Administration). 2008a. Annual Energy Review 2007. Washington, D.C.: U.S. Department of Energy, EIA.
EIA. 2008b. Federal Financial Interventions and Subsidies in Energy Markets 2007. Washington, D.C.: U.S. Department of Energy, EIA.
EIA. 2008c. Renewable Energy Annual, 2006. Washington, D.C.: U.S. Department of Energy, EIA.
EIA. 2008d. Annual Energy Outlook 2009 Early Release. DOE/EIA 0383(2009). Washington, D.C.: U.S. Department of Energy, EIA.
EIA. 2008e. Annual Energy Outlook 2008. DOE/EIA 0383(2008). Washington, D.C.: U.S. Department of Energy, EIA.
EIA. 2009. Electric Power Monthly. Washington, D.C.: U.S. Department of Energy, EIA.
Emerging Energy Research. 2007. U.S. Wind Power Markets and Strategies, 2007-2015. Cambridge, Mass.
EPRI (Electric Power Research Institute). 2004. Power Delivery System of the Future: A Preliminary Study of Costs and Benefits. Palo Alto, Calif.
GAO (General Accountability Office). 2007. Federal Electricity Subsidies: Information on Research Funding, Tax Expenditures, and Other Activities That Support Electricity Production. Washington, D.C.
Holmes, K.J., J.A. Graham, T. McKone, and C. Whipple. 2009. Regulatory models and the environment: Practice, pitfalls, and prospectus. Risk Analysis 29(9):159-170.
IEA (International Energy Agency). 2008. Key World Energy Statistics. Paris.
Luther, J. 2008. Renewable energy development in Germany. Presentation at the NRC Christine Mirzayan Fellows Seminar, March 5, 2008. Washington, D.C.
Martinot, E., R.Wiser, and J. Hamrin. 2005. Renewable Energy Policies and Markets in the United States. Prepared for the Energy Foundation’s China Sustainable Energy Program, Center for Resource Solutions. San Francisco.
Mendonca, M. 2007. Feed-in Tariffs: Accelerating the Development of Renewable Energy. London: Earthscan.
NAS-NAE-NRC (National Academy of Sciences-National Academy of Engineering-National Research Council). 2009a. America’s Energy Future: Technology and Transformation. Washington, D.C.: The National Academies Press.
NAS-NAE-NRC. 2009b. Liquid Transportation Fuels from Coal and Biomass: Technological Status, Costs, and Environmental Impacts. Washington, D.C.: The National Academies Press.
NAS-NAE-NRC. 2009c. Real Prospects for Energy Efficiency in the United States. Washington, D.C.: The National Academies Press.
NRC (National Research Council). 2007. Models in Environmental Regulatory Decision Making. Washington, D.C.: The National Academies Press.
Palmer, K., and D. Burtraw. 2005. Cost effectiveness of renewable energy policies. Energy Economics 27:873-894.
REPP (Renewable Energy Policy Project). 2005. Solar PV Development: Location of Economic Activity. Washington, D.C.
Rickerson, W., and R. Grace. 2007. The debate over fixed price incentives for renewable electricity in Europe and the United States: Fallout and future directions. White paper prepared for the Heinrich Böll Foundation. Washington, D.C.
SERI (Solar Energy Industries Association). 2009. U.S. Solar in Review 2008. Washington, D.C.
Sharman, H. 2005. Why wind power works for Denmark. Civil Engineering 158:66-72.
Sherwood, L. 2008. U.S. Solar Market Trends 2007. Latham, N.Y.: Interstate Renewable Energy Council.
Taub, S. 2008. Impact of 2007 Wind Farms on U.S. Treasury. Stamford, Conn.: GE Energy Financial Services.
Wiser, R. 2008. The development, deployment, and policy context of renewable electricity: A focus on wind. Presentation at the fourth meeting of the Panel on Electricity from Renewable Resources, March 11, 2008 Washington, D.C.
Wiser, R., and G. Barbose. 2008. Renewables Portfolio Standards in the United States: A Status Report with Data Through 2007. Berkeley, Calif.: Lawrence Berkeley National Laboratory.
Wiser, R., and M. Bolinger. 2008. Annual Report on U.S. Wind Power Installation, Cost and Performance Trends: 2007. DOE/GO-102008-2590. Washington, D.C.: U.S. Department of Energy.


