
6
Deployment of Renewable Electric Energy
Renewable energy technologies are poised to become an important component of the electricity supply mix. However, it is not a foregone conclusion that the United States will achieve and maintain a high rate of deployment of renewable electricity. The current financial situation (as of 2009) is impacting the renewables market at many levels, but the issues discussed in this chapter are nonetheless important for expanding the market for renewable electricity technologies. Renewables face challenges involving the deployment and commercialization of innovative technologies—the stages that follow technological innovation and development. These challenges include the risk of introducing new technologies into competitive markets; the investment in the long-term, market-enabling research and development activities needed to help move technologies along the learning curve; and the impact of policy measures that share the risk of product innovation and market transformation. The proverbial investment valley of death1 can prevent new technologies from advancing past the demonstration phase due to a lack of capital. Manufacturing capacity, policy, business and market innovation, and access to financing must coincide with technology innovations for the continued successful deployment of renewable sources of electricity.
As noted in Chapter 3, in many ways new renewable electricity technologies, and the thinking that will enable them, represent disruptive rather than
incremental changes in long-established industry sectors. Disruptive technologies have two important characteristics. First, they typically present different performance attributes—such as providing a carbon-free source of electricity—that, at least at the outset, are not valued by a majority of customers. Second, the performance attributes (e.g., costs) for disruptive technologies that customers do value can improve at such a rapid rate that the new technology can overtake established markets. Figure 6.1 shows how the performance of a disruptive technology that was once lagging that of an earlier established technology can improve at a faster rate. However, such performance improvements are speculative and are not preordained. In the case of renewable electricity technologies, on a conventional cost-of-energy basis traditional sources of electricity generation initially outperform non-hydropower renewables. The attraction of technologies that use renewable resources, together with government incentives, has been responsible for much of their market presence. However, owing to improvements in renewable technologies and cost increases for fossil fuels and nuclear power, renewables are gaining the ability to match the cost performance of traditional generating sources both in the wholesale power market and on the customer side of the meter.
This chapter explores the logistical and market barriers to commercial-scale deployment of renewable electricity. Although individual renewable energy technologies have unique developmental and economic characteristics, there are, common, non-technical challenges as well, including (1) constraints on capacity for larger-scale manufacturing and installation and limitations on the availability of trained employees for manufacturing, installation, and maintenance; (2) integration of intermittent resources into the existing electricity infrastructure and market; (3) market requirements such as capacity for competing in price and performance with conventional lower-cost coal, nuclear, and natural-gas-fired power plants; and (4) risk and related issues, including business risk, cost issues, and unpredictability of and inconsistency in regulatory policies.
Because of the robust regulatory and business activities related to wind and solar energy industries, many examples discussed in this chapter come from these sources. However, they are used to indicate deployment issues associated to some degree with other renewable sources of electricity.
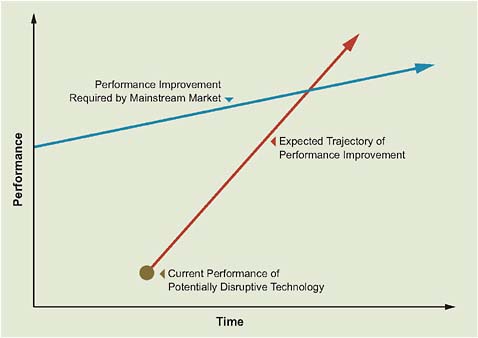
FIGURE 6.1 Performance characteristics of a disruptive technology.
Source: Bowen and Christensen, 1995.
DEPLOYMENT CAPACITY CONSIDERATIONS
Capacity constraints, such as restricted supplies of basic raw material inputs, limitations on manufacturing capacity, competition for larger construction project management and equipment, and limited trained workforce, have the potential to derail large-scale deployment and integration of renewable electricity resources. Thus, to grow the renewable electricity market, which is increasingly driven by the private sector, will require continued and ramped up investment in order to deploy, operate, and maintain these technologies.
Materials, Manufacturing, and Development Considerations
Raw and Basic Materials
Renewable energy technologies potentially can be restricted by a scarcity of key raw materials. A common example is solar photovoltaics (PV). Recent shortages of polycrystalline silicon have increased prices for PV modules, though these short-
ages were expected to ease by 2009 (Bradford, 2008). In addition, while silicon is relatively abundant, a scarcity of silver could limit use of traditional crystalline and polycrystalline silicon, as well as nano-silicon-based cells, in the long term. Likewise, limited availability of naturally occurring indium could restrict more efficient thin-film solar cell technologies using copper indium gallium selenide (CIGS). Solar cell raw material components and limiting material are summarized in Table 6.1, and global reserves for key materials are shown in Figure 6.2 (Feltrin and Freundlich, 2008).
There are also issues related to global competition for such basic materials as steel and cement that hinder large-scale deployment of renewables and increase renewable energy development costs. Wind turbine manufacturers are particularly affected by these material shortages. Global competition for essential elements has, in recent years, driven up the costs of commodities and limited the materials available for wind energy projects. Table 6.2 projects the raw materials needed through 2030 to support the 20 percent wind scenario (DOE, 2008a), and Figure 6.3 shows the predicted near-term U.S. and global raw material usage for wind turbines. Global competition for these resources is not limited to renewables. It applies to all types of generation and to the construction sector generally. Longer-term goals are achievable, but the broader use of renewables will require a well-defined strategy for deployment.
TABLE 6.1 Critical Limiting Raw Materials Needed for Fabrication of Solar Cells
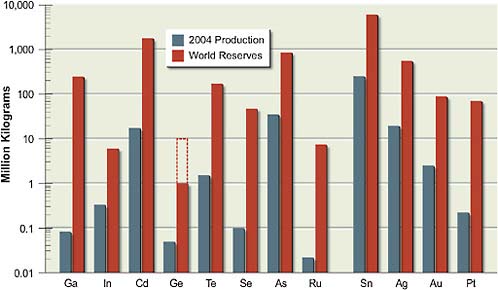
FIGURE 6.2 Estimated (2004) annual production levels and world material reserves of raw materials used in PV cell manufacturing. Note that because data are not available on world reserves of germanium (Ge), the solid bar represents U.S. reserves and the dashed lines represent a best guess about world reserves.
Source: Feltrin and Freundlich, 2008.
Manufacturing and Development
Wind Power Industry
Developers face shortages of wind turbines due to continuing strong demand for wind power both in the United States and globally (AWEA, 2008). Wind turbine manufacturers are still in the process of making the capital investments necessary to increase their capacity to catch up with the growing demand. Projections have suggested that the mismatch between turbine supplies and wind developer demands would level out as soon as 2009 (EER, 2007). Meanwhile, manufacturers continue to play catch-up, with typical delays of 6 months or more from turbine order to delivery. Though lead times have lengthened due to the rapid growth in wind turbine installations, wind and solar PV projects have an advantage over traditional power plants because of their shorter time between purchase of the equipment and placing it on line (Bierden, 2007).
Overall wind power project costs have increased due to recent increases in
TABLE 6.2 Yearly Raw Materials Required in 2030 to Meet Wind Turbine Demand in 20 Percent Wind Scenario (in units of thousands of metric tons)
|
Year |
kWh/kga |
Permanent Magnet |
Concrete |
Steel |
|
2006 |
65 |
0.03 |
1,614 |
110 |
|
2010 |
70 |
0.07 |
6,798 |
464 |
|
2015 |
75 |
0.96 |
16,150 |
1,188 |
|
2020 |
80 |
2.20 |
37,468 |
2,644 |
|
2025 |
85 |
2.10 |
35,180 |
2,544 |
|
2030 |
90 |
2.00 |
33,800 |
2,308 |
|
a Proposed scenario for energy density improvement for wind turbine growth during the 2006–2030 period. Source: Adapted from material in Wiley, 2007. |
||||
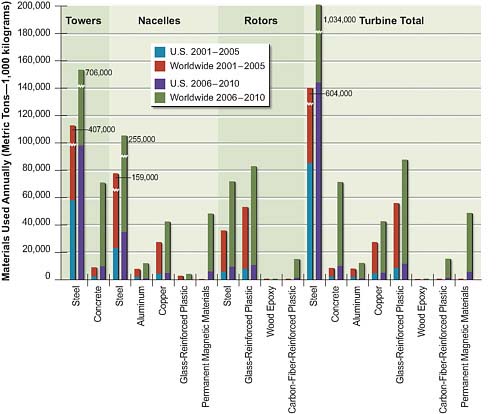
FIGURE 6.3 U.S. and worldwide wind turbine material usage.
Source: Ancona and McVeigh, 2001.
|
Aluminum |
Copper |
Glass-Reinforced Plastic |
Carbon Fiber Composite |
Adhesive |
Core |
|
1.2 |
1.6 |
7.1 |
0.2 |
1.4 |
0.4 |
|
4.6 |
7.4 |
29.8 |
2.2 |
5.6 |
1.6 |
|
15.4 |
10.2 |
73.8 |
9.0 |
15.0 |
5.0 |
|
29.6 |
20.2 |
162.2 |
20.4 |
33.6 |
11.2 |
|
27.8 |
19.4 |
156.2 |
19.2 |
31.4 |
10.4 |
|
26.4 |
18.4 |
152.4 |
18.4 |
30.2 |
9.6 |
wind turbine prices (DOE, 2008b). Figure 6.4 shows the recent trend in turbine costs. These prices have increased due to increased costs for materials and energy inputs; component shortages; upscaling of turbine size and improvements in turbine design; declining value of the U.S. dollar; and attempts to increase profitability in the wind turbine manufacturing industry (DOE, 2008b). The increase in project costs as of year 2000 reversed the long-term decline in project costs, which includes the turbine as well as other balance of system components (Figure 6.5). The upturn in the price of turbines might, however, be partially offset by an increase in the kilowatt-hour output per kilowatt turbine capacity with the use of power electronics, variable-speed drives, and more stringent requirements of ride-through faults in utility system operation.
The increased demand for wind turbines worldwide has expanded wind turbine manufacturing facilities in the United States. Though General Electric (GE) remains the dominant turbine manufacturer, other domestic and foreign manufacturers have entered the market or expanded their operations (DOE, 2008b). Component manufacturers of blades, gearboxes, and other elements are spread across the United States (Sterzinger and Svrcek, 2004). However, lower wages have caused many manufacturers to locate factories overseas (DOE, 2008b). In general, the strong growth nationally and internationally has resulted in an expansion of all segments of the wind industry, including manufacturers, as well as parts of the industry related to installation and operations and maintenance.
There have been changes in the wind power development sector of the industry (EER, 2007). Independent power producers (IPPs) have shown increased interest in wind power projects; IPPs develop a variety of electricity generation facili-
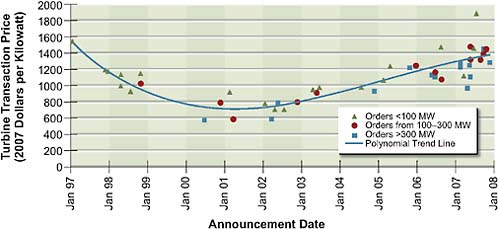
FIGURE 6.4 Wind turbine prices over time.
Source: DOE, 2008b.
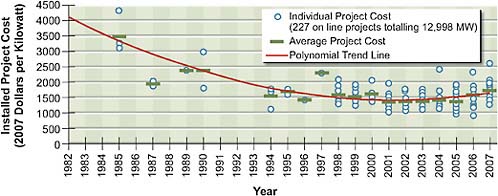
FIGURE 6.5 Installed wind project costs over time.
Source: DOE, 2008b.
ties for the wholesale electricity market. IPPs have to compete against developers whose sole focus is the development of wind power projects (termed the pure play wind developers). Further, globalization has become a factor in the U.S. market, with developers from Europe initiating projects in the United States. Most of these European developers provide wind through long-term contracted sales to utilities, though they also sell to power markets. A variant is the purchase of Energy
East, a New York state utility, by Iberdrola S.A., a Spanish energy company that develops wind power projects worldwide. As noted in Chapter 4, there also is a market for renewable energy credits (RECs) that can be sold separately from electric power. Finally, some utilities are beginning to develop their own wind power projects instead of purchasing wind power through long-term contracts with wind developers.
Solar PV Industry
Like wind power, the large growth rate for solar PV, both within the United States and globally, has caused shortages in manufacturing capacity and raw materials. As with wind power, it has also resulted in increasing prices and changes within the industry. As noted in the section on raw materials, the primary cause for shortages in PV is a shortage in polycrystalline silicon. Originally, the primary use of polycrystalline silicon was for semiconductors in the electronic industry, with solar PV manufacturers using a small fraction of silicon production and even using silicon recycled from the electronics industry. Recently, the solar PV industry has become the largest consumer of polycrystalline silicon, bringing new entrants into the industry that include producers specifically oriented to the solar PV industry, and even solar PV manufacturers looking to become more integrated along the supply chain (Prometheus Institute, 2007). Despite these new entrants, there was still a shortage of polycrystalline silicon, which had driven up the price for solar silicon PV modules (Figure 6.6), though this shortage was expected to subside by 2009. Recent articles project 2009 to see this decrease in costs for solar PV, though the decline in price has been attributed to both increasing supplies and decreasing demands due to the global economic slowdown (Patel, 2009).
Solar companies that are expected to perform well in the current solar PV market are generally those with stable silicon supplies (EIA, 2007). Conversely, companies that are thought to have insufficient or inflated silicon supplies have not done well in the market (Greentech Media, 2007). Another current positive market characteristic is less reliance on polycrystalline silicon. There is more competition among distinctively different technologies in the solar PV industry compared to the wind turbine market. As shown in Figure 6.6, shortages of polycrystalline silicon have spurred increases in the thin-film solar PV technologies that do not require as much or any silicon. Figure 6.7 shows the impacts on shipments by U.S. manufacturers of this shift toward thin-film PV.
The rapid growth and projected demand for solar PV have spurred increases
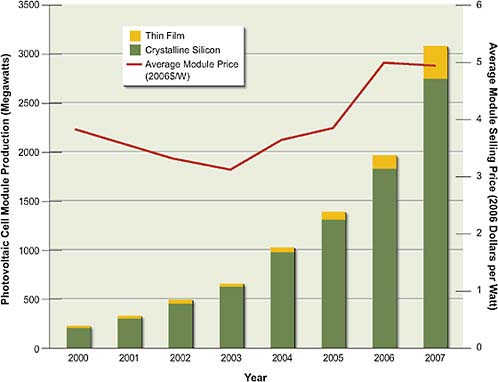
FIGURE 6.6 Global PV module production 2000–2007 and average module price during the same timeframe.
Source: Courtesy of Paula Mints, Principal Analyst, Navigant Consulting PV Services Program.
in both PV prices and demand for manufacturers to increase their manufacturing capacities. PV manufacturing in the United States is dominated by First Solar of Arizona, which has responded to market demand by expanding manufacturing capacity in Ohio and Germany, and it has announced additional capacity expansion in Malaysia (Prometheus Institute, 2007). Together, this expanded capacity is expected to bring First Solar’s total manufacturing capacity to more than 1 GW/yr by the end of 2009. This capacity expansion substantially increased income for this company in 2008 (Greentech Media, 2008). By 2010, SunPower and Solar-World are expected to add an additional 984 MW of capacity.
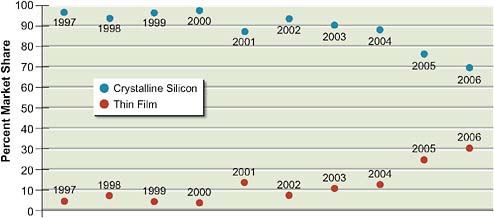
FIGURE 6.7 Crystalline silicon shipment and thin-film shipment market shares in the United States, 1997–2006.
Source: EIA, 2007.
The largest customer category for PV modules/cells has shifted from wholesale distributors to installers (EIA, 2007), reflecting the recent trend toward large commercial PV installations, such as those at Wal-Mart and the Google headquarters in California. The commercial sector was the largest market for PV in 2006 and grew more than 100 percent from 2005 (EIA, 2007). Additionally, some PV manufacturers have begun to enter the installation business to become more fully integrated along the PV supply chain (Greentech Media, 2007). Box 6.1 provides some background on the history and characteristics of the market for solar PV.
Workforce Requirements
Direct Requirements
Another limiting variable to the large-scale manufacturing and deployment of new renewable electricity systems is the need for a trained and capable workforce that grows as market demand grows. Educating this workforce requires the development of high-quality training infrastructures that include accredited institutions, skill testing, and certification. Table 6.3 shows the direct jobs and economic activity in the renewable electricity industry for 2006 (ASES, 2007).
The renewable energy industry in the United States opened 450,000 jobs in 2006 (ASES, 2007). Meeting a renewable energy portfolio standard of 20 percent by 2020 is projected to require an additional 185,000 jobs related to renewable
|
BOX 6.1 Evolution of the Market for Solar Photovoltaics The market for solar photovoltaics (PV) has evolved from niche, off-grid applications to a wide array of applications that provide power to the grid. For years, the primary market for PV cells and modules was in remote, stand-alone power for communication and navigation systems, cathodic protection, and village power, and in consumer products such as calculators, watches, and portable lighting products. Recently the grid-connected market has become the prominent user of PV modules and systems. The solar PV market has segments, distinguished by system size, such as residential (<10 kW), small commercial (10 kW to 100 kW), large industrial and public (100 kW to 1 MW), and utility scale (>1 MW). The economics of PV installations is directly related to the size of the installation and the degree of integration for the installation company across the PV supply value chain. Generally, the larger systems with greater degrees of integration into the grid will realize greater cost-reductions through economies of scale. In the United States, a bifurcated market for PV systems has developed, depending on whether the system is installed on a customer’s premises (behind the meter) or as a utility-scale generation resource. Behind-the-meter systems compete by displacing customer-purchased electricity at retail rates, while utility-scale plants must compete against wholesale electricity prices. Thus, behind-the-meter systems can often absorb a higher overall system cost structure. Much of the development of solar has occurred in this behind-the-meter market. Residential systems, one type of behind-the-meter systems, tend to be custom-designed based on roof space, pitch, and orientation. System dealers need to stock a variety of products and components and to manage product inventory; installers incur costs in project permitting and contracting for utility interconnection. Residential system installers have begun to address some of these issues. Some are |
energy (UCS, 2007). However, the renewable energy sector faces a challenge in meeting an increasing demand for educated and skilled workers. In fact, these workforce needs apply across the entire energy sector, which is faced with an aging workforce and a shortage of technically skilled people. Companies developing wind, solar, biomass, and geothermal recoverable resources will require an influx of skilled employees for sales marketing, customer services, and business support services in order to support the wide-scale deployment of these energy sources. Already, the shortage of skilled workers in the solar industry is partially blamed for upward cost pressures (EIA, 2007). A variety of sector-specific technical jobs, outlined in Table 6.4, will be drawn upon (Council on Competitiveness, 2007). To give a better picture of the variety of renewable energy positions,
|
customizing PV module systems that integrate racking hardware, grounding wires, wiring connections, and connections between panels. These systems can be factory-produced, reducing on-site installation costs. A homeowner will invest the needed capital to pay for the system purchase and installation, with cost recovery occurring over some period of time from displaced electricity savings. Economic payback periods can be quite long, but early-adopter residential investors are less sensitive to overall system economics because of other purchase motivations. In another version of the behind-the-meter systems, a commercial business or government agency might install and run a system itself, or have a system installed through a third-party ownership or solar services model. Under the solar services model, third-party companies install and own a PV system on behalf of a host business or public agency. The system is located behind the meter on a utility customer’s premises. The third-party company acts as technology integrator, project developer, and system operator, and secures the project financing as well. The solar electricity is sold to the host customer at a rate below the prevailing utility retail rate. Businesses and public agencies generally adhere to strict economic payback criteria. For example, businesses have an internal rate of return (IRR) hurdle (often >15 percent) that must be met for any corporate investment to be undertaken. At today’s costs, PV system investments may not meet the IRR hurdle. The success of this model often relies on key factors, including (1) net metering, which allows valuation of displaced grid electricity at the prevailing retail rate, and (2) the ability of the third-party entity to raise capital at rates well below the IRR hurdle of the private companies. Other factors include the availability of federal and state incentives; the existence of a time-of-use utility tariff in which the utility’s high-price rate tiers match well with the solar electricity output; and an existing market for solar renewable energy credits (RECs), the sale of which provides additional value to the solar generation. |
Table 6.5 delineates selected occupations at a typical wind turbine manufacturing plant in Ohio, illustrating that the renewable energy sector employs a wide range of people at all levels of skills and education.
Indirect Requirements
In addition to the basic manufacturing and operation workforce needs, there is an equally pressing need in the related electric utility infrastructure, where the turnover of an aging traditional electric utility employee base is outpacing the supply of skilled replacements. The shortfall may be as high as 10,000 by 2010 (DOE, 2006). According to the Center for Energy Workforce Development, at least half of the electric utilities’ technical workforce, including power line workers,
TABLE 6.3 Direct Jobs in the Renewable Energy Sector in 2006
|
Industry Segment |
Revenues/Budget (billion $) |
Direct Jobs |
|
Wind |
3.0 |
16,000 |
|
Photovoltaics |
1.0 |
6,800 |
|
Solar thermal |
0.1 |
800 |
|
Hydroelectric power |
4.0 |
8,000 |
|
Geothermal |
2.0 |
9,000 |
|
Biopower |
17.0 |
66,000 |
|
Federal government (including direct-support contractors) |
0.5 |
800 |
|
DOE laboratories (including direct-support contractors) |
1.8 |
3,600 |
|
State and local governments |
0.9 |
2,500 |
|
Source: Based on data from ASES, 2007. |
||
TABLE 6.4 Breakdown of Renewable-Energy-Specific Positions
|
Wind |
Solar |
Biomass |
Geothermal |
|
Electrical and mechanical engineers and technicians |
Electrical, mechanical, and chemical engineers and technicians |
Chemists and biochemists |
Geologists, geochemists, and geophysicists |
|
Aeronautical engineers |
Material scientists |
Agricultural specialists |
Hydrologists |
|
Construction workers |
Physicists |
Microbiologists |
Hydraulic engineers |
|
Meteorologists |
Construction workers, architects, and builders |
Electrical, mechanical, and chemical engineers and technicians |
HVAC contractors |
|
Source: Adapted from material in Council on Competitiveness, 2007. |
|||
TABLE 6.5 Selected Occupations of Employees at a 250-Person Wind Turbine Manufacturing Company in Ohio in 2006
|
Occupation |
Employees |
Earnings |
|
Engine and Other Machine Assemblers |
31 |
$36,300 |
|
Machinists |
27 |
40,500 |
|
Team Assemblers |
16 |
30,100 |
|
Computer-Controlled Machine Tool Operators |
12 |
40,600 |
|
Mechanical Engineers |
10 |
71,600 |
|
First-Line Supervisors/Managers of Production/Operating |
10 |
59,600 |
|
Inspectors, Testers, Sorters, Samplers, and Weighers |
8 |
40,400 |
|
Lathe and Turning Machine Tool Setters/Operators/Tenders |
6 |
40,000 |
|
Drilling and Boring Machine Tool Setters/Operators/Tenders |
4 |
39,800 |
|
Welders, Cutters, Solderers, and Brazers |
4 |
39,900 |
|
Laborers and Freight, Stock, and Material Movers |
4 |
29,800 |
|
Maintenance and Repair Workers |
4 |
44,100 |
|
Tool and Die Makers |
4 |
43,600 |
|
Grinding/Lapping/Polishing/Buffing Machine Tool Operators |
4 |
34,800 |
|
Multiple Machine Tool Setters/Operators/Tenders |
4 |
40,800 |
|
Industrial Engineers |
3 |
70,400 |
|
Industrial Machinery Mechanics |
3 |
46,000 |
|
Engineering Managers |
3 |
108,300 |
|
Shipping, Receiving, and Traffic Clerks |
3 |
32,100 |
|
General and Operations Managers |
3 |
120,600 |
|
Industrial Production Managers |
3 |
93,100 |
|
Industrial Truck and Tractor Operators |
3 |
34,200 |
|
Purchasing Agents |
3 |
56,200 |
|
Cutting/Punching/Press Machine Setters/Operators/Tenders |
3 |
31,400 |
|
Production, Planning, and Expediting Clerks |
3 |
45,200 |
|
Milling and Planning Machine Setters/Operators/Tenders |
3 |
40,600 |
|
Mechanical Drafters |
2 |
39,900 |
|
Customer Service Representatives |
2 |
39,100 |
|
Bookkeeping, Accounting, and Auditing Clerks |
2 |
35,600 |
|
Office Clerks, General |
2 |
29,400 |
|
Sales Representatives, Wholesale and Manufacturing |
2 |
55,300 |
|
Janitors and Cleaners |
2 |
29,800 |
|
Sales Engineers |
2 |
72,500 |
|
Accountants and Auditors |
2 |
59,800 |
|
Tool Grinders, Filers, and Sharpeners |
2 |
44,000 |
|
Executive Secretaries and Administrative Assistants |
2 |
43,200 |
|
Mechanical Engineering Technicians |
2 |
50,900 |
|
Electricians |
2 |
49,600 |
|
Other Employees |
48 |
49,700 |
|
Employee Total (126 occupations in the industry) |
250 |
$46,400 |
|
Source: ASES, 2007. Used with permission of the American Solar Energy Society. Copyright 2007 ASES. |
||
mechanics, installers, repairers, and first- and second-line supervisors, may retire in five to ten years (CEWD, 2007). These traditional electric utility roles are essential to the large-scale deployment and integration of renewable energy sources.
Training and Certification
To meet the growing demand for skilled workers, a variety of workforce development strategies are needed (Great Valley Center, 2003). Recent initiatives attempt to address the insufficient supply of skilled workers by instituting renewable energy-specific training, certification, and licensing programs. Some leading examples include:
-
New York State Energy Research and Development Authority. NYSERDA supports the development of an in-state network of training programs to provide accessible and quality instructional opportunities for those already in the renewable energy trades or those planning on entering the profession. NYSERDA has invested in developing seven accredited solar training centers and continuing education programs across the state through partnerships with community colleges, trade schools, universities, and trade unions (NYSERDA, 2005).
-
Florida Solar Energy Center. The center is a state-supported research and training institute in the area of renewable energy, with courses in photovoltaics and energy efficiency programs. In addition, the center develops curricula for national and international training on renewable energy, in partnership with other organizations, and offers these programs through distance learning.
-
Green Energy Ohio. A partnership of the Great Lakes Renewable Energy Association and Florida Solar Energy Center, Green Energy Ohio has a 5-day Photovoltaic (PV) Installer Apprentice Program. It is designed for individuals beginning a career as a PV system integrator, combining classroom sessions with field experience to introduce students to distributed generation technologies and interconnection issues, with a focus on solar energy.
-
Sonoma State University Energy Management and Design. The Energy Management and Design (EMD) Program provides either a B.A. or a B.S. degree in environmental studies. It provides management and design training in the application of a wide variety of energy efficiency
-
and renewable energy technologies. All EMD students must complete an internship, which provides experience in a professional setting. The program has several external relationships, including the California Energy Commission, Lawrence Berkeley National Laboratory, Pacific Gas and Electric Company, Sacramento Municipal Utility District, California Association of Building Energy Consultants, and the Northern California Solar Energy Association.
-
Midwest Renewable Energy Association. The MREA hosts a series of educational and hands-on workshops throughout the year, instructed by experienced renewable energy experts in small classroom settings and on-site installation locations. Workshop participants come from varied backgrounds, including homeowners, builders, educators, architects, engineers, and others. Participants can receive Continuing Education Units for attending workshops.
-
Central Carolina Community College. The college offers a course on introduction to PV system design, related to the properties and installation of solar panels that produce electricity. This course has been approved by the North American Board of Certified Energy Practitioners.
The federal government also is increasing its role in training. The Energy Independence and Security Act of 2007 authorizes a Department of Labor energy efficiency and renewable energy worker-training program. This legislation also establishes a grant program within the DOE’s Office of Solar Energy Technologies to create and strengthen solar-industry workforce training and internship programs for installation, operation, and maintenance of solar-energy devices.
To improve the workforce, there is a critical need to develop quality training programs that test and certify skill acquisition and capability. The Interstate Renewable Energy Council recommends criteria necessary for the design and implementation of workforce training programs (Weissman and Laflin, 2006). They include the need for the training institution to offer programs under the auspices of recognized third-party or government accreditation standards and development of curriculum based on industry-approved task analyses. The North American Board of Certified Energy Practitioners, an industry-based, non-profit credentialing organization that assesses competency and certifies solar installers, will be adding categories of certificates over time.
RENEWABLE ELECTRICITY INTEGRATION
The electric system balances and delivers power generation from a portfolio of resources to power demand centers that vary in scale and location. A modern electric grid is essential for overall reliability. Large-scale integration of renewables into the electricity system may require improved technologies to expand and upgrade the transmission and distribution system capabilities, and changes to utility and grid operations that can occur during system upgrades. This section discusses the potential impacts on utility and grid operations associated with renewable electricity deployment. Other aspects of renewables integration are considered in this report in Chapter 3, which discusses the technologies themselves; Chapter 4, which provides estimates of integration costs; and Chapter 7, which discusses scenarios that involve increased deployment of renewables and that include grid capacity needs.
System operators seek to ensure that generation and transmission resources meet the on-peak load within the entire control area with sufficient generating reserves and transmission capability to cover contingencies, in order to meet mandatory federal system reliability criteria. In most cases, a generation reserve margin2 of 15 percent is deemed adequate. If a given resource, such as wind, cannot be counted on to be available on peak with some degree of certainty, the grid operator cannot count on it to meet the resource adequacy requirement. In California, the wind resource available on peak is on average less than 7 percent of the nameplate rating3 of the aggregated machines and frequently is of the order of 1 percent (CALISO, 2007). In New York, GE estimated an average onshore capacity value of 9 percent and an offshore value of 36 percent (GE Energy, 2005).
A grid can support some intermittent resources without electricity storage if sufficient excess capacity is available to maintain resource adequacy. As described below and in Chapter 7, in many cases the amount of intermittent renewable resources that can be supported is approximately 20 percent, particularly for utilities that rely primarily on hydropower or natural-gas-fired generation. Hydropower and natural-gas-fired plants can ramp levels of generation up or down fairly rapidly, and are able to incorporate a higher fraction of renewables than
utilities that rely on nuclear and coal-fired generation, which cannot ramp up or down quickly. Increases in ancillary services and additions of storage or other dispatchable resources may be necessary to maintain system reliability as the system mix is diversified. For example, a New York State study demonstrated that wind generation could be introduced up to about 10 percent of total capacity of the network without adding storage (GE Energy, 2005), although the location of the wind resources might require additional transmission due to wind capacity generated constraints. Dispatchable resources, typically natural-gas-fired units and sometimes hydropower, and interruptible demand are used to compensate for the lack of dispatchable resources when scheduled wind or other capacity diminishes.
Transmission Considerations
The prospect of large-scale development of renewable energy resources raises issues of electricity transmission grid adequacy, planning, and expansion. Because they are manufactured technologies, renewable energy generating systems can be constructed much more rapidly than can baseload fossil-fuel or nuclear plants. Dramatic expansion of the renewable electricity base in the United States implicates the need for improvement and expansion of the transmission grid. Of course, transmission grid development would be required as part of a significant expansion of the conventional electricity resource base as well. The primary difference is in the timing of this development.
Large conventional power plants, such as nuclear and coal units, require much lead time and many years of planning and construction, and therefore, transmission to serve these units can be addressed later in the construction process. This is not so with wind or solar farms which can be constructed in a matter of months or a few years (Bierden, 2007; Sheedan and Hetznecker, 2008). A systems perspective will be required in order to dramatically increase the contribution of large-scale renewables to electricity supply, one which undertakes consideration of transmission and other infrastructure needs for the whole utility or electricity control area4 well in advance of generation plant construction. Though there is scant experience with this approach to electricity system development, there would be potential efficiency benefits in planning and constructing the grid as part of
an overall resource development process. These benefits could include least-cost route planning, sensitivity to environmental and cultural resources, planning for maximum beneficial use by all generation resources, and proactive design for system reliability and security. These benefits might be sufficient to offset some of the costs of building large-scale transmission systems in advance of generation interconnection demand, but further study is required.
In Texas, rapid growth of the development of west Texas wind resources without a coordinated transmission development plan has led to curtailment of renewable electricity generation and system congestion. The Texas Legislature created the Competitive Renewable Energy Zones model to rationalize renewable electricity development and necessary transmission support. After 3 years of regulatory proceedings, the Public Utility Commission of Texas adopted a plan. The challenge that Texas faces now is whether it can efficiently and rapidly extend the transmission system to support its world-leading pace of renewable electricity development. The Texas experience highlights the importance of transmission system planning and development for the rest of the nation. Outside of the Electric Reliability Council of Texas (ERCOT), these planning and development functions would be even more challenging due to the involvement of multiple states and regulatory jurisdictions.
Reaching out for outstanding resources capable of sustaining large installations is typical of early stage power option development—whether it is fuel or some other key supporting resource. Mine-mouth coal plants, rail-dependent coal plants, large hydropower, geothermal (ring of fire), large wind, large solar, coastal/riverine nuclear (for cooling), and carbon capture and storage (CCS)-ready coal are all examples. Two important points bear consideration. First, investment in infrastructure to reach these resources supports capturing economies of manufacturing scale and thereby driving down prices, while also improving technological performance to support deployment in less optimal (and less remote) locations. Second, the cost of building infrastructure to capture remote wind, for example, can be mitigated by planning lines to deliver system-wide reliability and security benefits. Conventional plants can generally no longer locate near load centers due to air quality non-attainment designations associated with most large urban areas, so expanding capacity to meet increasing demand will require building all power plants in relatively remote locations. Large “interstate” transmission highways can support not just renewables but also conventional energy, reliability, and system security. Finally, in many cases the energy and fuel savings associated with captur-
ing large amounts of renewables can help offset the incremental remaining costs of new transmission infrastructure.
The Committee on America’s Energy Future (AEF), through its subgroup on electric power transmission and distribution (T&D subgroup) is considering the needs of the grid in its upcoming report (NAS-NAE-NRC, 2009). The T&D subgroup is focusing on the need to add more transmission lines, modernize vintage equipment, and introduce new technologies, which includes introducing advanced equipment; measurements, communications, and control technologies; and improved decision support tools. The benefits from an improved grid as discussed by the AEF T&D subgroup include economic, security, and environmental benefits, extending beyond additional needs for increased renewable electricity generation.
Studies on the Integration of Renewables
Numerous studies of the integration of renewables into the electric system have looked almost exclusively at integration of wind power, because wind is the intermittent renewable with generation capacity approaching levels where integration becomes important. Several reviews analyze, summarize, and cross-compare these various state and national studies (see, for example, Parsons et al., 2006; Holttinen et al., 2007; DOE, 2008a).5 Although the individual studies use different assumptions and modeling techniques, these reviews provide some synthesis and offer general observations. First, it appears that large, diverse balancing areas with robust transmission are a key factor to reducing wind’s impacts as its market penetration increases. Second, although wind speeds vary continuously (e.g., from second to second), wind power fluctuation is comparatively lower for very short periods of time, such that appropriate attention to the ramp rates for a given system can overcome these fluctuations (Wan, 2004). As a result, regulation impacts (variations measured in seconds or minutes) are small, but load-following and unit commitment can entail much higher costs. Third, improved wind forecasting can play an important role in reducing integration challenges and costs, particularly for unit commitment. Finally, based on techniques and methods used to analyze wind’s impacts, Parsons et al. (2006) concluded that it is important to focus on
|
5 |
Many additional reviews are available on the Utility Wind Integration Group website (http://www.uwig.org) and two large studies (the eastern wind integration and transmission study, and the western wind and solar integration study) are expected in 2009. |
balancing the system as opposed to individual parts; in other words, not every movement needs to be matched on a one-to-one basis in order to maintain a stable grid.
The individual studies tend to focus on associated costs (and in some cases economic benefits), with less attention to the more technical aspects and limitations of integration. Most U.S. studies model potential impacts of meeting a state’s renewables portfolio standard and do not necessarily seek to identify upper limits for market penetration. Current systems can handle wind market penetrations of up to 10–20 percent based on capacity, and costs tend to increase with penetration (Parsons et al., 2006). New York State conducted perhaps the most comprehensive domestic study to date to examine the potential impacts of integrating wind power equal to 10 percent of the state’s estimated peak load for 2008 (NYSERDA, 2005). It concluded that the state could accommodate at least that amount of market penetration of wind generation with only minor adjustments to its existing system and practices (NYSERDA, 2005). Minnesota conducted a similar study that estimated that the Midwest Independent System Operator market could accommodate wind penetration of at least 25 percent of Minnesota’s retail electricity sales, at an added integration operating cost of ~$4.41/MWh (MPUC, 2006). A Colorado utility commissioned studies of 10, 15, and 20 percent wind penetration (nameplate capacity relative to peak load) and the associated cost implications, which showed that integration costs would rise as market penetration increased, but that improved forecasting would help reduce these costs, estimated to be ~$5.13/MWh (EnerNex, 2008).
The California Intermittency Assessment Project (Davis and Quach, 2007) considered a portfolio of renewables that could be used as the state pursues a goal of obtaining 33 percent of its electricity from renewables by 2020. The study concludes that the 2020 goal is feasible (assuming some needed transmission line upgrades), and that most of this would be provided by wind and solar, two intermittent resources that together would represent 31 percent penetration of California ISO’s market. Another large regional assessment, the Northwest Wind Integration Action Plan (NPCC, 2007), synthesizes several studies from the Pacific Northwest and finds no technical barriers to achieving a regional goal of 6000 MW of wind, although cost may become a limiting factor as some of the states reach 30 percent wind penetration. A recent international assessment (Holttinen et al., 2007) also indicates that the barriers to substantial wind penetration are not technical, but social and economic. This review draws on some of the only practi-
cal experience6 to date (e.g., in Germany and Denmark); it suggests that in the regions where wind already meets more than 20 percent of gross demand, interconnection capacity has allowed grid operators to maintain balance within the grid, and curtailment of wind power is rare.
Another approach to improving wind power integration is to have an interconnected, geographically dispersed resource base (NERC, 2009). Archer and Jacobson (2007) considered the impacts of connecting wind farms with transmission throughout a given geographical area and found that such an interconnected system increases the capacity factor associated with the wind power. Using hourly wind data, this study simulated 19 sites in the Midwest with wind speeds greater than 6.9 meters/second and found that an average of 33 percent and a maximum of 47 percent of yearly averaged wind power from the pooled resources could be used as baseload electric power. Similarly, Hawkins and Rothleder (2006) found that having wind generation spread into five separate geographical areas with different weather patterns and power production patterns improved the management of the wind power production in California.
Co-Siting of Electricity Generators
Co-siting of generators has the potential to smooth temporal variations of electricity generation associated with intermittent renewable resources. For example, as shown in the wind resources map in Chapter 2 (Figure 2.1), some of the best wind resources are located away from demand centers and existing transmission capacity. If an intermittent resource is located at some distance from any load center and if there is insufficient transmission in the vicinity of the resource, transmission lines have been and will continue to be built or upgraded. The dilemma is how to size the transmission line. If size is based on the nameplate rating of the aggregated generation, the line will not be fully used. If the line is sized based on a criterion related to average capacity, then there will be times when some of the remote generation will be curtailed. Though no transmission line is loaded to capacity all of the time, increasing the usage through co-location could improve the economics of additional transmission capacity by smoothing temporal variations in electricity generation. It should be noted that in the concept of co-location
of resources for pooling transmission resources, the effect is the same if the plants are close but not actually on the same site.
Conventional and Renewable Electricity Generators
Co-location of a conventional fossil-fired power generator in close proximity to the renewable resource can address renewable intermittency. For example, Mesa Energy has recently announced plans to build 500–600 MW of natural gas base-load capacity and a separate 300 MW of peaking capacity in close proximity to its West Texas wind farm development (Stern, 2008). The approach taken by Mesa and others is intended to allow the transmission line not only to be dedicated to the wind resource to increase its utilization, but also to be amortized as part of the greater generation/transmission system in that area. Consideration must be given, of course, to fuel transportation costs, since generators would not necessarily be located near fossil resources or existing distribution networks.
Two (or More) Renewable Electricity Generators
In certain locations within the United States, two (or more) renewable resources may be co-located to take advantage of temporal synergies, including both daily and seasonal fluctuations. Wind and solar are intermittent resources that can interact synergistically in locations where solar energy peaks during daylight hours and wind energy peaks during late-night hours. Meteorological conditions may also create synergies between solar and wind power, such as in areas of the country where low barometric pressure fronts create more windy and cloudy conditions, and stable, high-pressure conditions create sunny, stagnant conditions.
Co-location might also help renewable generation located in remote regions. The California Renewable Energy Transmission Initiative has looked at the use of Competitive Renewable Energy Zones (CREZs) to aggregate projects based on their physical location and shared transmission needs (Black & Veatch, 2008). Significant progress has been made in Texas’s CREZs, and recently specific projects have been purposed to take advantage of the new transmission structure.7 The issue of co-locating renewables is also the subject of the NREL Western Wind and Solar study looking at the costs and operating impacts due to the variability and uncertainty of wind, PV and concentrating solar power (CSP) on the grid (Lew,
2008). Hydropower has been used in Europe to balance wind power production. In particular, Denmark is able to balance its large penetration of wind (almost 20 percent of generation in 2007) in part due to its interconnection to hydropower production in Norway and Sweden and its interconnection to Germany (Sharman, 2005).
Renewable Generators and Storage
Greater use of storage technologies as discussed in Chapters 3 and 4 is an important consideration with respect to renewables’ contribution to electricity generation for the later time periods (post-2020) if the level of generation by non-hydropower renewables reaches 20 percent and above. In the mid-term (2020–2035), storage capacity could help relieve the sizing of transmission lines from remote renewable resources as well as increase the flexibility of those resources. Storage tied to intermittent renewables can have three distinct purposes: (1) to increase the flexibility of the resources; (2) to increase the use of transmission line(s) connecting the resource to the grid; and (3) to increase the on-peak availability of renewable electricity. The last is particularly relevant if the resource is remotely located from the load centers, though it would have similar value for local wind resources. Several types of electricity storage used or under consideration for supplementing renewable electricity include pumped hydropower, compressed air energy storage (CAES), and advanced stationary batteries. In the renewable electricity context, chemical energy storage that uses the electricity generated from distributed technologies and the customer side of the meter, such as solar, wind, or other renewable resources, could run an electrolysis process that creates hydrogen or another fuel. As noted in Chapter 3, storage could increase the interconnection between the generation and transportation sectors. Because large-scale storage is not necessary until later timeframes (post-2020), it is not necessary at this time to identify what approach to storage would be the most functional with renewables.
RENEWABLE ENERGY MARKETS
Deploying new technologies requires a concerted effort in overcoming market barriers (Box 6.2) and in meeting investment requirements. Businesses generally adhere to a strict economic payback criterion: an internal rate of return (IRR), often >15 percent, that must be met for any corporate investment to be under-
|
BOX 6.2 Key Barriers, Opportunities, and Stakeholders Affecting the Wide-Scale Deployment and Integration of Renewable Energy Sources Barriers Relatively High Costs
Lack of Knowledge
Opportunities
Stakeholders
Market Inertia and Risk Aversion
Infrastructure Limitations
Lack of Performance Validation and Experience
|
taken. Surmounting market barriers to new renewable energy commercialization requires both alleviating consumer hesitancy to try new products and mitigating business risks associated with adopting technologies prior to a predictable, measurable market demand (Brown et al., 2007). Significant difficulties are associated with attempting to enter and successfully compete in well-established, highly regulated, structured markets characterized by large, well-capitalized incumbents. As a general rule, financial markets demand higher returns from investments by new market entrants than from incumbents. This fact reflects the risk associated with being a market challenger and constitutes a market barrier for the challenger.
Basic Market Structure
Renewable energy markets have some distinctive attributes compared to traditional electricity markets. Markets for renewable electricity can be viewed from two perspectives: distributed power production, where the electric power is generated and used on-site; and wholesale power production,8 where the electricity is sold and distributed to customers through the transmission and distribution grid. In each of these renewable electricity market structures, the energy generated and its associated renewable attributes can be, and frequently are, sold separately.9 Rather than being lumped together with all the generation on the local electrical grid, renewable attributes can follow a contract path to a customer, giving the end purchaser a legitimate claim of a specific percentage of renewable electricity in that electricity purchase. The math is fairly simple: 1 kWh of conventional system power, plus 1 kWh worth of wind energy attributes (uniquely used and sold to a single ultimate customer), equals one unit of renewable electricity. The ability to track and sell the electricity and the renewable attributes associated with that energy substantially increases renewable energy market opportunities by increasing the number of ways that renewable energy sales can occur. Box 6.3 indicates the wide array of markets that can be available to renewable electricity for one of these two attributes. Market flexibility opens more opportunities for renewable
|
BOX 6.3 Types of Renewable Electricity Ownership and Markets Customer Ownership With customer-owned renewable energy generation equipment, the self-generation of electricity displaces an existing or potential purchase of electricity from the grid or other source of generation. Solar photovoltaics and small-scale wind are examples of distributed generation (customer-owned generation). In this case, a homeowner will invest the needed capital to pay for the system purchase and installation, with cost recovery occurring over some period of time from displaced electricity savings. Third-Party Ownership Under the third-party ownership model, third-party companies install and own renewable energy systems on behalf of a host utility customer. Such systems are located behind the meter on a utility customer’s premises. The third-party company acts as technology integrator, project developer, and system operator, and often secures the project financing. The electricity generated is sold to the host customer at a rate at or below the prevailing utility retail rate. The success of this model often relies on several key factors, including (1) net metering, which allows valuation of displaced grid electricity at the prevailing retail rate; and (2) the ability of the third-party entity to raise capital at rates well below the IRR hurdle of the private companies. Other factors include the availability of federal and state incentives; the existence of a time-of-use utility tariff in which the utility’s high-price rate tiers match well with the solar electricity output; and an existing market for renewable energy credits, which provides additional value. Wholesale Energy Wholesale, or utility-scale, projects generally compete against wholesale power prices. Larger projects can usually achieve lower costs from economies of scale throughout the value chain. In the case of PV, price competition can also encourage a greater degree of vertical integration throughout the PV value chain to achieve available cost savings and margin compression. In the most extreme example, a project developer with PV module manufacturing capabilities might have a distinct advantage in offering the lowest-priced solar projects. Utility-scale projects can take the form of either utility ownership or third-party ownership using traditional power purchase agreements (PPAs). To date, most utilities have used the PPA model for solar project development, primarily because of technology risk considerations1 and the fact that utility property is not currently eligible for the federal ITC. |
|
Utility Ownership Some key benefits of utility ownership include long-term amortization of capital investments (often 30 years), the ability to manage electricity transmission requirements, and the ability to manage grid impacts. Utilities can also earn a rate of return on owned assets unlike with PPAs, which are a cost pass-through to customers. However, utilities typically do not vertically integrate into equipment manufacture, and thus are subject to paying market prices for the renewable technologies. Utility-Sponsored Green Pricing In many jurisdictions, customers can buy electricity from a renewable energy facility through the grid via a utility-sponsored green pricing program. These programs tend to have a cost premium for subscribing to renewable electricity, though customers may also enjoy the system benefits associated with renewable energy purchases, including the value of saved fuel costs or costs associated with pollution control equipment required by fossil generation. Renewable Energy Credits or Certificates Customers can directly buy renewable energy credits to match with their conventional electricity purchases in order to green their electricity use. The U.S. EPA Green Power Partners Program calls attention to voluntary renewable energy credits purchases by large electricity users. Retail Electricity Choice In relatively few jurisdictions, customers may choose their retail electricity supplier. Some of these suppliers offer renewable electricity options.2 Given the mechanics of electricity markets, these suppliers are typically selling a retail product comprised of generic system power combined with renewable energy credits. |
|
Renewables Portfolio Standards Many customers are indirect purchasers of renewable energy through their utilities. In states where utilities or retail suppliers are required, typically by legislation, to procure a minimum amount of renewable energy for their total portfolio (under a renewables portfolio standard), all customers contribute indirectly to increasing the renewable electricity in the grid. The notion behind the RPS concept is that customers acting together can procure more renewable energy at a lower individual cost than they would as individual retail purchasers. Most RPSs also incorporate tradable renewable energy certificate programs designed to use market forces to reduce the total cost of procuring the renewable energy. Utility Resource Planning or Integrated Resource Planning In recent years, public utility regulatory authorities have been revisiting the process of comprehensive resource planning review for regulated utilities. Utilities submitting resource or integrated resource plans are often required to procure increasing amounts of renewable energy generation as a way to diversify supply, reduce costs, reduce emissions, and support economic development. Acquisition costs are rate-based and spread to all utility customers according to traditional regulatory approaches. |
electricity to become part of the supply mix and increases the number of potential customers.
Market Infrastructure and Inertia
Mature industries have established, complex, and interdependent industry structures, where specialization in supporting sectors, such as maintenance and service, law, regulation, financial support, and insurance, develop and become more efficient as a business sector expands. In well-established markets, supply chain actors integrate effectively; parts and tools become standardized; and operating standards are adopted. Emerging industries are in a transition between novel and mature status; product demand, growth potential, and market infrastructure needs are unknown. Emerging renewable energy technologies are speculative, as both the individual companies and the industry itself have yet to be established in the larger electricity sector. Expanding the use of renewable energy technologies will require
an appropriate distribution chain to move the product from the manufacturer through to the consumer (OECD/IEA, 2003). Some technologies may not easily fit into an existing market infrastructure. Moreover, the availability, quality, and location of resources vary by region and thus will have an important impact on how regional infrastructure will develop. Failure of the emerging renewable energy industry to mature in a timely fashion poses a significant impediment to substantially increasing renewable energy availability.
Established markets and incumbent technologies are better insulated from policy and regulatory variations than are emergent ones. Markets and industries organize around and within their regulatory and policy frameworks and become conservative, maintaining stability and reducing risk. The large, interconnected nature of established industries, especially one as large as the electric service sector, also distributes risk broadly and efficiently through a well-developed value chain. Renewable electricity is only beginning to realize this kind of stability, and only in parts of the United States.
Market inertia is an initial challenge to renewable energy deployment. Inertia (or resistance to change) is found in well-established conventional energy markets. Likewise, consumers are resistant to change. A study on the differing views of the target consumer and the manufacturer when making a value assessment during new product introduction and adoption concluded that, when sizing up a new product, consumers tend to assign its product value based on a perceived value (using experiences with similar products as a point of reference) as opposed to the actual product value (Gourville and Sellers, 2006). The consumer also practices a high level of loss aversion and assigns greater weight to potential shortcomings than to potential benefits. Manufacturers marketing a new product, on the other hand, tend to overvalue the new product and overestimate the probability that the consumer will see the same value. Firms may also tend to invest in improvements to the cost-competitiveness of products they already manufacture or service. This type of technology lock-in helps explain why disruptive innovations typically result from new businesses and not existing firms (Brown et al., 2007).
DEPLOYMENT RISK AND RELATED ISSUES
Risk in its simplest form is the likelihood that things will not turn out the way we expect. For financial and economic performance, risk is the degree of likelihood that an investment will not yield sufficient returns. The impacts of this risk
can be found in the cost of capital and rates of returns required in the market. Investments in renewable energy markets are made all along the value chain, and all assume a certain ultimate range of sales of generated electricity and related products to the markets for renewable energy. In theory, the internal rate of return demanded by investors and the interest charged by lenders reflect the risk associated with a particular investment.
Economic and financial risk issues for renewable technologies involve a host of uncertainties associated with the electricity market. The growth in renewable energy as a share of U.S. electricity generation comes at the expense of incumbent conventional supply sources, and their potential growth in those sectors. While far from purely competitive due to an embedded system of rules, regulations, subsidies, habits, and customer expectations, the U.S. electricity system is still highly competitive, with mature energy companies directly competing with emerging renewable energy companies. Ultimately, renewable electricity will have to compete in this market environment, and investors and policy makers will assess the risks associated with the possible profit outcomes for renewable electricity business ventures against risks in other electricity sources, or in other investment opportunities in general.
Perspectives of Risk by Public and Private Sector Investors
Bringing increased renewable energy technologies to market requires public and private sector investment and commitment to overcome the various market barriers. Public and private sector investors will approach risk and related issues associated with renewable energy technologies from different perspectives, as outlined in Table 6.6. Private sector investment is typically based on the ability to achieve an acceptable return on investment and on projected business growth. The private sector’s decisions on whether to move ahead with a renewable electricity project usually begin with an evaluation of the business case for such an investment. On the other hand, public sector investments incorporate different criteria, such as whether to attempt to spur the development of technologies that meet public sector goals by taking on some of the early development and deployment risks that the private sector may not assume. Government investment in high-risk research and development provides the information and impetus for the private sector to pursue public sector goals, and it also reduces deployment risks to private sector investors by developing technology certifications and standards. Decades of research funded by DOE in the areas of energy efficiency and fossil energy have
TABLE 6.6 Key Characteristics and Perspectives of Public and Private Sector Investors
|
|
Public Sector Investors |
Private Sector Investors |
|
Key goals |
|
|
|
||
|
Investment focus |
|
|
|
|
|
|
Biggest concern |
|
|
|
Other key contributing investor insights/expertise/strengths |
|
|
|
|
|
|
||
|
||
|
Key constraints on collaborations |
|
|
|
Key enablers needed |
|
|
|
|
Public Sector Investors |
Private Sector Investors |
|
Differences in funding process |
|
|
|
Pay off |
|
|
|
Source: Murphy and Edwards, 2003. |
||
yielded significant economic, environmental, and security benefits; new technical options with applications in other fields; and general contributions to the stock of scientific and technical knowledge (NRC, 2001).
Product Cost Evolution
New products, including renewable energy technologies, experience high initial cost in the market. Inexperience in the manufacturing and deployment process is one reason for higher costs and contributes to the greater risks for fiscal, regulatory, and other market participants in adopting a new technology. As outlined below, costs can come down as market participants gain experience with a new technology. However, using this market experience to reduce costs is greatly aided by the participation of early adopters and niche markets. Their feedback to other market participants, such as the technology manufacturers, installers, and regulators, can be critical for reducing costs.
Learning Curve
Technology learning based on increasing economies of scale in production, additional research and development, learning-by-doing, learning-by-using, and improvements in product distribution and service can result in cost reductions (IEA, 2008). Learning curves measure and illustrate the reduction in unit cost of
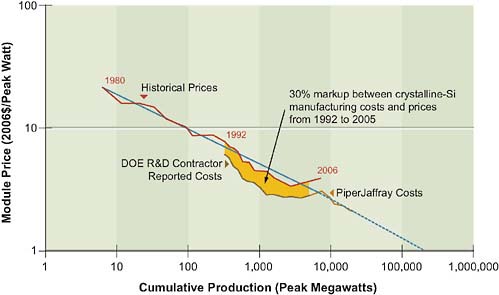
FIGURE 6.8 Learning curve cost reductions for crystalline silicon PV modules.
Source: Department of Energy; presented in Cornelius, 2007.
a technology as a function of the cumulative increase in sales and deployment of the technology (Jamasb, 2006). As demand increases, the manufacturer of the technology develops mechanisms to overcome barriers not directly related to the cost or performance of a technology. Subsequently, other market actors learn how to use the technology more efficiently. Figures 6.8 and 6.9 illustrate the historical decrease in cost of solar PV systems with a cumulative increase in installed capacity. This trend can be an indicator of future decreases; however, the panel recognizes the difficulty of achieving this goal. Other energy technologies have experienced similar cost decreases, as shown in the slope of the cost reduction curve for the natural gas combustion turbine in Figure 6.9. Other examples of estimated cost reductions associated with learning include large automobile manufacturers that show a cost reduction of 25 percent to 30 percent for a 10-fold increase in production volumes (personal communication, K.G. Duleep, February 26, 2008); the developer of the Tesla Roadster, a limited production electric sports car, contends that the cost for the vehicle could be reduced by a factor of two for a 10-fold increase in production volume (Newsweek, 2008); and an assessment of cost reductions needed for solar PV to reach 10 percent of electricity generation that
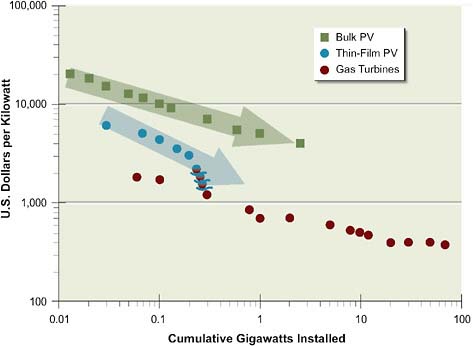
FIGURE 6.9 Learning curve cost reductions for crystalline silicon solar PV, thin-film solar PV, and natural gas combustion turbines.
Source: Courtesy of Charles Gay and Applied Materials.
assume an 18 percent reduction in installed PV cost (per MW) for every doubling of the market size (Pernick and Wilder, 2008).
Diffusion Curve
Technology deployment is a combination of market pull, where early stage consumers create a demand for the technology, and scientific push, where the technology developer actively promotes the technology to the market. Experience is gained in the market when innovators and early adopters willingly take new technology risks and encourage more risk adverse consumers that the technology is worth the investment (Mathur et al., 2007). The adage is that everyone wants to be the first to be the second to adopt a new technology. Market growth can be illustrated as in Figure 6.10 through use of the diffusion curve showing demand for a product increasing as early adopters start building on the experience of innovators. Market mechanisms, such as learning-by-doing and learning-by-using,
bring the product to the inflection point on the curve where demand increases rapidly. Prior to the inflection point, the demand for the technology may not be self-sustaining and could benefit from public/private partnerships to share early market risk and provide a feedback mechanism for integrating market experience with research and development activities. In addition, the shape of the diffusion curve varies by the characteristics of the technology and the local market, as shown in the diffusion curve in Figure 6.10.
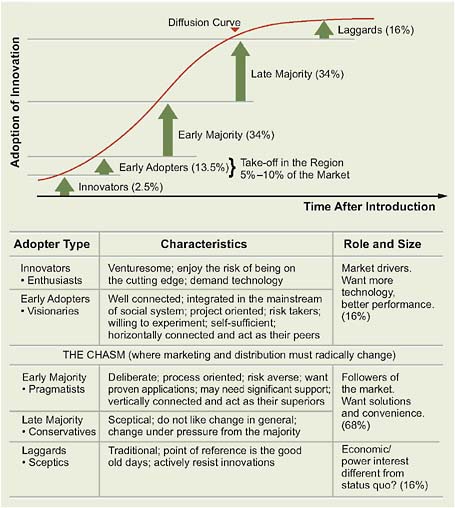
FIGURE 6.10 Generalized diffusion curve for adoption of new technologies and key characteristics of the various adopters.
Source: IEA, 2008.
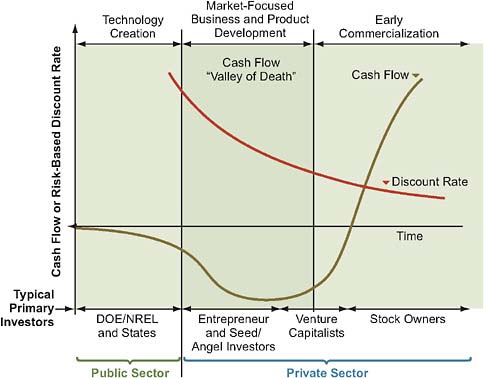
FIGURE 6.11 The cash flow valley of death for the process from product development to commercialization.
Source: Murphy and Edwards, 2008.
Commercialization Risk
Investment is necessary to move the new technology to the point of commercialization. Similar to the diffusion curve that illustrated the different market participants as demand for the product increases, Figure 6.11 illustrates the relative financial investment necessary to bring a new technology to the point of commercialization. Figure 6.11 depicts three broad stages of development where investment is needed: (1) the technology creation stage, when the public sector focuses its investment; (2) the cash flow valley of death10 stage, after product development
but before commercialization, when public sector financing may not be available and there is typically a dearth of private capital; and (3) the early commercialization stage, when a company has an improved position with respect to obtaining private sector investment (Murphy and Edwards, 2003). The risks associated with the introduction and successful deployment of a new technology are directly tied to whether the developers of the technology can successfully navigate through these various stages, especially the stage between technology innovation and commercial introduction.
Issues Related to Electricity Rates
Several issues related to the basic approach to electricity services rate regulation have a significant impact on the renewable electricity deployment risks. These issues particularly arise in three areas: (1) the treatment of intermittent resources; (2) the development of supporting infrastructure (hardware and policy) for bulk power (transmission); and (3) the development of supporting infrastructure (hardware and policy) for distributed energy resources. Numerous regulatory and policy initiatives have been launched to address these issues in recent years. The most significant risk facing the large-scale deployment of renewable electricity in this regard is whether policy makers and regulators will move to address these issues in an orderly, predictable, and sustainable fashion.
The relationships between rates and market behavior by suppliers and consumers are complex and vary by location; indeed, rate is a term that describes a whole host of tariffs,11 rates, and charges that affect those that interact with the electricity system. A renewable electricity facility, for example, faces a wholesale rate at which it can sell electricity and another rate for sales of capacity. There is one rate for transmission service, another for interconnection, yet another for standby service, and there may be ancillary services charges as well. As delivered to the end-user customers, the final bill for the electricity may include congestion charges, and ultimately will be bundled with distribution, metering, and billing-rate elements. Uncertainties about the application and charges in any such rate elements may slow progress toward greater deployment of renewable electricity.
A few examples of where growth in renewable electricity market penetration may conflict with the current rate structure and where regulatory risk associated with rates may be significant include:
-
The volume-based, average rate per customer class model for consumption favors baseload generation capacity and fails to create incentives for resources like photovoltaics that generate electricity on or near peak.
-
Net metering schemes that do not assign full retail value to generation occurring behind-the-meter may not encourage distributed generation.
-
Transmission capacity reservation and shortfall charges that drive high availability for dispatchable resources (such as natural gas turbines) can effectively preclude cost-effective deployment of intermittent resources.
-
Rate structures driven by efforts to encourage all-requirements loads and customers in order to build demand for capital investments often penalize partial-requirements loads coupled with self-generation. Renewed interest in demand-response and interruptible loads may require reexamination of rate-making fundamentals.
There is a chicken-and-egg problem associated with rates. Most often in the United States, rates are calculated based on extrapolation from a historical test year of experience, and adjudicated in contested rate cases. While the general constructs of rate making are well understood, there are variations in all the jurisdictions with authority to impose them. These jurisdictions are primarily states and the federal government, but also include municipal governments, electric cooperative boards, and multistate electric reliability and transmission authorities. Because there has been relatively little experience in the United States with large-scale deployment of renewable electricity (above the scale where significant impacts are experienced), there is relatively little actual data on which to construct fair and non-discriminatory rates. Any period of expansion in the amount of renewable electricity will therefore be accompanied by risk related to how the rate structure treats renewables.
Policy and Regulatory Risk
The relationships among markets to policy and regulation can be contributory, supportive, symbiotic, and parasitic. This is true for the electricity market as well as all sectors of the economy. All participants in the electricity market seem to agree that policy and regulation can have a profound impact on energy markets and that predictability and sustainability are highly valued. Electricity markets operate within a web of interlocking, overlapping, and sometimes conflicting pol-
icy prescriptions and legal and regulatory structures.12 The key risks engendered by this pervasive regime relate to the degree to which one can expect that future policies will conform to reasonable expectations. For example, uncertainty surrounding the renewal of federal production tax credit policy for renewables carries a potential impact for the renewables industry in the billions of dollars. Regulation is the tool for implementing policy in the electric industry, even when that implementation involves relaxation of regulation. As the United States Supreme Court has held, when business is “affected with the public interest,” such regulation is proper (Munn v. State of Illinois, 94 US 113 [1876]). There are few industries so affected with the public interest as that of electricity.
Renewable electricity will always be fundamentally affected by wider regulatory and policy conditions existing in electricity markets for several reasons. First, of course, is the ubiquity of electric service in the United States. Second, the dominant industry model is one based on spreading of costs through franchised service via regulated utilities. Even when some degree of competitive market structure exists as it does in much of the electricity sector today, the industry remains highly regulated. Third, the most significant environmental attributes of electricity are also spread broadly through energy security and reducing greenhouse gases. Indeed, greenhouse gas emissions are part of a global budget of atmospheric gases. Finally, the technologies and businesses of renewable electricity are young and relatively immature. Development of renewables depends on research and development, as well as special subsidies and manipulation of the existing markets, for renewables to succeed against well-established incumbents that enjoy embedded subsidies of their own.
Electricity Sector Regulation
Regulators and policy makers in the electricity sector are often uncertain about how to deal with new market entrants, new technologies, and new product and service models. Charged with protecting the general public interest, regulators, and policy makers often approach innovation with caution, and on an ad hoc basis. Regulation and policy designed for incumbent industries may not be well suited to emerging technologies and businesses, but efficient alternatives are not often apparent. New market entrants often face risk due to lack of clarity and
|
12 |
The various incentives for renewable energy are catalogued by the Database of State Incentives for Renewables and Efficiency (DSIRE), available at www.dsireusa.org. |
specificity; newcomers must spend proportionally more time and money to engage with the regulatory systems than well-known incumbents.
Large-scale deployment of renewable electricity will add a new dimension to this uncertainty. For example, relatively simple and clear regulatory and management solutions exist for wind penetration rates of 1 percent or 2 percent, but the need for potentially expensive regulatory changes and ancillary services may occur as system penetration rates reach 10 percent to 20 percent and higher. Moreover, effective response to system-scale issues requires comprehensive reviews and solutions. Regulatory processes, such as integrated resource planning, rate cases, and broad revisions of transmission system pricing regimes, place heavy demands on scarce regulatory resources.
Climate Regulation
Climate change regulation and policy are emerging in many local and regional jurisdictions around the United States. Many other countries have also implemented climate regulations. Indeed, increasing attention and concern about the potential for global climate change is having impacts on business decision making and risk evaluation, especially companies operating in the power sector and energy-intensive industries. Renewable energy industries should benefit greatly from comprehensive and effective regulation to reduce or avoid greenhouse gas emissions. Greenhouse gas regulation will likely affect the relative costs of renewable electricity and non-renewable fossil-fuel and nuclear power options and spur more rapid technology improvement in renewables. However, there are risks. Greenhouse gas regulation is itself a new thing, and changes and inconsistencies are inevitable. Because this regulation will have a direct impact on the costs and market opportunities for both incumbent and emerging technologies, the degree of orderliness and predictability of changes in regulations constitutes a significant risk factor for large-scale deployment of renewables.
Lash and Wellington (2007) categorize business risks associated with the public and regulatory climate change concerns as follows:
-
Regulatory risk. Rates and direct regulation of emissions.
-
Supply chain risk. Higher component and energy costs as suppliers pass along increasing carbon-related costs to their customers.
-
Product and technology risk. Ability to identify new market opportunities for climate-friendly products and services.
-
Litigation risk. Threat of lawsuits against companies that generate significant carbon.
-
Reputational risk. Public, or consumer, perception on the role of the company as a steward of the environment.
-
Physical risk. Risk posed by climate change as droughts, floods, and storms become more frequent and more severe.
These risks and benefits are summarized in Box 6.4. Deployment of renewable energy technologies can help electricity generators mitigate climate-change-related risks through reduced risk exposure, direct reductions in greenhouse gas emissions, improved ability to take advantage of climate policy incentives, reduced resource use, and improved perception of corporate social responsibility (Pater, 2006).
Environmental Policy
As discussed in Chapter 5, renewable electricity deployment is particularly site specific, whether for resource availability or access to infrastructure. The permitting process is intended to consider the local impacts on the land, water, and air that occur during the installation and operation of these technologies. As a result, local, state, and national governmental policies and regulations affecting the siting of generation and associated facilities will have a major impact on renewable energy deployment. The range of local, state, and national regulations confronting development also grows, and the risk of variability and inconsistency likewise increases as the scale of renewable energy deployment grows.
FINDINGS
Shown in bold below are the most critical elements of the panel’s findings, based on its examination of issues related to the deployment of renewable electricity into the U.S. electricity supply.
Policy, technology, and capital are all critical for the deployment of renewable electricity. In addition to enhanced technological capabilities, adequate manufacturing capacity, predictable policy conditions, acceptable financial risks, and access to capital are all needed to greatly accelerate the deployment of renewable electricity. Improvements in the relative position of renewable electricity will
require consistent and long-term commitments from policy makers and the public. Investments and market-facing research that focuses on market needs as opposed to technology needs are also required to enable business growth and market transformations.
Successful technology deployment in emerging energy sectors such as renew-
able electricity depends on sustained government policies, both at the project and at the program level, and continued progress requires stable and orderly government participation. Uncertainty created when policies cycle on and off, as has been the case with the federal production tax credit, can hamper the development of new projects and reduce the number of market participants. Significant increases in renewable electricity generation will also be contingent on concomitant improvements in several areas, including the size and training of the workforce; the capabilities of the transmission and distribution grids; and the framework and regulations under which the systems are operated. As with other energy resources, the material deployment of renewable electricity will necessitate large and ongoing infusions of capital. However, renewable energy requires a greater allocation of capital than do the conventional fossil-based energy technologies to manufacturing and infrastructure requirements.
Integration of the intermittent characteristics of wind and solar power into the electricity system is critical for large-scale deployment of renewable electricity. Advanced storage technologies will play an important role in supporting the widespread deployment of intermittent renewable electric power above approximately 20 percent of electricity generation, although electricity storage is not necessary below 20 percent. Storage tied to renewable resources has three distinct purposes: (1) to increase the flexibility of the resources in providing power when the sun is not shining or the wind is not blowing, (2) to allow the use of energy on peak when its value is greatest, and (3) to facilitate increased use of the transmission line(s) that connect the resource to the grid. The last is particularly relevant if the resource is located far from the load centers or if the system output does not match peak load times well, as is often the case with wind power. However, wind power’s development is occurring long before widespread storage will be economical. Although storage is not required for continued expansion of wind power, the inability to maximize the use of transmission corridors built to move wind resources to load centers represents an inefficient deployment of resources. Several parties are currently exploring the co-location of natural-gas-fired generation and other types of electricity generation with wind power generation to bridge this gap between storage technology and asset utilization. The co-siting of conventional dispatchable generation sources (such as natural-gas-fired combustion turbines or combined cycle plants) with renewable resources could serve as an interim mechanism to increase the value of renewable electric power until advanced storage technologies are technically feasible and economically attractive. The location of such natural-gas-fired generation could be at or near the wind resource, or at an
appropriate site within the control area. Another possibility is the co-siting of two (or more) renewable resources, such as wind and solar resources, which might on average interact synergistically with respect to their temporal patterns of power generation and needs for transmission capacity.
Finally, it is important to note that the deployment needs and impacts from renewable electricity deployment are not evenly distributed regionally. Development of solar and wind power resources has been growing at an average annual rate of 20 percent and higher over the past decade. Overall electricity demand is forecasted to continue to grow at just under 1 percent annually until 2030, with the southeastern and southwestern regions of the United States expected to see most of this growth. Although some of this growth may correspond to areas where renewable resources are available, some of it will not, indicating the possible need for increases in electricity transmission capacity.
REFERENCES
Ancona, D., and J. McVeigh. 2001. Wind Turbine—Materials and Manufacturing Fact Sheet. Princeton Energy Resources International. Prepared for Office of Industrial Technologies, U.S. Department of Energy. Washington, D.C.
Archer, C.L., and M.Z. Jacobson. 2007. Supplying baseload power and reducing transmission requirements by interconnecting wind farms. Journal of Applied Meteorology and Climatology 46:1701-1717.
ASES (American Solar Energy Society). 2007. Renewable Energy and Energy Efficiency: Economic Drivers for the 21st Century. R. Bezdek, principal investigator, Management Information Services, Inc. Washington, D.C.
AWEA (American Wind Energy Association). 2008. Wind Power Outlook 2008. Washington, D.C.
Bierden, P. 2007. The process of developing wind power generators. Presentation at the second meeting of the Panel on Electricity from Renewable Resources, December 6, 2007. Washington, D.C.
Black & Veatch. 2008. Renewable Energy Transmission Initiative RETI Phase 1B—Resource Report. RETI-1000-2008-003-F. Prepared for RETI Stakeholder Steering Committee, Renewable Energy Transmission Initiative (RETI), Sacramento, Calif.
Bowen, J.L., and C.M. Christensen. 1995. Disruptive technologies, catching the wave. Harvard Business Review 73(1):43-53.
Bradford, T. 2008. Solar energy market update 2008—PV and CSP. Presentation at Solar Market Outlook: A Day of Data, February 19, 2008. New York.
Brown, M., J. Chandler, M.V. Lapsa, and B.K. Sovacol. 2007. Carbon Lock-in: Barriers to Deploying Climate Change Mitigation Technologies. ORNL/TM-2007/124. Oak Ridge, Tenn.: Oak Ridge National Laboratory. November.
CALISO (California Independent System Operator Corporation). 2007. Annual Report. Folsom, Calif.
CEWD (Center for Energy Workforce Development). 2007. An Action Plan for Workforce Development. Washington, D.C.
Cornelius, C. 2007. DOE Solar Energy Technologies Program. Presentation at the first meeting of the Panel on Electricity from Renewable Resources, September 18, 2007. Washington, D.C.
Council on Competitiveness. 2007. Energy Security, Innovation, and Sustainability. Washington, D.C.
Davis, R.E., and W. Quach. 2007. Intermittency Analysis Project: Appendix A. Intermittency Impacts of Wind and Solar Resources on Transmission Reliability. CEC-500-2007-081-APA. PIER Renewable Energy Technologies Program. Sacramento, Calif.: California Energy Commission.
DOE (U.S. Department of Energy). 2006. Workforce Trends in the Electric Utility Industry. Prepared for the United States Congress. Washington, D.C.
DOE. 2008a. 20% Wind Energy by 2030—Increasing Wind Energy’s Contribution to U.S. Electricity Supply. Office of Energy Efficiency and Renewable Energy. Washington, D.C.
DOE. 2008b. Annual Report on U.S. Wind Power Installation, Cost, and Performance Trends. Office of Energy Efficiency and Renewable Energy. Washington, D.C.
EER (Emerging Energy Research). 2007. U.S. Wind Power Markets and Strategies, 2007-2015. Cambridge, Mass.
EIA (Energy Information Agency). 2007. Solar Thermal and Photovoltaic Collector Manufacturing Activities, Renewable Energy Annual 2006. Washington, D.C.: U.S. Department of Energy, EIA.
EnerNex. 2008. Detailed Analysis of 20% Wind Penetration. Addendum to Wind Integration Study for Public Service of Colorado. Prepared by EnerNex Corporation for Xcel Energy. Denver, Colo. December 1.
Feltrin, A., and A. Freundlich. 2008. Material considerations for terawatt level of deployment of photovoltaics. Renewable Energy 33:180-185.
GE Energy. 2005. The Effects of Integrating Wind Power on Transmission System Planning. Prepared for the New York State Energy Research and Development Authority. New York.
Gourville, J.T., and E. Sellers. 2006. Eager sellers and stony buyers: Understanding the psychology of new-product adoption. Harvard Business Review 84(6):98-106.
Great Valley Center. 2003. Workforce Implications in Renewable Energy. Modesto, Calif.
Greentech Media. 2007. Silicon Shortages Slows Solar Industry—The Green Year in Review. Cambridge, Mass. December 31.
Greentech Media. 2008. First Solar Posts Blockbuster 2Q. Cambridge, Mass. July 30.
Hawkins, D., and M. Rothleder. 2006. Evolving role of wind forecasting in market operation. Presented at the CAISO in IEEE Power Systems Conference and Exposition, Atlanta, Ga. Available at http://ieeexplore.ieee.org.
Holttinen, H., B. Lemström, P. Meibom, H. Bindner, A. Orths, F. van Hulle, C. Ensslin, A. Tiedemann, L. Hofmann, W. Winter, A. Tuohy, M. O’Malley, P. Smith, J. Pierik, J.O. Tande, A. Estanqueiro, J. Ricardo, E. Gomez, L. Söder, G. Strbac, A. Shakoor, J.C. Smith, B. Parsons, M. Milligan, and Y. Wan. 2007. Design and operation of power systems with large amounts of wind power: State-of-the-art report. VTT Working Papers 82. VTT Technical Research Centre of Finland. October. Available at http://www.vtt.fi/inf/pdf/workingpapers/2007/W82.pdf.
IEA (International Energy Agency). 2008. ETP 2008: Technology Learning and Deployment—A Workshop in the Framework of the G8 Dialogue on Climate Change, Clean Energy and Sustainable Development—Final Version 29. Paris. June.
Jamasb, T. 2006. Technical change theory and learning curves: Patterns of progress in energy technologies. Cambridge Working Papers in Economics, University of Cambridge, Cambridge, U.K. March 20. Available at http://www.dspace.cam.ac.uk/handle/1810/131682.
Lash, J., and F. Wellington. 2007. Competitive advantage on a warming planet. Harvard Business Review 85(3):95-102.
Lew, D. 2008. Western wind and solar integration study. Presentation at Stakeholders Meeting, August 14, 2008. Denver, Colo.
Mathur, A., A.P. Chikkatur, and A.D. Sagar. 2007. Past as prologue: An innovation diffusion approach to additionality. Climate Policy 7:230-239.
MPUC (Minnesota Public Utilities Commission). 2006. Final Report: 2006 Minnesota Wind Integration Study. Volume 1. Saint Paul, Minn.
Murphy, L.M., and P.L. Edwards. 2003. Bridging the Valley of Death: Transitioning from Public to Private Sector Financing. NREL/MP-720-34036. Golden, Colo.: National Renewable Energy Laboratory.
NAS-NAE-NRC (National Academy of Sciences-National Academy of Engineering-National Research Council). 2009. America’s Energy Future: Technology and Transformation. Washington, D.C.: The National Academies Press.
Navigant Consulting. 2008. Photovoltaic Shipments and Competitive Analysis 2007/2008. Report # NPS-Supply3. Washington, D.C.
NERC (North American Electric Reliability Corporation). 2009. Accommodating High Levels of Variable Generation: Special Report. Princeton, N.J.
Newsweek. 2008. PayPal’s cofounder hopes to produce a practical $30,000 all-electric car in four years.
NPCC (Northwest Power and Conservation Council). 2007. The Northwest Wind Integration Action Plan. Portland, Ore. Available at http://www.nwcouncil.org/energy/wind/library/2007-1.pdf.
NRC (National Research Council). 2001. Energy Research at DOE: Was It Worth It? Energy Efficiency and Fossil Energy Research 1978 to 2000. National Academy Press: Washington, D.C.
NYSERDA (New York State Energy Research and Development Authority). 2005. The Effects of Integrating Wind Power on Transmission System Planning, Reliability, and Operations: Report on Phase 2—System Performance Evaluation. Albany, N.Y. March.
OECD (Organisation for Economic Co-Operation and Development)/IEA. 2003. Creating Markets for Energy Technologies. Paris: OECD Publishing. Available at http://www.iea.org/textbase/nppdf/free/2000/creating_markets2003.pdf.
Parsons, B., M. Milligan, J.C. Smith, E. DeMeo, B. Oakleaf, K. Wolf, M. Schuerger, R. Zavadil, M. Ahlstrom, and D.Y. Nakafuji. 2006. Grid impacts of wind power variability: Recent assessments from a variety of utilities in the United States. European Wind Energy Conference Paper. NREL/CP 500-39955. National Renewable Energy Laboratory. Washington, D.C.: U.S. Department of Energy. July.
Patel, S. 2009. PV sales in the U.S. soar as solar panel prices plummet. POWER Magazine. March 1.
Pater, J.E. 2006. Framework for Evaluating the Total Value Proposition of Clean Energy Technologies. Technical Report NREL/TP-620-38597. National Renewable Energy Laboratory. Washington, D.C.: U.S. Department of Energy. February.
Pernick, R., and C. Wilder. 2008. Utility Solar Assessment (USA) Study: Reaching Ten Percent by 2025. Washington, D.C.: Clean Edge, Inc.
Prometheus Institute: For Sustainable Development. 2007. U.S. Solar Industry: The Year in Review 2006. SEIA/Prometheus Institute Joint Report. Cambridge, Mass.
Roy, B.S., S.W. Pacala, and R.L. Walko. 2004. Can large wind farms affect local meteorology? Journal of Geophysical Research 109:D19101.
Sharman, H. 2005. Why wind power works for Denmark. Civil Engineering 158:66-72.
Sheehan, G., and S. Hetznecker. 2008. Utility scale solar power. Next Generation Power & Energy (5; October).
Sherwood, L. 2007. U.S. market trends: Solar and distributed wind. Presented at Interstate Renewable Energy Council, September 24, 2007. Long Beach, Calif.
Stern, G. 2008. Lassoing panhandle wind: Oilman plans huge complex. EnergyBiz Magazine (January/February):12-13.
Sterzinger, G., and M. Svrcek. 2004. Wind Turbine Development: Location of Manufacturing Activity. Renewable Energy Policy Project. Washington, D.C.
UCS (Union of Concerned Scientists). 2007. Cashing in on Clean Energy National Analysis. Cambridge, Mass.
Wan, Y.H. 2004. Wind Power Plant Behaviors: Analyses of Long-Term Wind Power Data. NREL Technical Report NREL/TP-500-36551. Golden, Colo.: National Renewable Energy Laboratory.
Weissman, J., and K. Laflin. 2006. Trends in practitioner training for the renewable energy trades. Solar 2006: Renewable Energy—Key to Climate Recovery. Proceedings of 35th ASES Annual Conference, July 9-13, 2006, Denver, Colo. Boulder, Colo.: American Solar Energy Society.
Wiley, L. 2007. Utility scale wind turbine manufacturing requirements. Presented at WPA/NWCC Wind Energy and Economic Development Forum, April 24, 2007. East Lansing, Mich.


