
7
Scenarios
This chapter considers the extent to which renewable technologies might contribute to the future U.S. electric power supply. To come to conclusions about the level that renewables might contribute to electricity generation, we focus on scenarios of the technologic, economic, environmental, and implementation-related characteristics that may enable a greater fraction of renewable electricity. How much these factors might affect the market penetration of any individual renewable resource would depend on the rate at which generation from additional renewables is introduced. Under business as usual conditions without major policy initiatives to speed deployment, the introduction of renewables into electricity markets can continue at a moderate pace, with the growth rate and technology learning following a conventional S curve. But if policy makers or external conditions were to bring a sense of urgency to addressing concerns such as energy security or climate change, the question would become how to accelerate the market penetration of renewables while minimizing impacts on electricity’s price, the environment, the reliability of electricity service, and the ability of industry to manufacture and deploy relevant technologies. The scenarios selected by the panel allow exploration of such issues.
The scenarios discussed below in this chapter were chosen to represent aggressive but achievable rates of renewables deployment in the U.S. electricity sector, provided that significant policy and financial resources are devoted to the effort. Scenarios do not represent a simple extrapolation of historical growth rates; instead, they reflect a more integrated perspective on the conditions required to scale up renewables deployment. The panel’s criteria in choosing the particular scenarios it presents were whether the scenario was developed with input from
multiple stakeholder groups and whether it underwent peer review. The panel also considered the degree to which each scenario assessed not simply deployment rates and cumulative levels of generation but also economic, financial, human, and environmental facets. Many of the scenarios described here have been released over the past few years, which helps ensure that inputs to the scenarios reflect recent conditions.
OBJECTIVES FOR SCENARIOS
Scenarios provide conceptual and quantitative frameworks to describe and assess how renewable resources’ contribution to electricity supply might be significantly increased. Such scenarios are a primary way to quantify materials and manufacturing requirements, human and financial resource needs, and environmental impacts that come with greatly expanding electricity generation from renewable electricity sources. These scenarios typically use qualitative analysis, quantitative assumptions, and computational models of the energy, economic, and/or electricity systems. They attempt to integrate the environmental, technologic, economic, and deployment-related elements into an internally consistent analytical framework. The panel considered two types of scenarios. The first type analyzes increased market penetration of a single resource, such as solar or wind. A prominent example is the 20 percent wind study (DOE, 2008) described in more detail in the following section. Examples for solar energy include the Solar America Initiative (DOE, 2007b), the U.S. Photovoltaic Industry Roadmap (SEIA, 2001, 2004), and the 10 percent solar study (Pernick and Wilder, 2008). The scenarios described here are used to assess issues such as:
-
Land-use impacts, manufacturing and employment requirements, and economic costs associated with an assumed market penetration of a single renewable resource (e.g., 20 percent electricity generation from wind power or more than 50 percent electricity generation from solar);
-
The additional transmission, distribution, and other technologies needed to incorporate or enhance the use of intermittent renewable resources in the electricity market; and
-
The cost-reduction trajectories needed to make solar electricity widely competitive with other electricity sources.
A second type of scenario examines how renewables interact with other sources of electricity, other sources of energy, and end-use energy demands (CCSP, 2007; EIA, 2008a). Through the use of long-term energy–economic models, these scenarios enable assessment of the potential impacts of demographic, economic, and regulatory factors on renewable electricity within a framework that considers the whole energy sector. The scenarios described here are used to explore issues such as:
-
How wider energy–economic interactions and the electricity market could affect market penetration by renewables;
-
The impacts of environmental, economic, and/or energy policies on end-use demand and electricity generation from renewables and other sources.
These scenarios, as with the reference case scenario presented in Chapter 1, are not predictors of the future, and the results of scenarios are not forecasts. Rather, they are descriptions of one set of conditions that could result in significantly increased market penetration by one or several renewables over what is estimated based on present-day conditions and a business-as-usual future. They demonstrate the costs, benefits, and scale of the challenges associated with increasing the integration of renewables into the electricity sector.
EXAMPLES OF HIGH-PENETRATION SCENARIOS
20 Percent National Wind Penetration Scenario
The American Wind Energy Association and DOE’s National Renewable Energy Laboratory (NREL) developed a scenario assuming that 20 percent of electricity generation would come from wind power by 2030 (DOE, 2008). The scenario included assessments of the wind resource base, materials and manufacturing requirements, environmental and siting issues, transmission and system integration, costs, and public policy drivers (Smith and Parsons, 2007). The scenario estimated that more than 300 GW of new wind power capacity would be needed to meet a goal of 20 percent market penetration by wind, of which about 250 GW would be installed onshore and 50 GW installed offshore. Under this scenario, in 2030 wind power would produce about 1.2 million GWh out of a total U.S.
electricity generation of 5.8 million GWh. All impacts for the 20 percent wind scenario (such as costs and impacts on CO2 emissions) were estimated through a comparison to a base case that assumed no new wind capacity additions after 2006, which is a more pessimistic base case in terms of wind power than both the AEO 2007 and AEO 2008 versions (EIA, 2008b,c). Because the 2008 DOE report contained “influential scientific information” as defined by the Office of Management and Budget’s (OMB’s) Information Quality Bulletin for Peer Review, it was subjected to interagency peer review.
Manufacturing, Materials, and Resources
Manufacturing and other requirements to implement a 20 percent wind scenario are significant. Figure 7.1 shows the amount of annual installed capacity needed to increase to 300 GW by 2030 from approximately 12 GW in 2006. Though the scenario limited the annual capacity increase to 20 percent, it assumed an
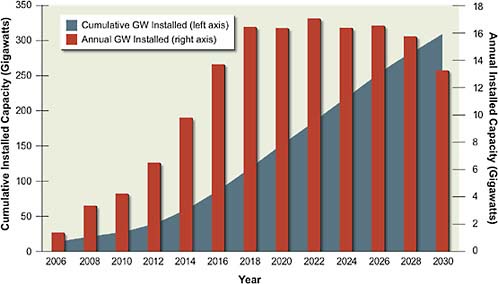
FIGURE 7.1 Annual and cumulative generation needed to achieve 20 percent wind generation of electricity by 2030.
Source: Lawrence Berkeley National Laboratory; presented in Wiser, 2008.
extremely large expansion of manufacturing, materials, and installation capacities. It projected that by 2018 the amount of annual installed capacity in the United States would be more than 16 GW, compared to a global wind turbine manufacturing output of about 15 GW in 2007 (DOE, 2007a). As discussed in Chapter 1 of the present report, an additional 5 GW of capacity was added in the United States in 2007 and more than 8 GW in 2008, both exceeding the trajectory for the 20 percent wind scenario. Even assuming that growth outside the United States would be more modest, this scenario would require a continued large expansion of the manufacturing base. Global growth in wind power is likely to continue to be strong. For example, the Commission of the European Communities’ roadmap for renewables proposes that the European Union establish a mandatory target of 20 percent for renewable energy’s share of energy consumption in the EU by 2020, much of which would be met with wind power (Commission of the European Communities, 2007).
The 20 percent wind scenario also contains critical challenges to fulfill materials, capital, and employment requirements. Table 7.1 shows the level of raw materials needed to meet this scenario. While some quantities would be small relative to global production, Smith and Parsons (2007) concluded that supplying fiberglass, core materials (balsa and foam), and resins could be difficult, as would supplying a sufficient number of wind turbine gearboxes. Assuming that the average-sized wind turbine would be in the 1–3 MW range, with modest introduction of large 4- to 6-MW turbines, there could be a total of almost 100,000 wind turbines installed (Wiley, 2007; DOE, 2008). The average number of turbines
TABLE 7.1 Raw Materials Requirements for 20 Percent Wind Scenario (thousands of tons per year)
|
Year |
Concrete |
Steel |
Aluminum |
Copper |
Glass-Reinforced Plastic |
Carbon Fiber Composite |
Adhesive |
Core |
|
2010 |
6,800 |
460 |
4.6 |
7.4 |
30 |
2.2 |
5.6 |
1.8 |
|
2015 |
16,200 |
1,200 |
15 |
10 |
74 |
9 |
15 |
5 |
|
2020 |
37,000 |
2,600 |
30 |
20 |
162 |
20 |
34 |
11 |
|
2025 |
35,000 |
2,500 |
28 |
19 |
156 |
19 |
31 |
10 |
|
2030 |
34,000 |
2,300 |
26 |
18 |
152 |
18 |
30 |
10 |
|
Source: Adapted from material in Wiley, 2007. |
||||||||
TABLE 7.2 Net Present Value Direct Electricity Sector Costs for 20 Percent Wind Scenario and No-New-Wind Scenario
installed would have to increase from its present level of 2,000 per year to 7,000 per year by 2017 (DOE, 2008).
The NREL Wind Development System (WinDS) model, which simulates generation capacity expansion in the U.S. electricity sector for wind and other technologies through 2030, estimates that the 20 percent wind scenario would result in a direct increased cost for the total electricity sector of $43 billion (U.S. 2006$) in net present value (NPV) over the no-new-wind case. Table 7.2 shows the breakdown of direct electricity sector costs for the 20 percent wind scenario and the no-new-wind scenario. Overall, increases in wind power generation costs (capital and operation and maintenance [O&M] expenses) would be partially offset by lower capital, O&M, and fuel costs for other electricity sources. The total capital costs for wind under this scenario would be $236 billion NPV, and O&M cost would be $51 billion NPV. These cost estimates do not consider the total capital required for potential investments in manufacturing capacity, expanded employment training, or other needs, and do not represent the indirect costs to the economy. According to the scenario, in 2030, 20 percent market penetration by wind would provide well over 140,000 direct manufacturing, construction, and operations jobs, as indicated by DOE’s Job and Economic Development (JEDI) model (Goldberg et al., 2004; Wiley, 2007; DOE, 2008). This projection would include more than 20,000 jobs in manufacturing, almost 50,000 jobs in construction, and more than 75,000 jobs in operations (DOE, 2008).
Integration of Wind Power into the Electricity System
Under this high-market-penetration scenario, integrating 20 percent wind power into the electricity system would require investment in the electricity grid and other parts of the electricity system. Transmission could be the biggest obstacle to seeing levels of wind power rise to 20 percent. Studies of wind integration at the utility and state level show that incorporating significant amounts of wind power into the electricity grid, while feasible, would require improvements in the transmission grid, wind forecasting, and other modifications to the electricity system, which would impose additional costs (Zavadil et al., 2004; GE Energy, 2005; DeMeo et al., 2005; UWIG, 2006; Parsons, 2006). The 20 percent wind integration study included a conceptual framework of the regional transmission system upgrades needed to move electricity from high-resource to high-demand areas (Figure 7.2). The study estimated the cost of expanded transmission at $23 billion,
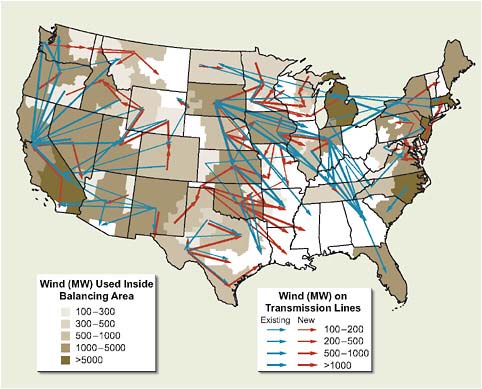
FIGURE 7.2 Map indicating potential new transmission corridors for integrating 300 GW of wind power.
Source: DOE, 2008.
though it recognized the barriers to installing new transmission in general. This estimate is lower than other estimates. Separately, American Electric Power (AEP) developed a conceptual interstate transmission plan for integrating more than 300 GW from wind power and for reducing existing transmission bottlenecks. AEP estimates such a system would include 19,000 miles of new high-voltage (765 kV) transmission lines and require investments on the order of $60 billion (AEP, 2007). The more recent Joint Coordinated System Plan (JCSP), discussed below in this section, estimated that integrating 20 percent wind into most of the eastern U.S. electricity system would require 15,000 miles of new extra-high-voltage lines at a cost of $80 billion (JCSP, 2009). Though these studies have differing assumptions resulting in varying estimates, they all indicate the magnitude of investment in transmission required to integrate large amounts of wind power into the electric grid.
Environmental and Energy Impacts
The 20 percent wind power scenario would cause significant land-use and atmospheric emissions impacts. The estimated land area needed to realize this scenario would be 50,000 km2, which includes the land used directly for the turbines and other land requirements. Only about 2–5 percent of the land use would be for the turbines themselves, with the rest of the area between turbines that could be available for agricultural or other uses.
Figure 7.3 shows reductions of carbon dioxide (CO2) emissions with 20 percent wind compared to the reference case. Atmospheric emissions of CO2 and other pollutants would be significantly reduced. The scenario estimates that wind power would replace coal- and gas-fired electricity generation and reduce CO2 emissions to 800 million tons per year in 2030. Also shown in Figure 7.3 is the trajectory required to reduce electricity sector CO2 emissions by 80 percent, which is the overall target for reductions of greenhouse gas (GHG) emissions necessary to maintain CO2 at or below 450 parts per million. Increasing wind power generation would also result in reductions of other atmospheric pollutants associated with fossil-fuel electricity generation, though there would be emissions from natural-gas-fired power plants needed for backup generation. However, the impact on NOx and SO2 emissions is less than what would be expected from assuming that electricity generation from fossil fuels is replaced with a non-carbon-emitting technology such as wind power. Because emissions of NOx and SO2 are subject to caps on emissions, reductions of emissions from wind-generated electricity might
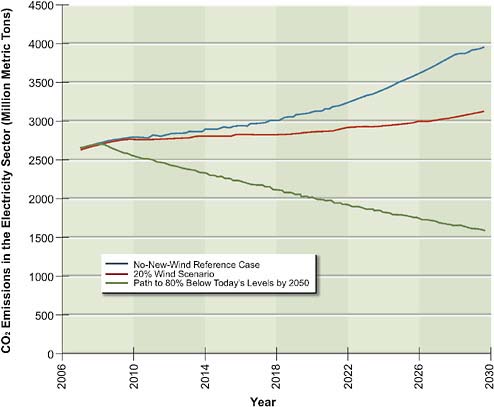
FIGURE 7.3 Reductions in CO2emissions resulting from 20 percent wind scenario compared to the no-new-wind reference case. Also shown is the trajectory for reducing CO2emissions by 80 percent.
Source: DOE, 2008.
be reallocated to other plants. Other air toxics emitted from coal and natural gas electricity generation are not capped and would be reduced in replacing fossil-fuel electricity generation with wind power.
The impact on the energy mix would be largest for natural gas, with the 20 percent wind scenario displacing about 50 percent of electric utility natural gas consumption compared to 18 percent of coal consumption in 2030 (DOE, 2008). The 20 percent wind scenario would also greatly reduce the need for imported liquefied natural gas. However, maintaining electricity system reliability would require additional capacity from natural gas combustion turbines that could respond to wind fluctuations in some combination with the transmission upgrades.
Joint Coordinated System Plan
Following the national 20 percent wind study, a multi-stakeholder group within the Eastern Interconnection prepared a report looking at wind integration issues from a regional perspective. As with the 20 percent wind study, it included multiple stakeholders in a collaborative that held numerous public workshop meetings. The Joint Coordinated System Plan (JCSP, 2009) looked at two scenarios, one a reference case with 5 percent market penetration by wind and the second with 20 percent wind. For the 5 percent wind scenario, the study estimated a need for 10,000 miles of new extra-high-voltage (EHV) transmission lines at an estimated cost of $50 billion. For the 20 percent wind scenario, the projected transmission requirement was 15,000 miles of new EHV lines at an estimated cost of $80 billion. In both cases, the additional transmission allowed renewable and baseload steam energy from the Midwest to be transmitted to a wider area. The study assumed that increased wind generation would primarily offset baseload steam production while requiring more production from fast-response, gas-fired combustion turbines. The JCSP study did not envision electricity storage as having a role in integrating this level of wind power. That report is intended to be part of an ongoing set of studies that examine the reliability and economic impacts of alternative combinations of supply- and demand-side resource technologies, densities and locations, and transmission infrastructure options. The group also plans to conduct sensitivity analyses to determine the implications of varying assumptions such as fuel and technology costs, load projections, plant retirements, and carbon regulation options and costs (JCSP, 2009).
Summary of High Wind Power Penetration Scenarios
It is clear that the high wind penetration scenarios outlined above represent a departure from present conditions. For manufacturers to make the investments needed to develop such capacities and supply chains, substantial capital and a stable policy environment would be required. These scenarios also would require significant land area for the spacing needed between wind turbines, though the actual area occupied by the turbines is a small portion of the land. Realizing the scenarios would entail substantial economic activity, including the addition of thousands of new manufacturing and construction jobs in the wind industry, and would provide significant carbon reductions. DOE’s 20 percent wind study estimated a reduced demand for natural gas for electricity generation, though 20 percent wind would increase the need for the use of high-cost combustion-
turbine natural gas capacity. The 20 percent wind scenarios of both the DOE and the JCSP demonstrate the need for substantial increases in transmission capacity. There are sufficient resources, technologies, and generally positive economics to increase wind power’s contribution to the electricity sector. What these 20 percent wind penetration scenarios emphasize are the scale of the challenges and the benefits for the future.
High Solar Electricity Penetration Scenarios
A variety of scenarios discuss increased market penetration by solar photovoltaics (PV) and concentrating solar power (CSP). Examples range from the comparatively modest Solar America Initiative (SAI; DOE, 2007b) to the more optimistic U.S. Photovoltaic Industry Roadmap (PV Roadmap; SEIA, 2001, 2004) and the “Solar Grand Plan” (Zweibel et al., 2008). Another study examined a scenario for reaching 10 percent electricity generation from solar by 2025 (Pernick and Wilder, 2008). These scenarios consider issues similar to those addressed in the 20 percent wind power scenarios, such as the potential impacts of renewables’ high market penetration on manufacturing, implementation, economics, and the environment. Further, solar electricity can provide insights into attributes of distributed energy sources. Because of the higher costs associated with solar energy, all scenarios consider the significant cost reductions that would have to occur to make solar electricity competitive with other electricity sources.
Distributed Solar Power—SAI and PV Roadmap Scenarios
The SAI and the PV Roadmap scenarios assume that 100–200 GWp (Wp indicates peak power) of solar PV would be introduced by 2030 and that a majority of the newly installed generation would be distributed in residential, commercial, and industrial applications.1 Tables 7.3 and 7.4 provide the assumptions used in these scenarios. As shown in Table 7.3, the SAI considered two scenarios: a low-penetration scenario assuming that a total of 5 GWp of PV would be installed by 2015 and 70 GW by 2030, and a high-penetration scenario assuming that a total of 10 GWp of PV would be installed by 2015 and 100 GWp by 2030. In the PV Roadmap scenario, installed capacity would reach 200 GWp by 2030, and 670 GWp by 2050. In order for solar PV to be competitive with other electric-
TABLE 7.3 Electricity Capacity and Generation Under SAI and PV Roadmap Scenarios and Total U.S. Electricity Generation Estimated Under AEO 2008 Out to 2030
ity sources, both scenarios assumed that the installed system cost of PV would decrease significantly. For example, in both SAI scenarios, costs would decrease from the 2005 value of $8/Wp to $3.3/Wp in 2015 and $2.5/Wp in 2030 (Grover, 2007). The PV Roadmap assumed costs would decrease to $3/Wp in 2020 and $1.9/Wp in 2050 (SEIA, 2004). Table 7.3 compares the estimated PV electricity generation for these scenarios and total U.S. electricity generation under the Energy Information Agency’s reference case AEO 2008 (EIA, 2008b). Assuming a capacity factor of 19 percent, the SAI scenarios would represent between 2 and 3 percent of the total 2030 electricity generation in the AEO 2008 case. The electric-
TABLE 7.4 Annual Installations, System Costs, and Performance for Solar America Initiative High-Penetration and Photovoltaics Roadmap Scenarios
ity generation under the PV Roadmap scenario would represent almost 8 percent of the estimate from AEO 2008.
Providing solar PV as distributed electricity generation, as opposed to wholesale generation to the grid, has several advantages. Reducing the need to integrate this portion of PV-generated electricity into the transmission grid would reduce the costs of developing and maintaining transmission facilities. And localized use of electricity would eliminate the losses that occur during transmission. Distributed PV is also easier to site and eliminates land-use impacts. Because available solar energy tends to peak in the afternoon, solar PV delivers electricity directly to residences and businesses close to the time of peak electricity demand. A 19 percent capacity factor has been estimated for a 4.6 MW PV array operated by Tucson Electric Power that was sited to maximize sun exposure (Curtright and Apt, 2008). However, a goal of 19 percent capacity would be high for residential, commercial, and industrial applications where installation of solar panels would have to use existing rooflines and orientations.
Both the SAI scenarios and the PV Roadmap require substantial increases in manufacturing capacities. As shown in Table 7.4, annual U.S. installations of PV over the 2005–2030 time period would grow at a 20 percent rate to 2.7 GWp in 2015 and 10 GWp in 2030 under the SAI high scenario. Annual U.S. installations of PV over the 2005-2030 time period for the PV Roadmap would grow at a 22 percent rate to 19 GWp in 2030. Both cases would result in large increases in manufacturing capabilities. Bradford (2008) estimated that 2007 global PV production was 3.7 GW and grew at an annual average rate of more 45 percent from 2001 to 2007. But global demand also continues to be strong. For example, Bradford (2008) projected that demand for PV in Europe would increase to 4.5 GWp by 2010.
These scenarios pose significant materials, employment, and capital needs. The primary concern regarding PV materials would be the availability of sufficient polysilicon supplies to produce crystalline silicon PV cells. Global polysilicon supplies were tight in 2007, but there is evidence that supply conditions should improve in 2008 and later (Prometheus Institute, 2007). Though using thin-film technologies would require fewer materials, some shortages might occur; for example, technologies using copper indium gallium selenide (CIGS) could be limited by the amount of naturally occurring indium. The SAI scenarios in 2030 would produce about 120,000 jobs in the manufacturing and installation of PV systems and require $26 billion for manufacturing and installation costs (Grover, 2007). The PV Roadmap estimated that its scenario would produce 260,000 jobs
for the manufacturing and installation of PV systems in 2030 and 350,000 jobs in 2050.
Environmental impacts under the SAI scenarios include reductions in atmospheric emissions of CO2 and other pollutants, as well as potential waste-generation impacts associated with PV manufacturing. SAI estimated reductions in CO2 and other atmospheric emissions, assuming that PV generation of electricity would replace fossil-fuel generation on a one-to-one basis, and that 75 percent of the fuel displaced would be natural gas and 25 percent would be coal (Grover, 2007). Using this assumption, the SAI low scenario would reduce annual CO2 emissions by almost 70 million tons in 2030, while its high scenario would reduce annual CO2 emissions by almost 100 million tons in 2030. These reductions would be about 2–3 percent of estimated annual CO2 emissions for the electricity sector under AEO 2008 (EIA, 2008b). As with wind power, the impact on NOx and SO2 emissions would be less than what would come from replacing fossil fuels with solar PV for the generation of electricity, because of cap and trade policies. Emissions of both NOx and SO2 are subject to caps on emissions and thus credit for reductions of emissions from solar electricity generation might be reallocated to existing fossil-fuel plants. Other air toxics emitted from coal and natural gas electricity generation are not capped, however, and would be reduced by replacing fossil-fuel electricity generation with solar PV. As noted in Chapter 5, other impacts related to solar PV not incorporated in this scenario include the waste generation associated with its production and the energy payback time, or the number of years before the PV system becomes a net energy producer.
Grid Solar—CSP and Grand Plan Scenarios
Expanding CSP in California
Expanding the market for concentrating solar power (CSP) represents an approach to providing solar electricity to the electricity grid. Stoddard et al. (2006) described scenarios for increased cumulative market penetration of CSP at two different levels, 2100 MW or 4000 MW, by the year 2020, and the associated economic, energy, and environmental impacts of CSP in California. The report concluded that the size of the resource in California would offer even greater potential. Plants between 100 and 200 MW in size with parabolic trough technology and 6 hours of storage were assumed. It was estimated that with the solar resource in California, each 1000 MW of CSP would produce 3600 GWh/yr. The report concluded that the levelized costs of energy from the CSP plants would
make them competitive with natural gas combustion turbines by 2015. The 4000 MW scenario estimated reductions in CO2 by 7.6 million tons per year, compared with natural gas combined cycle plant, and provision of 3000 permanent jobs associated with the operation of the plants.
The Solar Grand Plan
The “Solar Grand Plan” scenario proposed meeting approximately 70 percent of electricity demand by 2050 through the development of large-scale solar PV farms and CSP plants (Zweibel et al., 2008). The plan also envisioned an extensive direct current (DC) transmission system and compressed air storage facilities distributed throughout the country to enable solar electricity to provide baseload capabilities nationally. It assumed that system costs for thin-film cadmium telluride would fall to $1.20/Wp and that efficiencies would increase to 14 percent. Almost 3,000 GWp of capacity would be built, covering 30,000 square miles in the southwestern United States. This scenario assumed that only 10 percent of the generation would come from distributed PV installations. Another 560 GW of capacity would use CSP technologies, which would require 16,000 square miles of land area, also in the southwestern United States. Electricity would be delivered nationally over 100,000–500,000 miles of high-voltage DC transmission lines and partially stored in compressed-air storage facilities to provide power for turbines to generate year-round power. The scenario called for 400 storage facilities with a total capacity of more than 500 billion cubic feet (for information on compressed-air storage, see Chapter 3). It was estimated that a cumulative $420 billion subsidy from the federal government would be required for the overhaul of the energy infrastructure. Under the plan’s scenario, it was projected that U.S. CO2 emissions would be reduced by 3.6 billions tons per year in 2050, meaning that CO2 emissions in 2050 would be 62 percent lower than CO2 emissions in 2005.
The Solar Grand Plan would require large cost reductions, efficiency improvements, and the development of massive storage and transmission infrastructure. The land requirements alone, more than 46,000 square miles, are enormous. One limiting factor would be whether sufficient tellurium exists for manufacturing solar cells at the scale necessary. Approximately 30,000 square miles of CdTe cell area would be used to reach this level of electricity generation, and a typical cell width of 2 × 10⁻⁶ meters would require slightly less than the total resource base shown in Figure 6.2 and more than the resource base estimated by the U.S. Geological Survey (USGS, 2007). The USGS resource base is estimated
from the only economical source of tellurium, which is a by-product of producing copper, lead, and bismuth. Estimates from both the USGS and Feltrin and Freundlich (2008) have indicated that such a scenario would require most if not all of the world’s tellurium production.
Reaching 10 Percent Solar by 2025 Scenario
Capacity Requirements
The 10 percent solar study by Pernick and Wilder (2008) examined conditions that would allow combined PV and CSP electricity generation to reach 486 TWh by 2025, approximately 10 percent of the estimated 4,858 TWh of total electricity generation (Pernick and Wilder, 2008).2 To attain this level of generation, installed PV capacity would have to rise from less than 1 GWp in 2007 to more than 210 GWp in 2025 at an annual average growth rate greater than 30 percent, and CSP would have to rise from less than 0.5 GWp to more than 40 GWp over the same period at an annual average growth rate of almost 30 percent (Table 7.5). To achieve this growth rate would require annual installation of almost 50 GWp of PV and almost 7 GWp of CSP in 2025. Though this level of installation is quite high, it is smaller than the 60 GWp of natural gas electricity generation installed in the United States in 2002.
Costs and Capital Requirements
Pernick and Wilder (2008) estimated that the installed price for PV would decline to $1.48–1.82/Wp by 2025 and that the price for CSP would decline to $0.88/Wp (Table 7.6), based on the assumption that costs decline by 18 percent for every doubling of capacity. With this decline in costs, solar PV would reach cost parity with conventional retail electricity rates throughout much of the United States by around 2015. Figure 7.4 compares projections of retail electricity rates for various cities in the United States with the cost of electricity from PV. It should be noted that the real retail price of electricity has not increased since 1960 (EIA, 2008c). The report estimated that to reach these levels of market penetration would require investment of $26–33 billion per year with a total cost of $450–560 bil-
TABLE 7.5 Photovoltaic and Concentrated Solar Power Installation and Generation Under 10 Percent Solar Scenario
lion (in 2008 dollars). This estimated cost covered only the installed costs, not the costs for transmission upgrades. Rooftop PV installations on commercial roofs, connected directly to the distribution system where they are installed, do not require transmission system upgrades, similar to PV installations envisioned under Southern California Edison’s initiative to install 250 MWp of PV capacity (Southern California Edison, 2008). However, CSP requires high-quality solar resources found in the Southwest, which would require transmission capacity to move electricity to demand centers. This scenario did not estimate market penetration requirements (e.g., materials or employment requirements) beyond the estimates of annual and cumulative installations and did not estimate energy payback times and environmental impacts.
Summary
The 10 percent solar scenario would result in a dramatic increase in solar’s contribution to electricity generation that would require aggressive growth rates (annual average growth rates of 30 percent and greater) lasting for almost two decades. It would require large cost reductions for both PV and CSP continuing over the same
TABLE 7.6 Crystalline Silicon PV, Thin-Film, and CSP Cost Assumptions in 10 Percent Solar Scenario
time period and approximately $500 billion (2008 dollars) in investment in manufacturing and installation capacity to meet this target. The 10 percent solar scenario would also require a much greater involvement of electric utilities in using solar electricity capacity, improvements to the electricity grid to integrate intermittent distributed electricity generation, and national standards for solar interconnections to allow solar to become a “plug-and-play” technology (Pernick and Wilder, 2008). The motivation for pursuing such a strategy includes taking advantage of the ability of solar to produce power during times of peak demand and to serve as a price hedge against escalating fuel costs and potential carbon costs.
Using Multiple Renewables to Reach 20 Percent of Total U.S. Electricity Generation
The scenarios discussed above show the potential for renewables to increase electricity generation and the scale and integration associated with rapid expansion of any single renewable. In this section the panel describes a projection combining multiple renewable technologies that could meet the goal of providing 20 percent
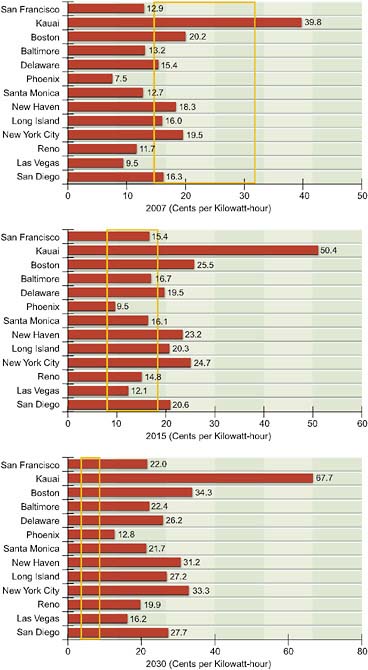
FIGURE 7.4 Comparison of projected average retail electricity rates with projected high and low PV costs, indicated by yellow box outline, for 2007, 2015, and 2030.
Source: Pernick and Wilder (2008), Clean Edge, Inc. (www.cleanedge.com).
of total electricity generation by 2035 from new renewable electricity generation. This is not a scenario like those described above in this chapter because it does not consider material and deployment needs, capital requirements, or interactions with other electricity sources.
Assuming the use of multiple renewable resources and technologies to reach the 20 percent goal would address some of the scale and integration issues associated with meeting this level of electricity generation with a single renewable. Using an array of renewables could reduce the growth that would be required from individual sources and the scale-up challenges for manufacturers, materials, and human resources. Considering an array of renewables also might ease their integration into the electricity system, particularly for wind generation. Obtaining 20 percent of electricity generation from wind power as a single source will be a challenge, in that the 20 percent refers to an annual average, and wind power is intermittent. Because wind is not available all the time, it might have to represent much more than half the generation at times in order to reach the 20 percent annual average. Wind energy tends to be most abundant at night and in the spring and fall, when demand is low. Balancing wind with multiple renewable resources—including solar, which does not normally peak when wind does, and baseload power from geothermal and biopower—could mitigate the temporal variability in generation. As discussed in Chapter 2, using multiple renewable resources would take advantage of the geographical variability in the resource base. Relying on multiple renewable resources would not eliminate the need to expand transmission capacity or to make other improvements in the electricity infrastructure to enable the integration of renewables, nor would it reduce the magnitude of costs. However, it can provide other attributes, such as providing baseload generation and combining different intermittent renewables to reduce the temporal variability in generation.
Table 7.7 lists a set of renewables that, under the projection described here, would reach 20 percent of electricity generation by 2035. Achieving that goal would depend on wind power capacity additions of 9.5 GW per year, a slight increase over the 8.4 GW installed in 2008. Table 7.7 also shows solar growing to 70 GW by 2035, a much smaller gain than those projected in the high market penetration solar scenarios described above. It assumes that an additional 13 GW would come from conventional geothermal by 2035, which is consistent with the Western Governors’ Association’s estimated potential resource base in the western United States (WGA, 2006). It also assumes that an additional 13 GW would come from biomass. The mix of renewable resources shown in Table 7.7 is not
TABLE 7.7 Capacity and Generation from Multiple Renewable Resources Sufficient to Meet 20 Percent of Estimated U.S. Electricity Demand in 2035
presented as the optimal set to meet the target of obtaining 20 percent of total electricity generation from additions of renewable resources. This set is merely one mix that could be considered, given the available resource base, readiness of renewable electricity technologies, and what might be practicable for an aggressive but achievable expansion of market penetration.
SCENARIOS COUPLING RENEWABLES TO ENERGY MARKETS THROUGH CARBON POLICIES
Another set of scenarios examines how renewables interact with other sources of electricity, other sources of energy, and end-use energy demands. This approach incorporates scenarios developed with long-term energy–economic models. The long-term outlook for renewable electricity will depend largely on the ability of renewable electricity technologies to compete against fossil-fuel and nuclear electricity generation. Further, an important consideration would be the extent to which a policy might affect end-use electricity and energy demands. For example, a policy that might influence the price of carbon would likely induce investment in energy efficiency, in addition to making renewables more economical. Energy–economic models allow assessment of potential impacts of demographic, economic, and regulatory factors on renewable electricity within a framework that considers how such factors interrelate to other sources of electricity and end-use energy demands. Therefore, these models are important for understanding possible future pathways for renewable electricity penetration.
These models do not predict the future, and their results are not forecasts.
Rather, they provide a convenient framework for understanding the impacts of critical assumptions and variables using a simplified, internally consistent representation of the energy–economic system. This caveat is especially true for models that simulate the evolution of the energy system over a century or more. It needs to be remembered that these scenarios depend on underlying technology and behavioral assumptions, and results would change if other assumptions were employed.
CCSP Climate Stabilization Scenarios
One set of scenarios that explicitly couples the U.S. and the global energy sectors to the objective of reducing greenhouse gas (GHG) emission concentrations are the scenarios developed for the U.S. Climate Change Science Program (CCSP, 2007). Using three long-term energy–economic models linked to climate representations (listed below), the CCSP simulated changes in the energy system that would stabilize atmospheric CO2 emissions at approximately 450, 550, 650, or 750 parts per million (ppm):
-
Integrated Global Systems Model (IGSM) of the Massachusetts Institute of Technology’s Joint Program on the Science and Policy of Global Change (Sokolov et al., 2005);
-
Model for Evaluating the Regional and Global Effects (MERGE) of GHG reduction policies developed jointly at Stanford University and the Electric Power Research Institute (Manne and Richels, 2005); and
-
MiniCAM Model of the Joint Global Change Research Institute, a partnership between the Pacific Northwest National Laboratory and the University of Maryland (Brenkert et al., 2003).
To reduce CO2 emissions, these models apply different levels of carbon taxes to all sources of emissions. Imposing costs for carbon from greenhouse gas emissions made fossil-fuel generation increasingly less competitive compared to non-carbon-based energy sources and technologies that use fossil fuels along with CO2 capture and storage. Carbon prices also induced energy efficiency improvements and reductions in demand. Each model estimates the fee on carbon that it would take to stabilize atmospheric GHG at concentrations of 450–750 ppm. For example, the carbon taxes projected to be necessary to stabilize GHG at concentrations of 550 ppm in 2050 are $35/ton carbon (MERGE), $70/ton (MiniCAM), and
$250/ton (IGSM). The report on these scenarios describes the differences in the models and discusses selected results to provide insight on the following questions (CCSP, 2007):
-
What emissions trajectories over time are consistent with meeting the four alternative stabilization levels, and what are the key factors that shape them?
-
What energy system characteristics are consistent with each of the four alternative stabilization levels, and how might these characteristics differ among stabilization levels?
-
What are the possible economic consequences of meeting each of the four alternative stabilization levels?
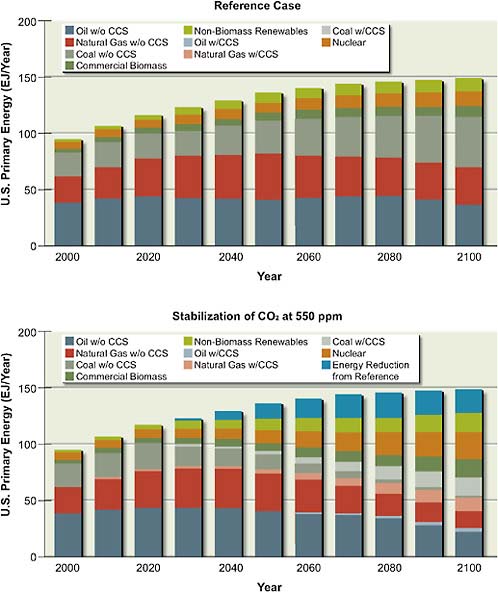
The models showed variability both in their reference case representations of the future for renewables and in the responsiveness of renewables to increases in fossil-fuel costs. The IGSM model postulates less renewable energy supply than in the MiniCAM model in both the reference and climate-constrained scenarios for a variety of reasons, including differences in assumed technology availability and institutional settings. Figure 7.5 shows the results for these two models for the reference and 550-ppm stabilization scenarios for renewable electricity generation. The IGSM model, less optimistic than the MiniCAM model in terms of the future market penetration of renewables, projects almost no increase in renewables in response to application of carbon taxes. Figure 7.6 shows the results of the MiniCAM reference and 550-ppm stabilization scenario in the larger context of the U.S. primary energy mix. One response to carbon taxes would be demand reduction and efficiency improvements (labeled Energy Reduction from Reference in Figure 7.6), which would be substantially greater than the increase in renewable electricity production. Clarke et al. (2007a) contains a more detailed description of the scenarios whose projections are graphed in Figure 7.6, along with documentation of the assumptions underlying the models (Clarke et al., 2007a,b).
Scenarios Projecting Effects of the Lieberman-Warner Climate Security Legislation
The EIA often analyzes proposed legislation related to energy and electricity. Its report Energy Market and Economic Impacts of S. 2191 (EIA, 2008a) was prepared in response to a request for analysis of the Lieberman-Warner Climate Secu-
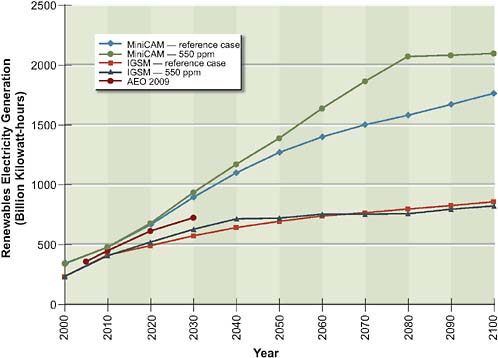
FIGURE 7.5 Renewables electricity generation from reference case and 550 ppm stabilization scenarios for MiniCAM and IGSM models compared to AEO 2009.
Source: CCSP (2007) and EIA (2008d).
rity Act of 2007 (the CSA). Regulating greenhouse gas emissions through market-based mechanisms, energy efficiency programs, and economic incentives, the CSA sets caps on annual emissions, primarily of CO2, that decline from 5775 million metric tons of CO2 equivalent in 2012 (7 percent below 2006 emission levels) to 1732 million metric tons in 2050 (72 percent below 2006 levels). The emission allowances created under the legislation are tradable and bankable.
Case Scenarios and Methods
The EIA projected the effects of CSA’s provisions out to 2030 by modeling several scenarios with varying assumptions about future technology costs and how the legislation might be implemented. Here the panel focuses on two scenarios from the six offered in the EIA report and compares them to the AEO 2008 reference case (EIA, 2008b). The EIA’s core CSA scenario assumed that key low-emission
technologies, such as nuclear, fossil fuel with carbon capture and storage (CCS), and renewables, would be developed and deployed in the timeframe for emissions reduction set by the CSA without facing any major problems. The EIA’s high-cost scenario used the basic assumptions of the core case, except that it applied a 50 percent higher cost of nuclear, fossil fuel with CCS, and biomass-generating technologies to reflect a more pessimistic perspective regarding the costs of these technologies and the feasibility of introducing them rapidly on a large scale.
The EIA used the National Energy Modeling System (NEMS) for its analysis of the CSA (EIA, 2003). NEMS calculated changes in energy-related CO2 emissions for the various cases by adjusting the cost of fossil fuels and the GHG allowance prices variables that affect energy demand, the energy mix, and energy-related CO2 emissions. The NEMS Macroeconomic Activity Module is used for analyzing the macroeconomic impacts of GHG reduction policies. This module solves for the energy–economy equilibrium by iteratively interrelating the energy supply, demand, and conversion modules of NEMS (EIA, 2003). Thus, NEMS is sensitive to energy prices, energy consumption, and allowance revenues, and it solves for the effects of policy such as that legislated in the CSA on macroeconomic and industry-level variables.
Energy Market and Electricity Mix
As expected, the projected greenhouse gas emissions in scenarios with emissions regulations are significantly lower than those in the reference case. The EIA’s core CSA scenario described above would result in an 85–90 percent reduction of CO2-equivalent emissions by 2030, and its high-cost case in a 50–60 percent reduction during the same timeframe. The majority of the emissions reduction would come from the electric power sector, a projection that is relevant to this panel’s work. These reductions would be achieved by deployment of new nuclear, renewable, and fossil fuel with CCS facilities. Major determinants of the energy and economic impact of the CSA bill include the potential for and the timing of the development and commercial marketing of low-emissions electricity generation technologies. Another determinant is the degree to which companies might be able to purchase emission reduction credits overseas, a topic that is not discussed further here.
Figure 7.7 shows the impact of EIA’s core and high-cost CSA scenarios on the overall electricity mix. With the regulation of greenhouse gas emissions in place, coal consumption, especially for electricity generation, would be significantly reduced by 2030. Many coal power plants without CCS would be forced
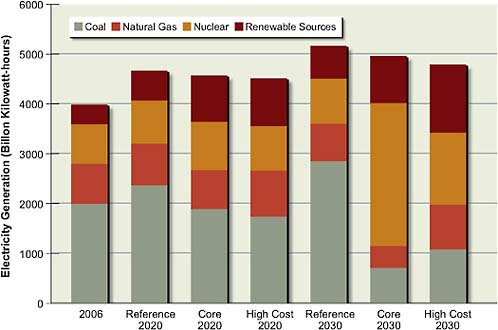
FIGURE 7.7 Mix of electricity generation from EIA core and high-cost analysis of CSA bill compared to electricity mix in 2006 and to the AEO 2008 reference.
Source: EIA, 2008b.
to retire early, because retrofitting with CCS technology is generally impracticable, and so is not simulated in the model. The energy-generation mix for the EIA’s core CSA scenario would be composed of coal with CCS, nuclear, and renewable technologies, primarily wind and biomass. One important characteristic of the core case is the strong growth in nuclear power. If these low-emission technologies face trouble in deployment, as in the high-cost case, there would be a shift to electricity generation from natural gas to offset the reduction in coal generation.
The EIA estimated that renewable electricity generation would be significantly higher under the provisions of the CSA, with the vast majority of the increase from wind generation, followed by generation from biomass (EIA, 2008a). How each renewable energy resource would contribute to the total supply of electricity generated in the three scenarios (AEO 2008, core, and high cost) is shown in Table 7.8. The increase in total renewable generation is especially strong in the high-cost case. Table 7.9 shows the projected average annual growth rates
TABLE 7.8 Percent of Total U.S. Electricity Generated from Renewable Sources as Projected in Energy Information Administration Analysis of Three Scenarios
|
|
2020 |
2030 |
||||
|
Reference Case |
Core Case |
High-Cost Case |
Reference Case |
Core Case |
High-Cost Case |
|
|
Hydropower |
6.87 |
7.18 |
7.37 |
6.23 |
6.63 |
7.13 |
|
Geothermal |
0.55 |
0.98 |
1.21 |
0.65 |
1.14 |
1.45 |
|
Municipal waste |
0.44 |
0.56 |
0.65 |
0.44 |
0.54 |
0.89 |
|
Biomass |
1.79 |
5.54 |
5.30 |
1.72 |
3.74 |
4.58 |
|
Solar |
0.059 |
0.06 |
0.061 |
0.066 |
0.068 |
0.095 |
|
Wind |
2.33 |
5.76 |
6.73 |
2.57 |
5.63 |
13.94 |
|
Total renewable |
12.0 |
20.1 |
21.3 |
11.6 |
17.8 |
28.1 |
|
Total non-hydropower renewable |
5.13 |
12.92 |
13.93 |
5.37 |
11.17 |
20.97 |
|
Source: Data from EIA, 2008a. |
||||||
TABLE 7.9 Average Annual Growth Rate (Percent) from 2005 to 2030 for Each Source of Renewable Electricity Generation
|
|
Hydropower |
Geothermal |
Municipal Waste |
Biomass |
Solar |
Wind |
|
Reference case |
0.49 |
3.05 |
1.88 |
9.45 |
18.51 |
8.78 |
|
Core case |
0.57 |
5.38 |
2.93 |
18.02 |
18.51 |
12.03 |
|
High-cost case |
0.71 |
6.34 |
5.08 |
21.94 |
19.4 |
15.85 |
|
Source: Data from EIA, 2008a. |
||||||
of each renewable resource from 2005 to 2030. With GHG-emissions-regulating legislation in place, the NEMS model shows a sharp increase in the growth rate of biomass, solar, and wind generation, especially for the high-cost case, Wind generation would increase significantly, averaging annual growth at 16 percent in the high-cost case, and would grow to constitute 14 percent of the U.S. electricity mix by 2030. Despite this projected rapid growth, NEMS does not indicate a 20 percent contribution by wind energy to the U.S. electricity mix, as is projected in the 20 percent wind scenario discussed above in this chapter. Interestingly, despite the rapid growth rate for solar electricity in all cases, averaging 19 percent annually, solar would still contribute less than 1 percent of total U.S. electricity generation. These values are much smaller than the 10 percent solar generation described in the DOE study discussed above (DOE, 2008). Finally, the EIA estimates significant
growth in the use of biomass for electricity generation: by 2030 biomass it would be used to generate 4–5 percent of the U.S. electricity supply.
Summary of Macroeconomic Impacts and Model Uncertainties
EIA’s estimates of the macroeconomic impacts of the CSA include an increase in energy prices for consumers, especially in the cost of electricity, with increases of 11–64 percent, mainly as a result of high GHG allowance prices. Also projected by EIA is a reduction of total electricity consumption (5–11 percent). The large increases in energy costs would reduce economic output, lessen purchasing power, and lower aggregate demand for goods and services. In the core CSA case, the gross domestic product would fall by approximately 0.2 percent and would fall by approximately 0.8 percent in the high-cost case.
Many major uncertainties are associated with the EIA projections. It is difficult to foresee how existing technologies might evolve or what new technologies might emerge as market conditions change, particularly when those changes are fairly dramatic. To meet greenhouse gas emission reduction targets, future electricity providers will have to rely on technologies that today play a relatively small role or have not been built in the United States in some time. The actual cost of implementing legislation such as the CSA would depend on unknowns such as future reductions in the cost of renewable technologies, the potential for successful commercialization of CCS, and future costs for nuclear power—all of which cannot be predicted by the model.
FINDINGS
Shown in bold below are the most critical elements of the panel’s findings, based on its examination of previously produced scenarios, regarding the future expansion of renewable electricity and factors affecting renewables expansion and integration into the U.S. electricity supply system.
Scale of Deployment
An understanding of the scale of deployment necessary for renewable resources to make a material contribution to U.S. electricity generation is critical to assessing the potential for renewable electricity generation. Large increases over current levels of manufacturing, employment, investment, and installation will be required
for non-hydropower renewable resources to move from single-digit- to double-digit-percentage contributions to U.S. electricity generation.
The scenarios described in this chapter indicate some of the characteristics and impacts associated with accelerating the integration of more renewable generation in the U.S. electricity market. Wind power, an intermittent source of electricity, would be the largest contributor in the near term. DOE (2008) shows that 20 percent of U.S. electricity generation could be obtained from wind and integrated into the nation’s electricity system. Follow-up studies such as JCSP (2009) assess the impacts of 20 percent wind at a regional level. Solar PV and CSP could also contribute to attaining additional renewable electricity generation by 2035. Solar electricity is the only renewable resource that has a sufficiently large resource base to supply a majority of the electricity demands of the United States. Today’s prices prevent solar electricity from being a widespread economic option at this time. However, the ability of solar PV to produce electricity at the point of consumption means that it competes with the higher retail price of electricity as opposed to the wholesale price of electricity. Solar CSP can provide utility-scale solar power at lower costs than solar PV, though it is limited to favored sites in the U.S. Southwest that have abundant direct solar radiation. Additional contributions could come from biopower and conventional geothermal resources, which can provide baseload power. Thus, if renewables were to contribute an additional 20 percent or more of all U.S. electricity generation by 2035, the largest portion of new renewable electricity generation would come from wind power, but other renewables would also contribute to making this goal a reasonable possibility.
The numbers from the 20 percent wind penetration study (DOE, 2008) demonstrate the challenges and opportunities. To reach the 20 percent target would require installing 100,000 wind turbines; incurring $100 billion worth of additional capital investments and transmission upgrades; and requiring 140,000 jobs be filled. Achieving this goal could reduce CO2 emissions by 800 million metric tons. The high solar market penetration scenarios also present challenges associated with scaling up this resource. The 10 percent solar study (Pernick and Wilder, 2008) would require that annual installation of PV increase to almost 50 GW in 2025 and installation of CSP to almost 7 GW, with prices for installed PV declining to $1.48–1.82/W and prices for installed CSP declining to $0.88/W in the same timeframe. The cost estimates for reaching the 10 percent solar goal are $26–33 billion per year, with a total cost of $450–560 billion.
In the panel’s opinion, increasing manufacturing and installation capacity, employment, and financing to levels required to meet the goals for greatly
increased solar or wind penetration goals is doable. However, to do so would require aggressive growth rates, a large increase in manufacturing and installation capacity, and a large infusion of capital. The magnitude of the challenges is clear from the scale of such efforts.
Integration of Renewable Electricity
The cost of new transmission and upgrades to the distribution system will be important factors when integrating increasing amounts of renewable electricity. The nation’s electricity grid needs major improvements regardless of whether renewable electricity generation is increased. Such improvements would increase the reliability of the electricity transmission system and would reduce the losses incurred with all electricity sources. However, because a substantial fraction of new renewable electricity generation capacity would come from intermittent z distant sources, increases in transmission capacity and other grid improvements are critical for significant penetration of renewable electricity sources. According to the Department of Energy’s study postulating 20 percent wind penetration, transmission could be the greatest obstacle to reaching the 20 percent wind generation level. Transmission improvements can bring new renewable resources into the electricity system, provide geographical diversity in the generation base, and allow improved access to regional wholesale electricity markets. These benefits can also generally contribute positively to the reliability, stability, and security of the grid. Improvements in the system’s distribution of electricity are needed to maximize the benefits of two-way electricity flow and to implement time-of-day pricing. Such improvements would more efficiently integrate distributed renewable electricity sources, such as solar photovoltaics sited at residential and commercial units. A significant increase in renewable sources of power in the electricity system would also require fast-responding backup generation and/or storage capacity, such as that provided by natural gas combustion turbines, hydropower, or storage technologies. Higher levels of penetration of intermittent renewables (above about 20 percent) would require batteries, compressed air energy storage, or other methods of storing energy such as conversion of excess generated electricity to chemical fuels. Improved meteorological forecasting could also facilitate increased integration of solar and wind power. Hence, though improvements in the grid and related technologies are necessary and valuable for other objectives, significant integration of renewable electricity will not occur without increases in transmission capacity as well as other grid management improvements.
Timeframes for Renewable Technologies
For the time period from the present to 2020, there are no current technological constraints for wind, solar photovoltaics and concentrating solar power, conventional geothermal, and biomass technologies to accelerate deployment. The primary current barriers are the cost-competitiveness of the existing technologies relative to most other sources of electricity (with no costs assigned to carbon emissions or other currently unpriced externalities), the lack of sufficient transmission capacity to move electricity generated from renewable resources to distant demand centers, and the lack of sustained policies. Expanded research and development is needed to realize continued improvements and further cost reductions for these technologies. Along with favorable policies, such improvements can greatly enhance renewable electricity’s competitiveness and its level of deployment. Action now will set the stage for greater, more cost-effective penetration of renewable electricity in later time periods. It is reasonable to envision that, collectively, non-hydropower renewable electricity could begin to provide a material contribution (i.e., reaching a level of 10 percent level or more with trends toward continued growth) to the nation’s electricity generation in the period up to 2020 with such accelerated deployment. Combined with hydropower, total renewable electricity could approach a contribution of 20 percent of U.S. electricity by the year 2020.
In the period from 2020 to 2035, it is reasonable to envision that continued and even further accelerated deployment could potentially result in non-hydroelectric renewables providing, collectively, 20 percent or more of domestic electricity generation by 2035. In the third timeframe, beyond 2035, continued development of renewable electricity technologies could potentially provide lower costs and result in further increases in the percentage of renewable electricity generated from renewable resources. However, achieving a predominant (i.e., >50 percent) level of renewable electricity penetration will require new scientific advances (e.g., in solar photovoltaics, other renewable electricity technologies, and storage technologies) and dramatic changes in how we generate, transmit, and use electricity. Scientific advances are anticipated to improve the cost, scalability, and performance of all renewable energy generation technologies. Moreover, some combination of intelligent, two-way electric grids; scalable and cost-effective methods for large-scale and distributed storage (either direct electricity energy storage or generation of chemical fuels); widespread implementation of rapidly dispatchable fossil-based electricity technologies; and greatly improved technologies for cost-effective long-distance electricity transmission will be required. Significant,
sustained, and greatly expanded R&D focused on these technologies is also necessary if this vision is to be realized by 2035 and beyond.
REFERENCES
AEP (American Electric Power). 2007. Interstate transmission vision for wind integration. AEP white paper. Columbus, Ohio.
Bradford, T. 2008. Solar energy market update 2008—PV and CSP. Presentation at Solar Market Outlook: A Day of Data, February 19, 2008. New York.
Brenkert, A., S. Smith, S. Kim, and H. Pitcher. 2003. Model Documentation for the MiniCAM. PNNL-14337. Richland, Wash.: Pacific Northwest National Laboratory.
CCSP (U.S. Climate Change Science Program). 2007. Scenarios of Greenhouse Gas Emissions and Atmospheric Concentrations; and Review of Integrated Scenario Development and Application. Washington, D.C.
Clarke, L., J. Edmonds, H. Jacoby, H. Pitcher, J. Reilly, and R. Richels. 2007a. Scenarios of Greenhouse Gas Emissions and Atmospheric Concentrations. Sub-report 2.1A of Synthesis and Assessment Product 2.1. U.S. Climate Change Science Program and the Subcommittee on Global Change Research, Office of Biological and Environmental Research. Washington, D.C.: U.S. Department of Energy.
Clarke, L., J. Edmonds, S. Kim, J. Lurz, H. Pitcher, S. Smith, and M. Wise. 2007b. Documentation for the MiniCAM CCSP Scenarios. PNNL-16735. Richland, Wash.: Battelle Pacific Northwest Laboratory.
Commission of the European Communities. 2007. Renewable Energy Road Map Renewable Energies in the 21st Century: Building a More Sustainable Future. Communication. Report to the Council and European Parliament. Brussels.
Curtright, A., and J. Apt. 2008. The character of power output from utility-scale photovoltaic systems. Progress in Photovoltaics 16(3):241-247.
DeMeo, E., W. Grant, M.R. Milligan, and M.J. Schuerger. 2005. Wind plant integration. IEEE Power & Energy Magazine 3(6).
DOE (U.S. Department of Energy). 2007a. Annual Report on U.S. Wind Power Installation, Cost, and Performance Trends. Office of Energy Efficiency and Renewable Energy. Washington, D.C.
DOE. 2007b. Solar America Initiative—A Plan for the Integrated Research, Development, and Market Transformation of Solar Energy Technologies. Washington, D.C.
DOE. 2008. 20% Wind Energy by 2030: Increasing Wind Energy’s Contribution to U.S. Electricity Supply. Office of Energy Efficiency and Renewable Energy. Washington, D.C.
EIA (Energy Information Administration). 2003. The National Energy Modeling System: An Overview 2003. Washington, D.C.: U.S. Department of Energy, EIA.
EIA. 2008a. Energy Market and Economic Impacts of S. 2191, the Lieberman-Warner Climate Security Act of 2007. Washington, D.C.: U.S. Department of Energy, EIA.
EIA. 2008b. Annual Energy Outlook 2008: With Projections to 2030. DOE/EIA-0383(2008). Washington, D.C.: U.S. Department of Energy, EIA.
EIA. 2008c. Annual Energy Review 2007. Washington, D.C.: U.S. Department of Energy, EIA.
EIA. 2008d. Annual Energy Outlook 2009 Early Release. U.S. Department of Energy DOE/EIA-0383(2009). Washington, D.C.: U.S. Department of Energy, EIA.
Feltrin, A., and A. Freundlich. 2008. Material considerations for terawatt level deployment of photovoltaics. Renewable Energy 33:180-185.
GE Energy. 2005. The Effects of Integrating Wind Power on Transmission System Planning. Prepared for the New York State Energy Research and Development Authority. New York.
Goldberg, M., K. Sinclair, and M. Milligan. 2004. Job and Economic Development Impact (JEDI) model: A user-friendly tool to calculate economic impacts from wind projects. Presented at the Global Windpower Conference, Chicago, Ill. Washington, D.C.: American Wind Energy Association.
Grover, S. 2007. Energy, Economic, and Environmental Benefits of the Solar America Initiative. Subcontractor Report NREL/SR-640-41998. National Renewable Energy Laboratory. Washington, D.C.: U.S. Department of Energy.
JCSP (Joint Coordinated System Plan). 2009. Joint Coordinated System Plan 2008. Available at http://www.jcspstudy.org/.
Manne, A., and R. Richels. 2005. MERGE—A model for global climate change. Energy and Environment (R. Loulou, J. Waaub, and G. Zaccour, eds.). New York: Springer.
Parsons, B. 2006. Grid impacts of wind power variability: Recent assessments from a variety of utilities in the United States. Presentation at the European Wind Energy Conference, March 2006. Athens, Greece. Brussels: European Wind Energy Association.
Pernick, R., and C. Wilder. 2008. Utility Solar Assessment (U.S.A.) Study Reaching Ten Percent by 2025. San Francisco: Clean Edge, Inc. Available at http://www.cleanedge.com/reports/reports-solarUSA2008.php.
Prometheus Institute: For Sustainable Development. 2007. U.S. Solar Industry: The Year in Review 2006. SEIA/Prometheus Institute Joint Report. Cambridge, Mass.
SEIA (Solar Energy Industries Association). 2001. Solar Electric Power—The U.S. Photovoltaic Industry Roadmap. Washington, D.C.
SEIA. 2004. Our Solar Power Future—The U.S Photovoltaic Industry Roadmap Through 2030 and Beyond. Washington, D.C.
Smith, J.C., and B. Parsons. 2007. What does 20 percent look like? IEEE Power & Energy Magazine 5:22-33.
Sokolov, A., C. Schlosser, S. Dutkiewicz, S. Paltsev, D. Kicklighter, H. Jacoby, R. Prinn, C. Forest, J. Reilly, C. Wang, B. Felzer, M. Sarofim, J. Scott, P. Stone, J. Melillo, and J. Cohen. 2005. The MIT Integrated Global System Model (IGSM) Version 2: Model Description and Baseline Evaluation. Report 124. MIT Joint Program on the Science and Policy of Global Change. Cambridge, Mass.
Southern California Edison. 2008. Southern California Edison launches nation’s largest solar panel installation. News release. Rosemead, Calif.: Edison International.
Stoddard, L., J. Abiecunas, and R. O’Connell. 2006. Economic, Energy, and Environmental Benefits of Concentrating Solar Power in California. Golden, Colo.: National Renewable Energy Laboratory.
USGS (U.S. Geological Survey). 2007. Mineral Commodity Summaries. Reston, Va.: USGS Minerals Information.
UWIG (Utility Wind Integration Group). 2006. Grid Impacts of Wind Power Variability: Recent Assessments from a Variety of Utilities in the United States. Reston, Va. Available at http://www.uwig.org/opimpactsdocs.html.
WGA (Western Governors’ Association). 2006. Clean and Diversified Energy Initiative: Geothermal Task Force Report. Washington, D.C.
Wiley, L. 2007. Utility scale wind turbine manufacturing requirements. Presentation at National Wind Coordinating Collaborative’s Wind Energy and Economic Development Forum, April 24, 2007. Lansing, Mich.
Wiser, R. 2008. The development, deployment, and policy context of renewable electricity: A focus on wind. Presentation at the fourth meeting of the Panel on Electricity from Renewable Resources, March 11, 2008. Washington, D.C.
Zavadil, R., J. King, L. Xiadong, M. Ahlstrom, B. Lee, D. Moon, C. Finley, L. Alnes, L. Jones, F. Hudry, M. Monstream, S. Lai, and J. Smith. 2004. Wind Integration Study—Final Report. Xcel Energy and the Minnesota Department of Commerce, EnerNex Corporation and Wind Logics, Inc. Available at http://www.uwig.org/XcelMNDOCStudyReport.pdf.
Zweibel, K., J. Mason, and V. Fthenakis. 2008. A solar grand plan. Scientific American 298(1):64-73.


