
F
Atmospheric Emissions from Fossil-Fuel and Nuclear Electricity Generation
Because of its high C-to-H ratio, coal is potentially the highest emitter of the energy sources available when it comes to greenhouse gas emissions. Emissions for traditional pulverized-coal plants hover near or above 1000 g CO2e/kWh, about 2 orders of magnitude larger than most estimates for renewables. However, the emissions can be significantly mitigated to as low as ~40 g CO2e/kWh with different configurations and most notably with carbon capture and storage (CCS) technologies, assuming that CCS can be successfully implemented (see Figure F.1).
Estimates for CO2 emissions from pulverized-coal plants currently deployed range from 960 and 1050 g CO2e/kWh; these estimates include the average for the United States, the United Kingdom, and Japan, as well as the average for the United States operating under new source performance standards (NSPS). Modest reductions (757 to 879 g CO2e/kWh) are projected for new technologies that increase plant efficiency; these include a future low-emission boiler system (LEBS) (Spath et al., 1999), a U.K. supercritical pulverized coal plant (Odeh and Cockerill, 2008), and a U.K. integrated gasification combined cycle (IGCC) plant (Odeh and Cockerill, 2008). Emissions from a coal co-fired with biomass waste residue facility are estimated at 681 g CO2e/kWh (Spath and Mann, 2004).
The lower end of the range from 43 to 255 g CO2e/kWh includes a variety of coal technologies with future CCS methods. The carbon capture methods discussed in the literature include absorption by monoethanolamine (MEA) and selexol. (MEA is a post-combustion CO2 capture method for the traditional pulverized-coal and biomass co-fired plants and thus could be used with the existing fleet. Selexol is used to capture CO2 prior to combustion in IGCC
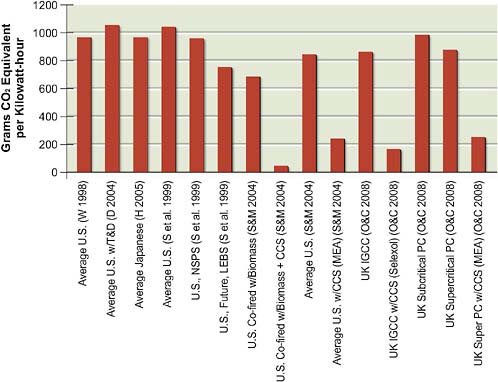
FIGURE F.1 Range of life-cycle CO2equivalent emissions from various technologies for generating electricity from coal.
Source: Based on data compiled from Denholm (2004), Hondo (2005), Odeh and Cockerill (2008), Spath and Mann (2004), Spath et al. (1999), and White (1998).
plants.) A hypothetical U.K. IGCC plant with carbon capture via selexol had a value of 167 g CO2e/kWh (Odeh and Cockerill, 2008). Two hypothetical U.S. and U.K. average coal plants with carbon capture via MEA emit approximately 250 g CO2e/kWh (Odeh and Cockerill, 2008; Spath and Mann, 2004). The lowest value of 43 g CO2e/kWh is from a hypothetical coal plant co-fired with biomass residues (Spath and Mann, 2004). However, this estimate did not account for CO2 emissions associated with the production, regeneration, or disposal of MEA.
Because MEA is highly reactive with SO2, Odeh and Cockerill (2008) also evaluated a pulverized-coal plant with CCS, but without flue gas desulfurization (FGD) to evaluate how the life-cycle emissions of CO2 would be affected by the interaction of the MEA with SO2. Under this scenario significantly more MEA would be required, and because of the extra emissions associated with producing
MEA and other materials used in the capture process, they found that life-cycle CO2e emissions doubled.
Natural Gas
Key factors affecting natural gas CO2 emissions from natural gas facilities include plant efficiency and natural gas losses from production and distribution. Emissions for natural gas combined cycle (NGCC) plants had a small range of 469 to 518 g CO2e/kWh. A higher value of 608 g CO2e/kWh was reported for the only gas-fired plant evaluated (Hondo, 2005). CCS is not expected to have as large an impact on natural gas carbon emissions as it does for coal because upstream emissions are more significant in the natural gas fuel cycle. Two studies evaluated the future deployment of CCS with MEA for NGCC plants. Odeh and Cockerill (2008) found CCS reduced emissions from 488 to 200 g CO2e/kWh and Spath and Mann (2004) found emissions dropped from 499 to 245 g CO2e/kWh. The Spath and Mann (2004) result does not include CO2 emissions associated with production, regeneration, or disposal of MEA.
Nuclear
For nuclear technologies, the studies reviewed report values from 3 to 106 g CO2e/kWh, with all values except the low and high values clustered from 15 to 25 g CO2e/kWh. The low value of 3 g CO2e/kWh is from Vattenfall (2004) and the high value of 108 g CO2e/kWh is from Storm van Leeuwen and Smith (2008). The Vattenfall study used PA methods to analyze two Swedish reactors where 80 percent of the fuel enrichment was performed by centrifuge. The reactors were assumed to operate at 85 percent capacity with a life expectancy of 40 years. The Storm van Leeuwen and Smith (2008) study used EIO methods to analyze a nuclear facility located outside of Sweden with fuel enrichment via gas diffusion and an 82 percent operational capacity over a life expectancy of 30 years. The nuclear subgroup of the America’s Energy Future (AEF) Committee uses a narrower range of 24 to 55 g CO2e/kWh. The narrower range was developed by the nuclear subgroup of the AEF Committee to represent the CO2 emissions from the current fuel enrichment situation in the United States.
Fthenakis and Kim (2007) attribute most of the difference between low and high estimates on nuclear power to three factors: the energy mix of the country developing the plant, whether enrichment is via centrifugation or diffusion (diffusion tends to use 40 percent more electricity), and the type of LCA method used.
They found that EIO methods gave estimates 10–20 times higher than PA methods for side by side comparisons of nuclear plant construction. The difference between the results of these studies is a topic of interest in the nuclear power industry.
SO2EMISSIONS
Coal
Because of coal’s high sulfur content, traditional pulverized-coal plants have the highest SO2 emissions of all technologies considered here—approaching 7000 mg/kWh. Significantly lower emissions, however, are estimated for different coal-based configurations. The high-end values correspond to two cases from the United States: one case with SO2 at 6700 mg/kWh based on average U.S. coal plant emissions in 1995, and a plant that complied with the NSPS with SO2 at 2530 mg/kWh (Spath et al., 1999). The mid-range includes several cases from the United Kingdom that have SO2 values of 1000–1250 mg/kWh (Berry et al., 1998; Odeh and Cockerill, 2008). Spath et al. (1999) analyzed a coal-fired plant with a low-emission boiler system (LEBS) that emitted SO2 at 720 mg/kWh.
IGCC plants with or without CCS are estimated to emit SO2 at between 200 mg and 330 mg/kWh. Odeh and Cockerill (2008) found that CCS to an IGCC plant caused a 10 percent increase in SO2 emissions. On the other hand, the lowest SO2 emissions were estimated for a supercritical coal plant with carbon capture via MEA. In this case SO2 emissions were reduced from 1250 to 9 mg/kWh (Odeh and Cockerill, 2008), primarily by increasing SO2 removal efficiency from 90 percent to 98 percent with flue gas desulfurization (FGD).
Natural Gas
Natural gas SO2 emission data were reviewed for three studies that reported SO2 emissions as negligible to 324 mg/kWh. Different methodological assumptions contribute to the very divergent results from the European and U.S. studies. The U.K. ExternE (Berry et al., 1998) study assumed SO2 as negligible through the fuel cycle and the German ExternE study (European Commission, 1997) had a very small value for SO2 of 3 mg/kWh from extraction only. In contrast, the U.S. study assigned a large value of 324 mg/kWh for SO2 emissions, with more than 80 percent of the emissions from gas production and distribution and about 15 percent from construction and decommissioning of plant (Spath and Mann, 2000).
NOx EMISSIONS
Coal
As is the case for other gaseous emissions, coal has potentially the greatest rate of NOx emissions. Estimates range from 100 to 3,350 mg/kWh. These values represent a number of different configurations, including current average practices, future practices, different power plant designs, and with CCS technologies. The high end of the range includes a U.S. NSPS, an average U.S. case, and an average U.K. case. The average U.S. case emitted NOx at 3350 mg/kWh (Spath et al., 1999), the U.S. NSPS case emitted NOx at 2340 mg/kWh (Spath et al., 1999), and the average U.K. case emitted NOx at 2200 mg/kWh (Berry et al., 1998). Hypothetical future cases from Berry et al. (1998) and Spath et al. (1999) had mid-range values for NOx of 540–1000 mg/kWh. Emission results from Odeh and Cockerill (2008) suggest pulverized-coal plants with CCS via MEA will experience an increase in NOx emissions. They found that carbon capture via MEA increased air emissions of NOx from 410 to 590 mg/kWh for a supercritical pulverized-coal plant with SCR, FGD, and ESP. (NH3 increases from 5 to 470 mg/kWh with CCS via MEA for coal because oxidation of MEA produces ammonia.)
The lowest NOx emission values were from an IGCC. Without CCS, NOx emissions were estimated at 120 mg/kWh; with CCS via selexol, NOx emissions were estimated to decrease by 17 percent to 100 mg/kWh.
Natural Gas
NOx emissions for NGCC plants were estimated to be considerable, ranging from 140 to 570 mg/kWh. The high value is from Spath and Mann (2000) for an average U.S. plant with SCR. The U.K. case with low NOx burners had a value of 460 mg/kWh (Berry et al., 1998). The ExternE case in Germany reported a value of 277 mg/kWh for a plant with no NOx controls (European Commission, 1997).
The lowest estimated emissions (140 mg/kWh) were from a study by Odeh and Cockerill (2008) of a plant equipped with SCR. They found that the addition of CCR using MEA increased NOx emissions by 14 percent to 60 mg/kWh.
PARTICULATE MATTER EMISSIONS
Coal
Coal has a very wide range of particulate matter emission values. At the low end (4 mg/kWh), the estimated emission rate is as low as or lower than that of renewables. The high-end estimates, approaching 10,000 mg/kWh, are an order of magnitude or greater than for all other technologies. An emission rate for particulate matter of 9,210 mg/kWh was estimated for an average U.S. coal-fired plant, while a U.S. NSPS plant was estimated to emit PM at 9,780 mg/kWh (Spath et al., 1999). Future cases range from 4 to 160 mg/kWh and represent a variety of pollution controls and burner types. At the low end, a hypothetical IGCC plant configured with SO2, NOx, and PM removal systems emitted 4 mg/kWh (Odeh and Cockerill, 2008). CCS had no impact on the estimated PM emissions.
Natural Gas
Two LCA studies for PM emissions from natural gas facilities were found. They reported very different results. The U.S. study estimated a large emission rate of 133 mg/kWh for PM (Spath and Mann, 2000), whereas an ExternE study in Germany estimated a rate of 18 mg/kWh (European Commission, 1997). The difference in the PM emission results is due in part to differing methodological assumptions. In the U.S. study, Spath and Mann (2000) found that approximately equal percentages of PM were emitted from upstream processes and from the power plant itself, while the German ExternE study found negligible PM emissions from power generation (European Commission, 1997).
REFERENCES
Berry, J.E., M.R. Holland, P.R. Watkiss, R. Boyd, and W. Stephenson. 1998. Power Generation and the Environment—A U.K. Perspective. Brussels: European Commission. June.
Denholm, P.L. 2004, Environmental and Policy Analysis of Renewable Energy Enabling Technologies. Ph.D. dissertation, University of Wisconsin, Madison.
European Commission. 1997. ExternE National Implementation Germany. Brussels.
Fthenakis, V.M., and H.C. Kim. 2007. Greenhouse-gas emissions from solar-electric and nuclear power: A life-cycle study. Energy Policy 35:2549-2557.
Hondo, H. 2005. Life cycle GHG emission analysis of power generation systems: Japanese case. Energy 30:2042-2056.
Odeh, N.A., and T.T. Cockerill. 2008. Life cycle GHG assessment of fossil fuel power plants with carbon capture and storage. Energy Policy 38:367-380.
Spath, P., and M. Mann. 2000. Life Cycle Assessment of a Natural Gas Combined-Cycle Power Generation System. NREL/TP-570-27715. Golden, Colo.: National Renewable Energy Laboratory. September.
Spath, P, and M. Mann. 2004. Biomass Power and Conventional Fossil Systems with and without CO2 Sequestration—Comparing the Energy Balance, Greenhouse Gas Emissions and Economics. NREL/TP-510-32575. Golden, Colo.: National Renewable Energy Laboratory. January.
Spath, P., M. Mann, and D. Kerr. 1999. Life Cycle Assessment of Coal-fired Power Production. NREL/TP-570-25119. Golden, Colo.: National Renewable Energy Laboratory. June.
Storm van Leeuwen, J.W. 2008. Nuclear power—The energy balance energy insecurity and greenhouse gases. Updated version of “Nuclear power—The energy balance” by J.W. Storm van Leeuwen and P. Smith. 2002. Available at http://www.stormsmith.nl/.
Vattenfall AB. 2004. Certified Environmental Product Declaration of Electricity from Vattenfall’s Nordic Hydropower. Registration No. S-P-00088. Vattenfall AB Generation Nordic. Stockholm. February. Available at http://www.environdec.com/reg/088/.
White, S. 1998. Net Energy Payback and CO2 Emissions from Helium-3 Fusion and Wind Electrical Power Plants. Ph.D. dissertation. UWFDM-1093. Fusion Technology Institute, University of Wisconsin, Madison.


