
5
Overarching Findings and Lessons Learned from Federal and State Energy Efficiency Policies and Programs
The opportunities described in Chapters 2 through 4 to improve energy efficiency in, respectively, U.S. residential and commercial buildings, the U.S. transportation sector, and U.S. industrial manufacturing are summarized here in Table 5.1, which presents the panel’s conservative and optimistic estimates for cost-effective annual energy savings available in these three sectors in 2020 and 2030.1 The panel’s estimates are not projections; they reflect its assessments of technology potential assuming a rapid rate of deployment, but a rate nonetheless consistent with past deployment rates. If society were to give a higher priority to efficiency, perhaps because of higher energy prices, energy shortages, or concern about greenhouse gas emissions, deployment rates would be faster and the savings would be greater.
To achieve the energy-savings potential outlined in Table 5.1, the manner in which Americans use energy will have to be transformed, and policy actions will doubtless be an integral part of this transformation. Although policy recommendations are outside the scope of this study, in order to inform the policy debate and contribute to a better understanding of how impediments can be overcome, the panel reviewed some of the experience with—and importantly, lessons learned from—policies and programs aimed at influencing energy use in the United States.
|
1 |
As discussed in Chapter 3, “Energy Efficiency in Transportation,” the focus of that assessment relates to technologies that could power the nation’s cars and light trucks. If other categories, such as heavy-duty vehicles and aviation, had been included in the analysis, the panel’s estimate of the total savings would be greater. Forthcoming National Research Council reports will provide estimates for these two categories. |
TABLE 5.1 Panel Estimate of the Potential for Cost-Effective Annual U.S. Energy Savings (in quads) Achievable with Energy Efficiency Technologies in 2020 and 2030
|
|
Conservative Estimate |
Optimistic Estimate |
||
|
|
2020 |
2030 |
2020 |
2030 |
|
Buildings, primary (source) electricity |
9.4 |
14.4 |
9.4 |
14.4 |
|
Residential |
4.4 |
6.4 |
4.4 |
6.4 |
|
Commercial |
5.0 |
8.0 |
5.0 |
8.0 |
|
Buildings, natural gas |
2.4 |
3.0 |
2.4 |
3.0 |
|
Residential |
1.5 |
1.5 |
1.5 |
1.5 |
|
Commercial |
0.9 |
1.5 |
0.9 |
1.5 |
|
Transportation, light-duty vehicles |
2.0 |
8.2 |
2.6 |
10.7 |
|
Industry, manufacturing |
4.9 |
4.9 |
7.7 |
7.7 |
|
Total |
18.6 |
30.5 |
22.1 |
35.8 |
|
Note: Savings are relative to the reference scenario of the EIA’s Annual Energy Outlook 2008 (EIA, 2008) or, for transportation, a similar scenario developed by the panel. See Table 1.2 for more information on the baselines used in the panel’s analysis of the buildings, transportation, and industry sectors. |
||||
5.1
OVERARCHING FINDINGS
On the basis of its estimates of the energy savings potential outlined in Table 5.1, the panel presents the following overarching finding:
Overarching Finding 1
Energy-efficient technologies for residences and commercial buildings, transportation, and industry exist today, or are expected to be developed in the normal course of business, that could potentially save 30 percent of the energy used in the U.S. economy while also saving money. If energy prices are high enough to motivate investment in energy efficiency, or if public policies are put in place that have the same effect, U.S. energy use could be lower than business-as-usual projections by 19–22 quadrillion Btu (17–20 percent) in 2020 and by 30–36 quadrillion Btu (25–31 percent) in 2030.2,3
A savings of the amount of energy estimated in Overarching Finding 1 would reverse the growth in energy use forecasted by the Department of Energy’s Energy Information Administration (EIA, 2008). Instead of increasing from 99 quadrillion Btu (99 quads) in 2008 to 111 quads in 2020 and 118 quads in 2030, as forecast by the EIA (2008), full deployment of cost-effective, energy-efficient technologies would cause U.S. energy use to fall to 89–92 quads in 2020 and 82–88 quads in 2030.
Table 5.1 shows that reducing electricity use in buildings provides the greatest opportunity for energy savings. In fact, these potential savings are so large that, as indicated in Overarching Finding 2, the effects on electricity generation could be dramatic.
Overarching Finding 2
The full deployment of cost-effective, energy-efficient technologies in buildings alone could eliminate the need to add to U.S. electricity generation capacity. Since the estimated electricity savings in buildings from Table 5.1 exceeds the EIA forecast for new net electricity generation in 2030, implementing these efficiency measures would mean that no new generation would be required except to address regional supply imbalances, replace obsolete generation assets, or substitute more environmentally benign generation sources.
The potential savings summarized above are very attractive. As discussed in Chapters 2 through 4, however, many barriers to the deployment of energy-efficient technologies exist, even though the adoption of such technologies is projected to save money over time. These barriers include potentially high up-front costs, alternative uses for investment capital deemed more attractive, the volatility of energy prices leading to uncertainty with respect to the payback time, and the lack of information available to consumers about the relative performance and costs of technology alternatives.
Overarching Finding 3
The barriers to improving energy efficiency are formidable. Overcoming these barriers will require significant public and private support, as well as sustained initiative. The experience of leading states provides valuable lessons for national, state, and local policy makers in the leadership skills required and the policies that are most effective.
One valuable lesson learned is that the long lifetimes of buildings and some capital equipment present a particularly important barrier to implementing energy-efficient technologies. These investments—particularly buildings—can last for decades or even centuries, blocking the implementation of more efficient substitutes.
Overarching Finding 4
Long-lived capital stock and infrastructure can lock in patterns of energy use for decades. Thus, it is important to take advantage of opportunities (during the design and construction of new buildings or major subsystems, for example) to insert energy-efficient technologies into these long-lived capital goods.
In the rest of this chapter the panel discusses this and other examples of valuable experience gained from the implementation of federal and state policies aimed at overcoming barriers to energy savings. The review below concentrates on federal actions, but it also covers some actions taken in two large states, California and New York, as well as some policies adopted by electric utilities.
5.2
ENERGY EFFICIENCY POLICIES AND PROGRAMS
Between 1975 and 1980 the federal government adopted a number of laws that established educational efforts and financial incentives for energy efficiency, and it authorized the setting of efficiency standards. More recent legislation has established minimum efficiency standards for a wide range of household appliances and equipment used in the commercial and industrial sectors, as well as tax incentives to stimulate the commercialization and adoption of highly efficient products and buildings. Over the past 30 years the federal government has also devoted billions of dollars to energy efficiency research and development. In addition, many states
have implemented building energy codes, utility-based energy efficiency programs, and other policies to complement these federal initiatives.4
5.2.1
Vehicle Efficiency Standards
In 1975 the United States adopted energy efficiency standards—known as corporate average fuel economy (CAFE) standards—for cars and light trucks. These standards played the leading role in the near doubling of the average fuel economy of new cars and the 55 percent increase in light-truck fuel economy from 1975 to 1988 (Greene, 1998). In addition, a tax on inefficient “gas guzzlers” contributed to the rise in vehicle fuel economy during the late 1970s and 1980s (Geller and Nadel, 1994). Had these efficiency improvements not been implemented, the U.S. car and light truck fleet would have consumed an additional 2.8 million barrels per day (bbl/d) of gasoline in 2000 (NRC, 2002). The gasoline savings meant lower levels of oil imports and consequently lower trade deficits in the United States compared with what they would have been otherwise. The CAFE standards were met mainly through technological improvements in engines and drivetrains, as well as through vehicle weight reduction (NRC, 2002).
The original CAFE standards for cars reached their maximum level in 1985; small increases in the standards for light trucks have been adopted since then.5 With no further increase in standards, the average fuel economy of each type of vehicle (cars and light trucks) remained nearly constant during the 1987–2007 period. In fact, the combined average fuel economy of new cars and light trucks actually declined from a high of 22.0 miles per gallon (mpg) in 1987 to 20.2 miles per gallon in 2006–2007 (estimated on-road performance, not rated fuel economy), due mainly to the shift from cars toward less-efficient sport utility vehicles (SUVs), pickup trucks, and minivans (EPA, 2007a). As a result of declining new-vehicle fuel economy and increasing vehicle-miles traveled, U.S. gasoline consumption increased 31 percent from 1986 through 2006 (EIA, 2007).
One of the flaws in the original CAFE standards was the lower standards for SUVs and other trucks relative to standards for cars, thereby encouraging manufacturers to redesign trucks to serve as passenger vehicles (Gerard and Lave, 2003). However, other factors also contributed to the shift from cars to light trucks, making it difficult to determine the role of CAFE in this regard (Greene, 1998; NRC, 2002).
Auto manufacturers blocked efforts to increase the standards for many years despite numerous studies showing that raising the standards was technically and economically feasible (NRC, 2002; Difiglio et al.,1990; Greene and DeCicco, 2000). Pressure to raise the standards grew, however, as energy security concerns increased. The U.S. Congress enacted the first significant increase in the CAFE standards in more than 30 years as part of the Energy Independence and Security Act (EISA; Public Law 110-140), which was signed into law by President George W. Bush in December 2007. EISA requires the Department of Transportation to set tougher fuel-economy standards starting in 2011 until the standards reach at least 35 mpg for cars and light trucks combined in 2020—a 40 percent increase over the current standards.6 EISA also gradually phases out the fuel-economy credits for dual-fuel vehicles, a policy that reduced the effectiveness of the CAFE standards without significantly increasing the use of alternative fuels.
It is estimated that the new CAFE standards will save 1.0 million bbl/d of gasoline by 2020 and 2.4 million bbl/d by 2030, while providing more than $50 billion in net economic benefits for consumers (ACEEE, 2007). These estimates include a “rebound effect”—that is, the increase in travel demand due to the reduction in the cost per mile driven as vehicle fuel economy improves. This effect is generally thought to be real but small (Greene, 1998; NRC, 2002; Small and Van Dender, 2007).
5.2.2
Appliance Efficiency Standards
Appliance efficiency standards were first enacted by states—including California, New York, Massachusetts, and Florida—during the late 1970s and early 1980s (Nadel, 2002). Appliance manufacturers, disturbed by the patchwork of state standards, then supported the adoption of uniform national standards. National
standards, developed through negotiations between manufacturers and energy efficiency advocates, first became law in 1987. These standards led to dramatic improvements in the energy efficiency of new refrigerators, air conditioners, clothes washers, and other appliances sold in the United States.
In 1992, minimum efficiency standards were extended to motors, heating and cooling equipment used in commercial buildings, and some types of lighting products. In 2005, standards were adopted for a variety of “second-tier” products, including torchiere light fixtures, commercial clothes washers, exit signs, distribution transformers, ice makers, and traffic signals. With the addition of these new products, national minimum efficiency standards were in place for more than 40 types of products.
Appliance efficiency standards eliminate the least efficient products from the marketplace. At times, such standards have been technology forcing—meaning that few if any products could meet the standard at the time that it was established. This was the case for the standards for refrigerators and clothes washers set by the U.S. Department of Energy (DOE) (Nadel, 2002; Goldstein, 2007). The DOE is authorized to strengthen the minimum efficiency standards on a particular product if it determines that doing so is technologically feasible and economically justified.
It is estimated that national appliance efficiency standards saved 88 terawatt-hours (TWh) of electricity in 2000, or 2.5 percent of national electricity use that year (Nadel, 2002). The retirement of less efficient, older appliances, combined with the adoption since 2000 of new and updated standards, is expected to result in energy savings of 268 TWh in 2010, or 6.9 percent of projected national electricity use in that year, and 394 TWh by 2020, or 9.1 percent of projected national electricity use in that year (Nadel et al., 2006).
The appliance standards laws include initial energy performance requirements, but they also direct the DOE to review them periodically and to adopt more stringent standards if technically feasible and economically justified. For example, the standards on refrigerators and freezers first adopted in 1987 have been significantly strengthened twice since then. As shown in Figure 5.1, the combination of federal and state standards resulted in a 70 percent reduction in the average electricity use of new refrigerators sold in the United States from 1972 through 2001; during this period the price (in constant dollars) also fell by 62 percent, while the refrigerated volume actually increased. New standards on fluorescent lighting ballasts were adopted in 2000, followed by new standards on water heaters, clothes washers, and central air conditioners and heat pumps. Despite
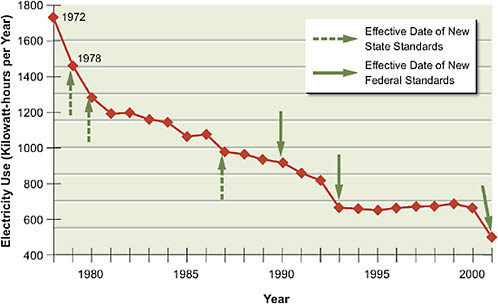
FIGURE 5.1 Average annual electricity consumption of new refrigerators sold in the United States, 1972–2001.
Source: Geller, 2003.
completing these revisions, the DOE has missed legal deadlines for updating standards for about 20 other products. These delays have reduced the energy savings and economic benefits of appliance efficiency standards.
Additional appliance efficiency standards were included in EISA. Most noteworthy are those on general-service lamps, standards that will make it illegal to sell ordinary incandescent lamps after the standards take effect. In Phase One, which takes effect in three stages from 2012 to 2014, manufacturers will be able to produce and sell improved incandescent lamps as well as compact fluorescent lamps (CFLs) and light-emitting diode (LED) lamps that meet the efficiency requirements—that is, the minimum lumens of light output per watt of power consumption. In Phase Two, which takes effect in 2020, only CFLs and LED lamps will qualify unless manufacturers are able to roughly triple the efficiency of incandescent lamps. It is estimated that these new standards will save 59 TWh per year by 2020, in addition to the savings from standards on other products (ACEEE, 2007).
5.2.3
Building Energy Codes
Federal legislation passed in 1976 called for the adoption of national standards for building energy efficiency (also known as building energy codes). The building industry strongly opposed this policy, however, and it was eventually converted to voluntary guidelines and design tools (Clinton et al., 1986). Meanwhile, many states and localities adopted mandatory energy codes for new homes and commercial buildings. Model codes, such as the International Energy Conservation Code (IECC) and American Society of Heating, Refrigerating, and Air-Conditioning Engineers (ASHRAE) Standard 90.1, are widely followed by states and localities, thereby bringing some uniformity to building energy codes. The model codes are updated periodically through a consensus-seeking process. As of 2008, 19 states had adopted the 2006 version of the IECC or a more stringent code for new homes, and 27 states had adopted the ASHRAE 90.1-2004 or 90.1-2006 code or a more stringent code for new commercial buildings (DOE, 2008).
Building energy codes are enforced at the local level throughout the country. There is some evidence that code enforcement and compliance have been weak in various regions (Halverson et al., 2002; Kinney et al., 2003; Khawaja et al., 2007), and a number of jurisdictions have taken steps to simplify their energy codes in order to facilitate compliance. Training architects, builders, contractors, and local code officials can significantly improve code compliance and can also be very cost-effective in terms of energy savings per program dollar (Stone et al., 2002). The DOE provides software tools, technical assistance, and grants to support code adoption and implementation.
It is estimated that the influence of building energy codes on new homes and commercial buildings constructed during the 1990s reduced U.S. energy use by 0.54 quad in 2000 (Nadel, 2004). This is a conservative estimate of the impact of energy codes in that it does not consider buildings constructed before 1990 or after 1999. The DOE estimates that if all states adopted the update to the model commercial building energy code approved by ASHRAE in 1999, building owners and occupants would save about 0.8 quad over 10 years (DOE, 2007a). Even more energy savings would result if all states adopted a more recent version of the ASHRAE model standard, such as the 2007 version. Energy codes in general are very cost-effective, with any extra first cost for complying with the code usually paid back through energy savings in 7 or fewer years (WGA, 2006).
5.2.4
Government-Funded Research, Development, and Demonstration
From 1978 to 2000, the DOE spent more than $7 billion (1999 dollars) on energy efficiency research, development, and demonstration (RD&D) programs, and as estimated by a report from the National Research Council, some of the most successful RD&D programs are yielding net economic benefits to the nation of around $30 billion (NRC, 2001).
DOE-funded research has contributed to the development and commercialization of a number of energy-efficient building technologies, including high-efficiency appliances, electronic lighting ballasts, and low-emissivity windows. RD&D programs tend to be most effective (Geller and McGaraghan, 1998; Alic et al., 2003) when they:
-
Involve collaboration between public research institutions (such as universities and DOE national laboratories) and the private sector,
-
Focus on multiple technologies and designs,
-
Contribute to all stages of the innovation and product development process, and
-
Are complemented by other policies, such as financial incentives or regulations that stimulate market demand.
In contrast to the building technology program, DOE’s transportation technology RD&D program has had very little effect on the vehicle marketplace. This result is attributed to the fact that the DOE initially chose to focus on a limited number of advanced engines and power systems, such as Stirling engines, gas turbines, and battery-powered electric vehicles—none of which proved viable because of technological problems, lack of industry interest, and/or lack of market acceptance. The more recent focus on hybrid-electric power trains and fuel cells also has not influenced commercial vehicles so far, although considerable technical progress has been made and these technologies show great promise (NRC, 2008). This experience demonstrates that RD&D projects should be carefully selected and designed, taking into account technological, institutional, and market barriers.
The Department of Energy operates a number of programs to promote greater energy efficiency in industry. Until 2007, the DOE funded RD&D mainly in partnership with nine energy-intensive sectors—agriculture, aluminum, chemicals, forest products, glass, metal casting, mining, petroleum, and steel. More recently the DOE has shifted RD&D toward crosscutting “technology platforms”
such as industrial reactions and separations, waste-heat minimization and recovery, and high-temperature processing. The DOE recently identified nearly 100 technologies that it supported in the past decade that are now commercially available and saving energy to some degree. These technologies are estimated to have saved about 1.1 quads of energy cumulatively and about 0.1 quad in 2005 alone (DOE, 2007b).
5.2.5
Federal Incentives and Grants
Federal tax credits were provided for energy efficiency measures purchased by households and businesses in the late 1970s and early 1980s. The credit amounted to 15 percent of the measure cost7 for households and 10 percent of the measure cost for businesses. However, studies were not able to document that the tax credits expanded the adoption of energy efficiency measures (Clinton et al., 1986; OTA, 1992). This result was attributed to the small size of the credits and the fact that the credits applied to commonplace efficiency measures such as home insulation and weather stripping, which had already been widely adopted before the credits took effect. These tax incentives cost the U.S. Treasury around $10 billion and were discontinued in 1985.
Based in part on this experience, new tax credits were enacted in 2005 for innovative energy efficiency measures that included hybrid, fuel cell, and advanced diesel vehicles; highly efficient new homes and commercial buildings; and efficient appliances. These tax credits were intended to support the commercialization and market development of these innovative technologies but not necessarily to save a significant amount of energy. In addition, a 10 percent tax credit of up to $500 was adopted for energy retrofits to the building envelope of existing homes. Except for the tax credits for advanced vehicles, these new tax credits were slated to expire at the end of 2007, but most were extended as part of the American Recovery and Reinvestment Act of 2009 (ARRA; Public Law 111-5). It is still too early to evaluate the impact of the 2005 tax credits.
Low-income households typically spend 16 percent of their total annual income on home energy costs, compared to 5 percent or less for middle- and upper-income households (DOE, 2006). The DOE provides grants to improve the energy efficiency of low-income housing through the Weatherization Assistance
Program (WAP). The WAP has helped more than 6.2 million families reduce their energy consumption and energy cost burden since 1976. The DOE estimates that these households experienced a $1.6 billion reduction in energy costs during the winter of 2005 as a result of the weatherization efforts (DOE, 2006).
Energy efficiency researchers developed improved home audit and retrofit techniques during the course of the WAP. These techniques include instrumented audits using blower doors, advanced air-sealing techniques, and greater emphasis on heating system improvements. As a result, the WAP lowered space-heating energy consumption in participating households by an average of 31 percent for homes weatherized from 1993 through 2002 (Berry and Schweitzer, 2003). This is significantly greater than the energy savings realized in homes weatherized during the 1970s and 1980s.
In recent years, federal funding for the WAP has enabled the weatherization of about 100,000 homes per year. The ARRA provides $5 billion in additional funds for home weatherization, as well as more flexible qualification and spending criteria. This one-time funding will enable the retrofitting of approximately 1 million homes.
5.2.6
State and Utility Programs
States and electric utilities have played a significant role in advancing energy efficiency in the United States. Many state utility regulatory commissions or state legislatures require electric utilities to operate energy efficiency programs, also known as demand-side management (DSM) programs. Most of these programs are funded through a small surcharge on electricity sales. In some states, utilities are allowed to earn more profit from the kilowatt-hours of electricity use saved through their energy efficiency programs than from the kilowatt-hours of new electricity delivered as a result of building new power plants or other energy supply facilities (not accounting for the relative size of the different resource options) (Kushler et al., 2006). This approach removes the financial disincentive that discourages utilities from promoting energy efficiency measures to their customers. In a few states, these programs are implemented by independent entities or state agencies rather than by utilities.
Utility and state efficiency programs provide information, technical assistance, and financial incentives to end users in order to encourage their greater adoption of cost-effective energy efficiency measures. Rebates are provided for a wide range of measures ranging from energy-efficient lightbulbs to heat pumps
to commercial and industrial energy efficiency projects. Many programs promote ENERGY STAR® products and buildings and support the implementation of building energy codes as well as encourage new construction that exceeds minimum code requirements. Program managers have made considerable progress in developing and refining strategies for maximizing energy savings and program cost-effectiveness over the past 25 years (Nadel and Geller, 1996; NAPEE, 2006).
Although the funding for utility DSM programs was cut during the mid-1990s as utility deregulation and restructuring began, it has rebounded in recent years. The funding for these programs nationwide increased from about $0.9 billion in 1997 to $2.0 billion in 2006 (CEE, 2007). There is considerable variation in the commitment to—and funding for—utility energy efficiency programs among states. As of 2004, the leading states were spending more than $15 per capita on these programs, whereas the median state was spending only $1.64 per capita. The top 20 states (in terms of spending per capita) accounted for 88 percent of nationwide spending on utility energy efficiency programs in 2004 (Eldridge et al., 2007).
Some states have adopted energy-savings requirements, sometimes known as energy efficiency resource standards, for utility and state energy efficiency programs. Connecticut, for example, is requiring electricity providers to achieve 1 percent electricity savings per year from end-use efficiency efforts, combined heat and power (CHP) plants, and waste-heat recovery. Minnesota has enacted overall energy-savings goals of 1.5 percent per year, with at least 1 percent coming from utility efficiency programs. Texas now requires electricity providers to offset 20 percent of projected load growth through end-use efficiency programs. Other states including Hawaii, Nevada, and North Carolina allow utilities to count the energy savings from efficiency programs as well as renewable energy generation toward meeting overall clean-energy standards (Nadel, 2007).
Utilities have collaborated to stimulate the development and commercialization of advanced technologies and superior efficiency levels. One such example is the “golden carrot” incentive program that led to the introduction of new, highly efficient refrigerators during the 1990s and also paved the way for next-generation efficiency standards (Geller and Nadel, 1994). In this case, participating utilities paid the winning manufacturer incentives—up to $30 million—as it sold qualifying highly efficient models in their service areas. Utilities have also collaborated to stimulate the development and commercialization of highly efficient air conditioners and heat pumps, heat-pump water heaters, air duct testing and sealing techniques, and other new energy efficiency technologies (Nadel et al., 2003).
In addition to the funding of energy efficiency programs by utilities, the DOE provides funding to states through the State Energy Program (SEP). This funding, a total of $49.5 million in fiscal year 2007, is used by state energy offices for loans and grants, energy audits, codes and standards efforts, training, and other educational activities related to advancing energy efficiency and renewable energy use. Researchers have determined that the state-level programs are very cost-effective, with more than $7 in energy-bill savings on average for each dollar provided by the DOE (Tonn and Peretz, 2007). The programs also yield substantial nonenergy benefits, including local economic development, reduction in pollutant emissions, and improved public health and safety. The ARRA of 2009 provides $3.1 billion in one-time funding for the SEP.
Utility and state energy efficiency programs as a whole reduced electricity use by about 74 TWh in 2004, or 2.0 percent of electricity sales nationwide (York and Kushler, 2006). In leading states such as California, Connecticut, Minnesota, Vermont, and Washington, however, efficiency programs reduced electricity use in 2004 by 7 to 9 percent, considering the cumulative impact of the programs in these states. Furthermore, energy savings have risen since 2004 because overall DSM funding has increased. National energy savings reached approximately 90 TWh as of 2006.
5.2.7
Promotion of Combined Heat and Power Systems
In addition to their other accomplishments, policy initiatives have also improved the efficiency of energy conversion and supply, specifically by expanding the use of combined heat and power systems, also known as cogeneration. The Public Utility Regulatory Policies Act of 1978 (PURPA; Public Law 95-617) includes a section mandating that utilities buy power from cogenerators (and other qualifying, smaller power producers) at avoided costs. PURPA also exempts qualifying facilities from regulatory oversight under the Public Utilities Holding Company Act (PUHCA; Public Law 74-333) and from constraints on natural gas use imposed by the Power Plant and Industrial Fuel Use Act (Public Law 95-620). Some states, such as California and New York, set attractive avoided costs and contract terms, and CHP capacity nationwide expanded from less than 10 gigawatts (GW) in 1980 to almost 44 GW by 1993 (Elliott and Spurr, 1999).
The expansion of CHP capacity slowed during the 1990s because of declining avoided costs and the onset of utility deregulation and restructuring, but the Clinton administration launched a new CHP initiative in late 1998, setting a goal
of 92 GW of installed CHP capacity by 2010. The DOE and the Environmental Protection Agency (EPA) support efforts to remove barriers and promote greater awareness and adoption of CHP systems. Partly in response to this national effort, some states, including California, New York, New Jersey, Connecticut, and Texas, have removed regulatory barriers, adopted favorable emissions regulations, and provided financial incentives for CHP systems (Eldridge et al., 2007).
Survey data indicate that installed CHP capacity in the United States reached 85 GW at more than 3,300 sites as of 2006 (Shipley et al., 2008). CHP plants generated 506 TWh of electricity in 2006, almost 12 percent of all electricity produced nationwide. It is estimated that the use of CHP systems resulted in about 1.9 quads of primary-energy savings that year (Shipley et al., 2008). Given that over 85 percent of the CHP capacity in the country was installed after 1980, the panel attributes 1.62 quads of energy savings in 2006 to PURPA and other policy initiatives aimed at stimulating the adoption of CHP systems. (The effects of PURPA and other energy initiatives are summarized in Table 5.2.)
5.2.8
Consumer Education, Training, and Technical Assistance
Complementing the minimum efficiency standards discussed above, the ENERGY STAR® product-labeling program informs U.S. consumers of the most efficient products in the marketplace at any particular time. The ENERGY STAR® label exists for a wide range of products, including personal computers and other types of office equipment, kitchen and laundry appliances, air conditioners and furnaces, windows, commercial appliances, and lighting devices. Energy-efficient commercial buildings and new homes also can qualify for the ENERGY STAR® label. The ENERGY STAR® label helps consumers by reducing uncertainties about energy performance and lowering transaction costs for obtaining such information.
Figure 5.2 shows the growth in the market share (percentage of new sales) for various ENERGY STAR® appliances over the past decade. Market shares for clothes washers, dishwashers, and room air conditioners greatly increased during this time period. Revisions in the ENERGY STAR® qualification level temporarily reduced the ENERGY STAR® market share for refrigerators and room air conditioners from 2000 to 2001.
It is estimated that the ENERGY STAR® program in aggregate has resulted in about 175 TWh of electricity savings as of 2006 (EPA, 2007b). However, some of this savings is also counted by utility and state-based energy efficiency pro-
TABLE 5.2 Estimates of Annual Energy Savings from Major Energy Efficiency Policies and Programs
|
Policy or Program |
Electricity Savings (TWh/yr) |
Primary Energy Savings (Quads/yr) |
Year |
Source |
|
CAFE vehicle efficiency standards |
— |
4.80 |
2006 |
NRC, 2002a |
|
Appliance efficiency standards |
196 |
2.58 |
2006 |
Nadel et al., 2006b |
|
PURPA and other CHP initiatives |
— |
1.62 |
2006 |
Shipley et al., 2008c |
|
ENERGY STAR® labeling and promotion |
132 |
1.52 |
2006 |
EPA, 2007bd |
|
Building energy codes |
— |
1.08 |
2006 |
Nadel, 2004e |
|
Utility and state end-use efficiency programs |
90 |
1.06 |
2006 |
York and Kushler, 2006f |
|
DOE industrial efficiency programs |
— |
0.40 |
2005 |
DOE, 2007b |
|
Weatherization assistance program |
— |
0.14 |
2006 |
DOE, 2006g |
|
Federal energy management program |
— |
0.11 |
2005 |
FEMP, 2006h |
|
Total |
— |
13.32 |
— |
— |
|
aExtrapolation of fuel savings estimated by the NRC to 2006, and assuming 75 percent of the energy savings from vehicle efficiency improvements are due to the CAFE standards. bInterpolates between savings estimates by ACEEE for 2000 and 2010. cAssumes that 85 percent of the energy savings from all CHP systems installed in 2006 was due to PURPA and other policy initiatives. dAssumes only 75 percent of the energy savings estimated by U.S. EPA in order to avoid double counting savings with utility and state programs. eIncreases the energy savings estimate for new buildings constructed during 1990–1999 from Nadel (2004) by 100 percent to account for the impact of codes prior to 1990 and post-1999. fExtrapolates the 2004 national electricity savings estimate to 2006 based on national DSM budget estimates for 2005 and 2006. gAssumes 5.6 million weatherized households and average energy savings of 25 million Btu/yr per household, from Berry and Schweitzer (2003). hBased on the reported reduction in energy use per square foot of floor area during 1985–2005 and actual primary energy use in federal buildings as of 2005 (i.e., excluding energy use by transport vehicles and equipment). |
||||
grams. The ENERGY STAR® program has achieved the most energy savings in the areas of commercial building improvements and personal computers, monitors, and other types of office equipment. The ENERGY STAR® program continues to develop criteria and adopt labeling for additional products—for example, for television sets and water heaters. In some cases, the ENERGY STAR® program paves the way for minimum efficiency standards by bringing new energy efficiency measures into wide production and use.
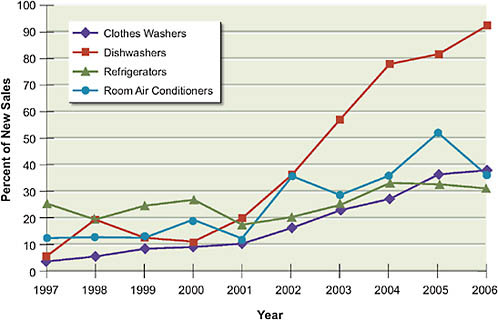
FIGURE 5.2 ENERGY STAR®appliance market shares (percent of new sales), 1997–2006.
Note: AC = air conditioner.
Source: Karney, 2006.
The DOE operates a number of education, training, and technical assistance programs for industries. These programs promote energy efficiency improvements in motors and in pumping and compressor systems. They also provide energy assessments for larger industrial plants and conduct energy audits for small- and medium-size manufacturers through university-based Industrial Assessment Centers. In combination, it is estimated that these programs have reduced industrial energy use by 1.75 quads cumulatively and 0.3 quad in 2005 alone (DOE, 2007b).
The DOE operates a program known as the Federal Energy Management Program (FEMP) to improve energy efficiency in federal facilities. Starting in 1991, executive orders instructed federal agencies to reduce their energy use per square foot of floor space. The FEMP provides technical assistance, training, and help with innovative approaches to project financing and implementation. Many federal agencies are using energy service companies and performance contracts to implement efficiency projects with support from the FEMP. In response to the rel-
evant executive orders and the FEMP, site energy use per square foot of floor area in federal buildings declined nearly 30 percent from 1985 to 2005. During this period, however, there was growing electrification in federal buildings, with the result that primary energy use per square foot of floor area declined by only 16 percent (FEMP, 2006).
The federal government also implements some significant information and education programs aimed at increasing energy efficiency in the transportation sector. These include the light-vehicle fuel economy information program (www.fueleconomy.gov) and the EPA’s SmartWay program for both passenger and freight vehicles (www.epa.gov/smartway/). In 2006, the EPA updated the test methods for measuring vehicle fuel economy as well as the label that appears on new vehicles. This was done to bring the estimates of miles per gallon on the label closer to actual fuel economy. The new label includes more prominently displayed fuel-cost information and a graphic comparing the fuel economy of various models in a particular vehicle category.
5.2.9
Overall Energy Savings
Table 5.2 provides estimates of the annual energy savings resulting from most of the policies and programs discussed above. In some cases (i.e., for CAFE standards and PURPA), the savings reflect a judgment of the relative importance of the policies and market forces. The total energy savings, 13.3 quads per year, was equivalent to more than 13 percent of national energy use in 2006—more than the energy supplied by nuclear power and hydroelectric power combined. It was also more than five times the increase in renewable energy supply in the United States between 1973 and 2006.
It should be noted, however, that these policies and programs provided only a moderate amount of the total energy savings associated with the 50 percent decline in national energy intensity during the 1973–2007 period (see Chapter 1). Increasing energy prices, ongoing technological change, and structural change also contributed to the steep decline in energy intensity in the past 35 years.
A comparison of the energy savings across the various policies and programs in Table 5.2 shows that regulatory initiatives such as the CAFE standards, appliance efficiency standards, and PURPA provided the largest amount of energy savings. It should be recognized that some energy efficiency policy initiatives, such as RD&D efforts in the buildings sector, are not included in Table 5.2 in order to avoid double counting of savings.
5.3
THE CALIFORNIA EXPERIENCE
Figure 5.3 illustrates electricity use per capita from 1960 to 2006 in California, New York, and the United States as a whole. California maintained nearly flat per capita electricity consumption from 1975 to 2006, and in 2006 its per capita use was about 40 percent less than that in the United States as a whole, although the two were nearly the same in the 1960s. The shaded wedge in Figure 5.3 depicts the growth in U.S. per capita electricity consumption (since 1973). The U.S. and California trend lines started to diverge in 1974 when the United States experienced its first energy crisis.
Many factors contributed to the difference between the California and U.S. trend lines. California began setting its building and appliance efficiency standards earlier, and its electricity prices increased more rapidly, than was the case in most of the United States. And, of course, compared with the entire United States, other factors such as a different mix of industries and differences in climate also contributed (Sudarshan and Sweeney, 2008).
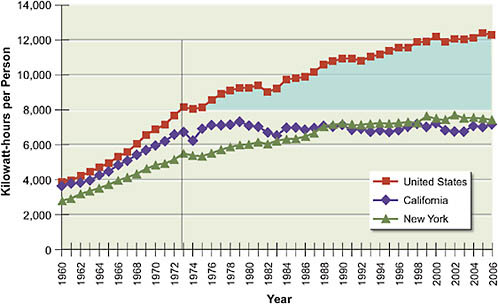
FIGURE 5.3 Per capita electricity consumption (not including on-site generation) in California, New York, and the United States, 1960–2006.
Source: U.S. Department of Energy, Energy Information Administration. State Energy Data System, State Energy Consumption, Price, and Expenditure Estimates, available at http://www.eia.doe.gov/emeu/states/_seds.html.
Table 5.3 compares 2005 per capita electricity consumption in California and the United States as a whole, broken out by major sectors (residential, commercial, and industrial) of the economy. The residential sector and the industrial sector each accounted for about 40 percent of the difference in consumption, and the commercial sector accounted for the remaining 20 percent. Sudarshan and Sweeney (2008) show that the types of industries in California are less electricity-intensive than those in the country as a whole, a factor that explains most of the difference in the industrial sector. Likewise, California has less commercial floor space per capita than does the United States as a whole, causing most of the difference in the commercial sector. These and other structural, price, and climatic effects can explain about 75 percent of the difference in electricity intensity between California and the country as a whole (Sudarshan and Sweeney, 2008).
In addition to the various policies (discussed below) that California has pursued to increase the efficiency of electricity consumption, the impact of price on consumption is certainly worth noting. Figure 5.4 illustrates on a state-by-state basis the connection between the average price of electricity and per capita consumption in 2006.
Although certainly not the whole story, consumption is clearly price elastic, and so the straight-line fit (with an R2 of 41 percent) has a negative slope of –811 kWh per capita per 1¢/kWh. Both New York and California have high-priced electricity and below-average per capita consumption, as indicated in Figure 5.4, and both have a relatively low percentage of total consumption associated with the industrial sector—New York just 11 percent and California only 19 percent, compared to the national average of 29 percent.
Regarding policies that influenced the trend shown in Figure 5.3, California first enacted efficiency standards for major types of appliances and for new residential and commercial buildings in the mid-1970s. The state has updated its
TABLE 5.3 Comparison of Per Capita Electricity Consumption in the United States and in California in 2005
|
|
United States (kWh/person) |
California (kWh/person) |
Difference (kWh/person) |
Difference (%) |
|
Residential |
4,586 |
2,369 |
2,216 |
42 |
|
Commercial |
4,302 |
3,253 |
1,048 |
20 |
|
Industrial |
3,438 |
1,391 |
2,048 |
39 |
|
Total |
12,326 |
7,013 |
5,312 |
100 |
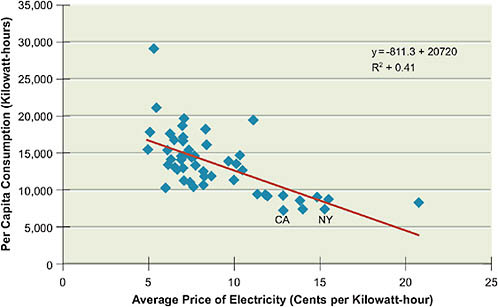
FIGURE 5.4 Average price of electricity and per capita consumption, 2006; 50-state data. Source: U.S. Department of Energy, Energy Information Administration, Electric Power Annual. Data Tables, 2006 State Data Tables (EIA-816). Population estimates from the U.S. Census Bureau, Annual Estimates of the Population for the U.S., Regions, States and Puerto Rico: April 1, 2000, to July 1, 2007 (NST-EST2007-01).
energy efficiency requirements for new buildings many times since then and has adopted minimum efficiency standards for additional appliances as well. After action by California and other states, the federal government also began to enact standards, at times even adopting those of California. Over the years, most of the appliance standards have migrated to national standards and therefore have resulted in efficiency gains in all states. The national energy savings are substantial, as noted previously.
In addition to appliance standards and energy codes for new buildings, California has implemented substantial state and utility energy efficiency programs. Figure 5.5 provides annual funding levels for investment in energy efficiency by California’s investor-owned utilities for the years 1976–2004, with forecasts for 2005–2012.8 Funding has varied considerably over time due to factors such as the
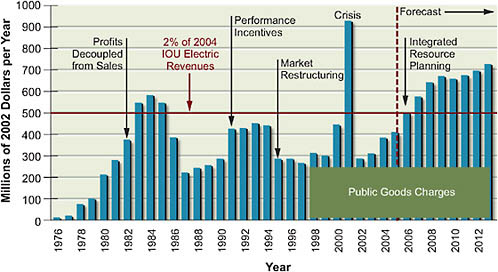
FIGURE 5.5 Funding (in constant 2002 dollars) for investor-owned utility energy efficiency programs in California, 1976–2004, and forecasted for 2005–2012. Also shown are key policies enacted by the state since the early 1980s. Public-good charges of 0.3¢/kWh sold were imposed beginning in 1998 to fund energy efficiency and other public-benefits activities.
Note: IRP = integrated resource planning; “crisis” refers to the temporary power shortages and severe electricity price spikes experienced in 2001.
Source: Rosenfeld and McAuliffe, 2008.
movement toward deregulation and restructuring during the 1990s, but energy efficiency funding has rebounded in recent years and is expected to continue to rise in the near future.
California enacted a number of policies to stimulate vigorous utility efficiency programs. The state has now placed energy efficiency as its most preferred resource and has committed to the aggressive funding of these efforts for the next few years, as Figure 5.5 illustrates. Figure 5.5 also highlights some of the following important policies that the state has adopted since the early 1980s:
-
1982: Decoupling of utility profits from sales in order to eliminate the negative incentives associated with reduced sales;
-
1991: Providing of performance incentives to utilities that met or exceeded efficiency savings, a policy that was then abandoned during California’s initial efforts at restructuring its electricity sector;
-
1998: Implementation of a mandatory charge of 0.3¢/kW sold in order to fund energy efficiency and other “public benefits” activities;
-
2001: Inclusion of efficiency as a part of integrated resource planning, and the direct comparison of energy savings to other options for meeting future load and load growth requirements, including other policy considerations;
-
2004: Establishment of energy efficiency goals of about 1 percent per year (about 2.3 TWh per year) through 2013; and
-
2007: Reinstatement of performance incentives. California established specific efficiency targets with a risk/reward incentive mechanism, as illustrated in Figure 5.6. Utilities are allowed a bonus, in addition to cost recovery, if they achieve at least 85 percent of their savings goals.
California updated its building efficiency standards and approved more than $500 million for additional energy efficiency programs in 2001. These actions were taken in order to help the state respond to temporary power shortages and severe electricity price spikes caused by flaws in the state’s utility restructuring policy. These emergency efforts were very successful. In total, compared to levels of the previous year, California reduced its electricity use by about 7 percent and peak demand by 10 percent in the summer of 2001 (CEC, 2002). These savings enabled the state to avoid further power shortages during the summer of 2001.
The combination of standards and programs has resulted in considerable electricity savings since the inception of these efforts. Figure 5.7 illustrates the cumulative effects of appliance standards, building energy codes, utility efficiency programs, and what is termed market transformation—that is, longer-term market impacts due to previous state and utility efficiency programs—in California from 1975 though 2003. In total, it is estimated that these initiatives saved about 40 TWh per year (1.13 MWh per capita) as of 2003, equivalent to about 15 percent of actual electricity use in the state that year.
California continues to promote and advance energy efficiency throughout all sectors of the economy. Energy efficiency, the top priority of the state’s Energy Action Plan, will be heavily relied on if the state is to meet its goal of reducing greenhouse gas emissions in 2020 to levels experienced in 1990 (CEC, 2008).
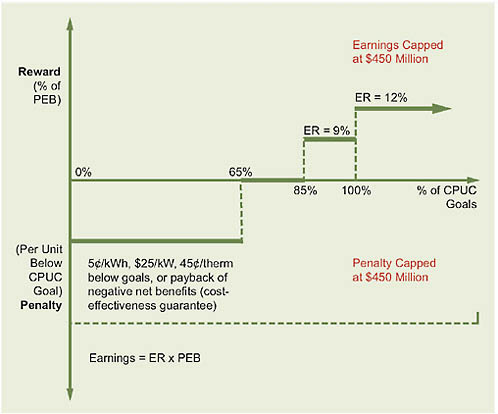
FIGURE 5.6 Utility energy efficiency incentive mechanism adopted by the California Public Utilities Commission (CPUC) in 2007. The CPUC established efficiency targets along with a risk/reward mechanism under which utilities are allowed both cost recovery and a bonus (or penalty) for exceeding (or falling short of ) the targets.
Note: PEB = performance earnings basis; ER = earnings rate(s), the percentage of PEB that will accrue to shareholders.
Source: CPUC, 2007.
5.4
THE NEW YORK EXPERIENCE
New York State has a long history of implementing policy actions to encourage more efficient use of energy across all sectors. Policy makers have recognized that cost-effective strategies to reduce energy use are critical for stimulating and maintaining economic growth. New York’s energy efficiency efforts include the system benefits charge (SBC) described below; the adoption and continual updating of energy building codes and appliance standards; executive orders directing state agencies and authorities to improve energy efficiency; and well-funded research and development programs.
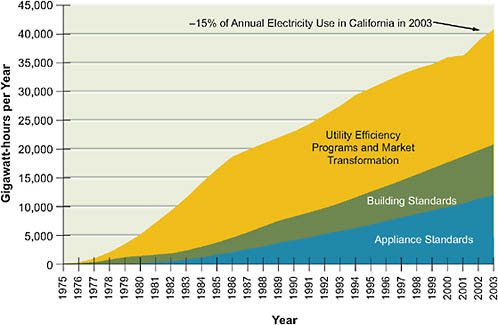
FIGURE 5.7 Annual electricity savings from key energy efficiency policies and programs implemented in California, 1975–2003.
Source: CEC, 2007.
Although the past three decades have been characterized by increases in population, greater demands for energy-using technologies, and increasing lifestyle expectations, New York State has maintained a relatively flat level of total energy use per capita (about 36 percent lower than the national average in 2005). New York is currently the second-least energy-intensive state in the continental United States on a per capita basis (after Rhode Island). Its relatively low energy use per capita is due in part to its highly energy-efficient urban transportation, which includes subways, commuter rail, buses, and ferries, as well as to structural changes such as the shift away from a heavy industrial base and toward a service and information economy.
New York’s electricity use per capita relative to that of the United States (see Figure 5.3) is an indicator of the overall success of the state’s continuing efforts to promote the efficient use of electricity. Between 1960 and 2006, the difference between New York and the United States in annual electricity use per capita widened from about 1100 kWh to about 4900 kWh. In 2006 the residential sector accounted for 41 percent of the difference, the industrial sector for 53 per-
cent, and the commercial and transportation sectors for the remaining 6 percent (Table 5.4).
New York’s energy efficiency efforts began in the late 1970s with federal funding for a State Energy Conservation Program (SECP). The funding was small relative to the need, but the efforts initiated through the New York State Energy Office (NYSEO) represented an important beginning in achieving greater energy efficiency and conservation savings and provided experience for government programs working in concert with the private sector. Over the years, the NYSEO was able to develop a diverse portfolio of programs serving the residential, business, and government sectors. These programs took another step forward in the 1980s as a result of receiving significant funding from a legal settlement against Exxon and other oil companies for charging excessive prices for their crude oil in the late 1970s. By 1989, New York State had received more than $335 million, including interest, from this funding source.
New York’s energy efficiency efforts directed at the electric utility sector began in earnest in 1984, driven largely by concerns about the construction delays and escalating costs that were plaguing the Shoreham and Nine Mile Point 2 nuclear power plants and the Somerset coal plant. At the time, DSM programs were viewed by New York’s Public Service Commission (PSC) as potential alternatives to continued investment in new, central-station power-generation projects. As a result, investor-owned utilities were required by the PSC to develop pilot-scale DSM programs that included energy efficiency and load management. The programs were initially funded at approximately $25 million annually, representing approximately one-quarter of 1 percent of gross annual utility revenue.
Following an assessment of the pilot programs in 1987, the PSC concluded
TABLE 5.4 Comparison of Per Capita Electricity Use in the United States and in New York in 2006
|
|
United States (kWh/person) |
New York (kWh/person) |
Difference (kWh/person) |
Difference (%) |
|
Residential |
4,514 |
2,508 |
2,006 |
41 |
|
Commercial |
4,341 |
3,938 |
403 |
8 |
|
Industrial |
3,378 |
776 |
2,602 |
53 |
|
Transportation |
25 |
145 |
−121 |
−2 |
|
Total |
12,258 |
7,367 |
4,890 |
100 |
that DSM programs were a viable and economic alternative to new energy supply resources and that DSM should be considered on an equal footing with supply resources in integrated resource planning. At a minimum, it was recognized that DSM could delay the need for peaking capacity, even if the need for new baseload power supplies could not be completely eliminated. The job creation and environmental benefits associated with reducing electricity use were also identified and quantified as further justification for investment in DSM. Utilities were directed by the PSC to assess DSM potential, identify cost-effective programs, establish DSM goals, and develop long-range DSM plans, including incentive, information, and education programs.
In the early 1990s, the PSC implemented a revenue decoupling mechanism to allow utilities to recover revenues lost from energy efficiency reductions (determined by the amount by which actual sales revenue fell below the forecast adopted in the most recent rate case). Along with the revenue decoupling mechanism, the PSC approved financial incentives for achieving energy efficiency goals, as well as financial penalties for falling short of goals. The incentive scheme proved to be effective and was successfully adapted to each investor-owned utility (DeCotis, 1989).
By 1993, DSM spending by investor-owned utilities in New York State reached $280 million (equivalent to about $400 million in 2007 dollars; Figure 5.8), a dramatic increase from the initial $25 million spent in 1984. Additional DSM spending by the state’s energy authorities raised the state’s annual investment in energy efficiency resources in 1993 to about $330 million (about $470 million in 2007 dollars).
New York began the process of restructuring its electricity industry in 1996. A key element of this effort was that investor-owned utilities were required to sell generation assets to independent power producers. As a result, New York’s investor-owned utilities were transformed into transmission and distribution companies. With the transition to wholesale market competition, the responsibilities for administering DSM programs were transferred to the New York State Energy Research and Development Authority (NYSERDA). The utilities’ current role, following the divestiture of their generation assets, is to collect program funds from ratepayers through a system benefits charge. The funds are provided to NYSERDA, under the oversight of the PSC, to administer energy efficiency, load management, environmental protection, and research and development programs. NYSERDA has been administering statewide SBC programs in cooperation with the New York Power Authority and the Long Island Power Authority since 1998.
By 2007, annual investment in energy efficiency by New York’s energy-related authorities increased to nearly $300 million (see Figure 5.8). Accounting for the cumulative annual impact of programs implemented since 1990, New York has lowered its annual electricity use by nearly 12 TWh, or about 8 percent of end-use sales (Figure 5.9). This 12 TWh of demand-side resources has reduced New York’s CO2 emissions by about 6.5 million tons per year, equivalent to removing about 1.3 million cars from the roads annually. All SBC energy efficiency programs (administered by NYSERDA) are required by the PSC to be cost-effective, which means that the present value of estimated lifetime monetary benefits exceeds the costs of implementing the programs. Through year’s end in 2007, the benefit-cost ratio, counting only direct utility system benefits for New York’s portfolio of SBC-funded energy efficiency programs, is 6.2 (on a present-value basis). Including nonenergy benefits, such as improved comfort, safety, and productivity, the benefit-cost ratio increases to 9.9, and adding macroeconomic
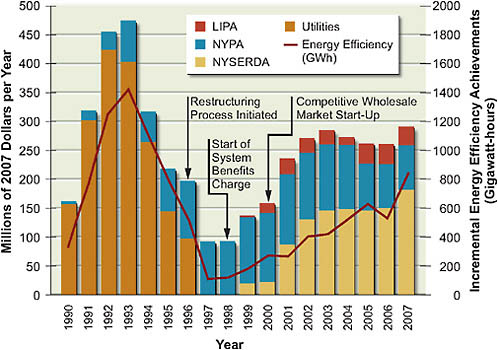
FIGURE 5.8 New York State’s annual energy efficiency expenditures (in constant 2007 dollars) and achievements, 1990–2007.
Note: EE = energy efficiency; GWh = gigawatt-hours; LIPA = Long Island Power Authority; NYPA = New York Power Authority; NYSERDA = New York State Energy Research and Development Authority.
Source: Courtesy of NYSERDA.
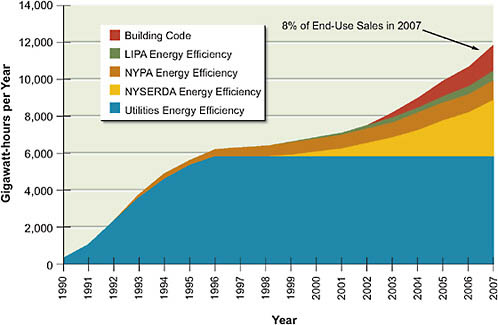
FIGURE 5.9 New York State’s energy efficiency achievements, 1990 through 2007: annual electricity use.
Note: EE = energy efficiency; LIPA = Long Island Power Authority; NYPA = New York Power Authority; NYSERDA = New York State Energy Research and Development Authority.
Source: Courtesy of NYSERDA.
benefits (e.g., valuing added employment) increases the ratio to 13.2 (NYSERDA, 2008).
In April 2007, then-New York Governor Eliot Spitzer initiated an energy efficiency program of unparalleled proportions, known as the “15 by 15” program, by calling for a 15 percent reduction in electricity use in 2015 compared to the business-as-usual projected level of electricity use for that year (Spitzer, 2007).
5.5
LESSONS LEARNED
What lessons can be drawn from the wide-ranging experience encapsulated in this chapter regarding policies and programs aimed at increasing energy efficiency at
both the national and the state level? Most importantly, the experience demonstrates that well-designed policies can result in substantial energy savings. This is clear from the fact that the policies taken together reduced national energy use in 2006 by more than 13 percent according to the estimates in Table 5.2. Also, leading states such as California and New York have been able to increase energy efficiency more than other states have, resulting in greater benefits for citizens, businesses, and the environment.
The experience shows that minimum efficiency standards can be a very effective strategy for stimulating energy efficiency improvements on a large scale, especially if standards are updated periodically. Minimum efficiency standards have been a key part of both federal and state energy efficiency efforts. Such standards should be technically and economically feasible and should provide manufacturers with enough lead time to phase out the production of nonqualifying products in an orderly manner.
Government-funded RD&D contributed to the development and commercialization of a number of important energy efficiency technologies. Experience has demonstrated that RD&D can take many years to pay off, and that attention should be devoted to commercialization and market development as well as to technological advancement. Also, a prudent RD&D portfolio includes high-risk, potentially high-payoff projects as well as those involving lower-risk, incremental improvements (NRC, 2001).
Although there is evidence that energy prices influence energy efficiency and levels of energy consumption, as illustrated in Figure 5.4, neither the federal government nor states have used energy taxes to any significant degree as a strategy for stimulating greater energy efficiency.
Financial incentives, including those provided by utilities, can increase the adoption of energy efficiency measures. Financial incentives should be carefully designed, however, avoiding costly efforts that have little or no incremental impact on the marketplace. One way to avoid this outcome is to provide incentives for newly commercialized technologies—in particular those with a high first cost but with good prospects for cost reduction as demand grows, production expands, and learning occurs.
Information dissemination, education, and training can increase the awareness of energy efficiency measures and improve know-how with respect to energy management. The ENERGY STAR® labeling program exemplifies the impact that a well-conceived, widely promoted labeling and education effort can have. Educa-
tion and training are also important for the successful implementation of building energy codes.
In general, energy efficiency policies and programs work best if they are integrated into market transformation strategies, addressing the range of barriers that are present in a particular situation (Geller and Nadel, 1994). In the appliance market, for example, all of the following are being carried out simultaneously: government-funded RD&D helps to develop and commercialize new technologies; product labeling educates consumers; efficiency standards eliminate inefficient products from the marketplace; and incentives offered by some utilities and states encourage consumers to purchase products that are significantly more efficient than the minimum standards. This combination of actions has led to dramatic improvements in the efficiency of refrigerators and other types of appliances, and the efficiency gains and energy savings are continuing today.
The experience described above suggests that energy efficiency policies should be kept in place for a decade or more in order to ensure an orderly development of energy efficiency markets. At the same time, policies such as efficiency standards and targets, product labeling, and financial incentives should be revised periodically. This will increase their effectiveness and reduce program costs, for example, by phasing out incentives as particular technologies become well established in the marketplace. Dynamic policies steadily improved residential appliance efficiency, whereas stagnant policies failed to maintain car and light-truck efficiency improvements during the 1990s and the early part of this decade.
5.6
CHANGING CONSUMER BEHAVIOR
The energy efficiency policies and programs discussed in this chapter focus primarily on increasing the energy efficiency of buildings, appliances, vehicles, and industrial operations. Less attention has been devoted to changing consumer behavior—for example, encouraging people to drive less or buy fewer and/or smaller vehicles, appliances, or homes. Consumer behavior can be influenced in a number of ways (PIEE, 2007), including the following:
-
Offering convenient alternatives such as practical and high-quality mass transit services;
-
Using financial incentives such as taxing energy, taxing carbon dioxide and other pollutant emissions, or taxing inefficient devices more heavily;
-
Increasing awareness, for example by educating people about the environmental consequences of their lifestyle choices; and
-
Providing feedback on energy consumption—for example, by including easy-to-understand comparative information on energy use on monthly utility bills.
It remains to be seen if changing behavior can play a larger role in energy efficiency efforts in the coming decades.
5.7
REFERENCES
ACEEE (American Council for an Energy-Efficient Economy). 2007. Energy Bill Savings Estimates as Passed by the Senate. Washington, D.C.: ACEEE. Available at http://www.aceee.org/energy/national/EnergyBillSavings12-14.pdf.
Alic, J.A., D.C. Mowery, and E.S. Rubin. 2003. U.S. Technology and Innovation Policies: Lessons for Climate Change. Arlington, Va.: Pew Center on Global Climate Change.
Berry and Schweitzer, 2003. Metaevaluation of National Weatherization Assistance Program Based on State Studies, 1993-2002. ORNL/CON-488. Oak Ridge, Tenn.: Oak Ridge National Laboratory.
CEC (California Energy Commission). 2002. The Summer 2001 Conservation Report. Sacramento, Calif.: CEC.
CEC. 2007. Table 42, California Energy Demand 2008-2018: Staff Revised Forecast, Final Staff Forecast, 2nd ed., CEC-200-2007-015-SF2. Sacramento, Calif.: CEC. November 27.
CEC. 2008. 2008 Energy Action Plan Update. CEC-100-2008-001. Sacramento, Calif.: CEC; San Francisco, Calif.: California Public Utilities Commission. Available at http://www.fypower.org/pdf/cpuc_eap_update.pdf.
CEE (Consortium for Energy Efficiency). 2007. U.S. Energy-Efficiency Programs—A $2.6 Billion Industry. Boston, Mass.: CEE.
Clinton, J., H. Geller, and E. Hirst. 1986. Review of government and utility energy conservation programs. Annual Review of Energy 11:95-142.
CPUC (California Public Utilities Commission). 2007. CPUC Decision 07-09-043, September 20, 2007. Interim Opinion on Phase 1 Issues: Shareholder Risk/Reward Mechanism for Energy Efficiency Programs. Document COM/DGX, ALJ/MEG/rbg, issued September 25, 2007. Available at http://docs.cpuc.ca.gov/published/final_decision/73172.htm.
DeCotis, P.A. 1989. Balancing shareholder and customer interests in incentive ratemaking. Electricity Journal 2(10):16-23.
Difiglio, C., K.G. Duleep, and D. Greene. 1990. Cost effectiveness of future fuel economy improvements. Energy Journal 11(1):65-68.
DOE (U.S. Department of Energy). 2006. Weatherization Works! Fact Sheet. Washington, D.C.: DOE Office of Energy Efficiency and Renewable Energy, Weatherization Assistance Program.
DOE. 2007a. Energy Department Determines That Model Commercial Building Code Will Save Energy and Benefit Consumers. Washington, D.C.: DOE Office of Energy Efficiency and Renewable Energy, Industrial Technologies Program. Available at http://www.energycodes.gov/implement/determinations_com_news.stm.
DOE. 2007b. Impacts. Industrial Technologies Program: Summary of Program Results for CY 2005. Washington, D.C.: DOE Office of Energy Efficiency and Renewable Energy, Industrial Technologies Program.
DOE. 2008. Status of Energy Codes. Washington, D.C.: DOE. Available at http://www.energycodes.gov/implement/state_codes/index.stm.
EIA (Energy Information Administration). 2007. Annual Energy Review 2006. DOE/EIA-0384(2006). Washington, D.C.: Department of Energy, Energy Information Administration.
EIA. 2008. Annual Energy Outlook 2008. DOE/EIA-0383(2008). Washington, D.C.: Department of Energy, Energy Information Administration.
Eldridge, M., B. Prindle, D. York, and S. Nadel. 2007. The State Energy Efficiency Scorecard for 2006. Washington, D.C.: American Council for an Energy-Efficient Economy.
Elliott, R.N., and M. Spurr. 1999. Combined Heat and Power: Capturing Wasted Energy. Washington, D.C.: American Council for an Energy-Efficient Economy.
EPA (Environmental Protection Agency). 2007a. Light-Duty Automotive Technology and Fuel Economy Trends: 1975 Through 2007. EPA420-R-07-008. Washington, D.C.: EPA Office of Transportation and Air Quality.
EPA. 2007b. Energy Star® and Other Climate Protection Partnership Programs: 2006 Annual Report. Washington, D.C.: EPA Office of Air and Radiation.
FEMP (Federal Energy Management Program). 2006. Annual Report to Congress on Federal Government Energy Management and Conservation Programs: Fiscal Year 2005. Washington, D.C.: DOE Federal Energy Management Program.
Geller, H. 2003. Energy Revolution: Policies for a Sustainable Future. Washington, D.C.: Island Press.
Geller, H., and S. McGaraghan. 1998. Successful government-industry partnership: The U.S. Department of Energy’s role in advancing energy-efficient technologies. Energy Policy 26:167-177.
Geller, H., and S. Nadel. 1994. Market transformation strategies to promote end-use efficiency. Annual Review of Energy and the Environment 19:301-346.
Gerard, D., and L.B. Lave. 2003. The Economics of CAFE Revisited: A Response to CAFE Critics and a Case for Fuel Economy Standards. Washington, D.C.: AEI-Brookings Joint Center for Regulatory Studies.
Goldstein, D.B. 2007. Saving Energy, Growing Jobs: How Environmental Protection Promotes Economic Growth, Profitability, Innovation, and Competition. Point Richmond, Calif.: Bay Tree Publishing.
Greene, D.L. 1998. Why CAFE worked. Energy Policy 26:595-614.
Greene, D., and J. DeCicco. 2000. Engineering-economic analyses of automotive fuel economy potential in the United States. Annual Review of Energy and Environment 25:477-535.
Halverson, M., J. Johnson, D. Weitz, R. Majette, and M. LaLiberte. 2002. Making residential energy codes more effective: Building science, beyond code programs, and effective implementation strategies. Pp. 2.111-2.122 in Proceedings of the 2002 ACEEE Summer Study on Energy Efficiency in Buildings. Washington, D.C.: American Council for an Energy-Efficient Economy.
Karney, R. 2006. ENERGY STAR® appliance market update. Presentation at 2006 ENERGY STAR® Appliance Partner Meeting, September 26-28, Newport, Rhode Island. Available at http://www.energystar.gov/index.cfm?c=partners.pt_meetings_archive.
Khawaja, M.S., A. Lee, and M. Levy. 2007. Statewide Codes and Standards Market Adoption and Noncompliance Rates. Report prepared for Southern California Edison. Portland, Oreg.: Quantec, LLC. May 10.
Kinney, L., H. Geller, and M. Ruzzin. 2003. Increasing Energy Efficiency in New Buildings in the Southwest: Energy Codes and Best Practices. Boulder, Colo.: Southwest Energy Efficiency Project. August.
Kushler, M., D. York, and P. Witte. 2006. Aligning Utility Interests with Energy Efficiency Objectives: A Review of Recent Efforts at Decoupling and Performance Incentives. Washington, D.C.: American Council for an Energy-Efficient Economy. October.
Nadel, S. 2002. Appliance and equipment efficiency standards. Annual Review of Energy and the Environment 27:159-192.
Nadel, S. 2004. Supplementary Information on Energy Efficiency for the National Commission on Energy Policy. Washington, D.C.: American Council for an Energy-Efficient Economy.
Nadel, S. 2007. Energy Efficiency Resource Standards Around the U.S. and World. Washington, D.C.: American Council for an Energy-Efficient Economy. September.
Nadel, S., and H. Geller. 1996. Utility DSM: What have we learned? Where are we going? Energy Policy 24:289-302.
Nadel, S., J. Thorne, H. Sachs, B. Prindle, and R.N. Elliott. 2003. Market Transformation: Substantial Progress from a Decade of Work. Washington, D.C.: American Council for an Energy-Efficient Economy. April.
Nadel, S., A. de Laski, M. Eldridge, and J. Kleisch. 2006. Leading the Way: Continued Opportunities for New State Appliance and Equipment Standards. Report ASAP-6/ACEEE-A062. (Updated from and supersedes report ACEEE-051.) Washington, D.C.: American Council for an Energy-Efficient Economy; Boston, Mass.: Appliance Standards Awareness Project. March.
NAPEE (National Action Plan for Energy Efficiency). 2006. National Action Plan for Energy Efficiency. Washington, D.C.: Department of Energy and Environmental Protection Agency. July.
NAS-NAE-NRC (National Academy of Sciences-National Academy of Engineering-National Research Council). 2009. America’s Energy Future: Technology and Transformation. Washington, D.C.: The National Academies Press.
NRC (National Research Council). 2001. Energy Research at DOE: Was It Worth It? Energy Efficiency and Fossil Energy Research 1978 to 2000. Washington, D.C.: National Academy Press.
NRC. 2002. Effectiveness and Impact of Corporate Average Fuel Economy (CAFE) Standards. Washington, D.C.: National Academy Press.
NRC. 2008. Review of the Research Program of the FreedomCar and Fuel Partnership: Second Report. Washington, D.C.: The National Academies Press.
NYSERDA (New York State Energy Research and Development Authority). 2008. New York Energy $martSM Program, Evaluation and Status Report, Year Ending December 31, 2007. Final Report. Albany, N.Y.: NYSERDA. March.
OTA (Office of Technology Assessment). 1992. Building Energy Efficiency. Washington, D.C.: OTA.
PIEE (Precourt Institute on Energy Efficiency). 2007. Presentations from the 2007 Behavior, Energy, and Climate Change Conference, Sacramento, Calif., November 7-9. Available at http://piee.stanford.edu/cgi-bin/htm/Behavior/2007_becc_conference.php.
Rosenfeld, Arthur H., and Patrick McAuliffe. 2008. Opportunities in the Building Sector: Managing Climate Change. Staff paper CEC-999-2008-016. California Energy Commission. June. Available at http://www.energy.ca.gov/2008publications/cec-9992008-016/cec-999-2008-016.pdf.
Shipley, A., A. Hampson, B. Hedman, P. Garland, and P. Bautista. 2008. Combined Heat and Power: Effective Energy Solutions for a Sustainable Future. ORNL/TM-2008/224. Oak Ridge, Tenn.: Oak Ridge National Laboratory.
Small, K., and K. Van Dender. 2007. Fuel efficiency and motor vehicle travel: The declining rebound effect. Energy Journal 28:25-51.
Spitzer, E. 2007. “15 by 15”—A Clean Energy Strategy for New York. Speech by Governor Eliott Spitzer, April 19. Available at http://www.ny.gov/governor/keydocs/CleanEnergySpeech-final.pdf.
Stone, N., D. Mahone, P. Eilert, and G. Fernstrom. 2002. What’s a utility codes and standards program worth, anyway? Pp. 9.341-9.351 in Proceedings of the 2002 ACEEE Summer Study on Energy Efficiency in Buildings. Washington, D.C.: American Council for an Energy-Efficient Economy.
Sudarshan, A., and J. Sweeney. 2008. Deconstructing the “Rosenfeld Curve.” Working Paper. Draft. Palo Alto, Calif.: Stanford University. June 1. Available at http://peec.stanford.edu/modeling/research/Deconstructing_the_Rosenfeld_Curve.php.
Tonn, B., and J.H. Peretz. 2007. State-level benefits of energy efficiency. Energy Policy 35:3665-3674.
WGA (Western Governors’ Association). 2006. Energy Efficiency Task Force Report. Denver, Colo.: WGA. Available at http://www.westgov.org/wga/initiatives/cdeac/Energy%20Efficiency-full.pdf.
York, D., and M. Kushler. 2006. A nationwide assessment of utility sector energy efficiency spending, savings, and integration with utility system resource acquisition. In Proceedings of the 2006 ACEEE Summer Study on Energy Efficiency in Buildings. Panel 8, Number 24. Washington, D.C.: American Council for an Energy-Efficient Economy.


