
5
Potential Effects of More Compact Development Patterns on Vehicle Miles Traveled, Energy Use, and CO2Emissions
In this chapter, estimates are developed of the potential magnitude of reductions in vehicle miles traveled (VMT), energy use, and carbon dioxide (CO2) emissions from more compact, mixed-use development, looking for ward to 2030 and to 2050. The chapter begins with a brief summary of two previous well-known estimates of the national-level impacts of more compact development. Then, the committee’s own development scenarios are elaborated, and results are summarized. The primary focus is on likely changes in travel behavior and related effects on VMT, energy use, and CO2 emissions. In addition, more compact development is likely to reduce energy use and CO2 emissions by improving the energy efficiency of buildings, a topic that is also briefly considered. The third section provides a more general discussion of other benefits and costs of more compact, mixed-use development patterns; no attempt is made to quantify these benefits and costs, which was beyond the scope of this study. The chapter ends with a series of findings.
PREVIOUS NATIONAL-LEVEL ESTIMATES OF REDUCTIONS IN TRAVEL, ENERGY USE, AND CO2EMISSIONS
Analysis Structure and Key Assumptions
Any estimate of the effect of compact, mixed-use development on future VMT, energy use, and CO2 emissions requires three sets of assumptions. The first concerns the quantity and characteristics of the new housing
and commercial developments that will be built between now and the end of the forecast period. How many new housing units are likely to be built, and how many of those new units will be in compact, mixed-use developments? The demographic, economic, and political factors that affect the quantity and character of new development were the subject of Chapter 4 of this report.
The second set of assumptions concerns the number of vehicle miles driven by households in different types of developments. Will the number of vehicle miles driven by the average household in existing types of developments continue to increase as it has in the past, or will it slow down or stop? And how many fewer vehicle miles will households in the new compact, mixed-use developments travel? The empirical evidence on the reduction in VMT attributable to compact, mixed-use development was summarized in Chapter 3 of this report. The committee did not account for any behavioral feedback effects, but the sensitivity of key assumptions is tested.
If estimates of reductions in VMT are to be translated into savings in energy use and CO2 emissions, one must make a further set of assumptions about the fuels and fuel economy of future vehicles. Will cars continue to be powered by internal combustion engines or hybrids running on fossil fuels, or will all-electric, hydrogen, or other more novel forms of propulsion emerge to play a significant role? And whatever fuels are used, what will be their carbon content and CO2 emissions per VMT? The savings in energy and CO2 emissions from the use of vehicles that do not use fossil fuels will depend in part on the energy source. For example, the electricity to run an electric vehicle may be generated by a CO2-emitting, coal-fired electric plant. Ideally, the full life-cycle costs of alternative energy sources should be considered in computing energy and emissions savings.
Previous National Estimates
Two previous studies attempt to estimate the reduction in VMT that might result from more compact development. In Costs of Sprawl—2000,
Burchell et al. (2002) produce comprehensive estimates of the various costs of sprawl in 2025 by developing scenarios of controlled growth and uncontrolled growth (business-as-usual sprawl) and then comparing the differences. One component of the cost of sprawl estimated in this study involves the extra travel costs associated with increased travel in spread-out areas, which are based on VMT estimates for the above two scenarios.
The changes in land development in the study’s controlled-growth scenario are complex, which makes it difficult to compare this study with others. Controlled growth cuts sprawl in all nonurban counties by 25 percent compared with their historic trends. For intracounty sprawl, growth is directed toward more urbanized development within the county by increasing the density of this development by 20 percent. Shifting growth by 2025 from sprawling to controlled-growth counties moves 11 percent of new housing (2.6 million households) and 6 percent of jobs (3.1 million jobs).
To estimate travel effects, Burchell et al. estimate a regression model that predicts personal miles of travel as a function of development type (urban, suburban, exurban, rural), income, gender, and household size. Separate models are developed for personally owned vehicles and transit. The models are calibrated by using individual data from the 1995 Nationwide Personal Transportation Survey, but the variables describing the built environment of households are limited, and there is no control for self-selection. (Perhaps as a result, these models explain a small share of the overall variance in the data: the models have an adjusted R2 of about 0.06.) The models predict that shifting residences and jobs from the sprawl to the controlled-growth scenario would reduce person miles of travel by about 4 percent overall. The 4 percent reduction results from combining a 5 percent reduction in travel in personally owned vehicles with a 19 percent increase in travel by transit by 2025.
In a more recent study entitled Growing Cooler, Ewing et al. (2007) develop an estimate of the amount of CO2 that could be reduced by encouraging much greater compact development between 2005 and
2050. They estimate that 89 million additional dwelling units and 190 billion additional square feet of nonresidential space will be built between 2005 and 2050, or about a 70 percent increase over the existing residential stock. They then assume that between 60 and 90 percent of all new development will be compact.
The authors further estimate that VMT per capita will be 30 percent less in compact than in conventional developments [primarily on the basis of the earlier Ewing and Cervero (2001) meta-analysis].1 They also project that VMT within urban areas will account for four-fifths of total VMT by 2050, noting that compact development will affect urban (not rural) VMT and that the United States will become more urbanized by 2050. Finally, the authors estimate that the CO2 emissions savings will be about 90 percent as large as the VMT reduction, attributing the difference to CO2 penalties associated with lower vehicle operating speeds in more compact areas, among other reasons. By multiplying out these factors, the authors arrive at an overall reduction of 7 to 10 percent in future U.S. transportation-related CO2 emissions resulting from more compact development.
Comparing the estimates of the above two studies would require limiting the Ewing et al. estimates to the VMT reduction resulting from compact development and ignoring the CO2 reduction factors described above. Doing so results in an estimated VMT reduction of 12.7 percent by 2050 from Ewing et al. compared with a 4 percent reduction in personal travel in private vehicles by 2025 from Burchell et al. The estimates were derived with totally different methods and apply to different time periods. That said, they appear to be in the same ballpark. If Burchell et al.’s estimates were extended another 25 years, they would presumably be of similar magnitude in 2050 to those of Ewing et al.
COMMITTEE’S SCENARIOS AND RESULTS
Assumptions and Scenarios
This committee developed its own estimates of the potential savings in VMT, energy use, and CO2 emissions from more compact, mixed-use development, drawing on its review of the literature and the papers commissioned for this study. The committee’s estimates are focused on residential development patterns only.2 Two scenarios were developed relative to a base case. The base case assumes that current land use and travel patterns, which are heavily weighted toward suburban development and automobile-dependent travel, will continue into the future, producing a further decline in the overall average density of metropolitan areas, while the two alternative scenarios assume more compact, mixed-use development patterns.
Two forecasting periods are analyzed: the first to 2030 and the second to 2050. The starting point selected was 2000 because firm data exist on the number of households (from the U.S. census) and their travel patterns [VMT per household from the 2001 National Household Travel Survey (NHTS)] (Hu and Reuscher 2004). Uncertainties grow over time. For example, the 2050 estimates are less certain than the 2030 estimates because of uncertainties as to the numbers of house holds,3 their demographic and socioeconomic composition, and technological innovations that could change the nature of travel (e.g., extent of
hybrid vehicles, introduction of new technologies such as fuel cells, use of alternative fuels with sharply reduced carbon content). Nevertheless, the longer time frame is shown to demonstrate that new development patterns (i.e., more compact, mixed-use development) can make a difference, and even the very small percentage changes by 2030 compound to more significant ones by 2050. At the same time, significant changes require decades to unfold because of the durability of the built environment.
The base case and the two scenarios all assume the same growth in the number of housing units during the forecast periods but differ as to the proportion of new and replacement units that will be built in compact, mixed-use developments. The increase in total housing units is based on the projections provided by Pitkin and Myers (2008) in the paper commissioned for this study and is reported as a range, with a broader spread in 2050 than 2030 because of the greater uncertainties.4 The base case assumes that all new (and replacement) housing will be built at the average density of new development during the 1990s, which was about 30 percent below average density levels at the end of the decade.5 The two alternative scenarios channel some fraction of the new growth from new household formation and from replacement of existing housing units into more compact development.6 Scenario 1,
|
4 |
The growth in new households closely follows Nelson’s projections to 2030 (Nelson 2004; Nelson 2006) and extends them to 2050 (see Tables 4-3 and 4-4 in Chapter 4). Estimates of average annual replacement units are considerably lower than those of Nelson (2004) for the reasons noted in Chapter 4, with the result that 2030 total estimates of all new units with potential for more compact development are more conservative than Nelson’s. Nelson also believes that all new and replacement housing units will be more compactly developed (e.g., as attached or small-lot units) (see the discussion in Chapter 4). |
|
5 |
See Appendix C for a more complete discussion of density trends in metropolitan areas. Table C-1 summarizes three ways in which the density of new and existing development can be computed from the two primary data sources—the National Resources Inventory and the U.S. Census of Population and Housing. The average of the three estimates of the density of new development is used here (i.e., new development is about 70 percent as dense as the average density at the end of the 1990s). |
|
6 |
Where replacement units are involved, either the new unit could be built more compactly than the one it replaces (e.g., a single unit could be split into two) if zoning permits, or the homeowner could sell the replacement unit and move to a unit in a more compactly developed area. |
the low-end estimate, assumes that only one-quarter of the new growth will be more compactly developed (i.e., density will be doubled from the baseline assumption of a continued decrease in density), similar to the shares assumed in Costs of Sprawl—2000.7 Scenario 2, the high-end estimate, assumes that three-quarters of the new growth will be more compactly developed, roughly the midpoint of the estimate in Growing Cooler.
All three scenarios assume that the driving patterns of those who live in existing housing will remain unchanged at 21,187 miles per household per year, the figure reported in the 2001 NHTS (Hu and Reuscher 2004). Between the 1990 Nationwide Personal Transportation Survey and the more recent 2001 NHTS, VMT per household rose by about 1.4 percent per year, but it appears reasonable to expect the growth to slow or stop given the aging of the population, the saturation of vehicle ownership (ownership levels nearing, on average, one vehicle for one licensed driver), and smaller household sizes.8 The sensitivity of the results to this assumption is tested later.
Those living in new housing in more compact developments— with higher densities, more walkable neighborhoods, and good transit access—are assumed to drive less. Scenario 1 assumes a 12 percent reduction in household VMT for new housing built at double the average density of existing housing. Scenario 2 assumes a 25 percent reduction, which brackets the reductions at a regional scale found in the literature (see Table 3-1 in Chapter 3).9 A third scenario was considered,
|
7 |
The share assumptions are similar, but the methods for computing the effects are very different. Burchell et al. (2002) use a regression modeling approach to estimate travel effects. |
|
8 |
The 1990 Nationwide Personal Transportation Survey reported annual VMT of 18,161 per household, implying an average annual growth rate of 1.41 percent between the 1990 and 2001 survey years (Hu and Reuscher 2004). |
|
9 |
The 12 percent reduction comes from the Brownstone and Golob (2009) study, which calculates the reduction in VMT from a doubling of density. The larger “best case” 25 percent reduction comes from the Bento et al. (2005) study, which calculates the reduction in VMT from changes in population centrality, jobs–housing balance, supply of transit, and other built environment and transportation variables. See the discussion of both studies in Chapter 3. |
which assumes only a 5 percent reduction in VMT for households living in more compact developments, the lower bound of the elasticity estimates in the literature (see Table 3-1).
Those living in new housing built at lower-than-average densities, continuing the recent trend, are assumed to drive more than existing households. The assumption is that the majority of this housing will be built at the urban fringe, with little access to transit and longer trip distances on average.10
The energy use estimates in the committee’s scenarios use data from a recent National Research Council (NRC) study (NRC 2008), which develops several scenarios to estimate the maximum practicable penetration rate for fuel cell vehicles and alternative technologies to reduce U.S. oil use and CO2 emissions to 2050. The committee uses the reference case from that NRC study.11 This scenario assumes improvements in gasoline internal combustion engine technology to meet the new corporate average fuel economy (CAFE) standards by 2020, expected in compliance with the Energy Independence and Security Act of 2007.12 After 2020, fuel economy continues to
grow but slowly, with some introduction of gasoline hybrid vehicles and some use of biofuels (blending up to 10 percent ethanol), but no introduction of hydrogen fuel cell vehicles or other advanced technologies. The sensitivity of the results is tested in a later section using a more aggressive fuel economy scenario.
Estimates of CO2 emissions are derived from the fuel use projections on the basis of Environmental Protection Agency (EPA 2005) estimates of the carbon content of gasoline, the main fuel used by cars and light trucks.13 Changes in the mix of fuels used by the fleet, including the share and formulation of gasoline, will affect the level of CO2 emissions. The committee recognizes this potential but has not conducted an independent assessment or made its own expert judgment. Rather, it assumes that gasoline will remain the main transport fuel for the next 20 to 30 years at least and that using its carbon content for developing the scenario estimates makes the most sense. The committee recognizes, however, that if the carbon content of fuels falls in the future, which is certainly the intent of current and proposed federal policies, then the CO2 savings the committee estimates from reduced travel due to changes in urban form become smaller. The same relationship holds true for improvements in vehicle fuel economy generally.
The committee’s scenarios assume that reductions in energy use and CO2 emissions are proportional to VMT. This assumption is a simplification in that density is likely to lead to changes in vehicle mix and driving conditions that could affect the relationship of VMT to energy use and CO2 emissions. For example, as discussed in Chapter 3, there is evidence that density will encourage the purchase of smaller and hence more fuel-efficient vehicles, so that the reduction in energy use may be more than proportionate to the reduction in VMT. Density may also increase stop-and-go driving and lower speeds under more congested conditions in higher-density areas, which would increase
fuel consumption per VMT for conventional vehicles, though it would reduce fuel consumption per VMT sharply were hybrid vehicles to be widely adopted. The committee has not estimated differences in future energy use that might arise if hybrids are highly successful, rather assuming that conventional powertrains will dominate long into the future.14
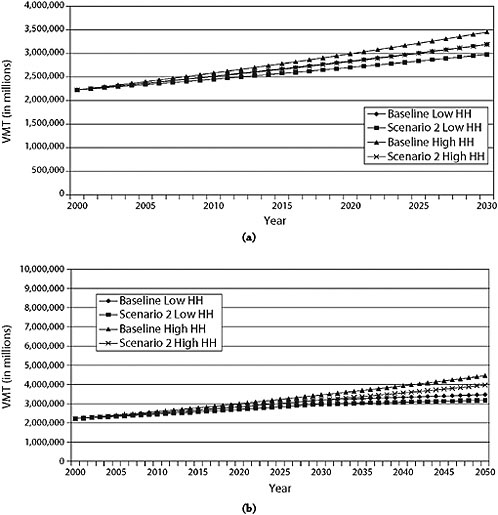
Results
Tables 5-1 and 5-2 summarize the results of the committee’s scenario analysis to 2030 and to 2050, respectively (Scenarios 1 and 2). Significant differences in magnitude are achieved only in Scenario 2 with its assumption of a doubling of density for 75 percent of new housing that is channeled to more compact development and an associated reduction in VMT of 25 percent for these households. Under these assumptions, reductions in VMT, energy use, and CO2 emissions of nearly 8 percent can be achieved by 2030. These savings cumulate and grow to more than 8 to 11 percent by 2050, illustrating on the one hand the longevity of the built environment and, on the other, the cumulative effect of land use changes (see Figures 5-1 to 5-3, which show how the reductions change both by scenario and over time).15 In Scenario 1, with its assumption of a doubling of density for 25 percent of new housing that is channeled to more compact development and an associated reduction in VMT of 12 percent for these households, reductions in VMT, energy use, and CO2 emissions of 1 to 1.2 percent can be achieved by 2030, growing
TABLE 5-1 Scenario Analysis, 2000–2030, Assumptions and Results
|
|
Year |
Base Case |
Scenario 1 |
Scenario 2 |
|
New Development |
||||
|
Assumptions |
|
|
|
|
|
Percent growth in housing units |
|
36%–46% |
36%–46% |
36%–46% |
|
Housing units (in millions) |
2000 |
105.2 |
105.2 |
105.2 |
|
2030 |
142.8–153.2 |
142.8–153.2 |
142.8–153.2 |
|
|
Percent of 2030 units new and replacement |
32%–37% |
32%–37% |
32%–37% |
|
|
New and replacement units (in millions) |
2030 |
45.8–56.7 |
45.8–56.7 |
45.8–56.7 |
|
Percent of new and replacement units compact |
0% |
25% |
75% |
|
|
New and replacement units compact (in millions) |
2030 |
0.0–0.0 |
11.5–14.2 |
34.4–42.5 |
|
Changes in VMT |
||||
|
Assumptions |
|
|
|
|
|
Percent change in VMT/household in existing development |
0% |
0% |
0% |
|
|
VMT/household in existing development |
2000 |
21,187 |
21,187 |
21,187 |
|
2030 |
21,187 |
21,187 |
21,187 |
|
|
Percent change in VMT/household in new noncompact development |
|
|
8.4% |
17.5% |
|
VMT/household in new noncompact development |
2030 |
22,967a |
24,895a |
|
|
Percent reduction in VMT/household in new compact development |
−12% |
−25% |
||
|
VMT/household in new compact development |
2030 |
|
20,211b |
18,671b |
|
|
Year |
Base Case |
Scenario 1 |
Scenario 2 |
|
Results |
|
|
|
|
|
Percent change in VMT between 2000 and 2030 |
|
39.4%–50.2% |
38.0%–48.4% |
|
|
VMT (in billions of miles) |
2000 |
2,228.9 |
2,228.9 |
|
|
2030 (1)c |
3,106.9–3,346.8 |
3,075.4–3,307.7 |
|
|
|
|
43.4%–55.1% |
33.8%–43.2% |
||
|
2000 |
2,228.9 |
2,228.9 |
||
|
2030 (2)d |
3,195.1–3,456.1 |
2,981.6–3,191.4 |
||
|
Percent change in VMT in 2030 from base case |
−1.0% to −1.2% |
−6.7% to −7.7% |
||
|
Change in VMT from base case (in billions of miles) |
2030 |
−31.5 to −39.1 |
−213.5 to −264.7 |
|
|
Changes in Energy Use and CO2Emissions |
||||
|
Assumptions |
|
|
|
|
|
Percent change in fleet mpg by 2030 |
58.5% |
58.5% |
58.5% |
|
|
Fleet mpg |
2000 |
19.5 |
19.5 |
19.5 |
|
2030 |
30.9 |
30.9 |
30.9 |
|
|
Percent change in carbon content of fuel between 2000 and 2030 |
0% |
0% |
0% |
|
|
Results |
|
|
|
|
|
Percent change in fuel use between 2000 and 2030 |
−12.0% to −5.2% |
−12.9% to −6.3% |
||
|
Fuel use (in billions of gallons) |
2000 |
114.3 |
114.3 |
|
|
2030 (1)c |
100.5–108.3 |
99.5–107.0 |
|
|
|
|
−9.5% to −2.1% |
|
−15.6% to −9.6% |
|
|
2000 |
114.3 |
114.3 |
||
|
2030 (2)d |
103.4–111.9 |
|
96.5–103.3 |
|
|
Percent change in fuel use in 2030 from base case |
|
|
−1.0 to −1.2% |
−6.7 to −7.7% |
|
Change in fuel use from base case (in billions of gallons) |
2030 |
|
−1.0 to −1.3 |
−6.9 to −8.6 |
|
|
Year |
Base Case |
Scenario 1 |
Scenario 2 |
|
Percent change in CO2 emissions between 2000 and 2030 |
|
−12.0% to −5.2% |
−12.9% to −6.3% |
|
|
CO2 emissions (millions of metric tons) |
2000 |
1,006 |
1,006 |
|
|
2030 (1)c |
885–953 |
876–942 |
|
|
|
|
−9.5% to −2.1% |
|
−15.6% to −9.6% |
|
|
2000 |
1,006 |
|
1,006 |
|
|
2030 (2)d |
910–984 |
|
849–909 |
|
|
Percent change in CO2 emissions from base case |
|
|
−1.0% to −1.2% |
−6.7% to −7.7% |
|
CO2 emissions (millions of metric tons) |
2030 |
|
−8.9 to −11 |
−61 to −75 |
|
aIn Scenario 1, VMT per household in new noncompact developments is assumed to be 8.4 percent higher (12 percent × .70) than the average for existing households, or 22,967 (21,187 × 1.084) VMT per household per year. In Scenario 2, VMT per household in new noncompact developments is assumed to be 17.5 percent higher (25 percent × .70) than the average for existing households, or 24,895 (21,187 × 1.175) VMT per household per year. bIn Scenario 1, VMT per household in new compact developments is assumed to be 12 percent less than the baseline of new noncompact development households, or 20,211 (22,967 × .88). In Scenario 2, VMT per household in new compact developments is assumed to be 25 percent less than the baseline of new noncompact development households, or 18,671 (24,895 × .75). cThe baseline projections for 2030 reflect the assumptions described in Footnote a. dThe baseline projections for 2030 reflect the assumptions described in Footnote b. |
||||
to 1.3 to 1.7 percent by 2050. The results for Scenario 3 (not shown separately in tabular form), which assumes a doubling of density for 25 percent of new housing that is channeled to more compact development and an associated reduction in VMT of only 5 percent for these households—the lowest estimate in the literature—show reductions in VMT, energy use, and CO2 emissions of less than 1 percent, even by 2050. Thus, under a wide range of conditions, reductions in VMT, energy use, and CO2 emissions resulting from compact, mixed-use development are estimated to be in the range of less than 1 percent to 11 percent
TABLE 5-2 Scenario Analysis, 2000–2050, Assumptions and Results
|
|
Year |
Base Case |
Scenario 1 |
Scenario 2 |
|
New Development |
||||
|
Assumptions |
|
|
|
|
|
Percent growth in housing units |
42.5%–82.5% |
42.5%–82.5% |
42.5%–82.5% |
|
|
Housing units (in millions) |
2000 |
105.2 |
105.2 |
105.2 |
|
2050 |
152.8–192.0 |
152.8–192.0 |
152.8–192.0 |
|
|
Percent of 2050 units new and replacement |
40.8%–54.9% |
40.8%–54.9% |
40.8%–54.9% |
|
|
New and replacement units (in millions) |
2050 |
62.4–105.4 |
62.4–105.4 |
62.4–105.4 |
|
Percent of new and replacement units compact |
0% |
25% |
75% |
|
|
New and replacement units compact (in millions) |
2050 |
0.0–0.0 |
15.6–25.8 |
46.8–78.4 |
|
Changes in VMT |
||||
|
Assumptions |
|
|
|
|
|
Percent change in VMT/household in existing development |
0% |
0% |
0% |
|
|
VMT/household in existing development |
2000 |
21,187 |
21,187 |
21,187 |
|
2050 |
21,187 |
21,187 |
21,187 |
|
|
Percent change in VMT/household in new noncompact development |
|
|
8.4% |
17.5% |
|
VMT/household in new noncompact development |
2050 |
22,967a |
24,895a |
|
|
Percent reduction in VMT/household in new compact development |
−12% |
−25% |
||
|
VMT/household in new compact development |
2050 |
|
20,211b |
18,671b |
|
|
Year |
Base Case |
Scenario 1 |
Scenario 2 |
|
Results |
|
|
|
|
|
Percent change in VMT between 2000 and 2050 |
|
50.2%–90.9% |
48.3%–87.7% |
|
|
VMT (in billions of miles) |
2000 |
2,228.9 |
2,228.9 |
|
|
2050 (1)c |
3,348.5–4,255.4 |
3,305.5–4,182.8 |
|
|
|
|
55.6%–100% |
|
42.6%–78% |
|
|
2000 |
2,228.9 |
|
2,228.9 |
|
|
2050 (2)d |
3,468.9–4,458.6 |
|
3,177.4–3,966.8 |
|
|
Percent change in VMT in 2050 from base case |
|
|
−1.3% to −1.7% |
−8.4% to −11.0% |
|
Change in VMT from base case (in billions of miles) 2050 |
|
|
−43.0 to −72.6 |
−291.5 to −491.8 |
|
Changes in Energy Use and CO2Emissions |
||||
|
Assumptions |
|
|
|
|
|
Percent change in fleet mpg by 2050 |
|
68.7% |
68.7% |
68.7% |
|
Fleet mpg |
2000 |
19.5 |
19.5 |
19.5 |
|
2050 |
32.9 |
32.9 |
32.9 |
|
|
Percent change in carbon content of fuel between 2000 and 2050 |
|
0% |
0% |
0% |
|
Results |
|
|
|
|
|
Percent change in fuel use between 2000 and 2050 |
|
−11.0% to +13.2% |
−12.1% to +11.2% |
|
|
Fuel use (in billions of gallons) |
2000 |
114.3 |
114.3 |
|
|
2050 (1)c |
101.8–129.3 |
100.5–127.1 |
|
|
|
|
−7.8% to +18.6% |
|
−15.5% to +5.5% |
|
|
2000 |
114.3 |
|
114.3 |
|
|
2050 (2)d |
105.4–135.6 |
|
96.6–120.6 |
|
|
Percent change in fuel use in 2050 from base case |
|
|
−1.3% to −1.7% |
−8.4% to −11.0% |
|
Change in fuel use from base case (in billions of gallons) |
2050 |
|
−1.3 to −2.2 |
−8.9 to −14.9 |
|
|
Year |
Base Case |
Scenario 1 |
Scenario 2 |
|
Percent change in CO2 emissions between 2000 and 2050 |
|
−11.0% to +13.2% |
−12.1% to +11.2% |
|
|
CO2 emissions (millions of metric tons) |
2000 |
1,006 |
1,006 |
|
|
2050 (1)c |
896–1,138 |
884–1,119 |
|
|
|
|
−7.8% to +18.6% |
|
−15.5% to +5.5% |
|
|
2000 |
1,006 |
|
1,006 |
|
|
2050 (2)d |
928–1,193 |
|
850–1,061 |
|
|
Percent change in CO2 emissions from base case |
|
|
−1.3% to −1.7% |
−8.4% to −11.0% |
|
Change in CO2 emissions from base case (millions of metric tons) |
2050 |
|
−12 to −19 |
−78 to −132 |
|
aIn Scenario 1, VMT per household in new noncompact developments is assumed to be 8.4 percent higher (12 percent × .70) than the average for existing households, or 22,967 (21,187 × 1.084) VMT per household per year. In Scenario 2, VMT per household in new noncompact developments is assumed to be 17.5 percent higher (25 percent × .70) than the average for existing households, or 24,895 (21,187 × 1.175) VMT per household per year. bIn Scenario 1, VMT per household in new compact developments is assumed to be 12 percent less than the baseline of new noncompact development households, or 20,211 (22,967 × .88). In Scenario 2, VMT per household in new compact developments is assumed to be 25 percent less than the baseline of new noncompact development households, or 18,671 (24,895 × .75). cThe baseline projections for 2050 reflect the assumptions described in Footnote a. dThe baseline projections for 2050 reflect the assumptions described in Footnote b. |
||||
by 2050. The possibilities for achieving these results, as well as what it means to double the density of new development, are discussed in a subsequent section.
Note that the scenarios project some reductions in energy use and CO2 emissions even in the base case, in which the density of new development is lower than current densities. These reductions occur because the base case assumes that the fuel economy of motor vehicles increases and the growth in VMT per household in existing developments stabilizes with the aging of the baby boomers and the continuing decline in household size. Between 2000 and 2030,
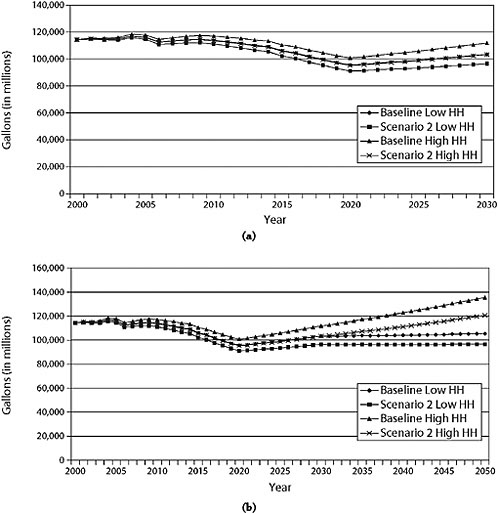
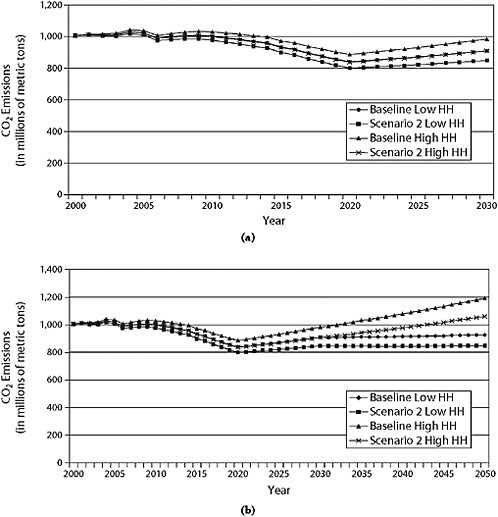
for example, total energy use and CO2 emissions from personal motor vehicles are projected to drop by 5 to 12 percent in the base case compared with just 6 to 13 percent under Scenario 1, and from 2 to 9 percent in the base case compared with a slightly higher reduction of 10 to 16 percent under Scenario 2 (see Table 5-1). These reductions reflect the improvement in fuel economy from the new CAFE standards, which offsets the effects on energy use of the growth in households and VMT during this period. Between 2000 and 2050, however, the base case shows between an 11 percent reduction and a 13 percent increase in energy use and CO2 emissions, compared with between a 12 percent reduction and an 11 percent increase under Scenario 1. Similarly, over the same 2000 to 2050 time period, the base case shows between an 8 percent reduction and a 19 percent increase, compared with a 15 percent reduction and a 6 percent increase under Scenario 2 (see Table 5-2). By 2050, the energy savings from the very modest improvements in fuel economy resulting from achieving the new CAFE standards in 2020 are offset by the growth in households and VMT over this period.16
Sensitivity Analyses
The reductions in energy use and CO2 emissions from compact development are fairly sensitive to assumptions about future growth in both fuel efficiency and VMT per household.
Changing Fuel Economy Assumptions
Table 5-3 summarizes the results if a more aggressive fuel economy scenario is assumed. This more aggressive scenario is drawn from the NRC study (2008) discussed previously and assumes that fuel economy
TABLE 5-3 Summary Results of Sensitivity Analyses, Changing Fuel Economy and VMT Assumptions
more than doubles by 2050.17 Changing the fuel economy assumptions does not change the percentage reductions in energy use and CO2 emissions from the base case: the compact-growth scenarios still save 1 to 8 percent by 2030 and 1 to 11 percent by 2050. But the more aggressive fuel economy assumptions more than double the reductions in energy use and CO2 emissions between 2000 and 2030 for both the base case and the two compact-growth scenarios. Between 2000 and 2030, for example, the base case projects a reduction in energy use and CO2 emissions of 24 to 32 percent with the more aggressive fuel economy assumptions, compared with only 2 to 12 percent with the committee’s original assumptions (see Annex 5-1 Tables 1 and 2 for details). By 2050, the more aggressive improvements in fuel economy turn increases in energy use and CO2 emissions in the committee’s scenarios to reductions, more than keeping pace with projected household and VMT growth. For example, under Scenario 2—the committee’s upper-bound scenario with respect to the share of expected compact development—reductions in energy use and CO2 emissions range from 39 to 51 percent with the more aggressive fuel economy assumptions, as compared with a 15 percent reduction to a 5 percent increase under the committee’s original assumptions (see Table 5-3 and Annex 5-1 Table 2). In short, over the longer time frame (i.e., to 2050), the impacts of continuing improvements in fuel economy beyond 2020 on energy use and CO2 emissions significantly outstrip those from more compact development.
|
17 |
The more aggressive fuel economy scenario assumes mpg improvements similar to those of the reference case used in the committee’s scenarios up to 2020. From 2020 to 2050, however, it assumes an average annual mpg growth rate of 2.18, reflecting a more aggressive penetration of hybrid gasoline vehicles—which represent 23 percent of the fleet by 2030 and 80 percent by 2050—as well as more gasoline vehicles with high fuel economy. Nevertheless, the NRC report (2008) characterizes this scenario as “evolutionary”; it assumes that currently available improvements in gasoline internal combustion engine technology are used to improve fuel economy, rather than to improve power and acceleration as was the case in the past. This scenario does not assume any rebound effect (i.e., increased VMT due to increased fuel efficiency that lowers the cost of driving), which researchers have estimated to be small (see discussion in Chapter 4). |
Changing VMT Assumptions
Relaxing the assumption of no growth in VMT per household causes base case VMT to grow and increases the role for compact development, although much less for energy use and CO2 emissions than for VMT. As shown in Annex 5-1 Tables 3 and 4, the base case is modified to assume that VMT per household in existing housing increases by 0.0025 percent per year, rising from 21,187 miles in 2001, to 22,835 miles in 2030, and to 24,004 miles in 2050.18 VMT per household in new and replacement units, both more compact and not, is adjusted accordingly. Under this growth assumption, base case VMT grows by 39 to 62 percent between 2000 and 2030 and by 70 to 116 percent between 2000 and 2050 (see Table 5-3 and Annex 5-1 Tables 3 and 4). Scenario 1 reduces VMT by only a few percentage points, even by 2050. Scenario 2 shaves 10 to 13 percentage points off a higher baseline by 2030 (as VMT increases by 44 to 54 percent) and 15 to 25 percentage points by 2050 (as VMT increases by 61 to 102 per cent). The effects on energy use and CO2 emissions are more modest because the improvements in fuel economy, even under the less aggressive reference scenario, more than offset the increases in VMT per household. Between 2000 and 2030, for example, the base case shows a 12 percent decline to a 2 percent increase in energy use and CO2 emissions, compared with just a 13 per cent decline to a 1 percent increase in Scenario 1 (see Table 5-3 and Annex 5-1 Table 3). Scenario 2 shaves another few percentage points (7 to 8) off a higher baseline. Between 2000 and 2050, Scenario 2 shows a 4 percent reduction to a 19 percent increase in energy use and CO2 emissions, while the base case shows a 4 to 34 percent overall increase (see Table 5-3 and Annex 5-1 Table 4).
The assumption that the large base of existing households will not change their preferences is restrictive. As discussed in Chapter 4, for example, aging baby boomers will likely downsize at some point, leaving their suburban homes before they exit the housing market entirely.
Nevertheless, if housing prices fall in response to the mismatch between the large supply of boomer suburban housing and the demand for new housing from the smaller home-buying cohorts that follow, some portion of the former is likely to be recycled to these new homeowners as well as to immigrant populations, diverting growth that could go to compact development.
Several other factors could work in the opposite direction, lowering the future value of reductions in VMT, energy use, and CO2 emissions. First, as discussed in Chapter 4, VMT per household may actually fall as the population ages, regardless of whether households move to more densely developed locations. Depending on the size of the reduction, it could reduce the base VMT against which future reductions from compact development are calculated. Second, if the introduction of new technologies is successful—resulting in a vehicle fleet that is much more fuel-efficient than today’s fleet and has a much larger mix of alter natively fueled vehicles—these changes will lower the baseline energy use and CO2 emissions levels from which reductions from more compact development are calculated. The sensitivity analysis mentioned previously, which assumes a more aggressive fuel economy scenario, illustrates this point. Finally, to the extent that households move to more compact areas and continue to drive, they may encounter more congested conditions than in conventional developments, which will reduce vehicle speeds, increase stop-and-start driving, and thereby reduce energy efficiency, unless, of course, hybrids come to dominate the fleet.19 These changes could be offset in more compactly developed
areas, however, by households owning fewer vehicles—in particular, less energy-efficient sport utility vehicles and pickup trucks—and higher transit use, particularly where rail transit is available, and are thus of less concern (see the discussion of these issues in Chapter 3).
In summary, the committee’s scenario analysis shows modest but increasing reductions in VMT, energy use, and CO2 emissions from more compact, mixed-use development that range from less than 1 per cent to a maximum of about 11 percent by 2050. To the extent that energy use and CO2 emissions are more of an issue than VMT, plausible improvements in vehicle fuel economy will generate significantly larger and more rapid improvements than increases in compact, mixed-use development. Relaxing the scenario restriction on infilling new housing within existing developments, thereby increasing density, would increase projected benefits from compact development. Additional improvements in vehicle fuel efficiency and reduction in the carbon content of fuel from greater use of alternative fuels, however, would work in the opposite direction, reducing the magnitude of benefits in energy use and CO2 emissions from more compact development.
Plausibility of Committee’s Scenarios
How plausible are the targets for compact development implicit in the committee’s scenarios, that is, doubling density for 25 percent (Scenario 1) or 75 percent (Scenario 2) of new development by 2030 and 2050? To address this question, the committee examined current and historical density trends as a benchmark against which to compare projected density changes. Two national data sources were used—the National Resources Inventory (NRI) and the decennial U.S. Census of Population and Housing (see Appendix C for details on the pros and cons of each). The measure of density—the number of dwelling units (DUs) divided by land area—was calculated in several different ways. All involved drawing on census data at the metropolitan level for num-
bers of DUs—the numerator—but the two different data sources were used in the denominator.20
Using both data sources and all the different ways of calculating density yielded the same trends. Over the decade of the 1990s, average densities declined because the average density of new development was lower than the average density of existing development.21 On the basis of average density weighted by population, the census data further indicate that between 1990 and 2000, nearly half of new DUs (47.5 percent) were built in census tracts having less than 1 DU per gross acre and another 20 percent in tracts with between 1 and 2 DUs per gross acre. Less than one-third (31.9 percent) of new DUs were built in tracts having 2 or more DUs per gross acre (see Table C-3 in Appendix C). On the basis of average density weighted by acres, the census data also show that between 1990 and 2000, more than three-quarters (76.5 percent) of newly developed acres were in tracts with less than 1 DU per gross acre (see Table C-3). By any measure, the majority of new development occurred in the lowest density categories.
The committee used the trend data for new development to project the densities implied in its two scenarios relative to the base case scenario that simply projects forward current trends toward low-density development. Using average densities for new development (calculated in the various ways just described), Scenario 1 assumes a doubling of average densities for 25 percent of new development. New noncompact development is assumed to have the same average density levels as the new development of the preceding decade (1990 to 2000), and existing development is assumed to have the average density levels of the housing
|
20 |
As discussed in more detail in Appendix C, the NRI data measure DUs per acre of developed urban land. The census data measure DUs per gross acre, including land used for nonresidential purposes, but enabling land area to be classified by a range of densities. Thus, by using census data it is possible to define the number of DUs on lots of different-sized acreage. With the census data, the average density can be calculated in two ways: (a) weighting by population (density of the average dwelling unit) or (b) weighting by acres (density of the average acre). |
|
21 |
The NRI data measured changes from 1987 to 1997, the most recent year such detailed data were available. |
stock in 2000 (see Table C-4). Scenario 2 uses similar calculations but assumes a doubling of densities for 75 percent of new development. The new average density levels for each scenario were then compared with the baseline scenario in 2030 and 2050. Only the results for 2050 are discussed below, since this time frame allows sufficient time for projected changes in development patterns to take hold.
Not surprisingly, the results of this analysis show that both scenarios depart from existing trends (of new development being significantly less dense than existing development). However, the doubling of density in 25 percent of new development (Scenario 1) fails to raise densities above the average density of the development that existed in 2000 and raises them only about 7 to 11 percent above the 2050 baseline (see Table C-4 for details). In comparison, doubling density in 75 percent of new development (Scenario 2) requires average densities above the average density of existing development and significantly above (20 to 33 percent) the 2050 baseline.
The more fine-grained census data enabled the committee to examine various ways in which the density targets implicit in the scenarios could be realized. For example, doubling density in 25 percent of new development (Scenario 1) could be achieved by eliminating half of all new development in census tracts in the lowest-density category (less than 1 DU per gross acre) (see Table C-5 for details). Alternatively, an infill strategy could be pursued and the target met by doubling the density in tracts with an average of 4 or more DUs per gross acre. Or the target could be met by some combination of these two possibilities. Reaching the target of Scenario 2—doubling density in 75 percent of new development—would require more drastic measures, such as eliminating all new development in the lowest-density category or doubling the density of tracts with an average of 3 or more DUs per gross acre, a more aggressive infill scenario.
In summary, both scenarios increase the density of development and thus represent a departure from current trends. New development in metropolitan areas has occurred at lower-than-average densities
for decades. Nevertheless, doubling the density of 25 percent of new development is possible, particularly by 2050. Average densities for new development would not be raised above current levels, and precedents for higher densities through smaller lot sizes and infill development near major transportation corridors can be found in growing areas such as Phoenix and Portland, Oregon. Phoenix, for example, demonstrates that a growing metropolitan area can achieve densities of the levels projected in Scenario 1 (see Box 5-1). Such higher densities are attributable to infrastructure investment decisions, land use planning, and land acquisition and banking approaches. They also reflect demographic factors and land ownership restrictions (i.e., Phoenix is encircled by large amounts of federal and state land) that are unique to Phoenix and may not be replicable in other metropolitan areas.
Doubling the density of 75 percent of new development by 2050 would be much more challenging. It would require, for example, either curtailing most large lot development or adding a significant proportion of new development as infill to achieve average densities above current levels and significantly above a 2050 baseline that continues current trends. The committee disagreed about the feasibility of doubling the density of 75 percent of new development, even by 2050. Those members who thought it was possible questioned whether densities will keep declining. Macroeconomic trends—likely higher energy prices and carbon taxes—in combination with growing public support for strategic infill, investments in transit, and higher densities along rail corridors could result in considerably higher densities by 2050. Density trends have already been reversed in some metropolitan areas, such as Portland, which have seen new single-family lot sizes decline by more than one-half since the urban growth boundary was established in 1981. Other members believed that the substantial infill or curbing of large-lot development at the urban fringe, or both, implied in achievement of the targets in Scenario 2 would require such a significant departure from current housing trends, land use policies of jurisdictions on the urban fringe, and public preferences
|
Box 5-1 PHOENIX AND ATLANTA A Comparison of Density Changes in Two Rapidly Growing Metropolitan Areas Atlanta and Phoenix were two of the most rapidly growing metropolitan areas in the United States in the 1990s. Between 1987 and 1997, the housing stock in both metropolitan areas grew by about 35 percent, but new urban development in Atlanta covered more than 505,000 acres, a 64 percent increase, whereas that in Phoenix occupied only an estimated 60,000 acres, up 18 percent between 1987 and 1997 according to data drawn from the National Resources Inventory. As a consequence, Atlanta’s built environment dropped from an already low density of 1.30 housing units per urbanized acre to 1.08, while Phoenix’s comparatively high density of 2.37 grew to 2.73. Results from the 1990 and 2000 U.S. Census of Population and Housing underscore the substantial differences between residential neighborhoods in Atlanta and Phoenix. In 2000, only about one-fifth (19 percent) of the housing units in Phoenix were in low-density tracts (below 1 dwelling per acre), compared with nearly half (47 percent) in Atlanta. Although the share in Phoenix grew during the 1990s while that in Atlanta declined (from 15 and 48 percent, respectively), Atlanta’s housing in this range was built at densities significantly lower than those in Phoenix, according to data from the American Housing Survey. In 2000, more than one-quarter (27 percent) of the housing in Phoenix was in tracts in the highest-density range (above 4 dwellings per acre) compared with just 6 percent in Atlanta. |
|
Phoenix’s comparatively high density is not a function of attached housing. In fact, the two metropolitan areas had roughly the same share of single-family detached and manufactured/mobile housing units in both 1990 and 2000, according to the 1990 and 2000 censuses. These two structure types accounted for 64 and 62 percent of the stock in 1990 in Atlanta and Phoenix, respectively, and grew in the 1990s to make up 69 and 66 percent of the stock, respectively. Why did urban development occupy so much more land in Atlanta than in Phoenix? The most important public decisions have to do with land use planning, public land ownership, and infrastructure.
|
Phoenix’s higher density and Atlanta’s low density also relate to demography and ethnicity. Phoenix has more immigrants and elderly residents, who appear to accept higher-density development. Racial composition may also play a role, as most of the households that have moved into the low-density northern reaches of metropolitan Atlanta have followed a long tradition of separation from African American neighbors in the region’s central cities and southern counties. Finally, Phoenix’s topography is mostly flat but punctuated with steep mountains, whereas Atlanta’s has more stream valleys and low hills. |
that they would be unrealistic absent a strong state or regional role in growth management.
OTHER BENEFITS AND COSTS OF MORE COMPACT DEVELOPMENT
Improved Energy Efficiency of Residential Buildings
The prior sections have focused on the potential savings in energy use and CO2 emissions from reduced travel associated with more compact, mixed-use development. Another important source of savings, directly related to more compact development, is the improved energy efficiency of residential buildings. The U.S. residential sector accounts for slightly more than one-fifth of the nation’s total annual energy use and produces an equivalent share of total annual CO2 emissions (EIA 2007).22
Substantial savings in energy use and CO2 emissions can be achieved through improved building design, primarily by increasing the thickness of insulation and by realizing changes in home size that would result from more compact development (Kockelman et al. 2009). For example, moving from a single-family to a multifamily DU would result in significant energy savings. Calculations conducted for this study revealed that moving from a 2,400-ft2 single-family home—the average home size in the United States in 200723—to a 2,000-ft2 apartment would save about 34.1 million Btu and about 3.3 metric tons of CO2 emissions, all else being equal (see Annex 5-1 Table 5 for detailed calculations).24 By
comparison, downsizing from a 2,400-ft2 single-family DU to a 2,000-ft2 single-family unit would save only 4.1 million Btu and 0.35 metric tons of CO2 emissions. Estimated savings are averages, however, which could vary widely from one location to another, depending on heating and cooling needs and energy sources.
The primary reason for the greater energy efficiency of multifamily DUs versus single-family homes is the reduced exposed surface area of the former. As exposed surface area increases, the amount of heat transferred either into or out of a building also increases. The same logic suggests that shorter buildings are more energy efficient than taller ones, all else being equal, because of less exposed surface area and the insulation provided by the ground soil. As the base floor area increases, however, building up becomes more energy efficient, particularly in multifamily DUs, where increasing the number of units maximizes interior volume relative to exposed wall and rooftop area. Shared walls also reduce the heating and cooling needs of individual units. Of course, multifamily units are smaller, on average, than single-family DUs.25
Table 5-4 shows the results of a simple calculation assuming that 75 percent of new and replacement housing units are built as 2,000-ft2 single-family units or 2,000-ft2 apartments instead of 2,400-ft2 single-family units. The savings calculated represent an upper bound in that they ignore any future improvements in building efficiency from better insulation or other measures, assume that all new development is detached single-family units, and are based on the committee’s most optimistic compact-growth scenario. Nevertheless, under these assumptions, 149.8 trillion to 173.9 trillion Btu per year could be saved by 2030 from downsizing to smaller single-family DUs and 1,173 trillion to 1,449 trillion Btu from moving to multifamily DUs. These energy savings translate to a reduction of 12 million to 14.8 million metric tons of CO2 emissions and 115.1 million to
TABLE 5-4 Estimated Savings in Energy Use and CO2Emissions from Improved Energy Efficiency of Residential Buildings and Changes in VMT from Compact Development, 2030, 2050
|
|
By 2030 |
By 2050 |
|
Number of new and replacement housing unitsa (in millions) |
45.8–56.7 |
62.4–105.3 |
|
Number of housing units in compact developmentb (in millions) |
34.4–42.5 |
46.8–78.4 |
|
Savings in energy use (in trillions of Btu) from |
|
|
|
Moving to MFDUc |
1,173.0–1,449.0 |
1,596.0–2,673.0 |
|
Downsizing to SFDUd |
140.8–173.9 |
191.6–320.9 |
|
Savings in CO2 emissions (in millions of metric tons) from |
|
|
|
Moving to MFDUc |
115.1–142.2 |
156.6–262.3 |
|
Downsizing to SFDUd |
12.0–14.8 |
16.3–27.4 |
|
Savings in fuel use (in trillions of Btu) from changes in VMT |
855.6–1,066.4 |
1,103.6–1,847.6 |
|
Savings in CO2 emissions (in millions of metric tons) from changes in VMT |
61.0–75.0 |
78.0–132.0 |
|
Note: MFDU = multifamily dwelling unit; SFDU = single-family dwelling unit. See Annex 5-1 Table 5 for conversion factors. aAssumes the same number of new and replacement housing units as committee scenarios. bAssumes the “best case” scenario (i.e., 75 percent of new and replacement housing units will be in more compact development settings). cAssumes moving from a 2,400-ft2 single-family dwelling unit to a 2,000-ft2 multifamily dwelling unit. dAssumes moving from a 2,400-ft2 single-family dwelling unit to a 2,000-ft2 single-family dwelling unit. |
||
142.2 million metric tons of CO2 emissions, respectively.26 By 2050, the energy savings from downsizing to smaller single-family DUs or moving to multifamily DUs grow to 191.6 trillion to 320.9 trillion Btu and 1,596 trillion to 2.673 trillion Btu, respectively, and savings in
CO2 emissions grow to 16.3 million to 27.4 million metric tons and 156.6 million to 262.3 million metric tons, respectively. These savings from residential building efficiencies represent significant additions to the savings realized from reduced VMT in more compact developments. Of course, the actual savings could be much less, particularly as a result of improvements in the efficiency of residential heating, cooling, and lighting systems, and they would vary from one location to another.
Other Benefits and Costs
A number of studies (Burchell et al. 2002; Burchell et al. 2005; Downs 2004) have enumerated many of the other benefits and costs of more compact, mixed-use development, or conversely, the costs (and benefits) of more sprawling development patterns. They are briefly summarized here; use is made of the organizational structure of Burchell et al. (2002, 2005). No attempt is made, however, to quantify these effects or determine whether the benefits outweigh the costs, which was beyond the scope of this study.
Land and Infrastructure
More compact development, particularly near areas that are already developed, should reduce demand for and conversion of undeveloped land to meet new housing and job needs. Chapter 2 noted the high rate of land conversion in recent decades. Reducing this growth rate would help preserve agricultural land as well as other environmentally fragile areas, such as wetlands and sensitive watersheds.
Developing more compactly would also reduce the costs of extending or upgrading infrastructure systems to support new housing and commercial development. Water and sewer trunk lines, in particular, would not have to be extended, nor local road networks expanded, although some upgrading of existing capacity might be needed if new development were directed toward already built-up areas. Water and
sewer hook-up fees, which are borne by new homeowners, would be reduced, lessening development and homeowner costs if the savings were passed on. More generally, compact development would increase the feasibility of building lower-cost housing. Medium-density units (low-rise apartments) in particular are less expensive to develop than either high-rise or low-density, single-family units and could find greater acceptance than high-rise apartment buildings in some developed areas (Downs 2004).
Health, Congestion, and Community
More compact development can provide greater incentives for walking and bicycling as travel modes, and increased physical activity is known to have positive health benefits. However, causal associations between compact development and physical activity have not been conclusively demonstrated (TRB 2005). The relationship is complex and operates through many mediating factors, such as sociodemographic characteristics, personal and cultural variables, safety and security, and time allocation. Nevertheless, in the longer run, more compactly developed environments that reduce automobile dependence should leave residents with more travel options as they face potentially higher energy costs and possible carbon taxes.
The potential benefits of more compact development in reducing congestion and pollution are more ambiguous. Reduction in congestion depends on the capacity of the existing road network, as well as on the extent of the shift to transit and other modes. Mobility in general could be affected because shifts to transit and walking are likely to increase traveler trip times, and lower levels of automobile ownership in very high-density locations may result in fewer vehicle trips. The effect on pollution reduction is also complex because many pollutants are not point specific; their concentrations are a regional phenomenon, affected by wind and weather, among other variables. Moreover, the urban heat island effect—higher temperatures associated with urban
development—is most pronounced in densely developed areas.27 Higher temperatures, particularly in the summer, can increase the rate of both ground-level ozone formation and electricity use, particularly for cooling, which in turn means more pollution and greenhouse gas emissions from fossil fuel–burning power plants (EPA 2008). Human health effects of increased daytime surface temperatures, reduced night-time cooling, and higher air pollution levels associated with urban heat islands include respiratory difficulties, heatstroke, and heat-related mortality (EPA 2008). Urban heat islands can also exacerbate the impact of heat waves, affecting sensitive populations, such as children and the elderly.
Another difficult-to-measure benefit of compact development is an enhanced sense of community among residents, thought to improve quality of life. The argument is that an environment in which residents live closer together and have more opportunities to interact in public spaces without resorting to automobiles should encourage more social interaction and foster a sense of community. The hypothesis is difficult to test empirically, and as Burchell et al. (2002, 15) conclude, “it cannot be said that controlled growth will lead to either improved or lower quality of life.”
Housing Choices and Costs
A potential cost of more compact development is the investment in transit, particularly rail transit, necessary to support high-density development. These costs could, at least in part, offset some of the savings from expanding highway infrastructure.
The studies cited earlier note some of the other costs of more compact development. One of the first mentioned is the preference of many
Americans for single-family homes and lower-density suburban settings that are often associated with related benefits, such as greater privacy, less noise, more access to open space and recreation, and in some cases, less congestion and pollution than more densely developed urban settings.28 Restricting the amount of single-family housing through zoning or other measures that increase compact development could raise the cost of that housing, contributing to housing affordability problems.
These affordability problems may be mitigated, however, as the baby boomers withdraw from their suburban single-family homes, increasing the supply of such housing. As noted in Chapter 4, moreover, it is unclear that more compact development would greatly restrict housing choices or increase single-family housing prices because exclusionary zoning may have forced a greater mix of single-family housing units than consumers wanted in the past. Moreover, building more compact, mixed-use developments does not necessarily mean building only multifamily housing. Reducing the lot size of single-family housing should also result in VMT reductions. Finally, housing preferences may change with the aging of the population and the withdrawal of the baby boomers from their suburban homes; the coming of age of succeeding (albeit smaller) generations of young single-person households that may prefer urban living; and the socioeconomic circumstances and cultural preferences of growing immigrant populations, who often favor high-density locations. (See the discussion of these trends in Chapter 4.)
FINDINGS
Changing development patterns to encourage more compact, mixed-use development has the potential to reduce VMT, energy use, and CO2 emissions. The question is by how much. In an upper-bound scenario,
which assumes that 75 percent of new and replacement housing units are built in more compact developments and that residents of those developments drive 25 percent less, the committee estimates that VMT and associated fuel use and CO2 emissions would be reduced by 7 to 8 percent below the base case by 2030, growing to between 8 and 11 percent below the base case by 2050. A more moderate scenario, which assumes that 25 percent of new and replacement housing units are built in more compact developments and that residents of those developments drive 12 percent less, results in reductions in energy use and CO2 emissions of about 1 percent below the base case by 2030, growing to between 1.3 and 1.7 percent below the base case by 2050. If the residents of compact developments drive only 5 percent less— the lower bound of available estimates—then the savings in energy use and CO2 emissions are less than 1 percent below the base case even by 2050. Thus, the committee believes that reductions in VMT, energy use, and CO2 emissions resulting from compact, mixed-use development would be in the range of less than 1 percent to 11 percent by 2050, although the committee members disagreed about whether the changes in development patterns and public policies necessary to achieve the high end of these findings are plausible.
All scenarios increase the density of development and thus represent a departure from current trends that produce a continued decline in density. New development in metropolitan areas has occurred at lower than the average density of existing development for decades. However, doubling the density of 25 percent of new development from this reduced level is possible, particularly by 2050. Average densities for new development would not be raised above current levels, and precedents for higher densities can be found in growing areas such as Phoenix and Portland. The committee members disagreed about the feasibility of doubling the density of 75 percent of new development, even by 2050. Those members who thought it was possible questioned whether densities will keep declining in the face of likely higher energy prices and carbon taxes and growing public support for strategic infill,
investments in transit, and higher densities along rail corridors. Other members believed that the substantial infill and curbing of large-lot development at the urban fringe implied in achieving the targets in Scenario 2 require such a significant departure from current housing trends, land use policies of jurisdictions on the urban fringe, and public preferences that they would be unrealistic absent a strong state or regional role in growth management.
Whether reductions in energy use and CO2 emissions from VMT reductions occur rapidly or slowly, more compact development will also yield significant savings in energy use and production of CO2 emissions by improving the energy efficiency of residential buildings. The U.S. residential sector accounts for more than one-fifth of the nation’s total annual energy use and an equivalent share of CO2 emissions. Multifamily housing is particularly energy efficient relative to single-family housing because of a combination of reduced exposed surface area per dwelling unit and shared walls and floors that reduce the heating and cooling costs of individual units. Downsizing to smaller single-family dwellings also yields savings, but much smaller than the reduction from moving to multifamily units.
The savings from reductions in VMT and greater energy efficiency of residential buildings resulting from more compact development, however, will be affected, and in most cases reduced, by other policies adopted to achieve these goals. For example, the more rapidly the energy efficiency of cars and light trucks increases, whether as a result of public policy or of higher energy prices, the smaller are the savings in energy use and CO2 emissions from reducing VMT. Similarly, if the energy efficiency of residential heating and cooling is improved, the advantages of shifting from detached single-family homes to apartments or to smaller single-family units will also decline. Indeed, a sensitivity analysis of the committee’s assumptions about fuel economy shows that more aggressive fuel economy improvements would produce savings in energy use and CO2 emissions many times the size of those from compact development.
Changes in development patterns significant enough to substantially alter travel behavior and the energy efficiency of residential buildings entail other benefits and costs that are not quantified in this study. On the benefit side, more compact, mixed-use development should reduce infrastructure costs, increase the feasibility and cost-effectiveness of transit, and enhance the likelihood of building more moderately priced housing. Other benefits include less demand for undeveloped land and less conversion of agricultural and other environmentally fragile areas. Finally, increasing the amount of more compact, mixed-use development should provide homeowners with more transportation options and more opportunities for increasing physical activity by walking and bicycling. Less certain benefits of more compact development include reduced congestion, better air quality, and improved quality of life.
On the cost side, savings in highway infrastructure would be offset, at least in part, by increased investment in transit, particularly rail transit, to support high-density development. Moreover, many Americans appear to prefer detached single-family homes in low-density suburbs that often are associated with more privacy, greater access to open space and recreation, and less noise than characterize many urban neighborhoods. As discussed in Chapter 4, however, there is some evidence that more compact developments may currently be undersupplied because of exclusionary suburban zoning. Moreover, housing preferences may change in the future with changes in the demographic and socioeconomic characteristics of the population.
REFERENCES
Abbreviations
EIA Energy Information Administration
EPA Environmental Protection Agency
NAHB National Association of Home Builders
NRC National Research Council
TRB Transportation Research Board
Bento, A. M., M. L. Cropper, A. M. Mobarak, and K. Vinha. 2005. The Effects of Urban Spatial Structure on Travel Demand in the United States. Review of Economics and Statistics, Vol. 87, No. 3, pp. 466–478.
Brownstone, D., and T. F. Golob. 2009. The Impact of Residential Density on Vehicle Usage and Energy Consumption. Journal of Urban Economics, Vol. 65, pp. 91–98.
Burchell, R., A. Downs, B. McCann, and S. Mukherji. 2005. Sprawl Costs: Economic Impacts of Unchecked Development. Island Press, Washington, D.C.
Burchell, R. W., G. Lowenstein, W. R. Dolphin, C. C. Galley, A. Downs, S. Seskin, K. G. Still, and T. Moore. 2002. TCRP Report 74: Costs of Sprawl—2000. Transportation Research Board, National Research Council, Washington, D.C.
Downs, A. 2004. Still Stuck in Traffic: Coping with Peak-Hour Traffic Congestion. Brookings Institution, Washington, D.C.
EIA. 2007. Annual Energy Review 2007. DOE/EIA-0384(2007). U.S. Department of Energy, Washington, D.C.
EPA. 2005. Emission Facts: Average Carbon Dioxide Emissions Resulting from Gasoline and Diesel Fuel. EPA420-F-05-001. Office of Transportation and Air Quality, Washington, D.C.
EPA. 2008. Heat Island Effect. www.epa.gov/heatisland/index.htm. Accessed Jan. 15, 2009.
Ewing, R., K. Bartholomew, S. Winkelman, J. Walters, and D. Chen. 2007. Growing Cooler: The Evidence on Urban Development and Climate Change. Urban Land Institute, Washington, D.C. www.smartgrowthamerica.org/gcindex.html. Accessed Oct. 17, 2007.
Ewing, R., and R. Cervero. 2001. Travel and the Built Environment: A Synthesis. In Transportation Research Record: Journal of the Transportation Research Board, No. 1780, Transportation Research Board, National Research Council, Washington, D.C., pp. 87–114.
Hu, P. S., and T. R. Reuscher. 2004. Summary of Travel Trends: 2001 National Household Travel Survey. Federal Highway Administration, U.S. Department of Transportation, Washington, D.C.
Kockelman, K., M. Bomberg, M. Thompson, and C. Whitehead. 2009. GHG Emissions Control Options: Opportunities for Conservation. University of Texas, Austin. http://onlinepubs.trb.org/Onlinepubs/sr/sr298kockelman.pdf.
NAHB. 2007. Construction Statistics. Washington, D.C.
Nelson, A. C. 2004. Toward a New Metropolis: The Opportunity to Rebuild America. Brookings Institution, Washington, D.C.
Nelson, A. C. 2006. Leadership in a New Era. Journal of the American Planning Association, Vol. 72, No. 4, pp. 393–405.
NRC. 2008. Transitions to Alternative Transportation Technologies—A Focus on Hydrogen. National Academy Press, Washington, D.C.
Pitkin, J., and D. Myers. 2008. U.S. Housing Trends: Generational Changes and the Outlook to 2050. Analysis and Forecasting, Inc., and School of Policy, Planning, and Development, University of Southern California. http://onlinepubs.trb.org/Onlinepubs/sr/sr298pitkin-myers.pdf.
TRB. 2005. Special Report 282: Does the Built Environment Influence Physical Activity? Examining the Evidence. National Academies, Washington, D.C.
Vyas, A., D. Santini, M. Duoba, and M. Alexander. 2008. Plug-In Hybrid Electric Vehicles: How Does One Determine Their Potential for Reducing U.S. Oil Dependence? World Electric Vehicle Journal, Vol. 2, No. 1, pp. 46–64.
Annex 5-1
Detailed Tables
ANNEX 5-1 TABLE 1 Sensitivity Analysis, 2000–2030, Changing Fuel Economy Assumptions
|
|
Year |
Base Case |
Scenario 1 |
Scenario 2 |
|
New Development |
||||
|
Assumptions |
|
|
|
|
|
Percent growth in housing units |
|
36%–46% |
36%–46% |
36%–46% |
|
Housing units (in millions) |
2000 |
105.2 |
105.2 |
105.2 |
|
2030 |
142.8–153.2 |
142.8–153.2 |
142.8–153.2 |
|
|
Percent of 2030 units new and replacement |
|
32%–37% |
32%–37% |
32%–37% |
|
New and replacement units (in millions) |
2030 |
45.8–56.7 |
45.8–56.7 |
45.8–56.7 |
|
Percent of new and replacement units compact |
|
0% |
25% |
75% |
|
New and replacement units compact (in millions) |
2030 |
0.0–0.0 |
11.5–14.2 |
34.4–42.5 |
|
Changes in VMT |
||||
|
Assumptions |
|
|
|
|
|
Percent change in VMT/household in existing development |
|
0% |
0% |
0% |
|
VMT/household in existing development |
2000 |
21,187 |
21,187 |
21,187 |
|
2030 |
21,187 |
21,187 |
21,187 |
|
|
Percent change in VMT/household in new noncompact development |
|
|
8.4% |
17.5% |
|
VMT/household in new noncompact development |
2030 |
|
22,967a |
24,895a |
|
|
Year |
Base Case |
Scenario 1 |
Scenario 2 |
|
Percent reduction in VMT/household in new compact development |
|
|
−12% |
−25% |
|
VMT/household in new compact development |
2030 |
|
20,211b |
18,671b |
|
Results |
|
|
|
|
|
Percent change in VMT between 2000 and 2030 |
|
39.4%–50.2% |
38.0%–48.4% |
|
|
VMT (in billions of miles) |
2000 |
2,228.9 |
2,228.9 |
|
|
2030 (1)c |
3,106.9–3,346.8 |
3,075.4–3,307.7 |
|
|
|
|
43.4%–55.1% |
|
33.8%–43.2% |
|
|
2000 |
2,228.9 |
|
2,228.9 |
|
|
2030 (2)d |
3,195.1–3,456.1 |
|
2,981.6–3,191.4 |
|
|
Percent change in VMT in 2030 from base case |
|
−1.0% to −1.2% |
−6.7% to −7.7% |
|
|
Change in VMT from base case (in billions of miles) |
2030 |
–31.5 to −39.1 |
−213.5 to −264.7 |
|
|
Changes in Energy Use and CO2Emissions |
||||
|
Assumptions |
|
|
|
|
|
Percent change in fleet mpg by 2030 |
103.6% |
103.6% |
103.6% |
|
|
Fleet mpg |
2000 |
19.5 |
19.5 |
19.5 |
|
2030 |
39.7c |
39.7c |
39.7c |
|
|
Percent change in carbon content of fuel between 2000 and 2030 |
0% |
0% |
0% |
|
|
Results |
|
|
|
|
|
Percent change in fuel use between 2000 and 2030 |
|
−31.5% to −26.2% |
−32.2% to −27.1% |
|
|
|
Year |
Base Case |
Scenario 1 |
Scenario 2 |
|
Fuel use (in billions of gallons) |
2000 |
114.3 |
114.3 |
|
|
2030 (1)c |
78.3–84.3 |
77.5–83.3 |
|
|
|
|
−29.6% to −23.8% |
|
−34.3% to −29.7% |
|
|
2000 |
114.3 |
|
114.3 |
|
|
2030 (2)d |
80.5–87.1 |
|
75.1–80.4 |
|
|
Percent change in fuel use in 2030 from base case |
|
|
−1.0% to −1.2% |
−6.7% to −7.7% |
|
Change in fuel use from base case (in billions of gallons) |
2030 |
|
−0.8 to −0.9 |
−6.9 to −6.7 |
|
Percent change in CO2 emissions between 2000 and 2030 |
|
−31.5% to −26.2% |
−32.2% to −27.2% |
|
|
CO2 emissions (millions of metric tons) |
2000 |
1,006 |
1,006 |
|
|
2030 (1)c |
689–742 |
682–733 |
|
|
|
|
−29.6% to −23.8% |
|
−34.3% to −29.7% |
|
|
2000 |
1,006 |
|
1,006 |
|
|
2030 (2)d |
708–766 |
661–707 |
||
|
Percent change in CO2 emissions from base case |
|
|
−1.0% to −1.2% |
−6.7% to −7.7% |
|
Change in CO2 emissions from base case (millions of metric tons) |
2030 |
|
−7 to −9 |
−47 to −59 |
|
aIn Scenario 1, VMT per household in new noncompact developments is assumed to be 8.4 percent higher (12 percent × .70) than the average for existing households, or 22,967 (21,187 × 1.084) VMT per household per year. In Scenario 2, VMT per household in new noncompact developments is assumed to be 17.5 percent higher (25 percent × .70) than the average for existing households, or 24,895 (21,187 × 1.175) VMT per household per year. bIn Scenario 1, VMT per household in new compact developments is assumed to be 12 percent less than the baseline of new noncompact development households, or 20,211 (22,967 × .88). In Scenario 2, VMT per household in new compact developments is assumed to be 25 percent less than the baseline of new noncompact development households, or 18,671 (24,895 × .75). cThe baseline projections for 2030 reflect the assumptions described in Footnote a. dThe baseline projections for 2030 reflect the assumptions described in Footnote b. |
||||
ANNEX 5-1 TABLE 2 Sensitivity Analysis, 2000–2050, Changing Fuel Economy Assumptions
|
|
Year |
Base Case |
Scenario 1 |
Scenario 2 |
|
New Development |
||||
|
Assumptions |
|
|
|
|
|
Percent growth in housing units |
42.5%–82.5% |
42.5%–82.5% |
42.5%–82.5% |
|
|
Housing units (in millions) |
2000 |
105.2 |
105.2 |
105.2 |
|
2050 |
152.8–192.0 |
152.8–192.0 |
152.8–192.0 |
|
|
Percent of 2050 units new and replacement |
|
40.8%–54.9% |
40.8%–54.9% |
40.8%–54.9% |
|
New and replacement units (in millions) |
2050 |
62.4–105.4 |
62.4–105.4 |
62.4–105.4 |
|
Percent of new and replacement units compact |
|
0% |
25% |
75% |
|
New and replacement units compact (in millions) |
2050 |
0.0–0.0 |
15.6–25.8 |
46.8–78.4 |
|
Changes in VMT |
||||
|
Assumptions |
|
|
|
|
|
Percent change in VMT/household in existing development |
|
0% |
0% |
0% |
|
VMT/household in existing development |
2000 |
21,187 |
21,187 |
21,187 |
|
2050 |
21,187 |
21,187 |
21,187 |
|
|
Percent change in VMT/household in new noncompact development |
|
|
8.4% |
17.5% |
|
VMT/household in new noncompact development |
2050 |
|
22,967a |
24,895a |
|
Percent reduction in VMT/household in new compact development |
|
|
−12% |
−25% |
|
|
Year |
Base Case |
Scenario 1 |
Scenario 2 |
|
VMT/household in new compact development |
2050 |
|
20,211b |
18,671b |
|
Results |
|
|
|
|
|
Percent change in VMT between 2000 and 2050 |
|
50.2%–90.9% |
48.3%–87.7% |
|
|
VMT (in billions of miles) |
2000 |
2,228.9 |
2,228.9 |
|
|
2050 (1)c |
3,348.5–4,255.4 |
3,305.5–4,182.8 |
|
|
|
|
55.6%–100% |
|
42.6%–78% |
|
|
2000 |
2,228.9 |
|
2,228.9 |
|
|
2050 (2)d |
3,468.9–4,458.6 |
|
3,177.4–3,966.8 |
|
|
Percent change in VMT in 2050 from base case |
|
|
−1.3% to −1.7% |
−8.4% to −11.0% |
|
Change in VMT from base case (in billions of miles) |
2050 |
|
−43.0 to −72.6 |
−291.5 to −491.8 |
|
Changes in Energy Use and CO2 Emissions |
||||
|
Assumptions |
|
|
|
|
|
Percent change in fleet mpg by 2050 |
|
193.8% |
193.8% |
193.8% |
|
Fleet mpg |
2000 |
19.5 |
19.5 |
19.5 |
|
2050 |
57.3e |
57.3e |
57.3e |
|
|
Percent change in carbon content of fuel between 2000 and 2050 |
|
0% |
0% |
0% |
|
Results |
|
|
|
|
|
Percent change in fuel use between 2000 and 2050 |
−48.9% to −35% |
−49.5% to −36.1% |
|
|
|
Fuel use (in billions of gallons) |
2000 |
114.3 |
114.3 |
|
|
2050 (1)c |
58.4–74.3 |
57.7–72.9 |
|
|
|
|
−47% to −31.9% |
−51.5% to −39.4% |
||
|
2000 |
114.3 |
|
114.3 |
|
|
2050 (2)d |
60.5–77.8 |
|
55.4–69.2 |
|
|
|
Year |
Base Case |
Scenario 1 |
Scenario 2 |
|
Percent change in fuel use in 2050 from base case |
|
|
−1.3% to −1.7% |
−8.4% to −11.0% |
|
Change in fuel use from base case (in billions of gallons) |
2050 |
|
−0.8 to −1.3 |
−5.1 to −8.6 |
|
Percent change in CO2 emissions between 2000 and 2050 |
|
−48.9% to −35% |
−49.5% to −36.1% |
|
|
CO2 emissions (millions of metric tons) |
2000 |
1,006 |
1,006 |
|
|
2050 (1)c |
514–654 |
508–642 |
|
|
|
|
−47% to −31.9% |
|
−51.5% to −39.4% |
|
|
2000 |
1,006 |
|
1,006 |
|
|
2050 (2)d |
533–685 |
488–609 |
||
|
Percent change in CO2 emissions from base case |
|
|
−1.3% to −1.7% |
−8.4% to −11.0% |
|
Change in CO2 emissions from base case (millions of metric tons) |
2050 |
|
−7 to −11 |
−45 to −76 |
|
aIn Scenario 1, VMT per household in new noncompact developments is assumed to be 8.4 percent higher (12 percent × .70) than the average for existing households, or 22,967 (21,187 × 1.084) VMT per household per year. In Scenario 2, VMT per household in new noncompact developments is assumed to be 17.5 percent higher (25 percent × .70) than the average for existing households, or 24,895 (21,187 × 1.175) VMT per household per year. bIn Scenario 1, VMT per household in new compact developments is assumed to be 12 percent less than the baseline of new noncompact development households, or 20,211 (22,967 × .88). In Scenario 2, VMT per household in new compact developments is assumed to be 25 percent less than the baseline of new noncompact development households, or 18,671 (24,895 × .75). cThe baseline projections for 2050 reflect the assumptions described in Footnote a. dThe baseline projections for 2050 reflect the assumptions described in Footnote b. eAssumes more aggressive fuel economy improvements. Average fleetwide on-road fuel economy reaches 57.3 mpg by 2050 rather than 32.9 mpg, an increase of 193.8 percent versus 68.7 percent over mpg in 2000 (see text and NRC 2008 for discussion of high-efficiency fuel assumptions). |
||||
ANNEX 5-1 TABLE 3 Sensitivity Analysis, 2000–2030, Changing VMT Assumptions
|
|
Year |
Base Case |
Scenario 1 |
Scenario 2 |
|
New Development |
||||
|
Assumptions |
|
|
|
|
|
Percent growth in housing units |
|
36%–46% |
36%–46% |
36%–46% |
|
Housing units (in millions) |
2000 |
105.2 |
105.2 |
105.2 |
|
2030 |
142.8–153.2 |
142.8–153.2 |
142.8–153.2 |
|
|
Percent of 2030 units new and replacement |
|
32%–37% |
32%–37% |
32%–37% |
|
New and replacement units (in millions) |
2030 |
45.8–56.7 |
45.8–56.7 |
45.8–56.7 |
|
Percent of new and replacement units compact |
|
0% |
25% |
75% |
|
New and replacement units compact (in millions) |
2030 |
0.0–0.0 |
11.5–14.2 |
34.4–42.5 |
|
Changes in VMT |
||||
|
Assumptions |
|
|
|
|
|
Percent change in VMT/household in existing development |
|
7.8% |
7.8% |
7.8% |
|
VMT/household in existing development |
2000 |
21,187 |
21,187 |
21,187 |
|
2030 |
22,835 |
22,835 |
22,835 |
|
|
Percent change in VMT/household in new noncompact development |
|
|
8.4% |
17.5% |
|
VMT/household in new noncompact development |
2000 |
|
22,967a |
24,895a |
|
2030 |
|
24,753 |
26,831 |
|
|
Percent reduction in VMT/household in new compact development |
|
|
−12% |
−25% |
|
|
Year |
Base Case |
Scenario 1 |
Scenario 2 |
|
VMT/household in new compact development |
2000 |
|
20,211b |
18,671b |
|
2030 |
|
21,783 |
20,123 |
|
|
Results |
|
|
|
|
|
Percent change in VMT between 2000 and 2030 |
|
39.4%–61.8% |
38.0%–59.9% |
|
|
VMT (in billions of miles) |
2000 |
2,228.9 |
2,228.9 |
|
|
2030 (1)c |
3,106.9–3,607.1 |
3,075.4–3,565.0 |
|
|
|
|
54.5%–67.1% |
|
44.2%–54.1% |
|
|
2000 |
2,228.9 |
|
2,228.9 |
|
|
2030 (2)d |
3,443.6–3,724.9 |
|
3,213.5–3,439.6 |
|
|
Percent change in VMT in 2030 from base case |
|
|
−1.0% to −1.2% |
−6.7% to −7.7% |
|
Change in VMT from base case (in billions of miles) |
2030 |
|
−31.5 to −42.1 |
−230.1 to −285.3 |
|
Changes in Energy Use and CO2Emissions |
||||
|
Assumptions |
|
|
|
|
|
Percent change in fleet mpg by 2030 |
|
58.5% |
58.5% |
58.5% |
|
Fleet mpg |
2000 |
19.5 |
19.5 |
19.5 |
|
2030 |
30.9 |
30.9 |
30.9 |
|
|
Percent change in carbon content of fuel between 2000 and 2030 |
|
0% |
0% |
0% |
|
Results |
|
|
|
|
|
Percent change in fuel use between 2000 and 2030 |
|
−12.0% to +2.1% |
−12.9% to +0.9% |
|
|
Fuel use (in billions of gallons) |
2000 |
114.3 |
114.3 |
|
|
2030 (1)c |
100.5–116.7 |
99.5–115.4 |
|
|
|
|
−2.5% to +5.5% |
|
−9.0% to −2.6% |
|
|
2000 |
114.3 |
|
114.3 |
|
|
2030 (2)d |
111.4–120.5 |
|
104.0–111.3 |
|
|
|
Year |
Base Case |
Scenario 1 |
Scenario 2 |
|
Percent change in fuel use in 2030 from base case |
|
|
−1.0% to −1.2% |
−6.7% to −7.7% |
|
Change in fuel use from base case (in billions of gallons) |
2030 |
|
−1.0 to −1.3 |
−7.4 to −9.2 |
|
Percent change in CO2 emissions between 2000 and 2030 |
|
−12.0% to +2.1% |
−12.9% to +0.9% |
|
|
CO2 emissions (millions of metric tons) |
2000 |
1,006 |
1,006 |
|
|
2030 (1)c |
885–1,027 |
876–1,015 |
|
|
|
|
−2.5% to +5.5% |
|
−9.0% to −2.6% |
|
|
2000 |
1,006 |
|
1,006 |
|
|
2030 (2)d |
981–1,061 |
|
915–980 |
|
|
Percent change in CO2 emissions from base case |
|
|
−1.0% to −1.2% |
−6.7% to −7.7% |
|
Change in CO2 emissions from base case (millions of metric tons) |
2030 |
|
−8.9 to −12 |
−66 to −81 |
|
aIn Scenario 1, VMT per household in new noncompact developments is assumed to be 8.4 percent higher (12 percent × .70) than the average for existing households, or 22,967 (21,187 × 1.084) VMT per household per year. In Scenario 2, VMT per household in new noncompact developments is assumed to be 17.5 percent higher (25 percent × .70) than the average for existing households, or 24,895 (21,187 × 1.175) VMT per household per year. bIn Scenario 1, VMT per household in new compact developments is assumed to be 12 percent less than the baseline of new noncompact development households, or 20,211 (22,967 × .88). In Scenario 2, VMT per household in new compact developments is assumed to be 25 percent less than the baseline of new noncompact development households, or 18,671 (24,895 × .75). cThe baseline projections for 2030 reflect the assumptions described in Footnote a. dThe baseline projections for 2030 reflect the assumptions described in Footnote b. |
||||
ANNEX 5-1 TABLE 4 Sensitivity Analysis, 2000–2050, Changing VMT Assumptions
|
|
Year |
Base Case |
Scenario 1 |
Scenario 2 |
|
New Development |
||||
|
Assumptions |
|
|
|
|
|
Percent growth in housing units |
|
42.5%–82.5% |
42.5%–82.5% |
42.5%–82.5% |
|
Housing units (in millions) |
2000 |
105.2 |
105.2 |
105.2 |
|
2050 |
152.8–192.0 |
152.8–192.0 |
152.8–192.0 |
|
|
Percent of 2050 units new and replacement |
|
40.8–54.9% |
40.8–54.9% |
40.8–54.9% |
|
New and replacement units (in millions) |
2050 |
62.4–105.4 |
62.4–105.4 |
62.4–105.4 |
|
Percent of new and replacement units compact |
|
0% |
25% |
75% |
|
New and replacement units compact (in millions) |
2050 |
0.0–0.0 |
15.6–25.8 |
46.8–78.4 |
|
Changes in VMT |
||||
|
Assumptions |
|
|
|
|
|
Percent change in VMT/household in existing development |
|
13.3% |
13.3% |
13.3% |
|
VMT/household in existing development |
2000 |
21,187 |
21,187 |
21,187 |
|
2050 |
24,004 |
24,004 |
24,004 |
|
|
Percent change in VMT/household in new noncompact development |
|
|
8.4% |
17.5% |
|
VMT/household in new noncompact development |
2000 |
|
22,967a |
24,895a |
|
2050 |
|
26,021 |
28,205 |
|
|
Percent reduction in VMT/household in new compact development |
|
|
−12% |
−25% |
|
|
Year |
Base Case |
Scenario 1 |
Scenario 2 |
|
VMT/household in new compact development |
2000 |
|
20,211b |
18,671b |
|
2050 |
|
22,898 |
21,154 |
|
|
Results |
|
|
|
|
|
Percent change in VMT between 2000 and 2050 |
|
70.2%–116.3% |
68.0%–112.6% |
|
|
VMT (in billions of miles) |
2000 |
2,228.9 |
2,228.9 |
|
|
2050 (1)c |
3,793.7–4,821.3 |
3,745.0–4,739.0 |
|
|
|
|
76.3%–126.6% |
|
61.5%–101.6% |
|
|
2000 |
2,228.9 |
|
2,228.9 |
|
|
2050 (2)d |
3,930.1–5,051.4 |
|
3,599.9–4,494.2 |
|
|
Percent change in VMT in 2050 from base case |
|
|
−1.3% to −1.7% |
−8.4% to −11.0% |
|
Change in VMT from base case (in billions of miles) |
2050 |
|
−48.7 to −82.3 |
−330.2 to −557.2 |
|
Changes in Energy Use and CO2Emissions |
||||
|
Assumptions |
|
|
|
|
|
Percent change in fleet mpg by 2050 |
|
68.7% |
68.7% |
68.7% |
|
Fleet mpg |
2000 |
19.5 |
19.5 |
19.5 |
|
2050 |
32.9 |
32.9 |
32.9 |
|
|
Percent change in carbon content of fuel between 2000 and 2050 |
|
0% |
0% |
0% |
|
Results |
|
|
|
|
|
Percent change in fuel use between 2000 and 2050 |
|
+0.9% to +28.2% |
−0.4% to +26% |
|
|
Fuel use (in billions of gallons) |
2000 |
114.3 |
114.3 |
|
|
2050 (1)c |
115.3–146.5 |
113.8–144 |
|
|
|
|
+4.5% to +34.3% |
|
−4.3% to +19.5% |
|
|
2000 |
114.3 |
|
119.5 |
|
|
2050 (2)d |
119.4–153.5 |
|
109.4–136.6 |
|
|
|
Year |
Base Case |
Scenario 1 |
Scenario 2 |
|
Percent change in fuel use in 2050 from base case |
|
|
−1.3% to −1.7% |
−8.4% to −11.0% |
|
Change in fuel use from base case (in billions of gallons) |
2050 |
|
−1.5 to −2.5 |
−10 to −16.9 |
|
Percent change in CO2 emissions between 2000 and 2050 |
|
+0.9% to +28.2% |
−0.4% to +26% |
|
|
CO2 emissions (millions of metric tons) |
2000 |
1,006 |
1,006 |
|
|
2050 (1)c |
1,015–1,290 |
1,002–1,268 |
|
|
|
|
+4.5% to +34.3% |
|
−4.3% to +19.5% |
|
|
2000 |
1,006 |
|
1,006 |
|
|
2050 (2)d |
1,051–1,351 |
|
963–1,202 |
|
|
Percent change in CO2 emissions from base case |
|
|
−1.3% to −1.7% |
−8.4% to −11.0% |
|
Change in CO2 emissions from base case (millions of metric tons) |
2050 |
|
−13 to −22 |
−88 to −149 |
|
aIn Scenario 1, VMT per household in new noncompact developments is assumed to be 8.4 percent higher (12 percent × .70) than the average for existing households, or 22,967 (21,187 × 1.084) VMT per household per year. In Scenario 2, VMT per household in new noncompact developments is assumed to be 17.5 percent higher (25 percent × .70) than the average for existing households, or 24,895 (21,187 × 1.175) VMT per household per year. bIn Scenario 1, VMT per household in new compact developments is assumed to be 12 percent less than the baseline of new noncompact development households, or 20,211 (22,967 × .88). In Scenario 2, VMT per household in new compact developments is assumed to be 25 percent less than the baseline of new noncompact development households, or 18,671 (24,895 × .75). cThe baseline projections for 2050 reflect the assumptions described in Footnote a. dThe baseline projections for 2050 reflect the assumptions described in Footnote b. |
||||
ANNEX 5-1 TABLE 5 Savings Calculations in Energy Use and CO2Emissions from Improved Residential Energy Efficiency with More Compact Growth


