
3
Impacts of Land Use Patterns on Vehicle Miles Traveled Evidence from the Literature
The congressional request for this study asks for consideration of “the correlation, if any, between land development patterns and increases in vehicle miles traveled (VMT),” implying that sprawl induces more travel. This chapter summarizes what is known from the literature about the effect of changes in the built environment—in particular, more compact, mixed-use development—on VMT. It starts with a brief discussion of the built environment–VMT connection. It then examines issues related to research design and data that help explain the variability in study results. Drawing on a paper commissioned by the committee (Brownstone 2008) and earlier reviews of the literature, the main section of the chapter summarizes the results of the most methodologically sound studies that examine the relationship between household travel and the built environment while controlling for socioeconomic variables and other factors (e.g., attitudes, preferences) that influence travel behavior. Few of these studies, however, consider the potential effects on VMT of a package of policies that combine increased density with higher employment concentrations, improved access to a mix of diverse destinations, a good transit network, and parking charges. The potential synergies of these policies for VMT reduction are discussed next through two case studies that demonstrate what can be accomplished but also underscore the associated challenges and costs. The final section presents a series of findings. Additional detail on the two case studies is provided in Annex 3-1.
THE BUILT ENVIRONMENT–VMT CONNECTION
Chapters 1 and 2 describe the dimensions of the built environment (land use) and transportation networks that are believed to affect VMT. The built environment dimensions include density, mix or diversity of land uses, concentration of development into centers, spatial arrangement of land uses, and design. The transportation network dimensions include the spatial patterns of the transportation system (whether the networks are sparse or dense, gridlike or hierarchical). Together, the land use and transportation network measures interact to affect destination accessibility (ease of travel between trip origins and desired destinations) and distance between development and transit. These dimensions are referred to in the literature as “the D’s” (see Box 3-1). A final set of characteristics—travel demand—can complement the first two, particularly through pricing.
Density is probably the most studied land use dimension, in part because it is readily measured. However, the effect of higher densities on VMT is not entirely straightforward, making it difficult to determine the net reduction in automobile use from increased densities. For example, trip frequencies may increase if desired destinations are closer and easier to access. Shifts to other modes, such as transit, require that transit services be available and that density thresholds be sufficient to support adequate and reliable service. VMT itself is a composite measure—the product of trip length, trip frequency, and mode choice (Ewing and Cervero 2001).
Moreover, increasing density alone may not be sufficient to lower VMT by a significant amount. A diversity of land uses that results in locating desired destinations, such as jobs and shopping, near housing (preferably in centers) and improved accessibility to these destinations from either home or work are also necessary. Development designs and street networks that provide good connectivity between locations and accommodate nonvehicular travel are important. Finally, demand management policies that complement efforts to lower VMT,
|
Box 3-1 THE FIVE D ’s Land development patterns that describe the built environment, particularly in the context of those features that encourage more compact development, have come to be characterized in the literature by the shorthand of “the D’s.” The initial three D’s, first used by Cervero and Kockelman (1997), have now been expanded to five:
|
such as establishing maximum rather than minimum parking requirements and introducing market-based parking fees, are also needed. As will be shown, however, few studies include many or all of these dimensions.
Even if it can be demonstrated that more compact, mixed-use development is associated with lower VMT, encourages mode shifts, and
lessens trip making by automobile, it is important to know the magnitude of these effects and whether they are of sufficient size to be relevant to policy. Researchers often use elasticities as a way of reporting the size of effects.1 Thus, for a percentage increase in density—say, for example, a 100 percent increase in or a doubling of density (the independent variable)—they estimate the corresponding percentage reduction in VMT (the dependent variable). Relatively few of the studies reviewed in this chapter estimate elasticities, but they are reported when available.
It should also be noted that changes in the built environment, such as increased density, do not directly “cause” reductions in VMT. Rather, the built environment, as represented by residential and employment density and neighborhood or employment center design, provides the context for behavioral decisions regarding location choice (e.g., residence and jobs), automobile ownership, and travel modes that are also strongly affected by income, age, household size, and other socioeconomic variables (Badoe and Miller 2000). Measuring and controlling for these effects empirically raises significant issues with respect to research methods and data, which are addressed in the following section.
ISSUES RELATED TO RESEARCH DESIGN AND DATA
This section reviews issues of aggregate versus disaggregate analyses, cross-sectional versus longitudinal studies, self-section and causality, measurement and scale, and generalizability that are important in understanding the variable results of studies of the relationship between more compact, mixed-use development and VMT.
Aggregate Versus Disaggregate Analyses
Worldwide attention was drawn to the relationship between urban form and automobile dependence through a series of books and articles by Newman and Kenworthy (1989, 1999, 2006). In their 1989 cross-national comparison of 32 cities,2 these authors showed that per capita gasoline consumption—a proxy for automobile use—is far higher in U.S. cities than abroad, a fact the authors attribute to lower metropolitan densities in the United States. A follow-on study of 37 cities in 1999 directly linked low-density cities, particularly in the United States and Australia, to higher per capita VMT. Notwithstanding the problems of attempting to translate experience from abroad to the United States because of substantial differences in public preferences, laws and regulations governing land development, fuel prices, income levels, and the supply of alternative modes of travel to the automobile, the Newman and Kenworthy studies illustrate the methodological problem of analyses that rely on aggregate data to draw simple cross-sectional correlations without controlling for other variables that affect VMT (see Gómez-Ibáñez 1991 and Brownstone 2008).
Aggregate analyses such as Newman and Kenworthy’s mask real differences in densities within metropolitan areas, as well as in the travel behavior of subpopulations, that vary on the basis of socioeconomic characteristics. For example, central cities may house dis-
proportionate shares of lower-income residents, who are less able to afford owning and operating an automobile, and younger people and older households without children whose travel is below average. On the other hand, suburban areas tend to include a disproportionate share of families, who are often in higher-income groups with higher levels of automobile ownership and travel demands for jobs, education, and extracurricular events.
Another well-known study (Holtzclaw et al. 2002) analyzes automobile ownership and use, controlling for socioeconomic variables, with results that corroborate the findings of Newman and Kenworthy. The authors use traffic zones3 within three metropolitan areas—Chicago, Los Angeles, and San Francisco—as the geographic unit of analysis, control for household size and income effects, and draw on odometer readings (as captured by legally mandated smog checks) rather than self-reported diaries to measure VMT.4 They find that both automobile ownership and use decline in a systematic and predictable pattern as a function of increasing residential density. These findings, however, are subject to many of the flaws of aggregate analyses. The travel analysis zones are large, with an average size of 7,000 residents per zone; limited socioeconomic variables are available at the zonal level; and key avail able control variables, such as income, are measured on a per capita basis. The result is to mask potentially important variability within zones, particularly with respect to household size and income differences, that could help explain automobile ownership and use patterns (Brownstone 2008). In addition, several of the independent variables are highly correlated (e.g., density measures, transit access, local shopping, center proximity, and pedestrian and bicycle friendliness), making it difficult to identify their separate effects (Holtzclaw et al. 2002).
A more recent, widely circulated book, Growing Cooler (Ewing et al. 2007), includes an ambitious effort to model the effect of land use on VMT by using structural equations modeling. Two models are estimated—a cross-sectional model based on 84 urbanized areas in 2005 and a longitudinal model of the same urbanized areas for the two 10-year periods between 1985 and 2005. The data set, assembled by the Texas Transportation Institute, includes population density, highway lane miles, transit revenue miles, and real fuel prices. The authors find that greater population density, among other variables, has a negative influence on VMT. They estimate elasticities of a 0.213 percent reduction in VMT from a 1 percent increase in population density on the basis of their cross-sectional model and a 0.152 percent reduction in VMT from a 1 percent increase in population density on the basis of their longitudinal model (Ewing et al. 2007, 123). However, the coarseness of the level of analysis (urbanized area), the quality of the data, and questions about their model specification limit the reliability of these results.5
To minimize or eliminate the aggregation issues that cloud the relationship between the built environment and travel behavior, many studies use disaggregate data—household-level travel data and neighborhood-, census tract–, or zip code–level data on the built environment—in regression models, controlling for a much richer combination of socioeconomic variables available at the household level. However, these studies are also subject to research design and data issues discussed below, which may help explain the wide range of their results.
Cross-Sectional Versus Longitudinal Studies
Most of the studies reviewed for this report are cross-sectional; that is, they examine the relationship between the built environment and VMT at a single point in time. Many of the studies use regression analysis to hold constant demographic and socioeconomic variables to isolate the variables of interest. Cross-sectional studies may find a statistically significant correlation between the built environment and VMT. Well-specified analyses that use disaggregate data from metropolitan areas and carefully control for socioeconomic variables and other factors that affect residential location and travel choices are valuable. Nevertheless, they cannot be used to determine the temporal relation between variables, and evidence of cause and effect cannot be assumed.
Establishing causal relationships more reliably requires a longitudinal approach, typically collecting panel data and following households over time. This research is time-consuming and expensive—several decades of data may be needed to observe large enough changes in the built environment. It is also challenging as other factors are likely to change during that time period (i.e., household characteristics, such as household size, ages of its members, income, employment and marital status), thus affecting the results. For these reasons, with the few exceptions noted in the following section, most studies have not adopted a longitudinal approach.
Self-Selection and Causality
One of the main issues that confounds study results, particularly for studies of the effects of the built environment on travel at the neighborhood or other microscale level, is self-selection. Boarnet and Crane (2001), among others, note that the observed correlation between higher-density neighborhoods and less automobile travel may be due in part to the fact that some residents who dislike driving and prefer transit or walking or bicycling may have self-selected into neighborhoods
where these travel options are available. To the extent that this is true, the causal link between density and reduced automobile travel may in reality be weaker than it appears.
The question of what difference it makes whether the effect is directly one of the built environment or of people choosing to live in certain environments is often raised. Either way, the built environment clearly has an influence. The reason the distinction matters is the need to predict with some degree of accuracy the impact of substantial changes in the built environment on travel behavior. If future policies encourage a dramatic increase in the number of people living in compact, mixed-use areas but the increase is due primarily to policy incentives or to a limited supply of compact developments rather than to an intrinsic desire to live in such areas, the VMT reductions for those responding to such policies will probably not be as great as for those actively preferring to live in such areas. Thus, if one does not account for self-selection, the impacts of an aggressive land use policy could be overestimated, and the opportunity costs of such an outcome could be high.
It is true that, over time, the built environment (e.g., living in more compact, mixed-use developments) and travel behavior (e.g., taking transit because it is convenient) could influence attitudes to be more consonant with such an environment, which in turn could reinforce the travel behavior most suited to that environment. However, it is also possible for dissonance between one’s environment and preferences to increase over time and eventually prompt a move to a residential location more consonant with one’s predispositions. The fact that researchers do not have a good sense of which of these two outcomes dominates, and under what circumstances, points to the need for additional longitudinal research into changes in the relationship among attitudes, the built environment, and travel behavior (as well as sociodemographic characteristics) over time.
To solve the self-selection problem, researchers ideally would randomly assign households to treatment and control groups to observe
their behavior—a method used in the medical profession in clinical trials for drug testing. Of course, assigning households to neighborhoods with different characteristics and observing their travel behavior is not feasible, so researchers have adopted numerous other methods for controlling for self-selection. Boarnet and Sarmiento (1998), for example, use instrumental variables6 to control for choice of residential location in studying how what they term “neotraditional neighborhoods” affect nonwork automobile trip generation. They find a statistically significant negative association between retail employment density (measured at the zip code level) and nonwork automobile trips after controlling for residential location choices. This finding is replicated in a subsequent study (Boarnet and Greenwald 2000) using Portland, Oregon, data. Applying a similar approach, a more recent German study (Vance and Hedel 2007) finds statistically significant effects of commercial density, road density, and walking time to public transit on daily weekday travel, perhaps reflecting the higher densities and better access to transit of German cities (Brownstone 2008). Brownstone and Golob (2009) use a simultaneous equations model7 to control for self-selection and a broad set of socioeconomic variables and find a statistically signifi-
cant but small remaining effect of the built environment on VMT and fuel use.
Still other studies deal with the self-selection issue by attempting to measure preferences through attitude surveys in addition to controlling for residential location type. Bagley and Mokhtarian (2002) find little remaining effect of neighborhood type on VMT after controlling for attitudes, lifestyle preferences, and sociodemographic variables. In contrast, using a survey of neighborhood preferences and attitudes in Atlanta, Frank et al. (2007) find, after controlling for demographic variables, that survey participants who lived in walkable neighborhoods drove less than those living in automobile-oriented neighborhoods, regardless of whether they preferred this neighborhood type.8
A final approach attempts to control for self-selection by looking at households that move, comparing their travel behavior before and after moving to a more compact neighborhood. Using data from the Puget Sound Transportation Panel, Krizek (2003) examines the travel behavior of a sample of households that moved to neighborhoods with higher local accessibility during 1989–1997. He finds that, all else being equal, the movers significantly reduced vehicle and person miles traveled, although they took more trip tours.9 Krizek estimates a decrease of about 5 VMT per day per household that moved to a neighborhood with better accessibility, not as large as the estimate of Frank et al.
Measurement and Scale
Measurement issues—in particular, use of different measures of the built environment and travel—as well as the scale of analysis may also help explain why study results differ.
Measuring the Built Environment
Researchers are still attempting to identify and measure characteristics of the built environment with the greatest impact on travel behavior. Researchers have often selected easy-to-measure characteristics, such as residential or employment densities. But density may well be a proxy for other variables, such as distance from trip origins to destinations, car ownership levels, and transit service quality (Boarnet and Crane 2001). Several measures, including diversity (mix of land uses), design, and the other five D’s (see Box 3-1), are needed to capture their combined effect on travel behavior. Objective measures are important because they can be readily quantified and verified. Subjective measures, such as individuals’ perceptions of neighborhood safety and the quality of amenities that encourage them to walk and cycle, are also important. But many subjective measures, such as the walkability of a neighborhood or other design variables, are difficult to characterize in consistent, quantifiable ways.
Measuring Travel
Studies that examine the relationship between the built environment and travel often measure very different aspects of travel, with differing results. Researchers may study trip lengths, trip frequencies, and mode choice, and they may include automobile ownership under a broad definition of travel. Reducing VMT could be achieved by affecting each of these factors: (a) reducing trip lengths, (b) reducing trip frequencies, (c) reducing travel by automobile (mode shift), and (d) reducing the number of cars per household. The question is how more compact devel-
opment affects each of these factors. The results are likely to differ for each variable. For example, by decreasing distances between origins and destinations, higher densities should reduce trip lengths, all else being equal, but could work in the opposite direction for trip frequencies, depending on the time-cost of travel (Crane 2000).10 Mode choice, particularly the decision to use transit, depends on threshold density levels adequate to support good transit service, as well as on socioeconomic variables (Ewing and Cervero 2001). Finally, automobile ownership levels, while highly correlated with density, are typically a function of socioeconomic characteristics first, and secondarily a function of location characteristics (Ewing and Cervero 2001). Thus, travel is not a monolithic variable to be affected by different density levels.
Scale of Analysis
Scale issues are also important. Measures of the built environment that influence VMT within a neighborhood are likely to differ from those that reduce VMT in a region. For example, local trips, particularly by non-motorized modes, are likely to be influenced by neighborhood design (e.g., walkability, safety) and the number of desirable destinations (e.g., local shopping, restaurants, schools) in close proximity. In contrast, travel to regional destinations—deciding whether to drive or take transit to work or travel to a major shopping center—is determined primarily by the location of jobs and shopping destinations in a region relative to a household’s residence (jobs–housing balance), the accessibility of transit at both trip origin and destination, and parking charges at the destination.
The magnitude of changes in travel behavior resulting from changes in the built environment also depends on scale. For example, high-
density neighborhood development near an extensive transit system may result in large mode shifts to transit. The overall impact of these effects, however, must be examined from the perspective of the share of all trips and travel in a region represented by transit. Improved accessibility and jobs–housing balance in a region could result in much larger reductions in VMT than changes at the neighborhood level. For example, using data from the San Francisco Bay Area, Cervero and Duncan (2006) find that improving the jobs–housing balance in the region had a far greater effect in reducing both VMT for commuting and vehicle hours traveled (VHT) than in improving access to retail and consumer services by locating them close to residences (i.e., mixed-use development in neighborhoods).11 This finding held even after the larger share of daily VMT and VHT devoted to travel for shopping and services than to commuting was taken into account. The authors note, however, that the findings should not be interpreted as favoring a regional over a neighborhood strategy. Rather, both should be viewed as complementary land use strategies for reducing VMT and VHT.
Generalizability
Another issue that affects the findings reported in the literature, particularly studies that use disaggregate data to examine the effects of the built environment on the travel behavior of neighborhood residents, is the applicability of the findings to other settings. Neighborhoods within a particular metropolitan area rather than across areas are often selected as the unit of analysis because data may be available at a sufficiently fine-grained level. But are the characteristics of the built environment and their impact on travel behavior the same in neighborhoods in Austin (Texas) or San Francisco as are they are in neighborhoods in Atlanta or Boston? Pairing neighborhoods that have similar socioeconomic charac-
teristics but differ in the built environment (e.g., a compact, mixed-use development versus a traditional, sprawling suburban development) in a quasi treatment control group, if such a pairing can be found, is one way of handling comparability issues. Over time, as the number of reliable studies drawn from many metropolitan areas and settings accumulates, the external validity of research results should improve.
A final issue relates to whether the results of any of the studies would apply in the future. Aging of the population, growth of immigrant populations, and the potential for sustained higher energy prices in the future and new vehicle technologies could result in development and travel patterns that differ from those of today, topics that are elaborated in Chapter 4.
LITERATURE REVIEW
This section reviews in turn five comprehensive reviews of the literature produced over the past two decades; several more recent studies; and studies focused specifically on travel effects of transit-oriented development, compact development and urban truck travel, and estimation of the effects of compact development through modeling.
Comprehensive Reviews of the Literature
Over the past two decades, numerous studies have been conducted that have analyzed travel behavior while attempting to control for measures of the built environment and socioeconomic variables that also influence this behavior. Fortunately, noted scholars have conducted five comprehensive reviews of this burgeoning literature (Badoe and Miller 2000; Crane 2000; Ewing and Cervero 2001; Handy 2005; Cao et al. 2008).
Crane (2000) categorizes studies by type of research design and assesses study results in light of the strengths and weaknesses of each approach. Badoe and Miller (2000) summarize the empirical evidence concerning impacts of urban form on travel but also look at mode use
and studies of transit impacts on urban form. Ewing and Cervero (2001) review a number of studies to examine the effects of the built environment, relative to socioeconomic variables, on four travel variables: trip frequency; trip length; mode choice; and VMT or VHT, a composite of the first three. [The authors also derive elasticities to estimate the magnitude of effects of different aspects of the built environment (regional accessibility, density, diversity, and design) on vehicle trips and VMT, which are discussed later.] Handy (2005) summarizes evidence for the proposition that new urbanism design strategies will reduce automobile use.12 She comments on how well studies have sorted out the relative importance of socioeconomic characteristics and characteristics of the built environment in explaining travel behavior and addresses issues of causality, including self-selection. The review of Cao et al. (2008) focuses primarily on the issue of self-selection to determine whether the built environment has a statistically significant influence on travel behavior in those studies that control for socioeconomic characteristics and attitudes and preferences and, if so, whether the magnitude of that effect is identified.13
The findings from these reviews can be summarized with respect to two key questions, each of which is addressed below: (a) Is there a statistically significant effect of the built environment on VMT? and (b) What is the magnitude of this effect?
Significance of the Built Environment for VMT
The majority of the studies reviewed find a statistically significant effect of the built environment after controlling for socioeconomic characteristics and self-selection (see Cao et al.’s 2008 review for the latter).
However, the survey authors characterize these results as “mixed.” Crane notes, for example, the lack of “any transparent influences of the built environment on travel behavior that hold generally or that straightforwardly translate into policy prescriptions” (Crane 2000, 18). Handy concludes that “land use and design strategies … may reduce automobile use a small amount” but points to outstanding questions concerning “the degree of the connection and the direction of causality” (Handy 2005, 23, 25). Badoe and Miller (2000, 256) attribute results that vary in their robustness to weaknesses in data and methods.
Badoe and Miller (2000) and Ewing and Cervero (2001)14 attempt to parse the findings more closely to examine the relative effects of socioeconomic characteristics and the built environment, respectively, on various aspects of travel (e.g., trip length, trip frequency, mode choice), with the following results:
-
Socioeconomic characteristics (e.g., income, age, gender, occupation) have a significant impact on travel behavior and must be adequately represented at a disaggregate level in models that attempt to estimate the impact of the built environment on travel behavior. Ewing and Cervero note further that socioeconomic factors are dominant in trip frequency decisions, whereas the built environment appears to be more influential with respect to trip length; mode choice depends on both factors.
-
Density, particularly employment density at destinations, has a significant impact on mode choice, with higher transit usage and walking found in high-density employment centers. The impact of residential density is more ambiguous, particularly when socioeconomic characteristics and automobile ownership are controlled for. Ewing and Cervero note as an unresolved issue whether the impact of density on travel patterns is due to density itself or to other unobserved variables with which it is correlated, including attitudes.
-
Automobile ownership is a frequently overlooked variable that affects travel decisions. A consistent finding in the literature reviewed by Badoe and Miller is that households in higher-density neighborhoods tend to own fewer vehicles, use transit more (where available), and generate less VMT. Ewing and Cervero also point to the disutility of automobile ownership in high-density locations because of traffic congestion and limited parking.
Magnitude of Effects
The authors of the literature surveys reviewed above uncovered few studies that estimate the magnitude of the effect of the built environment on travel behavior, even when the effect is statistically significant. Ewing and Cervero (2001) take an approach different from that of the other authors: they select the best studies and, where possible, derive elasticity estimates of travel demand with respect to local density, diversity, design, and regional accessibility.15 These estimates are then input into the U.S. Environmental Protection Agency’s Smart Growth Index (SGI) Model to estimate elasticity values for each of the D’s.16 The results are small in absolute terms—a 100 percent increase in each of the first three D’s is associated with 3 to 5 percent less VMT (see Table 3-1), suggesting that scale issues are important. The authors note, however, that the results should be additive.17 It is also important to keep in
TABLE 3-1 Elasticity Estimates of Changes in VMT Relative to Changes in the Built Environment from Selected Studies and Surveys of the Literature
|
Authorship |
Built Environment Feature |
Scale |
Geographic Location |
Percentage Increase in Built Environment Feature |
Percentage Reduction in VMT |
|
Ewing and Cervero (2001, 111)a |
Density |
Neighborhood |
Multiple locations |
100 |
5 |
|
Diversity (land use mix) |
Neighborhood |
|
100 |
5 |
|
|
Design |
Neighborhood |
|
100 |
3 |
|
|
Density, diversity, and design |
Neighborhood |
|
100 |
13 |
|
|
Accessibility |
Regional |
|
100 |
20 |
|
|
Bento et al. (2005, 475–477)b |
City shape, jobs– housing balance, road density, rail supply (for rail cities)— each variable alone |
Regional |
114 U.S. MSAs |
100 |
≤7 |
|
Population centrality alone |
Regional |
114 U.S. MSAs (without New York) |
100 |
15 |
|
|
All built environment variables |
Regional |
Atlanta, GA; Boston, MA |
Various |
25 |
|
|
Brownstone and Golob (2009)c |
Density |
Regional |
California |
100 |
12 |
|
Note: MSA = metropolitan statistical area. Unless otherwise indicated, all estimates assume a doubling of the particular land use variable indicated. aEwing and Cervero’s elasticity estimates represent a midpoint or 50th percentile case. They are not averaged over the sample. Ewing and Cervero also estimate the following elasticities for reduction in vehicle trips (VT): 100 percent increase in local density reduces VT by 5 percent, local diversity does so by 3 percent, and local design does so by 5 percent (Ewing and Cervero 2001, 111). bUnclear how elasticities were calculated (i.e., point estimates or averages). cBrownstone and Golob’s elasticities are averaged over the sample. Because their model is linear for density, they are able to calculate the elasticity for a doubling of density [i.e., increasing density by 2.61 units (100 percent) of the mean reduces VMT by 2.61 × 1,171 = 3,056 miles, or about 12 percent of the mean VMT]. |
|||||
mind that few of the studies they analyze account for self-selection, which suggests that the built environment effects they find could be biased upward.
Ewing and Cervero (2001) find VMT to be influenced more strongly by regional accessibility, the fourth D, than by any of their local measures— with 20 percent lower VMT associated with a 100 percent improvement in destination accessibility (see Table 3-1).18 Badoe and Miller (2000) also stress the importance of regional accessibility, that is, how well connected a given location is with activities such as work opportunities and shopping destinations. Both studies note the futility of increasing density in the middle of nowhere as a policy to reduce VMT. Reviewers of the Ewing and Cervero work question, however, whether government policy intervention could change regional spatial patterns in any meaningful way given the strength of market forces and fragmented local control of land use, a concern that is addressed in a subsequent chapter of this report.19
Cao et al. (2008), who review 28 studies that control for self-selection, find that virtually all the studies report a statistically significant remaining influence of the built environment on travel behavior.20 However, none of the studies quantify the relative importance of the two factors (residential self-selection and the built environment) or the magnitude of the remaining built environment effect.
More Recent Studies
The literature review conducted for this study (see Brownstone 2008) identified a handful of more recent studies that carefully control for a broad range of socioeconomic variables in an effort to control for self-selection and test a number of attributes of the built environment to
determine the effect on VMT.21 Each is described in turn below, with a focus on both the statistical significance and the magnitude of effects (see also Table 3-1).
Bento et al. (2005) examine a broad range of built environment variables and socioeconomic measures to determine the effects on the annual VMT of a large sample of households living in the urbanized portion of 114 U.S. metropolitan statistical areas (MSAs). In their model, annual VMT is determined by the number of cars owned as well as the number of miles each car is driven. Measures of urban form— city shape, spatial distribution of population or population centrality, jobs–housing balance22—and the supply of public transit are combined with data on the socioeconomic characteristics23 and automobile ownership and travel patterns (i.e., annual miles driven) of households drawn from the 1990 Nationwide Personal Transportation Survey (NPTS) (Bento et al. 2005).24 The authors find that population centrality, jobs–housing balance, city shape, road density, and rail supply (for rail cities) all have a significant effect on annual household VMT.25 The magnitude of the effect of each measure is small, however; a 10 percent change in either the urban form or the transit supply variables is associated with at most a 0.7 percent change in average annual miles driven with the exception of population centrality, which is associated
with a somewhat larger 1.5 percent change (Bento et al. 2005, 475) (see Table 3-1).
Nevertheless, if measures of urban form and transit availability are considered jointly, the effects may be considerably larger. To illustrate this point, Bento et al. use their estimated model to simulate the effect of moving their sample households from an urbanized area with measures of urban form and transit supply the same as those of Atlanta, one of the most sprawled metropolitan areas, to an urbanized area with measures the same as those of Boston, one of the most compact metropolitan areas. The result of this experiment is that annual household VMT could be lowered by as much as 25 percent (Bento et al. 2005, 478) (see also Table 3-1). The outcome is attributed to differences in public transit supply, city shape, and especially population centrality between the two cities. Such a lowering in VMT should be considered as an upper bound, however. The authors themselves note that implementing the policies necessary to make Atlanta more like Boston would be costly (e.g., requiring extensive transit investments) and that it would take decades to alter urban form in any measurable way.26 Moreover, the simulation does not address behavioral issues. If typical Atlanta residents were to face the Boston environment, they would be unlikely to travel like typical Bostonians, at least in the near term.
Brownstone and Golob (2009) also use a rich set of socioeconomic variables to help control for self-selection and model the relationship among residential density, vehicle use, and fuel consumption for California households. They employ residential density alone (dwelling units per square mile at the census block group level show the strongest relationship among density measures) to describe the built environment
because of the consistency and availability of density data. However, they acknowledge that density should probably be interpreted as a proxy for other built environment variables, such as access to employment, shopping, and other travel destinations. Brownstone and Golob draw on the California subsample of the 2001 National Household Travel Survey for data on vehicle ownership and fuel usage, land use densities, and socioeconomic characteristics of California households, thus providing a narrower geographic perspective than the national focus of Bento et al.
Brownstone and Golob find that, after controlling for socioeconomic differences, a 40 percent increase in residential density is associated with about 5 percent less annual VMT (see Table 3-1).27 The most important exogenous influences on annual VMT and fuel consumption are the number of household drivers and the number of workers; education and income are also significant. Brownstone and Golob conclude that increasing the density of an urban area to lower VMT produces small changes that are difficult to achieve, requiring very high densities in new and infill developments that exceed historical levels.28 As evidence, they cite Bryan et al. (2007), who show that only 30 of 456 cities29 increased population density by more than 40 percent between 1950 and 1990.
The study of Bento et al. (2005) and one by Chen et al. (2008) (not reviewed by Brownstone) also examine the impact of the built environment on mode choice, particularly transit use, which would substitute for automobile use and thereby reduce VMT. Bento et al. link the measures of urban form and transit supply previously described to
the 1990 NPTS data to explain commute mode choice. They find that population centrality and transit supply have a nonnegligible effect on the share of commuting by rail, bus, and nonmotorized modes (i.e., walking and bicycling).30 However, the overall effect on VMT for commuting is small because of the small fraction of commuters who use these modes. For example, a 10 percent increase in population centrality lowers the probability of driving by approximately 1 percentage point (Bento et al. 2005, 472). A 10 percent increase in rail and bus route miles lowers the probability of driving by only 0.03 percent when New York, which is an outlier in terms of the amount of transit service, is excluded.
Chen et al. (2008) assess the importance of density relative to other built environment variables—job accessibility with respect to the central business district (CBD)31 and distance to transit stops from home and work—in affecting mode choice for commuting while controlling for confounding factors (self-selection). Using a data set collected from house holds in the New York metropolitan region (1997– 1998)32 on travel patterns and socioeconomic characteristics, the authors select only those households that made a home-based work tour on the survey day.33 The focus on a tour or trip chain, rather than
a single trip, is a unique feature of their research, better representing how commuters actually travel.
The authors find that indeed residential self-selection is a key factor in interpreting the importance of the built environment for travel behavior. However, after controlling for self-selection, job accessibility via transit remains statistically significant (at a confidence level of 0.05) and the most important of the built environment variables, reducing the propensity to commute by car. Density is also significant, but only employment density at work, corroborating findings of earlier studies (see Badoe and Miller 2000 and Ewing and Cervero 2001); also significant is distance to transit stations from home and work. Chen et al. (2008) also test the impact of tour complexity on mode choice and find that increasing the number of stops in a tour significantly increases the propensity to commute by car.
Two other studies examine the effect of the built environment on automobile ownership, which indirectly affects VMT. Bhat and Guo (2007) jointly model residential location and automobile ownership decisions by using data for Alameda County from the 2000 San Francisco Bay Area Travel Survey and other related sources. After applying extensive controls for self-selection,34 the authors find that both household characteristics (primarily household income) and built environment characteristics were influential in car ownership decisions, although the former had a more dominant effect. Household and employment density, however, had a statistically significant but small effect on propensity for car ownership.35 Bhat and Guo attribute this result largely to the high correlation between density and other built environment measures, such as local transportation network measures (e.g., transit
availability and access time and street block density), suggesting that density is a partial proxy for these measures.36
Fang (2008) examines the impact of changes in the built environment, specifically higher residential density, on the number of vehicles and VMT by vehicle category (e.g., cars and trucks)37 for California households. Drawing on data from the California subsample of the 2001 National Household Travel Survey, Fang finds that a 50 percent increase in residential density is associated with a statistically significant but small reduction in household truck holdings (i.e., a 1.2 percent reduction) and a larger change in truck VMT (nearly an 8 percent reduction) than in car VMT (1.32 percent) (Fang 2008, 744). These findings are in line with those of Bento et al. (2005), who find that various measures of urban form had a small impact (elasticities less than 0.1) on the number of vehicles owned and VMT.
To summarize the results from recent studies, those studies that carefully control for socioeconomic characteristics and self-selection effects find that the built environment has a statistically significant, but often modest, effect on VMT. Some studies (Brownstone and Golob 2009; Chen et al. 2008) investigate only the effect of a single measure of the built environment—density—and the authors acknowledge that other attributes of the built environment might augment the results or that density itself is a proxy for these other measures. One of the most thorough studies in terms of inclusion of numerous built environment variables—that of Bento et al. (2005)—finds small effects when each variable is considered singly, but the authors suggest that if the variables were changed simultaneously, VMT per household could be lowered by as much as 25 percent. Implementing the policies necessary to bring about changes of such magnitude, however, presents a considerable challenge, a topic addressed in a subsequent section.
Studies of Travel Effects of Transit-Oriented Development
Several recent studies (Bento et al. 2005; Chen et al. 2008) point to the importance of transit supply and good access to transit in conjunction with land use as critical variables affecting mode choice and hence VMT. This section reviews the literature on the travel effects of transit-oriented development (TOD). TODs are mixed-use developments designed to maximize access to public transit, including good access to rail transit stations and bus stops, with relatively high densities close to transit stops and other urban design features that encourage pedestrian and other nonmotorized travel.38
A recent report of the Transit Cooperative Research Program (Arrington and Cervero 2008) summarizes the literature on the travel performance of TODs. Few if any of these studies, however, control for socioeconomic differences or self-selection bias. With that caveat in mind, the reviewers find that TOD commuters typically use transit two to five times more than other commuters in a region, although the transit mode share can vary from 5 percent to 50 percent (Arrington and Cervero 2008, 11). The share of nonwork trips by transit is similarly two to five times higher, although the transit mode shares are lower (2 percent to 20 percent). The primary reason suggested for the wide range of mode shares is differences across regions in the extensiveness of transit service and the relative travel times involved in using transit compared with the automobile. Thus, the authors of the literature review conclude that the location of a TOD in a region—its accessibility to desired locations—and the quality of connecting transit service are more important in influencing travel patterns than are the characteristics of the TOD itself (e.g., mixed uses, walkability).
The higher mode shares and thus VMT reductions found in many TODs must be kept in perspective. First, as the literature review points out, a primary reason for higher TOD transit use is self-selection; many residents locate in TODs precisely because they want to use transit. For example, surveys of TOD residents have found that, for those who previously drove to work (presumably because they did not live close to transit), 52 percent switched to commuting by transit upon moving within a ½-mile walking distance of a rail station (Arrington and Cervero 2008, 12).39 Second, the demographic profile of TOD residents is often different from the profile of residents in surrounding communities. The majority of TOD residents are childless singles or couples—often younger working professionals or older “empty nesters.” Smaller households typically own fewer cars, and proximity to good transit service can reduce the need for multiple vehicles. These findings are borne out by the statistics: TOD households own almost half the number of cars of other households and are almost twice as likely not to own any car (Arrington and Cervero 2008, 44).
The literature review also examines the effect of land use and design features—mixed land uses, traffic calming, short blocks, street furniture—on travel patterns, transit ridership, and the decision to locate in a TOD. For work trips, proximity to transit and employment densities at trip ends exert a stronger influence on transit use than land use mix, population density at trip origins, or quality of the walking environment (Arrington and Cervero 2008). Moreover, relative travel time (transit versus automobile) is more important than any land use variable, including density, diversity of uses, and design. The authors find some evidence that mixed uses and urban design features (e.g., a more walkable environment) influence nonwork trips and may therefore play a role in attracting TOD residents.
Another study involving a survey of households that moved to TODs within the past 5 years in three California cities—Los Angeles, San Francisco, and San Diego—finds that the three primary reasons for choosing to live in a TOD were the quality and cost of housing and the quality of the neighborhood (Lund 2006). Only about one-third of respondents reported access to transit as one of the top three reasons, and the San Francisco Bay Area, particularly along the heavy rail lines of the Bay Area Rapid Transit system, was overrepresented, reflecting the high level of transit service in that region.40 In comparison with the population as a whole, however, TOD residents used transit at a relatively high rate. When regional and sociodemographic influences were controlled for, those who cited access to transit as one of their top three reasons for choosing to live in a TOD were nearly 20 times more likely to travel by rail than those who did not cite this factor. The author acknowledges that the results should be tempered by a low response rate41 and by the somewhat different socioeconomic profile of TOD residents, including higher annual household income, more professionals and office workers, smaller mean household size, and fewer Hispanics relative to the surrounding population (Lund 2006). The results are also a good example of self-selection.
Studies of Compact Development and Urban Truck Travel
Most of the studies reviewed in this chapter focus on personal travel. The committee also commissioned a paper to examine how compact
development might affect urban freight movement and commercial traffic (Bronzini 2008). Commercial and freight truck traffic typically accounts for between 3 and 10 percent of urban highway VMT, but truck traffic can represent as much as 50 percent of average daily traffic on major freight connectors to ports, airports, and other intermodal facilities. Because of the much lower fuel economy (miles per gallon) of trucks compared with automobiles, truck travel accounts for nearly one-quarter (23 percent) of carbon dioxide emissions from highway travel in the nation’s 100 largest metropolitan areas (Southworth et al. 2008).
No studies were found that directly address the topic of compact development and urban truck travel, but an analysis by Bronzini of a data set on truck traffic in the 100 largest U.S. metropolitan areas (Southworth et al. 2008) finds that truck VMT per capita tends to decline as population increases. The author concludes that large urban areas (as measured by population) tend to have higher densities, thereby promoting shorter trip lengths. This finding suggests that more compact development could be effective in lowering truck VMT per capita. The effect is probably greater for commercial than freight traffic because the latter includes a substantial component of through traffic.42 However, the strong relationship between population and truck VMT makes it difficult to identify any separate, additional effect of land use on VMT.43
For 97 of the nation’s 100 largest metropolitan areas, Southworth et al. (2008) find a relationship between carbon emissions from truck
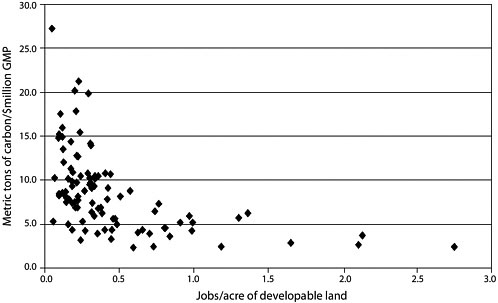
FIGURE 3-1 Carbon from truck travel within metropolitan areas (GMP = gross metropolitan product in 2005 dollars).
Source: Southworth et al. 2008, 27.
traffic per gross metropolitan product (GMP)44 and the number of jobs per developed acre of land (see Figure 3-1). As job density increases, VMT-based carbon emissions per dollar of economic activity decline.45 However, there is a good deal of variability at specific density levels, indicating the importance of other factors affecting truck carbon emissions.
Before definitive quantitative conclusions can be drawn, more research is needed to understand the mechanisms by which higher-density development could affect truck travel and logistics patterns
in metropolitan areas (e.g., urban freight villages where workers live near jobs, commercial centers near airports, land bridges to expedite the shift of truck traffic away from major ports or airports to exurban warehouses and distribution centers). In addition, simulations of different urban land use patterns and the resulting effects on freight and commercial truck VMT are recommended, including studies of specific urbanized areas.
Other Modeling Approaches to Estimating Effects of Compact Development
A number of different types of models can provide insight into the relationship between land development patterns and travel. So far, the committee has focused mainly on elasticities derived from disaggregate analyses in which travel behavior is modeled as a function of the built environment and socioeconomic characteristics. Models are also useful for taking complex scenarios and systematically analyzing the effects of changes in individual parameters—for example, how changes in residential density alone or in combination with other policies (such as transit investment and pricing policies) might affect VMT and mode choice. However, as discussed subsequently, many models, particularly those used by metropolitan planning organizations (MPOs), are highly aggregate and not behaviorally based (TRB 2007). Nevertheless, to the extent that the models are calibrated with current local data and make their assumptions transparent, they are useful for analyzing the relative importance of various policy options for desired objectives.
The traditional four-step travel forecasting models used by most MPOs were developed during a time of major capital investment in transportation infrastructure in the 1960s and 1970s when the primary concern was the appropriate scaling and location of major highway and transit system capacity expansions (TRB 2007).46 Today,
however, MPOs face expanded forecasting requirements, among them, particularly in growing regions, the need to model the impacts on travel of land use policies, such as increases in overall density, urban growth boundaries, intensification around rail stations, and more mixed housing and employment (TRB 2007). While almost all MPOs require forecasts of population, households, and employment as input to their trip generation and travel forecasts, only some of the larger MPOs have adopted integrated urban models that combine advanced land use and transportation models with feedback effects to address this need. These models require significant investment in data assembly, model development, and technical support staff and thus are not widespread in practice (TRB 2007). Most travel forecasting models have limited ability to represent the effects of land use, transit, parking fees or other pricing strategies, and urban freight traffic (Rodier 2009).47
Sacramento, California, is notable for its use of advanced travel models to analyze various alternative “futures” as part of developing long-term investment plans. Specifically, the models have been used to examine the effectiveness of land use policies, both alone and in conjunction with investments in transit and automobile pricing policies, to reduce regional automobile travel and vehicle emissions (Rodier et al. 2002). A scenario involving TODs and some 75 miles of new light rail investment showed a significant decrease in automobile trips from increased transit use and greater nonmotorized travel. However, a light rail and pricing scenario48 showed similar modal shares but much larger reductions in VMT, primarily from a reduction in the length of trips. Model results indicated that land use policies and transit investments could reduce VMT by 5 to 7 percent over a 20-year time horizon compared with the status quo scenario. The
addition of pricing increased the VMT reduction to 9 to 10 percent (Rodier et al. 2002, 252).49
A recent review of the U.S. and international modeling literature on the effects of land use, transit, and automobile pricing policies on vehicle kilometers traveled (VKT) and greenhouse gas reductions reports model results for time horizons of 10, 20, 30, and 40 years relative to business-as-usual, base case scenarios (Rodier 2009). On the basis of the median study result, Rodier finds that land use policies only (e.g., increased residential housing density, urban growth boundary) reduced VKT by 0.5 percent to 1.7 percent during a time horizon of 10 to 40 years, respectively.50 A combination of policies that included land use, transit, and pricing yielded much higher median reductions in VKT of 14.5 percent to 24.1 percent over the same 10- to 40-year time horizon. Rodier concludes by noting that metropolitan area context matters with regard to the effectiveness of various policies (e.g., whether areas have viable alternatives to automobile travel, such as transit) and cautions against generalizing the results of strategies effective in some metropolitan areas, particularly in European cities, to other areas where conditions differ (Rodier 2009).
As part of its charge, the committee was asked to examine the potential benefits of using location efficiency models in transportation infrastructure planning and investment analyses (see Appendix A). These
|
49 |
These reductions in VMT cannot be compared with the elasticity estimates derived from the literature review (see Table 3-1), because the former are based on applications of aggregate models that differ substantively from the disaggregate models on which the elasticity estimates are based. For example, simulated system-level changes such as “adding 75 miles of new light rail investment” are not generally translated into “percentage changes in density” (which would need to be averaged across the region, somehow) or some other indicator, which is what would be needed to put the resulting change in VMT into terms comparable to an elasticity. For a given set of assumptions, however, they do show the relative magnitude of effects of alternative policies. |
|
50 |
However, the author notes sharp differences in the individual study results. Reductions in VKT were small in those areas with relatively high densities and extensive transit systems (e.g., Washington, D.C., Helsinki) but much higher than the median in areas like the sprawling and rapidly growing Sacramento region, where transit is more limited and an aggressive urban growth boundary was modeled (Rodier 2009). |
models are focused specifically on the relationship between residential land use patterns and automobile ownership and use. The original model development was sponsored by the Center for Neighborhood Technology, working in cooperation with the Natural Resources Defense Council and the Surface Transportation Policy Project in 1997. An important objective of the model at that time was to support the Location Efficient Mortgage program of Fannie Mae.51 The model, designed by Holtzclaw et al. and described in the 2002 study previously discussed, predicts household vehicle ownership and use in three metropolitan areas—Chicago, Los Angeles, and San Francisco—on the basis of household income and size, residential density, availability of transit, and pedestrian and bicycle friendliness of communities. Higher-density locations with good transit access were found to have lower automobile ownership and use, hence the greater efficiency of such locations. As noted earlier, however, the model depends on data collected at an overly aggregate level that mask important variability with respect to house hold and land use characteristics that could help explain automobile ownership and use patterns. As currently constructed, the location efficiency model of Holtzclaw et al. is too coarse to guide transportation plans and investments.
CASE STUDIES
Many of the studies reviewed in the previous sections suggest that reducing VMT in any significant way through changes in the built environment would require a broad range of measures, from increasing density, to substantial investment in transit, to pricing policies that better reflect the externalities of automobile travel. The committee identified two locations that have had considerable success in implementing such policies—Portland, Oregon, and Arlington County, Virginia. Case studies of each are summarized in this section
and described in detail in Annex 3-1. The case studies are descriptive in nature; they do not represent analytic assessments that carefully control for socioeconomic factors or the role of self-selection in examining the effects of changes in the built environment on travel behavior. Also, the two case study sites differ in scale. Portland is a regional area, while the Arlington TODs are local corridors within a single county. Nevertheless, the case studies are instructive in documenting what can be accomplished, particularly in changing housing and travel patterns, and in revealing the enormous challenges involved.
Portland, Oregon
Portland is often cited as the poster child for “smart growth” policies. Two landmark decisions in the mid-1970s put Portland on the path toward controlling regionwide growth and achieving more compact development: (a) state legislation requiring that every city and county establish urban growth boundaries to protect both farm- and forestland and (b) redirection of a major freeway expansion plan for Portland that resulted in a new light rail transit system. A plan was developed to create a series of compact developments along rail corridors—supported by zoning, parking, and design policies—to revitalize the CBD, link the downtown with new developments and new developments with each other, and create a multimodal transportation system. The final element was the creation of Metro, an elected regional governance body, which not only operated as the area’s MPO but also held the power of the purse, with broad taxing authority and responsibility for implementing the area’s ambitious development plans.
The evidence indicates that Portland’s policies to steer growth into more compact, mixed-use development have paid off, not only in revitalizing the downtown and many of its neighborhoods but also in changing travel behavior, the primary concern of this study. For example, while daily VMT per capita has risen sharply in the United States as a whole, it has declined in the Portland metro area since about 1996 (see Annex 3-1 Figure 1). According to data from the U.S.
and Oregon Departments of Transportation, Portland metropolitan area residents traveled about 17 percent fewer miles per day than the U.S. national average in 2007, the most recent year for which national data are available. High levels of transit ridership are an important contributor. Between 1993 and 2003, transit ridership increased by 55 percent, while Portland’s population grew by 21 percent and VMT by 19 percent (Gustafson 2007). But the growth in transit ridership accounts for only a fraction of the reported reduction in VMT, which suggests that land use policies played a key role. Over the same period, according to Metro’s Data Resource Center, population density levels increased by 18 percent, from 3,136 to 3,721 persons per square mile, holding constant the urban growth area boundary.52 A large fraction of the increase came from constructing single-family housing on small lots.53 The relatively small size of the Portland urban area, due to the urban growth boundary, has also resulted in shorter average trip lengths.
Portland demonstrates that the built environment can be changed in ways that encourage more compact development and less automobile dependence, but its experience may be difficult to replicate widely. As this case study points out, the success of Portland’s strategy depended on strong state planning legislation, an ambitious investment in a light rail system that received substantial federal assistance and strong citizen support, and a unique regional governance entity to ensure that plans were carried out.
Arlington County, Virginia, TOD Corridors
In 2002, Arlington County received the U.S. Environmental Protection Agency’s national award for Smart Growth Achievement in recognition
of its high-quality TODs. The success of the TODs developed along transit corridors, in terms of both mixed-use development and high levels of transit ridership, is a good illustration of the importance of accessibility and quality of transit service in reducing automobile travel.
The origins of TOD in Arlington County can be traced to early recognition (in the 1970s) by Arlington County planners and Metrorail itself of the development potential of deteriorating corridors with underutilized real estate and the opportunity to use the new rail transit system to promote revitalization. In particular, the decision to locate Metrorail along two major arterials—the Rosslyn–Ballston Metro Corridor and the Jefferson Davis Corridor—instead of down the median of Interstate 66 enabled the county to transform corridors of closely spaced stations into high-density, mixed-use town centers. By 2003, the county had 52 joint development projects created around dozens of Metrorail stations.
Good planning and transit investment have made Arlington County’s Metrorail corridors magnets for office, retail, and mid- and high-rise residential development. Since 1980, for example, county office space has nearly doubled to about 44 million square feet, with almost 80 percent located within the two Metrorail corridors (Arlington County Planning Department 2008). Housing growth in the corridors has occurred at two to three times the rate of growth of the regional population, with the result that in 2003, there were 1.06 jobs for every employed county resident.54 The Rosslyn–Ballston corridor has also emerged as one of Northern Virginia’s primary retail destinations.
The effect on travel patterns has been impressive. According to the 2000 U.S. census, 39 percent of those living in the Metrorail corridors use transit to get to work, and another 10 percent walk or bicycle; only 40 percent commute alone. In comparison, outside the Metrorail corridors, about 17 percent commute by transit, about
5 percent walk or bicycle, and nearly 61 percent commute alone to work. (These comparisons, however, do not take into account the very different population profiles of these areas or the issue of self-selection.) In addition, growth in traffic volumes along the major arterials in the TODs has largely been kept in check, the result of good-quality transit service and market-rate parking charges. However, more needs to be done to improve these arterials for pedestrian traffic.
Like Portland, Arlington County demonstrates what can be done through a combination of land use plans and transit investment to promote development and at the same time reduce automobile travel. The county’s success can be attributed to leadership and early recognition of development potential; good planning and design, including rezoning of land adjacent to Metrorail stations to allow high-density development; a healthy economic base; and above all, the foresight to take advantage of massive investment in a new regional transit system to channel development.
FINDINGS
Both logic and empirical evidence suggest that developing more compactly, that is, at higher population and employment densities, lowers VMT. Trip origins and destinations become closer, on average, and thus trip lengths become shorter, on average. Shorter trips can increase trip frequencies, but empirical evidence suggests that the increase is not enough to offset the reduction in VMT that comes from reduced trip lengths alone. Shorter trips also may lower VMT by making walking and bicycling more competitive alternatives to the automobile, while higher densities make it easier to support public transit. The effects of compact development on VMT can be enhanced when it is combined with other measures, such as mixing land uses to bring housing closer to jobs and shopping; developing at densities that can support transit; designing street networks that provide good connectivity between destinations and well-located transit stops and that accommodate non-
vehicular travel; and demand management measures, such as reducing the supply and increasing the cost of parking.
An extensive literature on the relationship between the built environment and household travel has developed, but capturing the nature and the magnitude of the link between the two has proved elusive. Problems of measurement, issues of scale, and adequate controls for confounding variables (e.g., socioeconomic factors, self-selection) have resulted in widely varying results concerning the importance of changes in land use and the magnitude of their effects on travel. The predominance of cross-sectional analyses has precluded establishing cause and effect between a change in the built environment and a change in VMT.
Recent studies, which have attempted to control for many of these problems, have found statistically significant but modest effects of the built environment on VMT—on the order of a 5 to 12 percent lowering of household VMT associated with a doubling (100 percent increase) of residential density in a metropolitan area. Some of these studies, however, have focused on only one attribute of the built environment— density. While density could be a proxy for other variables, it is unlikely to represent all the land use and related transportation measures necessary to bring about a significant change in VMT. Doubling residential density alone without also increasing other variables, such as the amount of mixed uses and the quality and accessibility of transit, will not bring about a significant change in travel.
One study that does a good job of capturing these multiple factors (Bento et al. 2005), including the spatial distribution of population or population centrality, jobs–housing balance, and the supply of public transit in a region, finds that, if implemented together, these measures could result in a significant lowering of VMT. Using the example of Boston, one of the densest metropolitan areas, and Atlanta, one of the most sprawling, the researchers simulate the effect of moving sample households from a city with the urban form and transit supply characteristics of Atlanta to a city with the characteristics of Boston, with the effect that VMT could be lowered by as much as 25 percent, an estimate
that the committee uses subsequently as an upper bound in its own scenarios. Of course, the simulation does not take behavioral issues into consideration. The typical Atlanta resident facing a Boston environment would not necessarily travel like a Bostonian, although both attitudes and behavior would likely be influenced by the built environment over time.
Moreover, making a thought experiment a reality poses considerable challenges. As the examples of Portland and Arlington County demonstrate, dramatic changes in the built environment and travel patterns can be achieved. However, they require significant and sustained political commitment, substantial transportation infrastructure investments, and decades to show results. Replicating these successes in other metropolitan areas is likely to pose similar challenges. Nevertheless, demographic changes over the next 30 to 50 years may provide opportunities for changing housing preferences and travel patterns in ways that are more favorable to compact development and reduced automobile travel, the topic of the next chapter.
REFERENCES
Abbreviation
TRB Transportation Research Board
Arlington County Planning Department. 2008. Profile 2008: Summer Update. www.co.arlington.va.us/Departments/CPHD/planning/data_maps/pdf/page65081.pdf. Accessed Oct. 23, 2008.
Arrington, G. B., and R. Cervero. 2008. TCRP Report 128: Effects of TOD on Housing, Parking, and Travel. Transportation Research Board of the National Academies, Washington, D.C.
Badoe, D., and E. Miller. 2000. Transportation–Land Use Interaction: Empirical Findings in North America, and Their Implications for Modeling. Transportation Research Part D, Vol. 5, No. 4, pp. 235–263.
Bagley, M. N., and P. L. Mokhtarian. 2002. The Impact of Residential Neighborhood Type on Travel Behavior: A Structural Equations Modeling Approach. Annals of Regional Science, Vol. 36, No. 2, pp. 279–297.
Bento, A. M., M. L. Cropper, A. M. Mobarak, and K. Vinha. 2005. The Effects of Urban Spatial Structure on Travel Demand in the United States. Review of Economics and Statistics, Vol. 87, No. 3, pp. 466–478.
Bhat, C. R., and J. Y. Guo. 2007. A Comprehensive Analysis of Built Environment Characteristics on Household Residential Choice and Auto Ownership Levels. Transportation Research Part B, Vol. 41, pp. 506–526.
Bhat, C. R., and S. Sen. 2006. Household Vehicle Type Holdings and Usage: An Application of the Multiple-Discrete-Continuous Extreme Value (MDCEV) Model. Transportation Research Part B, Vol. 40, No. 1, pp. 35–53.
Boarnet, M. G., and R. Crane. 2001. Travel by Design: The Influence of Urban Form on Travel. Oxford University Press, New York.
Boarnet, M. G., and M. J. Greenwald. 2000. Land Use, Urban Design, and Nonwork Travel: Reproducing Other Urban Areas’ Empirical Test Results in Portland, Oregon. In Transportation Research Record: Journal of the Transportation Research Board, No. 1722, Transportation Research Board, National Research Council, Washington, D.C., pp. 27–37.
Boarnet, M. G., and S. Sarmiento. 1998. Can Land Use Policy Really Affect Travel Behavior? A Study of the Link Between Non-Work Travel and Land Use Characteristics. Urban Studies, Vol. 35, No. 7, pp. 1155–1169.
Bronzini, M. S. 2008. Relationships Between Land Use and Freight and Commercial Truck Traffic in Metropolitan Areas. Department of Civil, Environmental, and Infrastructure Engineering, George Mason University, Fairfax, Va. http://onlinepubs.trb.org/Onlinepubs/sr/sr298bronzini.pdf.
Brownstone, D. 2008. Key Relationships Between the Built Environment and VMT. Department of Economics, University of California, Irvine. http://onlinepubs.trb. org/Onlinepubs/sr/sr298brownstone.pdf.
Brownstone, D., and T. F. Golob. 2009. The Impact of Residential Density on Vehicle Usage and Energy Consumption. Journal of Urban Economics, Vol. 65, pp. 91–98.
Bryan, K. A., B. D. Minton, and P. G. Sarte. 2007. The Evolution of City Population Density in the United States. Federal Reserve Bank of Richmond Economic Quarterly, Vol. 93, pp. 341–360. www.richmondfed.org/research/research_economists/files/ urbandensitycode.zip. Accessed Sept. 9, 2008.
Cao, X., P. Mokhtarian, and S. Handy. 2008. Examining the Impacts of Residential Self-Selection on Travel Behavior: Methodologies and Empirical Findings. Research Report UCD-ITS-RR-08-25. Institute of Transportation Studies, University of California, Davis. http://pubs.its.ucdavis.edu/publication_detail.php?id=1194. Accessed March 30, 2009.
Cao, X., P. Mokhtarian, and S. Handy. 2009. Examining the Impacts of Residential Self-Selection on Travel Behavior: A Focus on Empirical Findings. Transport Reviews, Vol. 29, No. 3, pp. 359–395.
Cervero, R., and M. Duncan. 2006. Which Reduces Travel More: Jobs–Housing Balance or Retail–Housing Mixing? Journal of the American Planning Association, Vol. 72, No. 4, pp. 475–492.
Cervero, R., and K. Kockelman. 1997. Travel Demand and the 3Ds: Density, Diversity, and Design. Transportation Research Part D, Vol. 2, No. 3, pp. 199–219.
Chen, C., H. Gong, and R. Paaswell. 2008. Role of the Built Environment on Mode Choice Decisions: Additional Evidence on the Impact of Density. Transportation, Vol. 35, pp. 285–299.
Crane, R. 2000. The Influence of Urban Form on Travel: An Interpretive Review. Journal of Planning Literature, Vol. 15, No. 1, pp. 3–23.
Downs, T. 2004. Still Stuck in Traffic: Coping with Peak-Hour Traffic Congestion. Brookings Institution, Washington, D.C.
Dunphy, R. T. 2007. TOD Without Transit? Urban Land, Aug. www.uli.org/ResearchAndPublications/MagazinesUrbanLand/2007/August/TOD%20without%20Transit.aspx. Accessed July 15, 2009.
Ewing, R., K. Bartholomew, S. Winkelman, J. Walters, and D. Chen. 2007. Growing Cooler: The Evidence on Urban Development and Climate Change. Urban Land Institute, Washington, D.C.
Ewing, R., and R. Cervero. 2001. Travel and the Built Environment: A Synthesis. In Transportation Research Record: Journal of the Transportation Research Board, No. 1780, Transportation Research Board, National Research Council, Washington, D.C., pp. 87–114.
Ewing, R., R. Pendall, and D. Chen. 2002. Measuring Sprawl and Its Impact. Smart Growth America. www.smartgrowthamerica.org/sprawlindex/MeasuringSprawl.pdf. Accessed Aug. 12, 2008.
Fang, H. A. 2008. A Discrete-Continuous Model of Households’ Vehicle Choice and Usage, with an Application to the Effects of Residential Density. Transportation Research Part B, Vol. 42, pp. 736–758.
Frank, L. D., B. E. Saelens, K. E. Powell, and J. E. Chapman. 2007. Stepping Towards Causation: Do Built Environments or Neighborhood and Travel Preferences Explain Physical Activity, Driving, and Obesity? Social Science and Medicine, Vol. 65, pp. 1898–1914.
Gómez-Ibáñez, J. 1991. A Global View of Automobile Dependence. Journal of the American Planning Association, Vol. 55, No. 3, pp. 376–391.
Gustafson, R. 2007. Streetcar Economics: The Trip Not Taken. www.portlandstreetcar. org. Accessed April 22, 2008.
Handy, S. 2005. Smart Growth and the Transportation–Land Use Connection: What Does the Research Tell Us? International Regional Science Review, Vol. 28, No. 2, pp. 146–167.
Holtzclaw, J., R. Clear, H. Dittmar, D. Goldstein, and P. Haas. 2002. Location Efficiency: Neighborhood and Socioeconomic Characteristics Determine Auto Ownership and
Use—Studies of Chicago, Los Angeles, and San Francisco. Transportation Planning and Technology, Vol. 25, No. 1, pp. 1–27.
Krizek, K. J. 2003. Residential Relocation and Changes in Urban Travel: Does Neighborhood-Scale Urban Form Matter? Journal of the American Planning Association, Vol. 69, No. 3, pp. 265–279.
Lund, H. 2006. Reasons for Living in a Transit-Oriented Development, and Associated Transit Use. Journal of the American Planning Association, Vol. 72, No. 3, pp. 357–366.
Mokhtarian, P., and X. Cao. 2008. Examining the Impacts of Residential Self-Selection on Travel Behavior: A Focus on Methodologies. Transportation Research Part B, Vol. 42, pp. 204–228.
Newman, P., and J. Kenworthy. 1989. Gasoline Consumption and Cities: A Comparison of U.S. Cities with a Global Survey. Journal of the American Planning Association, Vol. 55, No. 1, pp. 24–37.
Newman, P., and J. Kenworthy. 1999. Costs of Automobile Dependence: Global Survey of Cities. In Transportation Research Record: Journal of the Transportation Research Board, No. 1670, Transportation Research Board, National Research Council, Washington, D.C., pp. 17–26.
Newman, P., and J. Kenworthy. 2006. Urban Design to Reduce Automobile Dependence. Opolis: An International Journal of Suburban and Metropolitan Studies, Vol. 2, No. 1, pp. 35–52.
Rodier, C. 2009. Review of the International Modeling Literature: Transit, Land Use, and Auto Pricing Strategies to Reduce Vehicle Miles Traveled and Greenhouse Gas Emissions. In Transportation Research Record: Journal of the Transportation Research Board, No. 2132, Transportation Research Board of the National Academies, Washington, D.C.
Rodier, C. J., R. A. Johnston, and J. E. Abraham. 2002. Heuristic Policy Analysis of Regional Land Use, Transit, and Travel Pricing Scenarios Using Two Urban Models. Transportation Research Part D, Vol. 7, pp. 243–254.
Southworth, F., A. Sonnenberg, and M. A. Brown. 2008. The Transportation Energy and Carbon Footprints of the 100 Largest U.S. Metropolitan Areas. Working Paper No. 37. School of Public Policy, Georgia Institute of Technology, Atlanta.
Southworth, F., and M. R. Wigan. 2008. Movement of Goods, Services and People: Entangle ments with Sustainability Implications. In Building Blocks for Sustainable Transport: Obstacles, Trends, Solutions (A. Perrels, V. Himanen, and M. Lee-Gosselin, eds.), Emerald Group Publishing, United Kingdom, Chapter 9.
TRB. 2007. Special Report 288: Metropolitan Travel Forecasting: Current Practice and Future Direction. National Academies, Washington, D.C.
Vance, C., and R. Hedel. 2007. The Impact of Urban Form on Automobile Travel. Transportation, Vol. 34, pp. 575–588.
Annex 3-1
Details of Case Studies
PORTLAND, OREGON
The state of Oregon and the Portland metropolitan area in particular are well known for progressive growth management policies and pioneering leadership in compact, mixed-use development efforts. These efforts have their roots in the mid-1970s, when a Governor’s Task Force on Transportation redirected a major freeway expansion plan toward planning for a multimodal trans portation system and when the state legislature enacted Senate Bill 100. That bill required every city and county to adopt a comprehensive plan that met 19 statewide planning goals, including a requirement to establish “urban growth boundaries” (UGBs) to limit the extent of urbanization and protect farm- and forestlands outside these boundaries (Cotugno and Benner forthcoming).
Portland now operates under the 2040 Growth Management Strategy, which calls for focusing expected population growth in existing built-up areas and requires local governments to limit parking and adopt zoning and planning changes consistent with the strategy. The goal is that by 2040, two-thirds of jobs and 40 percent of households will be located in and around centers and corridors served by light rail transit (LRT) and bus. Leadership to develop this strategy is focused on a unique form of elected regional governance through Metro. In addition to being the region’s metropolitan planning organization, Metro has broad authority to ensure that local land use plans are consistent with the regional vision, has broad taxing powers, and plays a lead role in developing the LRT system and implementing TOD and open-space acquisition programs (A. Cotugno, personal communication).
Beginning in 1980, Tri-Met (the regional transit authority), Metro, the City of Portland, the City of Gresham, and Multnomah County
initiated their Transit Station Area Planning Program, which included market studies, coordination with other regional planning efforts, and station area plans (including legally binding requirements for minimum densities, parking maximums, and design guidelines), and sought to identify, create, and promote opportunities for TODs along the planned LRT corridors. Since that time, the region has been pursuing a steady LRT, commuter rail, and streetcar expansion program, which has evolved as decision makers have gained experience with using rail investments to achieve broader community objectives (Cervero et al. 2004).
Development along the 15-mile Eastside LRT line, opened in 1986, has been primarily infill, whereas the 18-mile Westside LRT, opened in 1998, was built largely into greenfields. The latter was one of the first efforts in the nation to combine extensive LRT expansion into the suburbs with deliberate TOD around the stations, connecting previously isolated communities to downtown and to each other and creating new mixed-use pockets of development in the middle of traditional suburbia (Cervero et al. 2004). In 2001, extension of a 5-mile segment to the airport provided the opportunity for a public– private partnership to finance the LRT construction and leverage the development of surplus airport property. In 2004, an inner-city 6-mile extension to the north provided a tool for revitalization in a low-income neighborhood. The newest extension, a 6.5-mile line to the south, is being built on a freeway right-of-way that was set aside for a transit corridor 30 years ago when the Interstate beltway was built (A. Cotugno, personal communication). Two of the most notable examples of TOD in the region, the Pearl District and Orenco Station, are discussed below.
The Pearl District arose from a decision to use construction of the Portland streetcar line as a means to leverage large-scale redevelopment of a functionally obsolete warehouse and industrial zone in downtown Portland. The city entered into an innovative agreement with developers, requiring them to meet ambitious housing density levels
to ensure a supply of affordable housing,55 donate land for parks and greenspace, and help pay for removal of a highway viaduct and construction of the streetcar line. The Pearl District has met all expectations for becoming a vibrant, desirable place to live. It currently contains approximately 5,500 housing units, along with 21,000 jobs and 1 million square feet of new commercial and retail space. As a result of its popularity, the district now has the most expensive housing in the Portland region as well as the highest density in the city, at approximately 120 housing units per acre.
Orenco Station was designated one of a number of “town centers” along the Westside LRT line in the 2040 regional plan and is generally viewed as the most ambitious and successful such community to date. It contains 1,800 homes, mixed with office and retail spaces, in the town of Hillsboro, situated close to a large employment center in the metropolitan area’s high-tech corridor. In response to market surveys indicating preferences for walkable streets and community-oriented spaces, the developers experimented with design elements such as communal greenspaces, narrow streets, houses located close to sidewalks, and garages placed behind homes. Free LRT passes are provided to all newcomers for their first year to encourage the use of transit. Orenco Station has won numerous national planning awards, and its housing units have commanded as much as a 25 percent premium over larger suburban homes in the area (NRDC 2001).
Metro’s TOD policies are thought to be one of the major factors in attracting people and businesses to the region. Over the decade of the 1990s, the number of college-educated 25- to 34-year-olds increased by 50 percent in the Portland metropolitan area—five times more rapidly
than in the nation as a whole, with the fastest increase occurring in the city’s close-in neighborhoods (Cortright and Coletta 2004). At the same time, Portland’s streetcar line became an important catalyst for development at much higher densities than seen previously. More than half of all the central city development within the past decade has been within one block of the streetcar line.
A wide array of studies has demonstrated the effect of these land use and transportation developments on travel behavior. While VMT per person has been increasing nationally, it has been declining in the Portland metropolitan area since about 1996 (see Annex 3-1 Figure 1). According to data from the U.S. and Oregon Departments of Transportation, Portland area residents traveled about 17 percent fewer miles per day than the national average for other urbanized areas in 2007, the most recent year for which national data are available. Portland is one of the few regions in the country where transit ridership is growing more rapidly than VMT, and bicycle use has also shown rapid growth.56
From 1993 to 2003, Portland’s population grew by 21 percent, its average VMT grew by 19 percent, while its transit ridership increased by 55 percent (Gustafson 2007). But the growth in transit ridership accounts for only a fraction of the reported reduction in VMT, which suggests that land use policies played a key role. Over the same period, according to Metro’s Data Resource Center, population density levels increased by 18 percent, from 3,136 to 3,721 persons per square mile, holding constant the urban growth area boundary.57 A large fraction of
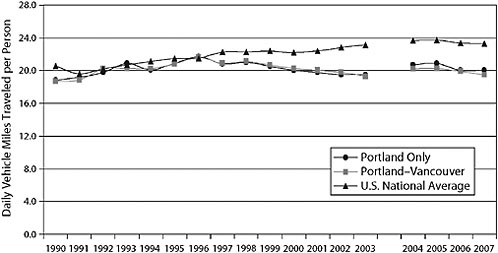
ANNEX 3-1 FIGURE 1 Daily VMT per person by urbanized area, 1990–2007, Portland, Oregon, only; Portland–Vancouver, Oregon–Washington; and U.S. national average.
[Before 2004, the 1990 census information was used to calculate the urbanized population for the Highway Performance Monitoring System (HPMS) submittal from which VMT is calculated. The only official population report for the urbanized area of Portland comes every 10 years from the U.S. census. The 2000 census data were reported in 2002, but because the urban boundary was not finalized in time, the HPMS report that was based on the 2000 census data was not included until the 2004 submittal. The method used to calculate the urbanized population each year is to apply the ratio of the total city population in 2000 to the urbanized population in 2000 to the total city population in 2004, 2005, 2006, etc., until an official new urbanized number is available from the 2010 census. The 2001–2003 population estimates were based on the 1990 ratio of city to urbanized areas. There was probably not a sudden jump in VMT for Portland and Portland–Vancouver from 2003 to 2004, but more likely a gradual increase that had been occurring over time and that had not been measured with the correct standard (the 2000 census data) until the 2004 data set was available. The break in the series from 2003 to 2004 denotes the break in trend.]
Source: FHWA 2009, Table HM-72.
the increase came from the construction of single-family housing on small lots.58 The relatively small size of the Portland urban area, due to the UGB, has also resulted in shorter average trip lengths.
Several studies have examined the travel behavior of Portland residents before and after moving to housing located adjacent to an
LRT station. In all such cases, residents reported that moving led to a significant increase in their use of rail transit and a concomitant decrease in auto mobile use (Podobnik 2002; Switzer 2002; Dill 2006; Evans et al. 2007). A related study examines travel behavior in two particular neighborhoods before and after the LRT system began running (in 1990 and 2000, respectively). In Orenco Station, residents’ automobile mode share dropped from 100 percent to 86 percent, and in Beaverton Central station, it dropped from 81 percent to 73 percent (Evans et al. 2007). None of these studies, however, controlled for self-selection.
Results of a travel behavior survey of more than 7,500 households in four counties (Clackmas, Multnomah, and Washington Counties in Oregon and Clark County in Washington) clearly indicate that good transit service and mixed-use neighborhoods have had a significant influence on reducing automobile use and ownership (see Annex 3-1 Table 1). In a more recent survey of residents living near stations along the Westside LRT line, 23 to 33 percent reported using transit as their
ANNEX 3-1 TABLE 1 Mode Share, VMT per Capita, and Automobile Ownership, Portland Region
|
Area |
Transit Mode Share (percent) |
Walking Mode Share (percent) |
Automobile Mode Share (percent) |
VMT per Capita |
Automobile Ownership per Household |
|
Neighborhoods with mixed use and good transit |
11.5 |
27.0 |
58.1 |
9.80 |
0.93 |
|
Neighborhoods with good transit only |
7.9 |
15.2 |
74.4 |
13.28 |
1.50 |
|
Remainder of Multnomah County |
3.5 |
9.7 |
81.5 |
17.34 |
1.74 |
|
Remainder of the region |
1.2 |
6.1 |
87.3 |
21.79 |
1.93 |
|
Source: 1994 Metro Travel Behavior Survey for all trip types. |
|||||
primary commute mode, compared with less than 10 percent of workers in the neighboring suburbs of Hillsboro and Beaverton and 15 percent of Portland workers overall (Dill 2006).
However, not all aspects of the Portland region’s planning efforts have gone smoothly. Some TOD projects (such as the Round and Center Commons) have faced significant financial struggles, and many would not have succeeded without significant public subsidies, including a 10-year tax abatement offered for new developments within walking distance of a rail station. Critics charge that the dense development policies have led to rapidly increasing congestion, unaffordable housing prices, and destruction of urban open spaces. And there have been recurring attempts by some civic and business interests over the past couple of decades to weaken or repeal key aspects of the growth management system.
Despite these struggles, however, the Portland region is still highly regarded for the scale and extent of sustained commitment to TOD and innovative planning regulations. The region offers some important lessons for how to create well-designed mixed-use communities that are nodes along successful regional corridors of compact development and not just isolated islands of development. The Portland metropolitan area’s success is due to a host of political, regulatory, and economic factors, some of which are unique to the region but all of which may still offer useful lessons for other parts of the country:
-
Early leadership from a visionary governor and a supportive state legislature willing to pass strong state planning laws, including urban growth boundaries;
-
Strong public support for LRT investments and advocacy from citizens groups (in particular, the 1000 Friends of Oregon) capable of litigating when relevant authorities were not following planning requirements;
-
Unique powers of Metro to influence planning and investments for regional transportation and land use;
-
Strong congressional representation (e.g., as an aid for obtaining federal Transit New Start program funds); and
-
Local and regional policy makers willing to go beyond just channeling growth around transit by pressing developers to increase density, quality of design, and mix of uses in TOD zones, and the persistent use of transit infrastructure investments as a means to enhance community revitalization.
ARLINGTON COUNTY, VIRGINIA, TOD CORRIDORS
The Washington, D.C., area’s 103-mile, 86-station Metrorail system is arguably the nation’s best example of a modern rapid transit system built specifically to incorporate a goal of shaping regional growth. The system, which opened in 1976, is overseen by the Washington Metropolitan Area Transit Authority (WMATA), an independent regional transportation authority involving coordination among the District of Columbia, Maryland, and Virginia.
TOD leadership was exercised early on by Metrorail’s leaders and county planners, who realized in the 1970s that deteriorating corridors and large swaths of underutilized real estate in the region were ripe for redevelopment and provided an opportunity for revitalization through transit investment. Long before the rail system became operational, WMATA’s leaders adopted policies to create a public–private program for promoting development adjacent to Metrorail stations, creating a real estate development department that was given the resources to build a portfolio of holdings and encouraged to pursue joint development opportunities. By 2003, 52 joint development projects had been created around dozens of Metrorail stations.
While successful TOD zones can be found throughout the region (particularly within downtown Washington, D.C., and in Montgomery County, Maryland), Arlington County, Virginia, in particular, is widely hailed as one of the nation’s best TOD success stories. When the Metrorail
lines were being planned initially, a key decision was made to reorient the planned rail line from running along the county’s major highway corridor, Interstate 66, to follow the Rosslyn–Ballston Metrorail corridor of five closely spaced stations that each could be developed into high-density, mixed-use town centers. A second Metrorail corridor along Fairfax Drive—the Jefferson Davis corridor—included stations at Pentagon City and Crystal City.
As these plans have been implemented, Arlington County has experienced major growth and renewal and is now among the most densely populated jurisdictions in the country (estimated at 8,062 persons per square mile in 2008). Since 1980, county office space has nearly doubled to about 44 million square feet, with almost 80 percent located within the two Metrorail corridors (Arlington County Planning Department 2008). Housing growth in the corridors has occurred two to three times more rapidly than the growth of the regional population, with the result that in 2003 there were 1.06 jobs for every employed county resident (Cervero et al. 2004). These trends are attributable in part to the growth of the region in general and the attraction of Arlington as a desirable location close to downtown Washington, but they also reflect the role of the Metrorail corridors as powerful magnets for development. The Arlington County Department of Public Works, for example, estimates that the presence of Metrorail stations attracted nearly $3 billion in real estate development between 1973 and 1990. More than 60 percent of the remaining office development capacity and almost 70 percent of the remaining residential development capacity are forecast to occur within the Metrorail corridors.
Transit ridership has paralleled the growth in development at major stations. Today, Arlington County has one of the highest percentages of transit use in the nation. Of those living along the Metrorail corridors, approximately 39 percent use transit to commute, and 10 percent walk or bike (Cervero et al. 2004). Outside the corridors, only 17 percent commute by transit and 5 percent walk or bike—but these are high transit ridership and walking percentages for most counties.
Of course, the region faces ongoing challenges. These include a lack of affordable housing and some inconsistencies between land use and transportation planning efforts (for instance, some roads near Metrorail stations are more accommodating of high-speed traffic than of pedestrians). The Arlington corridor’s Metrorail lines increasingly struggle with serious overcrowding because there are not enough cars and tracks to meet the booming ridership demand. This shortfall stems in part from inherent design problems but also from more general budget problems. The Washington Metrorail system is virtually the only major transit system in the nation that receives no dedicated stream of revenue for capital or operating costs; rather, it is dependent on operating subsidies from its member jurisdictions, having to compete for the same pool of state and local government general fund revenues that subsidize public safety, education, parks, and many other needs. This situation leaves the system continually vulnerable to the vagaries of local budgeting, often scrambling to fill revenue gaps and unable to address system maintenance and upgrading needs. Despite these challenges, most planners look to the Washington Metrorail system in general, and Arlington County in particular, as a model of TOD, which can provide important lessons for other regions of the country.
Some of Arlington County’s success may be attributable to unique local factors such as strong, stable support among the county board, manager, and other key local officials; a large base of locally rooted jobs in federal government agencies and related contracting organizations; and a manageable physical size (approximately 26 square miles) that made it possible for planners and officials to have a good grasp of the territory and communicate effectively with the community. The primary key to Arlington’s success, however, has been adherence to textbook planning principles. This has included the careful preparation of a general land use plan that set the broad policy framework for all development decisions along targeted growth axes, together with sector plans for orchestrating development activities (including land use and zoning ordinances, urban design, transportation planning, and open-space
guidelines) within quarter-mile “bulls-eyes” of each Metrorail station. These plans have been instrumental in communicating to investors and residents about the types of developments planned and creating a sense of integrity with respect to plans and policies. Ongoing review and revision of the original plans have ensured that developments evolve in response to changing community goals and market conditions. Related keys to success have included the following:
-
A variety of strategies to attract private investments around stations, such as targeted infrastructure improvements and incentive-based, permissive zoning measures;
-
Rezoning of land adjacent to stations to high density while maintaining relatively low density and protecting greenspace in surrounding neighborhoods;
-
Dedication to continually pressing for top-quality design for housing and office developments, with a strong focus on creating attractive, walkable spaces; and
-
Proactive public outreach and community involvement, with business alliances, neighborhood groups, and individual residents frequently being invited to express their opinions on the design and scale of new developments through neighborhood meetings, workshops, and interactive websites.
REFERENCES
Abbreviations
FHWA Federal Highway Administration
NRDC National Resources Defense Council
Arlington County Planning Department. 2008. Profile 2008: Summer Update. www.co.arlington.va.us/Departments/CPHD/planning/data_maps/pdf/page65081.pdf. Accessed Oct. 23, 2008.
Cervero, R., S. Murphy, C. Ferrell, N. Goguts, Y.-H. Tsai, G. B. Arrington, J. Boroski, J. Smith-Heimer, R. Golem, P. Peninger, E. Nakajima, E. Chui, R. Dunphy, M. Myers, S. McKay, and N. Witenstein. 2004. TCRP Report 102: Transit-Oriented Development
in the United States: Experiences, Challenges, and Prospects. Transportation Research Board of the National Academies, Washington, D.C.
Cortright, J., and C. Coletta. 2004. The Young and the Restless: How Portland Competes for Talent. Impresa, Inc.
Cotugno, A., and R. Benner. Forthcoming. Regional Planning Comes of Age. Rutgers University Press, Piscataway, N.J.
Dill, J. 2006. Travel and Transit Use at Portland Area Transit-Oriented Developments. Portland State University, Portland, Ore. www.transnow.org/publication/Reports/TNW2006-03.pdf. Accessed April 22, 2008.
Downs, T. 2004. Still Stuck in Traffic: Coping with Peak-Hour Traffic Congestion. Brookings Institution, Washington, D.C.
Evans, J. J., IV, R. H. Pratt, A. Stryker, and J. R. Kuzmyak. 2007. TCRP Report 95: Traveler Response to Transportation System Changes: Chapter 17—Transit-Oriented Development. Transportation Research Board of the National Academies, Washington, D.C.
FHWA. 2009. Highway Statistics 2007. U.S. Department of Transportation, Washington, D.C. www.fhwa.dot.gov/policyinformation/statistics/2007. Accessed April 1, 2009.
Gustafson, R. 2007. Streetcar Economics: The Trip Not Taken. www.portlandstreetcar. org. Accessed April 22, 2008.
NRDC. 2001. Solving Sprawl. www.nrdc.org/cities/smartgrowth/solve/solveinx.asp. Accessed April 22, 2008.
Podobnik, B. 2002. The Social and Environmental Achievements of New Urbanism: Evidence from Orenco Station. Department of Sociology, Lewis and Clark College, Portland, Ore. www.lclark.edu/~podobnik.orenco02.pdf. Accessed April 8, 2008.
Portland Bicycle Counts Report. 2008. www.portlandonline.com/TRANSPORTATION/index.cfm?c=44671&a=217489. Accessed July 2, 2009.
Switzer, C. R. 2002. The Center Commons Transit Oriented Development: A Case Study. Portland State University, Portland, Ore.


