
10
Transparency of Cost and Performance
INTRODUCTION
The information asymmetry experienced by consumers, providers, and payers shield these critical stakeholders from the information they need to make decisions about what works best for them. However, with recent efforts such as those by the National Committee on Quality Assurance (NCQA) on health plans’ quality transparency and Aetna’s Aexcel initiative on transparency of providers’ clinical quality and cost efficiency, attempts to bridge the gaps in information asymmetry have accelerated. Transparency—of the costs, prices, quality, and effectiveness of medical services and products—has been identified as a key tool to lower costs and improve outcomes (Fung et al., 2008; Mongan et al., 2008; Shea et al., 2007). In this series of discussions, the presenters address the potential of transparency on a variety of facets of the delivery system—including cost, quality, and outcomes—to illuminate vital information for consumers, providers, and payers and stimulate savings and quality improvements.
John Santa from Consumer’s Union characterizes the U.S. healthcare market as one shrouded by obscurity around costs, prices, and quality. Santa suggests that even though the healthcare system depends on market forces to allocate care services, it falls short and places patients and consumers at a distinct disadvantage. However, opportunities to address the information asymmetry in the healthcare market are many. He provides an overview of some of these strategies, including a focus on comparative effectiveness research, which if performed by neutral, credible, and inde-
pendent sources, could provide meaningful comparisons and enable fair cost analyses.
Suggesting that neither price transparency nor comparative effectiveness research are sufficient to optimize healthcare resource allocation, G. Scott Gazelle from the Institute for Technology Assessment at Massachusetts General Hospital contextualizes not only the call for more transparency but the value of cost-effectiveness analysis (CEA). He suggests that CEA provides a method for evaluating the health outcomes and costs of healthcare services relative to one another in a standardized manner in order to ensure that resources are spent on the most effective services. Following a discussion of examples of how CEA has influenced policy, he closes with a description of some of the limits to expanding use of CEA today, including the lack of standards, insufficient investments in workforce training, and political barriers.
Paul B. Ginsburg of the Center for Studying Health System Change addresses the issue of transparency by parsing out price transparency from quality transparency. In a system where consumers feel little impact from variations in pricing because of insurance coverage, for instance, Ginsburg states that the impact of price transparency is significantly mitigated, barring fundamental change to the healthcare market. However, he suggests that quality transparency provides a better tool for engaging providers and informing consumer choices. Access to these data in the form of physical access but also in the form of providing information that is easily understood and used by consumers will drive better quality in health care as consumer decisions supply an incentive for better care.
Peter K. Lindenauer from Tufts University School of Medicine concurs that quality transparency, or what he terms performance transparency, holds promise for enhancing the level of care at lower costs. However, Lindenauer highlights the limited research documenting the effects of these efforts. He explains that performance transparency drives improvements in value through one of two pathways: (1) the selection pathway, whereby patients, physicians, and insurers use information about performance to preferentially seek care from higher-quality or lower-cost providers, and (2) the change pathway, whereby the release of performance data catalyzes provider improvement efforts by appealing to the professionalism of physicians and nurses. While much more research needs to take place to quantify the success of such efforts, Lindenauer estimates that $5 billion in annual savings could be realized through the public reporting of hospital readmission, complication, and healthcare-associated infection rates. He additionally suggests that while there is limited evidence for benefits of transparency on hospital outcomes, assigning savings to transparency could be inherently problematic at some level, since reporting initiatives provide the stimulus for changes in care, but do not directly change care itself.
Margaret E. O’Kane of the NCQA concludes this session by discussing NCQA’s work over the past two decades in advancing an agenda of transparency. Their health plan accreditation and physician recognition programs and the collection and analysis of clinical quality (Healthcare Effectiveness Data and Information Set [HEDIS]) and patient experience/satisfaction (Consumer Assessment of Healthcare Providers and Systems [CAHPS]) measures have already been used across the country to inform plans, providers, patients, and purchasers about the performance of the healthcare system in delivering evidence-based care. O’Kane cites some of the resulting improvements in quality, such as the percentage of children under age 2 years receiving the full complement of vaccinations jumping from 30 percent in 1997 to more than 80 percent in 2007. Even so, she states that the effect on cost trends has not been significant because the national transparency agenda has been naïve and limited. Describing transparency as a major enabler of the value agenda, she outlines a set of policy initiatives to complement the transparency agenda that will optimize quality improvements and address costs.
TRANSPARENCY IN THE COST OF CARE
John Santa, M.D., M.P.H.
Consumers Union
The American healthcare system relies on market forces to ration care. However, these market forces are not those normally considered constructive or functional. Rather than price competition, America rations healthcare costs by not covering a portion of the population for timely health care while requiring the provision of emergency care for all without explicit funding. This leads to a unique set of dysfunctional market behaviors—substantial cost shifting between public and private sectors, increasing preference for healthy patients rather than sick ones, and pricing arrangements that reward errors, inefficiency, and poor outcomes. There are several reasons for this odd construct, but especially notable is the lack of transparency related to price and cost. If we hope to create constructive market forces in health care, some of our solutions must lead to more transparency.
Transparency of Cost and Quality in Health Care
Patients and consumers are now especially disadvantaged when it comes to the lack of transparency around the price and cost of healthcare products and services. Shielded in the past by comprehensive public or private insurance coverage, consumers are faced with substantial increases in
cost sharing. Significant increases in bankruptcy related to healthcare costs for insured middle-class Americans indicate how perilous this transition has become. As costs increase, market proponents should insist that consumers have access to comparative information, the price and cost of the products or services compared, and an analysis of the possible scenarios relevant to their purchasing decision.
Multiple third parties are involved in the American healthcare system that influences the purchasing process. In the case of those publicly insured, various federal and state laws govern the purchasing of health products and services. The political process is the major driver. Many Americans are skeptical of the government’s ability to purchase efficiently and are worried about their market power when they do. For those privately insured, employers are influential in purchasing and setting the levels of cost sharing. As the cost of health care increases and the economic climate worsens, employers are less able to absorb these costs.
Since the 1950s Americans have relied on another third party, health insurers, to purchase services in aggregate and spread the risk among large numbers. Yet, health insurers are unable to influence costs and are often rewarded financially for avoiding sick patients rather than improving care. The recent Ingenix settlement with the New York Attorney General to end the practice of manipulating rates to overcharge patients (U.S. Office of the Attorney General, 2009), for instance, offers yet another reason for Americans to distrust insurers (Booz Allen Hamilton, 2006).
Lastly, consumers rely heavily on their physicians to purchase on their behalf. Consumers are very satisfied with the relationships they have with their individual doctor, though they are less satisfied with their physician’s performance when it comes to costs (Consumer Reports National Research Center, 2009). Consumers believe their doctor’s advice is based on scientific evidence and expert experience. As a profession, physicians have assured Americans for decades that professional behavior, including a commitment to put the fiduciary interests of patients in front of their own fiduciary interests, prevails. However, studies show that practitioners commonly do not provide care consistent with evidence or expert opinion (McGlynn et al., 2003). A recent Consumer Reports poll showed only 4 percent of consumers learned the cost of a prescription drug from the doctor who prescribed it (2009). And large numbers of physicians have pharmaceutical, hospital, and other financial relationships that consumers are unaware of but likely create influential fiduciary relationships in conflict with those of consumers (Campbell et al., 2007).
Opportunities for Change
We are fortunate to have an opportunity to change this process. Comparative effectiveness research, if done by neutral, credible, independent
sources, can provide meaningful comparisons to Americans and enable fair cost analysis. Presented in a transparent, trustworthy context using understandable language, symbols, summaries, and ratings, it may be possible to significantly change the purchasing process for both physicians and consumers. For example, comparative information related to prescription drugs when linked transparently to price and cost information could significantly change the purchasing behavior of Americans (Donohue et al., 2008). Although developing a similar approach for devices, services, institutions, and practitioners will require substantial time and effort, it seems reasonable to pursue next steps.
The Agenda Ahead
A serious commitment to transparency means that we will strive to provide consumers with a comprehensive price and cost analysis, including effectiveness, adverse events, administration, and the impact of individual preferences related to convenience and access. Comprehensive price transparency may seem difficult to do but multiple innovations suggest otherwise. Well-organized practitioner groups, hospitals, and insurers have demonstrated the ability to provide high-quality care at much lower costs while satisfying consumers. They are usually data-driven organizations that are able to understand and track the elements of an outcome and constantly strive to improve value. Evidence is emerging that such approaches may be more likely to satisfy consumers than much more expensive approaches (Rovner, 2009).
Redesign of primary care especially offers a “green field” for better dealing with these issues (Kilo, 2005). Our challenge will be to find an effective way of presenting these choices in a transparent context that includes price and costs.
We know that even modest costs can discourage patients from purchasing health products and services regardless of effectiveness (Lohr, 1986). Our current cost-sharing tools are much too blunt to encourage good outcomes through pricing. But if we have reliable comparative evidence, more sophisticated economic analytic tools can provide consumers with more comprehensive price and cost information (CEA Registry). And we know that patients make different decisions when all the options are presented fairly (Informed Medical Decisions). Americans understand the value of a level “market” playing field—they have just rarely experienced one in health care.
None of this will happen without a sustained commitment to comparative effectiveness research. Price and cost are only relevant in a reliable comparative context. Communication to American practitioners and consumers has been dominated by an industry-influenced context focused on providing more services, not necessarily better or more effective ones. Such reform
requires multiple efforts moving forward while learning lessons from previous mistakes. But once reform is in place, the “invisible hand” of market competition will create a more explicit process that more Americans will be comfortable with than the inequitable process we have now. Imagine a healthcare system that rewards genuine discoveries, exceptional care, and responsiveness to individual preferences and values while driving down the prices for products and services that are similar.
TRANSPARENCY IN COMPARATIVE VALUE OF TREATMENT OPTIONS
G. Scott Gazelle, M.D., Ph.D., M.P.H.
Massachusetts General Hospital and Harvard Medical School
The explosive growth in medical technology and procedures during the last several decades has resulted in improved capability for prevention, screening, diagnosis, and treatment of an ever-expanding number of diseases. The availability and use of these new medical technologies and procedures has also contributed to increased spending, which has put pressure on already strained healthcare budgets. As a result, physicians, payers, and policy makers are increasingly faced with choosing the best or most cost-effective healthcare services from among worthy alternatives, rather than merely differentiating the ones that are effective from those that are not.
When considering the effects of medical technology and procedures (“healthcare services”) on health outcomes and costs, and particularly when evaluating strategies for limiting spending or spending growth, there are several challenges. First, most healthcare services are not cost saving. Some provide better value than others, but virtually all have positive net costs. Second, some healthcare services may not contribute to improved health, either because they are simply not effective or because they do not have beneficial effects if used in the wrong patients or at the wrong time.
Recently, increased attention has been focused on comparative effectiveness research as a means to improve decision making regarding which healthcare services should be used in which patients and under what circumstances. There has also been a call for increased transparency regarding prices, either the prices of specific healthcare services or, more generally, the price profiles of individual providers and hospitals. However, neither comparative effectiveness research nor price transparency alone provide sufficient information to optimize healthcare resource allocation. The only way to systematically reduce costs without reducing health—at the societal or population level—is to reallocate healthcare resources from healthcare services that are less cost-effective to those that are more cost-effective. More generally, to optimize the benefits of healthcare spending, resources must
be allocated based on the relative cost-effectiveness of specific healthcare services. In a very real and meaningful sense, therefore, “cost-effectiveness” defines value, and cost-effectiveness analysis is an essential component of any strategy that seeks to incorporate value transparency into healthcare reform.
Cost-Effectiveness Analysis
CEA is a method for evaluating the health outcomes and costs of healthcare services relative to one another (Russell et al., 1996; Weinstein and Stason, 1977). CEA evaluates relevant alternatives via the incremental cost-effectiveness ratio (ICER). The ICER includes differences in costs between services of interest in the numerator and differences in health effects in the denominator. For ICERs to provide useful metrics for comparison across technologies and diseases, common units for both the numerator and denominator are essential. Thus, ICERs are commonly expressed in terms of dollars per life-year or per quality-adjusted life-year (QALY) gained.
There has been some concern in the United States about including cost—at least explicitly—in comparisons of healthcare services, suggesting that Americans are uncomfortable with the concept of making decisions concerning healthcare spending even partially based on cost. However, as spending continues to grow at unsustainable rates, ignoring cost appears unreasonable. There has also been concern that the use of CEA will lead to rationing of healthcare services, despite the undeniable truth that healthcare services are already de facto rationed in the United States by a number of mechanisms, including: price (tiering, copays, deductibles), constraints on capacity (certificate of need/determination of need rules); and limits on use (preauthorization). Moreover, CEA does not, and need not, invariably lead to rationing, because it combines cost and effectiveness in a transparent manner. Allocating resources based on CEA would be more logical than the current systems used to ration healthcare services.
Using Cost-Effectiveness Analysis in Policy
The potential effect of using CEA in this manner is substantial. If one were to base decisions concerning the allocation of healthcare resources—even partially—on cost-effectiveness, any and all cost drivers could be targeted. Of course, this would depend on the availability of data to inform decision making, but there are numerous examples where rigorously conducted CEA has already been used to support the adoption of cost-effective healthcare services and/or to influence guidelines concerning their use. For example, Prosser and colleagues studied the cost-effectiveness of diet and statin-based cholesterol-lowering therapies according to differ-
ent patient risk factors (Prosser et al., 2000). They found that while most of the strategies recommended by the National Cholesterol Education Program were cost-effective (defined as having an ICER of <$50,000/QALY), several were not (e.g., primary prevention with a statin in patients with a limited number of risk factors). Based in part on their work, the National Cholesterol Education Program guidelines have since been modified. Using a similar analytic approach, Weinstein and colleagues evaluated the cost-effectiveness of genotypic antiretroviral-resistance testing (GART) at the time of virologic failure to guide the choice of subsequent therapy in HIV-infected patients under a wide range of assumptions regarding effectiveness and cost (Weinstein et al., 2001). They found that GART is not only cost-effective in this setting, but that it is also more cost-effective (i.e., lower ICER) than many widely used HIV interventions. This work accelerated the adoption of GART as the standard of care. Finally, Goldie and colleagues evaluated the cost-effectiveness of human papillomavirus (HPV) testing as a primary cervical cancer screening test in combination with cervical cytology in women over the age of 30 (Goldie et al., 2004). Compared with annual screening using conventional cervical cytology, they found that screening at 2- or 3-year intervals with either liquid-based cytology (using HPV DNA testing to guide management of equivocal results) or combined HPV DNA testing and cytology would provide increased protection against cervical cancer while at the same time reducing the average lifetime costs associated with screening. Goldie’s work has influenced screening guidelines in the United States and internationally.
In addition to the formal CEAs cited above, recent efforts by the Institute for Clinical and Economic Review of the Massachusetts General Hospital Institute for Technology Assessment provides an example of how information on the comparative value of healthcare services can be used to influence coverage and reimbursement policy. The institute’s approach is to combine comprehensive review of the medical literature, targeted formal CEA, and input from an expert review group composed of relevant stakeholders to provide an assessment of the comparative effectiveness and value of specific healthcare services. One example of the institute’s work is their assessment of coronary computerized tomography (CT) angiography, upon which the State of Washington Health Care Authority’s coverage policy is based.
Capitalizing on the Potential of Cost-Effectiveness Analysis
CEA has the potential to improve the efficiency of healthcare resource allocation in both the short and long term. In the short term, there are numerous completed or ongoing CEAs that are relevant to critical issues in healthcare policy; a few representative examples were briefly summarized
above. Though each of these has had some influence on the adoption of cost-effective healthcare services, the use of these analyses and others like them to influence healthcare policy could be expanded. In the longer term, given sufficient attention to addressing the challenges in the preceding paragraph, virtually all healthcare resource allocation decisions could be guided by CEA. Even if factors other than the ICERs of specific healthcare services were allowed to influence coverage and reimbursement policy, such an approach has the potential to curtail spending growth or reduce costs without reducing the health of the population. Ultimately, the extent to which we “bend the curve” versus reducing overall healthcare spending with such a strategy would depend on the threshold ICER below which services are considered cost-effective.
Looking Forward
In sum, when considering the potential of value transparency to help reduce costs and improve outcomes, CEAs are a critical component for success. If the U.S. healthcare system were to move toward more explicit use of CEA to influence coverage and/or reimbursement policy, a number of challenges will need to be addressed. First, though several well-conducted, policy-relevant analyses have been published or are underway, the CEA evidence base is currently insufficient to guide comprehensive healthcare policy. Second, the quality of existing analyses is variable; for example, not all have adhered to the consensus recommendations of the U.S. Department of Health and Human Services Panel on Cost-Effectiveness in Health and Medicine (Gold et al., 1996; Russell et al., 1996; Siegel et al., 1996; Weinstein et al., 1996). Third, the pool of investigators who can conduct these analyses is currently limited. Fourth, the infrastructure—and funding—to prioritize and support the research is underdeveloped. Fifth, failed prior experiments (e.g., Oregon’s attempt in the mid-1990s) may bias against the feasibility and acceptability of such an approach.
Potential policy approaches range widely. Starting with the most aggressive, one could approve or deny coverage for all healthcare services based on a single explicit ICER threshold. This would require a comprehensive evidence base of rigorous CEAs that were conducted according to established analytic guidelines. A somewhat less aggressive approach would be to create incentives for patients and providers to forego marginally beneficial services (i.e., those with high ICERs) using strategies such as tiering, copayments, and coinsurance that are based on the relative cost-effectiveness of different services (this would still require a sufficiently robust evidence base). If a more hands-off approach were desired, a possible strategy would be to develop standards for CEA, establish priorities to guide the research, expand funding, and then trust the market to use the information wisely.
What we cannot do is to ignore costs while focusing on comparative clinical effectiveness alone and hope that somehow this will lead to the use of beneficial services that are not too expensive. Ultimately, perhaps the biggest challenge will be to get the message right; namely, that allowing the concept of value to influence decisions about healthcare spending will improve the efficiency and quality of the healthcare system, not worsen it.
PROVIDER PRICE AND QUALITY TRANSPARENCY
Paul B. Ginsburg, Ph.D.
Center for Studying Health System Change
Amidst the healthcare debate, a general call for greater transparency has emerged. The confluence of two major trends has fueled the fire behind this call. First, there has been an ongoing movement to more open and accountable institutions throughout society. Second, the healthcare consumerism movement has gained momentum, envisioning consumers assuming more responsibility for and control over their health and health care.
Theoretically, greater transparency about price and quality can work through two mechanisms. First and most straightforward are wiser provider choices. To the degree that transparency leads to different provider choices and volume is shifted to providers that are more efficient or higher in quality, this will improve health care overall. But the superior providers have only so much capacity to increase patient loads. This suggests that larger effects will require changes by lower-performing providers to improve, motivated by loss of patients who are seeking improved efficiency and quality.
To achieve that will require a critical mass of patients choosing differently on the basis of improved data. But today’s reality is far from this ideal. Few patients have financial incentives to consider provider efficiency, and most have little awareness of provider quality differences. As such, the potential for transparency to have major impacts on efficiency and quality in the near term is not underappreciated but overstated. However, quality transparency as an engine for better consumer choices and more engagement by providers to raise the bar of practice has the most potential for success.
Price Transparency: A Limited Approach
Consumer responsiveness to price requires price data that are meaningful to them. For example, when consumers need to have a problem addressed, they have more interest in what the episode of care will cost them than in the prices of individual services that make up the episode. But
most price data available today is unit prices rather than price for episodes. Although hospital price transparency started off with the publication of “chargemasters,” insurers are increasingly providing averages of ranges of costs per admission for different types of patients. But care is still priced by service. Should provider payment reform advance so that payment moves from fee-for-service to payment for episodes or for patients’ needs over a period of time, this would advance the effectiveness of price transparency. Providers would then be quoting prices for units of care that are more meaningful to consumers.
A separate challenge in making price data meaningful to consumers involves customizing price data for a consumer’s health insurance. This is a major shortcoming of government price transparency initiatives, which do not reflect what insured patients will have to pay. Insurers have the potential to play a valuable intermediary function, since they can present information to their enrollees that reflects not only the benefit structure of their plan but prices that the insurer has negotiated with providers (for care delivered by network providers). Insurers have the potential to go to the next level by analyzing data on provider practice patterns to inform their enrollees about costs per episode, but individual insurers often have insufficient data on physicians to capture their practice patterns. Pooling data among private insurers and Medicare could sharply improve insurers’ ability to support their enrollees with meaningful data on price.
Most current insurance benefit structures mute the effects of price in a normal market and do not provide the incentives for patients to choose lower-cost providers. Copayments, such as a uniform dollar amount per hospital day or per admission or per physician visit, provide no incentive whatsoever. Coinsurance, where the patient pays a percentage of the bill, such as 25 percent, dilutes the price difference substantially. Even large deductibles, which have the potential for providing undiluted incentives to choose providers on the basis of price, do not work if the patient expects to exceed the deductible, which will be the case for almost every inpatient hospital admission.
Price transparency becomes more meaningful under reference pricing, which is a mechanism in which a low-cost provider is identified as the reference or baseline. Consumers are covered for the price of that baseline level of service, but they can choose services provided by others and pay the price above and beyond the reference price. This approach is used for prescription drug benefits in Germany and other countries; many manufacturers reduce their price to the reference price. This strategy balances the importance of covering healthcare services with the need for some market forces acting on controlling pricing and costs.
Insurers today have a great opportunity to provide consumers with pricing information about both in-network and out-of-network care. By
lifting the mask on prices that comes with flat fee copayment structures, for example, consumers have more information with which to make decisions about what providers to use. The recent settlement between New York State Attorney General Cuomo and health insurers to build a publicly accessible database of billed charges is a substantial step forward toward this goal.
Quality Transparency: The Harder Hitting Strategy
Transparency initiatives focused on quality transparency may in fact be more successful in the nearer term than the price transparency just discussed. Unlike price transparency, where there are formidable obstacles to price data affecting consumer choice, data on quality of providers has a much clearer path to consumer decision making.
Everyone wants to go to the best doctor and receive the best care. But even so, it is critical still to raise consumer awareness of the existence of gaps in provider quality and in the consequences of those gaps (Hibbard and Pawlson, 2004). The more aware consumers are of the ill effects of poor-quality care, the stronger the movement to build transparency initiatives that help patients choose providers wisely and inspire physicians, hospitals, and other providers to improve their performances.
Transparency means much more than access to data on quality. Effective quality reporting needs to reflect different consumer abilities to understand and use information. Sophisticated consumers may seek and understand more detailed and complex data, while others might be satisfied with less-detailed descriptions of provider quality. A key aspect of presenting quality information is how much data aggregation to perform. The most aggregated data would be a simple binary score for a hospital or physician, such as “preferred” or “not preferred.” The opposite extreme would be specific quality information for each service provided. The virtue of highly aggregated information is the packaging of complex information into understandable and actionable concepts. For consumers with lower levels of literacy and numeracy, visual cues, such as a star rating, or simple designations, such as “high performance,” may be useful (Peters, 2008). Research shows that comparative information on hospital quality can be presented in different ways “to ease the cognitive burden and highlight the meaning of important information” (Peters et al., 2007).
The downside of aggregation is that condensing complex information into simple measures may not meet the information needs of all consumer audiences. For example, a hospital might receive very different quality ratings for different types of patients or services. A hospital could have outstanding quality for cardiovascular surgery but be poor at treating congestive heart failure or performing hip replacements. So aggregating hospi-
tal quality into a single measure would mask variation, potentially masking a great deal of information that could be valuable to consumers.
But consumers are not the only ones whose choices and behaviors change in the face of quality data. Providers have repeatedly shown substantial responsiveness to data on quality. Research by the Center for Studying Health System Change has documented the degree to which hospitals are working to improve their scores on items measured by the Centers for Medicare & Medicaid Services (CMS) and the Joint Commission (Pham et al., 2006). Elements of strategic planning (the potential that measures will be used by payers or patients in the future) or professionalism (few want to knowingly deliver poor quality services or be perceived poorly by peers) probably play a role in motivating efforts to improve quality that is measured and available to the public. Quality data on specialists can also help primary care physicians make better referrals.
Realizing Quality Transparency
Defining quality is challenging, but how the approach is implemented is also important. Involving providers in the development of measures is critical to foster credibility of the information to providers, who have the potential to influence patient acceptance as well as use the data to improve quality. The experience of California Hospital Compare, which audits hospital quality data, has demonstrated how important an audit process can be (Tu and Lauer, 2009). Intermediaries that are trusted by consumers, such as Consumers Union, can play an instrumental role in analyzing publicly reported quality data and disseminating it to different audiences. Government too can play a key role. It can collect quality data; convene payers and providers to foster agreements on measurement of quality; support the pooling of information about providers that today is spread over both public insurers and private insurers; and, finally, set standards for integrated technology and subsidize efforts to build the necessary information technology to support those systems.
TRANSPARENCY TO IMPROVE THE VALUE OF HOSPITAL CARE
Peter K. Lindenauer, M.D., M.Sc.
Tufts University School of Medicine
Spending on hospital care consumes roughly $700 billion each year in the United States, approximately 32 percent of the national healthcare budget, and it is increasing 7 percent annually, nearly twice the overall rate of inflation (Hartman et al., 2009). Rising prices drive less than half of this increase, with growing service intensity per individual patient, number of
encounters per patient, and population growth driving the remainder of the increase. Yet growing expenditures have not led to increasing quality and safety of care, but instead persistent, wide variation in care. Gregory reported recently that 22 percent of newborn deliveries in California were associated with a maternal or child complication, the rate varying from 30 to 90 percent across hospitals (Gregory et al., 2009). Jencks observed that rates of rehospitalization of Medicare beneficiaries within 30 days of discharge vary dramatically across the United States—ranging from less than 15 percent in some Western states to over 21 percent in the South (Jencks et al., 2009). Mounting evidence suggests that additional spending does not translate into improved performance on quality measures or better outcomes. Yasaitis and colleagues examined the relationship between end-of-life spending on chronically ill Medicare beneficiaries at hospitals in New York and Los Angeles and found little if any correlation between spending patterns and hospital relative performance on quality of care measures for patients with acute myocardial infarction, heart failure, or pneumonia (Yasaitis et al., 2009). Jha noted that the mortality rates at hospitals with higher-risk adjusted cost of care were no better than those whose costs were lower (Jha et al., 2009).
A Suggested Solution
Among the many strategies aimed at improving quality and decreasing costs, transparency has become a central focus of both public and private efforts (Marshall et al., 2000). In principle, greater transparency of hospital quality and price information might improve the value of hospital care through two interrelated pathways (Figure 10-1) (Berwick et al., 2003; Fung et al., 2008). First is the selection pathway. Patients, physicians, and insurers use information about performance to preferentially seek care from higher-quality or lower-cost providers. The net effect is a greater proportion of patients being cared for at higher-quality institutions. Second is the change pathway. The release of performance data catalyzes improvement efforts at hospitals by appealing to the professionalism of physicians and nurses and the desire of senior hospital leaders to preserve or enhance the hospital’s reputation and market share.
Attractive Strategy, But Limited Evidence of Efficacy
Yet while transparency may be an appealing strategy, the evidence of its impact remains limited. RAND recently completed a systematic review of some 50 studies that have evaluated the impact of transparency and found the methodological quality of most studies to be relatively weak; most were simple before-after studies without controls or were qualitative (Fung et al.,
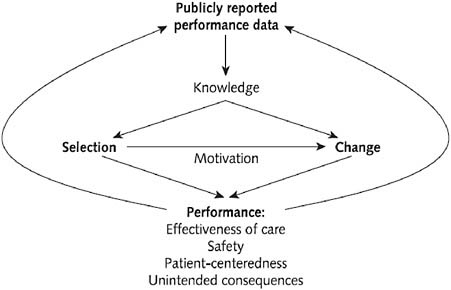
FIGURE 10-1 Two pathways through which transparency might lead to improved hospital value.
2008). Results from those focused on hospital care suggest that while the public release of performance data consistently stimulates quality improvement activity, its effects on outcomes are less certain, and it has had little if any impact on patient selection. In one well known example, Hibbard and colleagues described the results of a trial of transparency in Wisconsin, in which hospitals were assigned to public reporting, private reporting, or no reporting of performance. Like most studies focused on assessing the impact of reporting on the change pathway, she found that those in the public reporting group reported nearly twice as many quality improvement activities as control hospitals (Hibbard et al., 2003). In a study which sought to determine the effects of the New York State Cardiac Surgery Reporting System, Peterson reported that 30-day mortality following coronary bypass surgery declined 33 percent between 1987 and 1992, while over the same time period national mortality rates declined by only 19 percent (Peterson et al., 1998). Yet, in another study of the New York State Cardiac Surgery Reporting System, Jha found that hospitals identified as having high risk adjusted mortality rates experienced no decline in their market share (Jha and Epstein, 2006).
Transparency is unlikely to have a marked effect on hospital selection by patients for several reasons. First, hospital care is complex, and patients often do not know what condition they have or what services they need—and they rely on physicians to tell them. Second, patients are often
not in a position to choose which hospital to go to. In emergency settings the ambulance typically chooses the nearest facility, while in elective settings patients usually select a physician, whose admitting privileges determines hospital choice. Third, information about quality remains limited and conflicting, with the results and recommendations dependent on which Web site one chooses to search. Finally, there are often few hospital providers in a local market, limiting the scope of choice.
Another Possible (Yet Limited) Strategy: Price Transparency
While evidence about the benefits of transparency of information about the quality of hospital care is limited, even less is known about the effects of price transparency. In theory, price transparency could reduce price discrimination (different prices charged to different patients) and price dispersion (variation in prices for the same condition or procedure across hospitals), but it can have unintended consequences on average prices, especially in concentrated markets (Austin and Gravelle, 2007). Further, there are multiple reasons why hospital price transparency is unlikely to have substantial effects on selection by patients. In addition to the reasons highlighted earlier relating to patient’s use of information about quality, third-party payment blunts the impact of prices—even for those in high-deductible plans—since a typical hospital admission quickly exceeds even the largest of copayments. Finally, price is often confused by patients as a signal for quality, with higher prices indicating better care (Ginsburg, 2007). One of the few natural experiments with price transparency for hospital care has taken place in California, where legislation was enacted in 2003 requiring hospitals to make information about prices available to the public. Over the next several years officials observed no change in price dispersion for newborn delivery, a condition which is better suited than acute myocardial infarction for patients to use pricing information to guide selection, and found no correlation between changes in average daily charges and delivery volumes (Austin and Gravelle, 2007).
How Might Transparency Lead to Cost Savings and Better Outcomes
Unlike many other transparency initiatives, the public reporting of readmission, complication, and healthcare-associated infection rates offers the promise of simultaneously lowering costs while improving the outcomes of care. Extrapolating from the benefits of the New York State Cardiac Surgery Reporting System, and relying on data from the Medicare Payment Advisory Commission, Centers for Disease Control and Prevention (CDC), and the Agency for Healthcare Research and Quality on the costs and preventability of these complications, transparency could in theory result in as
much as $5 billion in annual savings (MedPAC, 2008; Scott II, 2009; Zhan and Miller, 2003) (Table 10-1).
But, again, there are several caveats to this estimate. First, as has been discussed, evidence for the benefits of transparency on hospital outcomes is weak from an evidence-based medicine perspective. Second, assigning savings to transparency is inherently problematic since reporting initiatives provide the stimulus for changes in care, but do not directly improve care themselves, thus creating a risk of double counting savings. For example, hospitals may address high medication-related complication rates by investing in a computerized provider order entry system with decision support. Yet it is not entirely clear how one ought to apportion the resulting savings between the two strategies. Another caveat is that hospital leaders may be less motivated to reduce high readmission rates than high mortality or poor process measures since readmission is less clearly a marker of poor quality and because in today’s environment readmissions represent a significant source of hospital revenue. This suggests that financial incentives are likely to be a necessary adjunct to readmission reporting. Additionally, hospital beds “opened up” by fewer readmissions and shorter lengths of stay from decreased complications may actually be filled by other patients—some of whom may be undergoing unnecessary procedures that contribute to the overall rise in healthcare spending.
TABLE 10-1 Estimating Savings from Reduced Readmission, Healthcare-Associated Infections and Complications
Conclusion
Achieving the potential benefits of transparency requires a great deal more development and work to advance from the current position. Limited by scant evidence of effect and inconsistent characterizations of price and performance transparency, the implementation of this strategy may be promising but difficult to realize. We will need to broaden and strengthen readmission, complication, and healthcare-associated infection reporting requirements, necessitating an investment in measure development and risk adjustment methodologies, improvements in documentation and coding, standardization of reporting, and tighter linkage to payment. Further, given that awareness and trust of public reporting sites is still low, those leading reporting initiatives must make an even greater effort to engage patients in using performance data—through advertising, better Web design, and the incorporation of social networking features into the Web sites. For example, in a recent Kaiser Family Foundation survey only 8 percent of U.S. adults were aware of the government Web site Hospital Compare (Kaiser Family Foundation, 2008).
Over the longer term it is imperative that we develop and implement measures with greater value to patients. This means paying greater attention to elective procedures and measuring outcomes other than mortality and complications. To achieve this vision the effort of collecting the necessary data must be streamlined, and better incorporated in the workflow of frontline physicians and nurses through the electronic medical record. More ambitious goals, such as extending the reporting beyond the inpatient or even 30-day window or combining physician and hospital quality and cost information, will require fundamental changes to how hospital care is paid for. Ultimately, transparency is an essential feature of open, democratic societies, one that is impossible to adequately value in economic terms. This, in itself, is reason enough to support the strengthening of current and future reporting initiatives.
HEALTH PLAN TRANSPARENCY
Margaret E. O’Kane, M.H.A.
National Committee for Quality Assurance
For 20 years, the National Committee for Quality Assurance has advanced an agenda rooted in the concepts of measurement, transparency, and accountability. Through our health plan accreditation and physician recognition programs and collection and analysis of clinical quality (HEDIS) and patient experience/satisfaction (CAHPS) measures, we have informed plans, providers, patients, and purchasers about the performance of the healthcare
system in delivering evidence-based care. We have publicized this information through public report cards, frequent reports on the state of healthcare quality and, most recently, through our joint venture with U.S. News and World Report ranking America’s best health insurance plans.
These efforts have produced some dramatic improvements in quality performance. For example, the percentage of patients in accountable health plans that receive a beta blocker after a heart attack rose from 63 percent in 1996 to 98 percent in 2006. The percentage of children under age 2 years receiving the full complement of vaccinations jumped from 30 percent in 1997 to more than 80 percent in 2007. Finally, the percentage of diabetic patients with controlled blood pressure (less than 140/90 mmHg) jumped from 39 percent in 1999 to 62 percent in 2007 (National Committee for Quality Assurance, 2008).
Current Challenges
Despite these improvements, much more progress is clearly needed. The successes, while important, have been limited to the portion of the healthcare industry that has either embraced accountability on its own or has done so in response to regulatory requirements or purchaser demand. In 2008, for example, 106 million Americans were covered by plans that report HEDIS, the highest in history. Yet that leaves nearly 200 million people outside that circle. But among both those plans that have adopted accountability systems and those that have not, much more could be done to be transparent. Current obstacles to more transparency are many. For instance, as costs balloon, large purchasers increasingly select plans on the basis of costs or provider discount. Another obstacle is that small employers typically have little leverage with plans and are not in a position to drive a quality agenda. Also, with some prominent exceptions, purchasers have not rewarded high-performing plans. And, though many Medicaid programs have used pay for performance for plans and providers, Medicare is woefully behind the times in the use of these effective incentives. One large obstacle is that consumers often have little or no choice of health plans. Finally, many health plans have been ambivalent about their role in quality.
It is fair to say that transparency has had little to no effect on health insurance cost trends and the overall performance of plans for several reasons. The ability of plans to create value networks has been limited by monopsony1 providers, market pressure for broad networks, and “any willing provider” requirements. The retreat from capitation to fee-for-service
fueled massive growth in medical premiums and spending. Purchaser and plan ambivalence about use management has limited the ability of plans to deny coverage of unproven treatments and technologies. Finally, concerns by some purchasers and many consumers that they will need to trade costs for quality leave them wary of addressing either.
But even where transparency has improved quality, the effect on cost trends in health insurance has not been significant. We have had a naïve transparency agenda, often predicated on the idea that the free market works in health care. The assumption is that the mere publication of price and quality information will drive people to choose the best health plans. However, this assumption depends on health care operating as a free market—an enormous logical leap.
It is useful to recall that the economic conditions for a perfect market include many suppliers and few barriers to entry; consumer willingness to pay as a source of financial discipline; a relatively homogeneous product; and enough useful consumer information for consumers to make the best buy (Lipsey and Lancaster, 1957). None of these conditions exist in health care: there is an uneven distribution of providers and often monopsony market conditions, third-party payers insulate consumers from true costs, the product is extremely variable and difficult to define, and quality information is still limited and difficult for most consumers to understand.
Further complicating matters, policy makers are ambivalent about driving a value agenda; providers induce demand for their services; patients are not in a position to choose when services are actually received; and benefit design differences make it difficult to compare options.
The Value Agenda
We are at a moment in time when the desire by the federal government to drive a value agenda has become clear. Transparency is a major enabler of the value agenda, but it needs to be accompanied by other reforms in order to optimize quality improvement and address costs. A value agenda must motivate significant action among health plans, hospitals, and other institutional providers, physicians, and consumers. Such an agenda would include the following:
-
Public programs should require health plans to report HEDIS and CAHPS and maintain accreditation.
-
“Insurance exchanges” should mandate collection and reporting of performance data by participating plans and demonstrate, through their accreditation, that they protect consumers’ rights. These exchanges can also use benchmarked performance results, prices, and other proven methods to influence consumers to select high-value plans.
-
Hospital payments should be aligned with performance across public and private payers. So-called never events should not be reimbursed, hospital infection rates should be publicly reported with payments adjusted accordingly, and there should be payment rewards for other aspects of high performance. The Hospital Consumer Assessment of Healthcare Providers and Systems (HCAHPS), for example, offers many opportunities for improvement that go beyond patient satisfaction to patients’ experiences with inpatient care.
-
Physician payment should be reformed to reward coordination of care and enable use of new technology and team-based care (Shih et al., 2008).
-
Consumer incentives also need to be aligned for value, with serious rewards for those who use value networks and participate in medical homes, disease management, or wellness programs according to their health needs. Value-based insurance design should encourage the use of high-value treatments and discourage treatments of small or negative value.
This agenda needs to be accompanied by a major education and communication strategy that explains to all Americans their role in the reform of health care. Transparency of health plan information has delivered some benefits, but it has also taught us that transparency needs to be coupled with a multifaceted strategy of payment reform, delivery system redesign, and consumer incentives and education if we are to achieve affordable high-quality health care.
REFERENCES
Austin, A., and J. Gravelle. 2007. Does price transparency improve market efficiency? Implications of empirical evidence in other markets for the health sector. http://stinet.dtic.mil/oai/oai?&verb=getRecord&metadataPrefix=html&identifier=ADA471238 (accessed August 26, 2009).
Berwick, D. M., B. James, and M. J. Coye. 2003. Connections between quality measurement and improvement. Medical Care 41(1 Suppl):I30-I38.
Booz Allen Hamilton. 2006. Consumer Survey. http://www.booz.com/media/file/Competing_Retail_Health_Consumer_MP.pdf (accessed July 31, 2009).
Campbell, E. G., R. L. Gruen, J. Mountford, L. G. Miller, P. D. Cleary, and D. Blumenthal. 2007. A national survey of physician-industry relationships. New England Journal of Medicine 356(17):1742-1750.
CEA Registry. CEA registry. https://research.tufts-nemc.org/cear/default.aspx (accessed July 31, 2009).
Consumer Reports. 2009. Sticker shock at the pharmacy counter. http://www.consumer-reports.org/health/prescription-drugs/sticker-shock-at-the-pharmacy-counter/overview/sticker-shock-at-the-pharmacy-counter.htm?resultPageIndex=1&resultIndex=1 (accessed July 31, 2009).
Consumer Reports National Research Center. 2009. Personal communication: Survey 1993 and 2006. Consumer Reports National Research Center.
Donohue, J. M., M. Fischer, H. H.A. and W. J. 2008. Savings associated with increased use of Consumer Reports Best Buy Drugs. Health Services Research 45(3):1557-1575.
Fung, C. H., Y. W. Lim, S. Mattke, C. Damberg, and P. G. Shekelle. 2008. Systematic review: The evidence that publishing patient care performance data improves quality of care. Annals of Internal Medicine 148(2):111-123.
Ginsburg, P. B. 2007. Shopping for price in medical care. Health Affairs (Millwood) 26(2): w208-w216.
Gold, M. R., J. E. Siegel, L. B. Russel, and M. C. Weinstein. 1996. Cost-Effectiveness in Health and Medicine. New York: Oxford University Press.
Goldie, S. J., J. J. Kim, and T. C. Wright. 2004. Cost-effectiveness of human papillomavirus DNA testing for cervical cancer screening in women aged 30 years or more. Obstetrics & Gynecology 103:619-631.
Gregory, K. D., M. Fridman, S. Shah, and L. M. Korst. 2009. Global measures of quality- and patient safety-related childbirth outcomes: Should we monitor adverse or ideal rates? American Journal of Obstetrics & Gynecology 200(6):681 e681-e687.
Hartman, M., A. Martin, P. McDonnell, and A. Catlin. 2009. National health spending in 2007: Slower drug spending contributes to lowest rate of overall growth since 1998. Health Affairs (Millwood) 28(1):246-261.
Hibbard, J., and L. G. Pawlson. 2004. Why not give consumers a framework for understanding quality? The Joint Commission Journal on Quality and Patient Safety 30(6):347-351.
Hibbard, J. H., J. Stockard, and M. Tusler. 2003. Does publicizing hospital performance stimulate quality improvement efforts? Health Affairs (Millwood) 22(2):84-94.
Informed Medical Decisions. Informed medical decisions. http://www.informedmedical decisions.org/ (accessed July 31, 2009).
Jencks, S. F., M. V. Williams, and E. A. Coleman. 2009. Rehospitalizations among patients in the Medicare fee-for-service program. New England Journal of Medicine 360(14):1418-1428.
Jha, A. K., and A. M. Epstein. 2006. The predictive accuracy of the New York State coronary artery bypass surgery report-card system. Health Affairs (Millwood) 25(3):844-855.
Jha, A. K., E. J. Orav, A. Dobson, R. A. Book, and A. M. Epstein. 2009. Measuring efficiency: The association of hospital costs and quality of care. Health Affairs (Millwood) 28(3):897-906.
Kaiser Family Foundation. 2008. Update on Consumers’ Views of Patient Safety and Quality Information. http://www.kff.org/kaiserpolls/upload/7819.pdf (accessed July 30, 2009).
Kilo, C. M. 2005. Transforming care: Medical practice design and information technology. Health Affairs (Millwood) 24(5):1296-1301.
Lipsey, R., and K. Lancaster. 1957. The general theory of second best. The Review of Economic Studies 24(11-32).
Lohr, K. N. 1986. Use of medical care in the Rand health insurance experiment: Diagnosis and service specific analysis in a randomized controlled trail. Medical Care 24:S1-S87.
Marshall, M. N., P. G. Shekelle, S. Leatherman, and R. H. Brook. 2000. The public release of performance data: What do we expect to gain? A review of the evidence. Journal of the American Medical Association 283(14):1866-1874.
McGlynn, E. A., S. M. Asch, J. Adams, J. Keesey, J. Hicks, A. DeCristofaro, and E. A. Kerr. 2003. The quality of health care delivered to adults in the United States. New England Journal of Medicine 348(26):2635-2645.
MedPAC (Medicare Payment Advisory Commission). 2008. Report to the Congress: Reforming the Delivery System. http://www.medpac.gov/documents/Jun08_EntireReport.pdf (accessed July 30, 2009).
Mongan, J. J., T. G. Ferris, and T. H. Lee. 2008. Options for slowing the growth of health care costs. New England Journal of Medicine 358(14):1509-1514.
National Committee for Quality Assurance. 2008. 2008 State of Health Care Quality Report. National Committee for Quality Assurance.
Pennsylvania Health Care Cost Containment Council. 2009. Hospital-Acquired Infections in Pennsylvania Data Reporting Period: 2006 & 2007. http://www.phc4.org/reports/hai/07/docs/hai2007report.pdf (accessed July 30, 2009).
Peters, E. 2008. Numeracy and the perception and communication of risk. Annals of the New York Academy of Sciences 1128:1-7.
Peters, E., N. Dieckmann, A. Dixon, J. H. Hibbard, and C. K. Mertz. 2007. Less is more in presenting quality information to consumers. Medical Care Research and Review 64(2):169-190.
Peterson, E. D., E. R. DeLong, J. G. Jollis, L. H. Muhlbaier, and D. B. Mark. 1998. The effects of New York’s bypass surgery provider profiling on access to care and patient outcomes in the elderly. Journal of the American College of Cardiology 32(4):993-999.
Pham, H. H., J. Coughlan, and A. S. O’Malley. 2006. The impact of quality-reporting programs on hospital operations. Health Affairs (Millwood) 25(5):1412-1422.
Prosser, L. A., A. A. Stinnett, P. A. Goldman, L. W. Williams, M. G. M. Hunink, L. Goldman, and M. C. Weinstein. 2000. Cost-effectiveness of cholesterol-lowering therapies according to selected patient characteristics. Annals of Internal Medicine 132:769-779.
Rovner, J. 2009. Providing better health care for less money. http://www.npr.org/templates/story/story.php?storyId=106875583 (accessed July 31, 2009).
Russell, L. B., M. B. Gold, J. E. Siegel, N. Daniels, and M. C. Weinstein. 1996. The role of cost-effectiveness analysis in health and medicine. Journal of the American Medical Association 276(14):1172-1177.
Scott II, R. 2009. The Direct Medical Costs of Healthcare-Associated Infections in U.S. Hospitals and the Benefits of Prevention. http://www.cdc.gov/ncidod/dhqp/pdf/Scott_CostPaper.pdf (accessed July 30, 2009).
Shea, K., A. Shih, and K. Davis. 2007. Health care opinion leaders’ views on the transparency of health care quality and price information in the United States. http://www.commonwealthfund.org/usr_doc/Shea_HCOLtransparencysurveydatabrief_1078.pdf?section=4039 (accessed October 5, 2009).
Shih, A., S. Schoenbaum, A. Gauthier, R. Nuzum, and D. McCarthy. 2008. Organizing the U.S. Healthcare Delivery System for High Performance. The Commonwealth Fund.
Siegel, J. E., M. C. Weinstein, L. B. Russell, and M. R. Gold. 1996. Recommendations for reporting cost-effectiveness analyses. Journal of the American Medical Association 276(16):1339-1341.
Tu, H. T., and J. R. Lauer. 2009. Designing effective health care quality transparency initiatives. Issue Brief Center for Studying Health System Change (126):1-6.
U.S. Office of the Attorney General. 2009. Attorney General Cuomo announces historic nationwide health insurance reform; ends practice of manipulating rates to overcharge patients by hundreds of millions of dollars. http://www.oag.state.ny.us/media_center/2009/jan/jan13a_09.html (accessed July 31, 2009).
Weinstein, M. C., and W. B. Stason. 1977. Foundations of cost-effectiveness analysis for health and medical practices. New England Journal of Medicine 296:716-721.
Weinstein, M. C., J. E. Siegel, M. R. Gold, M. S. Kamlet, and L. B. Russell. 1996. Recommendations of the panel on cost-effectiveness in health and medicine. Journal of the American Medical Association 276(15):1253-1258.
Weinstein, M. C., S. J. Goldie, E. Losina, C. J. Cohen, J. D. Baxter, H. Zhang, A. D. Kimmel, and K. A. Freedberg. 2001. Use of genotypic resistance testing to guide hiv therapy: Clinical impact and cost-effectivenesss. Annals of Internal Medicine 134:475-477.
Yasaitis, L., E. S. Fisher, J. S. Skinner, and A. Chandra. 2009. Hospital quality and intensity of spending: Is there an association? Health Affairs (Millwood) 28(4):w566-w572.
Zhan, C., and M. R. Miller. 2003. Excess length of stay, charges, and mortality attributable to medical injuries during hospitalization. Journal of the American Medical Association 290(14):1868-1874.


