9
Sulfur Dioxide1
Acute Exposure Guideline Levels
PREFACE
Under the authority of the Federal Advisory Committee Act (FACA) P. L. 92-463 of 1972, the National Advisory Committee for Acute Exposure Guideline Levels for Hazardous Substances (NAC/AEGL Committee) has been established to identify, review and interpret relevant toxicologic and other scientific data and develop AEGLs for high priority, acutely toxic chemicals.
AEGLs represent threshold exposure limits for the general public and are applicable to emergency exposure periods ranging from 10 minutes (min) to 8 hours (h). Three levels—AEGL-1, AEGL-2 and AEGL-3—are developed for each of five exposure periods (10 and 30 min, 1 h, 4 h, and 8 h) and are distinguished by varying degrees of severity of toxic effects. The three AEGLs are defined as follows:
AEGL-1 is the airborne concentration (expressed as parts per million or milligrams per cubic meter [ppm or mg/m3]) of a substance above which it is predicted that the general population, including susceptible individuals, could experience notable discomfort, irritation, or certain asymptomatic, non-
sensory effects. However, the effects are not disabling and are transient and reversible upon cessation of exposure.
AEGL-2 is the airborne concentration (expressed as ppm or mg/m3) of a substance above which it is predicted that the general population, including susceptible individuals, could experience irreversible or other serious, longlasting adverse health effects or an impaired ability to escape.
AEGL-3 is the airborne concentration (expressed as ppm or mg/m3) of a substance above which it is predicted that the general population, including susceptible individuals, could experience life-threatening health effects or death.
Airborne concentrations below the AEGL-1 represent exposure levels that could produce mild and progressively increasing but transient and nondisabling odor, taste, and sensory irritation or certain asymptomatic, non-sensory effects. With increasing airborne concentrations above each AEGL, there is a progressive increase in the likelihood of occurrence and the severity of effects described for each corresponding AEGL. Although the AEGL values represent threshold levels for the general public, including susceptible subpopulations, such as infants, children, the elderly, persons with asthma, and those with other illnesses, it is recognized that individuals, subject to idiosyncratic responses, could experience the effects described at concentrations below the corresponding AEGL.
SUMMARY
Sulfur dioxide is a colorless gas at ambient temperature and pressure. It can be detected by taste at concentrations of 0.35-1.05 ppm and has a pungent, irritating odor with an odor threshold of 0.67-4.75 ppm. Sulfur dioxide is used in the production of sodium sulfite, sulfuric acid, sulfuryl chloride, thionyl chloride, organic sulfonates, disinfectants, fumigants, glass, wine, industrial and edible protein, and vapor pressure thermometers. It is also used during the bleaching of beet sugar, flour, fruit, gelatin, glue, grain, oil, straw, textiles, wood pulp, and wood. Sulfur dioxide is also used in leather tanning, brewing and preserving, and in the refrigeration industry. It is a by-product of ore smelting coal, and fuel-oil combustion, paper manufacturing, and petroleum refining (WHO 1984).
Sulfur dioxide is an irritant of the upper respiratory tract and eyes. Conjunctivitis, corneal burns, and corneal opacity may occur from direct contact with high concentrations of sulfur dioxide. Death from respiratory arrest may occur from acute over-exposure, while survivors may develop bronchitis, bronchopneumonia, and fibrosing obliterative bronchiolitis. Bronchoconstriction accompanied by increased pulmonary resistance may be asymptomatic or may occur with high-pitched rales. Moderate exposure may result in a prolonged expiratory phase. Respirable particles, cold air, dry air, exercise, and
mouth-breathing may increase the severity of adverse effects caused by sulfur dioxide (WHO 1984).
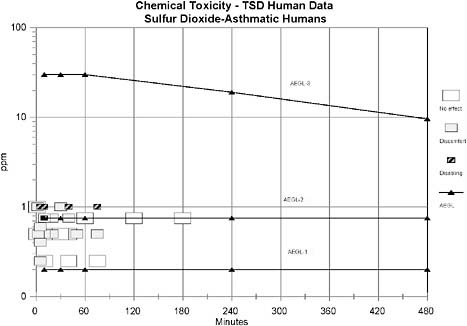
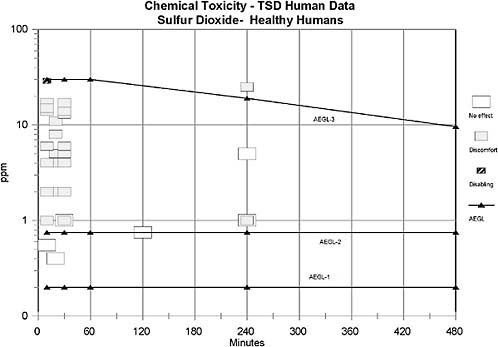
AEGL-1 values were based on the weight-of-evidence from human asthmatic data suggesting that 0.20 ppm may be a NOEL for bronchoconstriction in exercising asthmatics. No treatment-related effects were noted in asthmatics exposed to 0.2 ppm for 5 min (Linn et al. 1983b), 0.25 ppm for 10-40 min (Schacter et al. 1984), 0.25 ppm for 75 min (Roger et al. 1985), 0.5 ppm for 10-40 min (Schacter et al. 1984), or 0.5 ppm for 30 min (Jorres and Magnussen 1990). However, an increase in airway resistance (SRaw) of 134-139% was observed in exercising asthmatics exposed to 0.25 ppm for 5 min (Bethel et al. 1985); the increase in SRaw in this study, but not in the other studies, may be attributed to the lower relative humidity (36%) in the Bethel et al. (1985) study compared to the other studies (70-85%). No uncertainty factors were applied because the weight of evidence approach utilized studies from a sensitive human population, exercising asthmatics. The role of exposure duration to the magnitude of SO2-induced bronchoconstriction in asthmatics appears to decrease with extended exposure. For example, asthmatics exposed to 0.75 ppm SO2 for 3-h exhibited increases in SRaw of 322% 10-min into exposure, 233% 20-min into the exposure, 26% 1-hr into the exposure, 5% 2-h into the exposure, and a decrease of 12% at the end of the 3-h exposure period. These data suggest that a major portion of the SO2-induced bronchoconstriction occurs within 10-min and increases minimally or resolves beyond 10-min of exposure. Therefore, AEGL-1 values for SO2 were held constant across all time points. Exposure to concentrations at the level of derived AEGL-1 values is expected to have no effect in healthy individuals, but the concentrations are consistent with the definition of AEGL-1 for asthmatic individuals.
AEGL-2 values were based on the weight-of-evidence from human asthmatic data suggesting that 0.75 ppm induces moderate respiratory response in exercising asthmatics for exposure durations of 10-min to 3-h (Hackney et al. 1984; Schacter et al. 1984). No uncertainty factors were applied because the weight of evidence approach utilized studies from a sensitive human population, exercising asthmatics. The role of exposure duration to the magnitude of SO2-induced bronchoconstriction in asthmatics appears to decrease with extended exposure. For example, asthmatics exposed to 0.75 ppm SO2 for 3-h exhibited increases in SRaw of 322% 10 min into exposure, 233% 20 min into the exposure, 26% 1-hr into the exposure, 5% 2 h into the exposure, and a decrease of 12% at the end of the 3 h exposure period. These data suggest that a major portion of the SO2-induced bronchoconstriction occurs within 10-min and increases minimally or resolves beyond 10-min of exposure. Therefore, AEGL-2 values for SO2 were held constant across all time points. Exposure to concentrations at the level of derived AEGL-2 values is expected to have no effect in healthy individuals, but the concentrations are consistent with the definition of AEGL-2 for asthmatic individuals.
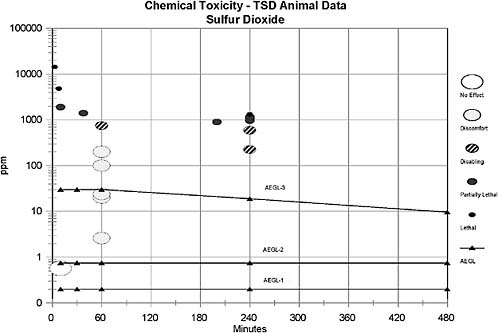
The AEGL-3 values were based on a calculated BMLC05 in rats exposed to SO2 for 4-h (573 ppm) (Cohen et al. 1973). An uncertainty factor of 10 was
applied for intraspecies extrapolation due to the wide variability in response to SO2 exposure between healthy and asthmatic humans. An uncertainty factor of 3 was applied for interspecies variability; this factor of 3 was considered sufficient because no deaths were reported in guinea pigs exposed to 750 ppm SO2 for 1 h (Amdur 1959), in dogs exposed to 400 ppm SO2 for 2 h (Jackson and Eady 1988), or in rats exposed to 593 ppm for 4-h (Cohen et al. 1973). Furthermore, a median lethal exposure time (Lt50) of 200 min was reported for mice exposed to 900 ppm SO2 (Bitron and Aharonson 1978) and three of eight rats died when exposed to 965 ppm for 240 min (Cohen et al. 1973), suggesting limited interspecies variability. Data are not sufficient to ascertain whether a maximal response to SO2 for a lethal end point is obtained within 10 min. Therefore, time scaling will be utilized in the derivation of AEGL-3 values. It has been shown that the concentration-exposure time relationship for many irritant and systemically acting vapors and gases may be described by Cn × t = k, where the exponent n ranges from 0.8 to 3.5 (ten Berge et al. 1986). Data were unavailable for an empirical derivation of n for sulfur dioxide. Therefore, an n of 3 was applied to extrapolate to the 1-h time period, and n of 1 was used for extrapolation to the 8-h time period to provide AEGL values that would be protective of human health (NRC 2001). The 1-h AEGL-3 value was also adopted as 10-min and 30-min values because asthmatic humans are highly sensitive to sulfur dioxide at short time periods.
The calculated values are listed in Table 9-1.
1.
INTRODUCTION
Sulfur dioxide is a colorless gas at ambient temperature and pressure. It can be detected by taste at concentrations of 0.35-1.05 ppm and has a pungent, irritating odor with an odor threshold of 0.67-4.75 ppm. It is soluble in water and forms sulfurous acid which is slowly oxidized to sulfuric acid by dissolved oxygen. In the gaseous state, sulfur dioxide may react with oxygen to form sulfur trioxide which then reacts with moisture to form sulfuric acid. Sulfuric acid may also be associated with airborne particles and react with the particles to form other sulfur compounds (WHO 1984).
Sulfur dioxide is produced by burning sulfur or iron pyrites in air and is used in the production of sodium sulfite, sulfuric acid, sulfuryl chloride, thionyl chloride, organic sulfonates, disinfectants, fumigants, glass, wine, industrial and edible protein, and vapor pressure thermo-meters. It is also used during the bleaching of beet sugar, flour, fruit, gelatin, glue, grain, oil, straw, textiles, wood pulp, and wood. Sulfur dioxide is also used in leather tanning, brewing and preserving, and the refrigeration industry. It is a by-product of ore smelting, coal and fuel-oil combustion, paper manufacturing, and petroleum refining (WHO 1984).
TABLE 9-1 Summary of AEGL Values for Sulfur Dioxide
|
|
10-min |
30-min |
1-h |
4-h |
8-h |
End Point (Reference) |
|
AEGL-1 (Nondisabling) |
0.20 ppm (0.52 mg/m3) |
0.20 ppm (0.52 mg/m3) |
0.20 ppm (0.52 mg/m3) |
0.20 ppm (0.52 mg/m3) |
0.20 ppm (0.52 mg/m3) |
NOEL for bronchoconstriction in exercising asthmatics (Linn et al. 1983b; Schacter et al. 1984; Bethel et al. 1985; Roger et al. 1985; Jorres and Magnussen 1990) |
|
AEGL-2 (Disabling) |
0.75 ppm (1.95 mg/m3) |
0.75 ppm (1.95 mg/m3) |
0.75 ppm (1.95 mg/m3) |
0.75 ppm (1.95 mg/m3) |
0.75 ppm (1.95 mg/m3) |
Moderate bronchoconstriction in exercising asthmatics (Hackney et al. 1984; Schacter et al. 1984) |
|
AEGL-3 (Lethality) |
30 ppm (78 mg/m3) |
30 ppm (78 mg/m3) |
30 ppm (78 mg/m3) |
19 ppm (49 mg/m3) |
9.6 ppm (25 mg/m3) |
Calculated BMCLC05 in the rat after a 4-h exposure (Cohen et al. 1973) |
Sulfur dioxide is an irritant of the upper respiratory tract and eyes. Conjunctivitis, corneal burns, and corneal opacity may occur from direct contact with high concentrations of sulfur dioxide. Death from respiratory arrest may occur from acute over-exposure, while survivors may develop bronchitis, bronchopneumonia, and fibrosing obliterative bronchiolitis. Bronchoconstriction accompanied by increased pulmonary resistance may be asymptomatic or may occur with high-pitched rales. Moderate exposure may result in a prolonged expiratory phase of the respiratory cycle. Co-exposure to respirable particles may increase the severity of adverse effects caused by sulfur dioxide (WHO 1984).
The chemical structure is depicted below, and the physicochemical properties of sulfur dioxide are presented in Table 9-2.
2.
HUMAN TOXICITY DATA
2.1.
Case Reports
2.1.1.
Acute Lethality
Charan et al. (1979) described an industrial accident in a paper mill resulting in the deaths of two of five exposed workers. Two maintenance workers (ages 56 and 59 years, nonsmokers) were repairing a digester partially filled with wooden chips. The digester was in a large shed where the tempera-
ture was 70 F. The valve of a line containing SO2 and steam was accidentally opened by another worker and the digester was immediately filled with concentrated SO2 under pressure. Both workers climbed out using a rope ladder suspended in the digester. Both workers died of respiratory arrest within 5 min of escape from the digester. Post-mortem examination revealed a “coagulated appearance” of the pharynx and larynx, frequent denudation of superficial columnar epithelium accompanied by retention of basal cells, and pink edema fluid in the airways. Histologic examination of the lungs showed extensive sloughing of the mucosa of the large and small airways and hemorrhagic alveolar edema. Three additional workers, presumably exposed to lower concentrations of SO2, survived the accident; these include a worker who helped the trapped workers escape, an individual wearing a dual-cartridge mask ascending to the top of the digester by an open elevator, and a fireman who responded to the accident. The acute symptoms in the 3 survivors included ocular, nasal, and throat irritation and soreness, chest tightness, and intense dyspnea. The eyes had severe conjunctivitis and superficial corneal burns and the pharyngeal mucosa was hyperemic but free of ulcerations. Pulmonary function tests performed at regular intervals showed that one survivor was asymptomatic, one survivor developed asymptomatic mild obstructive and restrictive disease, and the third survivor developed symptomatic severe airway obstruction unresponsive to bronchodialators. No SO2 exposure concentrations were provided.
TABLE 9-2 Physical and Chemical Data for Sulfur Dioxide
|
Parameter |
Data |
Reference |
|
Chemical Name |
Sulfur dioxide |
ATSDR 1998 |
|
Synonyms |
Sulfurous anhydride, sulfur oxide, sulfurous oxide, sulfurous acid anhydride |
O’Neil et al. 2001 |
|
CAS Registry No. |
7446-09-5 |
ATSDR 1998 |
|
Chemical Formula |
SO2 |
O’Neil et al. 2001 |
|
Molecular Weight |
64.06 |
O’Neil et al. 2001 |
|
Physical State |
Gas (or liquid) |
ATSDR 1998 |
|
Odor |
Pungent, irritating |
ATSDR 1998 |
|
Melting/Boiling/Flash Point |
−72°C/−10°C/no data |
O’Neil et al. 2001 |
|
Density |
2.927 g/L (gas) |
ATSDR 1998 |
|
Solubility |
Soluble in water and organic solvents |
O’Neil et al. 2001 |
|
Vapor Pressure |
3000 mm Hg at 20°C |
ATSDR 1998 |
|
Conversion factors in air |
1 ppm = 2.6 mg/m3 1 mg/m3 = 0.38 ppm |
NRC 1984 |
In another report, Galea (1964) describes an accident in a pulp and paper mill where two men were exposed to an undetermined concentration of SO2 for 15 to 20 min. One worker was a 45-year-old man who was a heavy smoker. He survived the accident but exhibited a delayed chronometric vital capacity, prolonged expiratory phase, and marked respiratory fatigue four months after the accident. The second worker was a 35-year-old man who was a non-smoker. He presented with slight ocular irritation and pain on deep breathing. He was released from the hospital a few days after the accident since his clinical condition had improved. Ten days later, he was readmitted complaining of a dry, irritable cough, dyspnea, and mucous. He had rales at both lung bases and required a tracheotomy on the seventh day of his readmission. He died the following day, seventeen days after the date of the accident. Extensive peribronchiolar fibrosis and bronchiolotis obliterans was assumed to be responsible for the acute emphysematous changes consistent with the immediate cause of death.
Rabinovitch et al. (1989) described an accident in an underground copper mine where three healthy male workers were exposed to high concentrations of SO2 as the result of a copper iron sulfide dust explosion. One miner died within mins. The other two survived by covering their heads with rubber pants and using compressed air to provide adequate ventilation. They were rescued 3.5 h after the explosion at which time the measured SO2 concentration was greater than 40 ppm. No other toxic gases were identified and particles of copper and iron were at background levels for the mine. The survivors presented with intense burning of the eyes, nose, and throat, dyspnea, diffuse precordial and retro sternal chest pain, nausea, vomiting, and urinary incontinence. One of the workers had skin irritation resulting in first degree burns. Two weeks after the accident, all of their symptoms except the dyspnea had resolved. Within three weeks of the accident, both workers had severe airway obstruction, hypoxemia, markedly decreased exercise tolerance, ventilation-perfusion mismatch, and evidence of active inflammation (positive gallium scan). Progressive improvement was observed over the next year; however, ventilation-perfusion scans remained abnormal.
In another mining accident, nine workers were descending into a mine in a cage of a hoist at which time a pyrite (FeS2) explosion occurred (Harkonen et al. 1983). The workers were exposed to gases, primarily an undetermined concentration of SO2, for 20 to 45 min. At the mining level, the workers tried to rescue themselves by breathing from compressed air vents. One of the workers died and the others were injured. The lung function of the survivors was followed for 4 years. The largest decreases in forced vital capacity (FVC), forced expiratory volume in 1 second (FEV1), and maximal midexpiratory flow were observed 1 week after the accident. Pyrometer indicated obstructive findings in 6 workers and restrictive findings in 1 worker. After three months, no further lung function decrement occurred; however, four years after the accident, bronchiolar obstruction was still present in three workers.
2.1.2.
Nonlethal Toxicity
Wunderlich et al. (1982) described an accident where a 12-year-old boy fell into a pit (4 m deep; 2.45 × 1.45 m area) containing SO2 on the grounds of a chemical manufacturing plant. He was not able to free himself and remained in the pit for approximately 4 h until he was found and rescued. Several days later, the measured concentration of SO2 in the pit was 4.8 ppm; thus, it is possible that the concentration was higher at the time of the accident. He presented with acute irritation of the eyes and mucous membranes of the upper airways, rhinopharyngitis, laryngitis, bronchitis, conjunctivitis, and corneal lesions. These effects persisted for five days and were followed by a symptom-free period of three days. Bronchitis, bronchiolitis, alveolitis, emphysema of the lung, and bronchiectasis then developed and persisted for 12 months in spite of aggressive therapy. Thereafter, lung emphysema and continuous partial respiratory insufficiency, accompanied by ventilatory obstruction were observed for 4 years. No follow-up beyond four years was reported.
Charan et al. (1979), Galea (1964), Rabinovitch et al. (1989), and Harkonen et al. (1983) describe cases where both non-lethal and lethal effects were observed. These case-reports are described in Section 2.1.1.
2.2.
Epidemiologic Studies
2.2.1.
Occupational Exposure
Lung function and sputum cytology were compared between copper smelter workers chronically exposed to 0.3 to 4 ppm SO2 and a control group of mine repair shop workers (Archer et al. 1979). All subjects were white males and exposed and control subjects were paired by age and smoking habits. Measurements of FVC, FEV1, FEF50, and closing volume were made both before and after the work shift for both exposed and control workers. Sputum samples for cytological analysis were also collected from both groups of workers. Mean FEV1 and FVC values were significantly (p<0.05) decreased after a work shift in the smelter compared to controls and significantly more smelter workers had decreased FEV1 and FEF50 values during the day when compared to controls. Also, more smelter workers complained of chest tightness compared to the control workers. Smelter workers had a higher percentage of sputum samples with moderate and marked atypical than controls; however, the cytological effects did not reach statistical significance.
Sulfur dioxide is used as a bleaching agent in the production of brooms. In another workplace monitoring study, Savic et al. (1987) compared a group of 190 workers from a broom manufacturing factory with a group of 43 workers not exposed to SO2 in the workplace (no other information concerning the
control groups was provided). Sulfur dioxide concentrations in the broom factory ranged from 0 to 0.285 ppm during the summer (windows were open) and from 6.5 to 56.8 ppm in the winter. Dust concentrations were similar in both summer (0-21 mg/m3) and winter (3-27 mg/m3). The most common subjective symptoms reported by exposed workers included coughing (94.2%), dyspnea (91.0%), burning of the nose, eyes, and throat (74.7%), tearing (64.7%), and substernal pain (75.3%). Sulfate concentration in the urine and methemoglobin concentration in the blood of exposed workers was significantly increased (p<0.01) compared to controls. No difference was found in sulfhemoglobin concentrations.
2.2.2.
Community Exposure: Ambient Air Pollution
Many studies concerning the relationship between SO2 exposure in polluted air and human health have been conducted; however, these studies are confounded by the presence of particulate matter and other air pollutants. Perhaps the most notable example of increased mortality from SO2 and particulate matter exposure occurred in London in the 1950’s (IPCS 1979). The London episode lasted 5 days. The number of deaths was approximately 4000 more (a three-fold increase) than would have been expected under normal circumstances. Most deaths occurred in the elderly and in people with preexisting cardiac or respiratory disease. Peak SO2 concentrations were 1.3 ppm while particulate matter concentrations were too high to be monitored (4.5 mg/m3 was provided as a conservative estimate). The excess deaths were attributed to bronchitis or to other impairments of the respiratory tract. Increased mortality from cardiac effects was also observed. The effects observed from this incident are attributed to the combination of SO2 and extremely high concentration of particulate matter. Direct attribution of effects to SO2 is toxicologically questionable because of the exceptionally high concentrations of particulate matter (see Section 4.4).
More recently, Touloumi et al. (1994) examined the effects of air pollution on mortality in Athens, Greece from 1984-1988. Mean SO2 levels (averaged over 2 recording stations) for the 5-year period ranged from 0.014 to 0.027 ppm. Total mortality was associated with SO2, smoke, and CO, with both SO2 and smoke being independent predictors of daily mortality. The strongest association was found for mortality lagged for 1 day. However, this study is of limited use due to the confounding pollutants and long exposure period (up to 5 years). In another study, Rahlenbeck and Kahl (1996) examined the relationship between mortality and air pollution in East Berlin for the winters of 1981-1989. When controlling for temperature and humidity, both SO2 and suspended particles were found to be contributors to excess mortality, the strongest association found for mortality lagged for 2 days. The mean SO2 concentration over the 9-year period was 0.063 ppm.
Rao et al. (1973), Castellsague et al. (1995), and Goldstein and Weinstein (1986) found no relationship between air pollution sulfur dioxide peaks and asthma attack rates in children. In another study, Partti-Pellinen et al. (1996) found increased incidences of cough, respiratory infections, and headache in residents living near a pulp mill compared with a reference community. The average SO2 concentrations were 0.00038 ppm in the reference community and 0.00076-0.0011 ppm in the exposed community. However, in view of the existing experimental database, it is likely that confounding pollutants, and not solely SO2, contributed to the observed effects.
Many other reports have shown an association between sulfur dioxide exposure and respiratory symptoms such as decreased lung function, coughing, chest tightness, and increased incidences of respiratory infections (Stebbings and Hayes 1976; Saric et al. 1981; Vedal et al. 1987; Hoek and Brunekreef 1993; Braback et al. 1994; Schwartz et al. 1994; Higgins et al. 1995; Soyseth et al. 1995; Braun-Fahrlander et al. 1997; Peters et al. 1997). However, these epidemiological studies are of limited usefulness to define a precise cause-effect relationship since other air pollutants, especially particulate matter, ozone, and nitrogen oxides, are also present.
2.3.
Experimental Studies
Many controlled human studies examining the effects of SO2 are available and indicate that the respiratory system is the principal target after acute exposure. Data show that asthmatics are particularly sensitive to the effects of SO2 and that effects are enhanced (in both healthy individuals and asthmatics) by exercise. Since it would not be feasible to include all available human SO2 data, the studies summarized below are considered sufficient to be quantitatively representative of data describing effects from acute exposure to SO2. Selected data from controlled exposures to SO2 in non-asthmatic individuals are presented in Table 9-3 and data from asthmatic individuals are presented in Table 9-4.
2.3.1.
Nonasthmatic Subjects
Amdur et al. (1953) exposed 14 healthy males (ages 28-58 years) to varying concentrations of SO2 through a face mask for 10 min. At 5 ppm most subjects complained of dryness in the throat and upper respiratory passages. Decreased respiratory volume and increased respiratory rate were noted at 1-8 ppm SO2.
TABLE 9-3 Selected Data from Exposure of Nonasthmatic Humans to SO2
|
Concentration |
Duration |
Subjects |
Exposure Parameters |
Effect |
Reference |
|
1-8 ppm |
10 min |
14 |
Exposure through facemask |
1-8 ppm: ↓Respiratory volume ↑respiratory rate 5 ppm: dry throat |
Amdur et al. 1953 |
|
0.75 ppm |
2 h |
16 |
21 °C, 60% RH, Treadmill exercise 45 min. after entering chamber |
SRaw: ↑2-55% (14.6% avg) |
Stacy et al. 1981 |
|
0.4 ppm |
20 min |
8 |
20 °C, 50% RH, exercise |
No effects on respiratory function parameters. |
Sandstrom et al. 1988 |
|
2.0 ppm |
|
|
75 W, last 15 min of exposure |
||
|
4.0 ppm |
|
|
|
Nasal irritation: 4 ppm (5/8) Throat irritation: concentration-dependent at 0.4, 2, and 4 ppm |
|
|
4.0 ppm |
20 min |
10 |
20 °C, 50% RH, exercise |
Transient concentration-related ↑ alveolar macrphage activity |
Sandstrom et al. 1989a |
|
8.0 ppm |
|
4 |
75 W |
||
|
8.0 ppm |
20 min |
22 |
20 °C, 50% RH, exercise |
Transient concentration-related ↑ alveolar macrophage activity |
Sandstrom et al. 1989b |
|
|
|
|
75 W |
||
|
4.0 ppm |
20 min |
22 |
20 °C, 50% RH, at rest |
Transient ↑ in alveolar macrophage activity. Concentration-related up to 8 ppm, no further increase at 1 ppm |
Sandstrom et al. 1989c |
|
5.0 ppm |
|
|
|
||
|
8.0 ppm |
|
|
|
||
|
11.0 ppm |
|
|
|
||
|
1.0 ppm |
4 h |
20 |
22.2 °C, 60% RH, exercise |
No effects on lung function parameters. |
Kulle et al. 1984 |
|
|
|
|
100 W |
Upper respiratory irritation (4/20) Ocular irritation (1/20) |
|
Concentration |
Duration |
Subjects |
Exposure Parameters |
Effect |
Reference |
|
1 ppm |
10-30 min |
11 |
Resting |
No effects |
Frank et al. 1962 |
|
5 ppm |
|
|
|
39%↑ Pulmonary flow res. |
|
|
13 ppm |
|
|
|
72%↑ Pulmonary flow res. Peak response 5-10 min |
|
|
1-2 ppm |
30 min |
6 |
Resting; exposures to SO2 alone or in combination with 18 mg/m3 NaCl |
No effects |
Frank et al. 1964 |
|
4-6 ppm |
|
|
↑ Pulmonary flow resistance |
||
|
14-17 ppm |
|
|
↑ Pulmonary flow resistance |
||
|
15 ppm |
10 min |
11 |
Compared nose breathing vs mouth breathing |
↑ Pulmonary flow resistance |
Frank et al. 1964 |
|
29 ppm |
|
|
15 ppm: 3% Nose; 20% mouth 29 ppm: 18% Nose; 65% mouth |
||
|
0.55 ppm |
10 min |
11 |
|
No nasal or eye irritation |
Dautrebrande and Capps 1950 |
|
1 ppm |
6 h |
15 |
Resting |
No effects |
Andersen et al. 1974 |
|
5 ppm |
|
|
Irritation. ↓FEV1, ↓Nasal mucous flow Irritation. ↓FEV1, ↓nasal mucous flow |
||
|
25 ppm |
|
|
TABLE 9-4 Selected Data from Exposure of Asthmatic Humans to Sulfur Dioxide
|
Concentration |
Duration |
Subjects |
Exposure Parameters |
Effect |
Reference |
|
0.2 ppm |
5 min |
8 |
23 °C, 85% RH, exercise 48 L/min |
None |
Linn et al. 1983b |
|
0.25 ppm |
10-40 min |
10 |
23 °C, 70% RH, exercise 35 L/min |
None |
Schacter et al. 1984 |
|
0.25 ppm |
5 min |
19 |
23 °C, 36% RH, exercise 60 L/min |
SRaw ↑134% |
Bethel et al. 1985 |
|
|
|
|
23 °C, 36% RH, exercise 80-90 L/min |
SRaw ↑139% |
|
|
|
|
9 |
|
|
|
|
0.25 ppm |
75 min |
28 |
26 °C, 70% RH, exercise 42 L/min intermittent |
None |
Roger et al. 1985 |
|
0.4 ppm |
5 min |
23 |
23 °C, 85% RH, exercise 48 L/min |
SRaw ↑69% Vmax25-75 ↓10% |
Linn et al. 1983b |
|
0.5 ppm |
10-40 min |
10 |
23 °C, 70% RH, exercise 35 L/min |
None |
Schacter et al. 1984 |
|
0.5 ppm |
5 min |
10 |
23 °C, 41% RH, exercise 60 L/min |
SRaw ↑238% |
Bethel et al. 1983a |
|
0.5 ppm |
5 min |
9 |
23 °C, 80% RH, exercise 27 L/min |
None |
Bethel et al. 1983b |
|
23 °C, 80% RH, exercise 41 L/min |
None |
|
|||
|
|
|
|
23 °C, 80% RH, exercise 61 L/min |
SRaw ↑219% |
|
|
0.5 ppm |
1 min |
8 |
22 °C, 75% RH, exercise 60 L/min |
SRaw ↑34% |
Balmes et al. 1987 |
|
|
3 min |
|
SRaw ↑173% |
|
|
|
|
5 min |
|
|
SRaw ↑234% |
|
|
0.5 ppm |
20 min |
46 |
23 °C, 92% RH, exercise 30 L/min for 10 min |
SRaw ↑131% |
Magnussen et al. 1990 |
|
0.5 ppm |
30 min |
14 |
24 °C, 50% RH, at rest |
None |
Jorres and Magnussen 1990 |
|
Concentration |
Duration |
Subjects |
Exposure Parameters |
Effect |
Reference |
|
0.5 ppm |
50 min |
10 |
22 °C, 75% RH, 30 min rest + 20 min exercise 43 L/min face mask |
Nasal resistance ↑30% FEV1 ↓16% Vmax-50 ↓26% Vmax-75 ↓26% |
Koenig et al. 1985 |
|
0.5 ppm |
50 min |
10 |
22 °C, 75% RH, 30 min rest + 20 min exercise 43 L/min mouthpiece |
Nasal resistance ↑32% FEV1 ↓24% Vmax-50 ↓46% Vmax-75 ↓56% |
Koenig et al. 1985 |
|
0.5 ppm |
75 min |
28 |
26 °C, 70% RH, exercise 42 L/min, intermittent |
SRaw ↑100% |
Roger et al. 1985 |
|
0.5 ppm |
3 min × 3 |
8 |
23 °C, 82% RH, exercise (hyperventilating) intermittent |
SRaw ↑104% (1st) SRaw ↑35% (2nd) SRaw ↑30% (3rd) |
Sheppard et al. 1983 |
|
0.6 ppm |
5 min |
22 |
21 °C, 20% RH, exercise 50 L/min |
SRaw ↑206% |
Linn et al. 1985 |
|
|
|
|
21 °C, 80% RH, exercise 50 L/min |
SRaw ↑157% |
|
|
|
|
|
38 °C, 20% RH, exercise 50 L/min |
SRaw ↑89% |
|
|
|
|
|
38 °C, 80% RH, exercise 50 L/min |
SRaw ↑39% |
|
|
0.6 ppm |
5 min |
23 |
23 °C, 85% RH, exercise 48 L/min |
SRaw ↑120% Vmax25-75 ↓26% FEV1 ↓13% |
Linn et al. 1983b |
|
0.75 ppm |
3 h |
17 |
22 °C, 85% RH, exercise 45 L/min (first 10-min of exposure) |
Sraw ↑: 322% (at 10-min) 233% (at 20-min) 26% (at 1-hr) 5% (at 2-hr) FEV1: ↓20% (at 15-min) |
Hackney et al. 1984 |
|
0.75 ppm |
10 min |
23 |
23 °C, 90% RH, exercise 40 L/min facemask mouthpiece |
SRaw ↑186% SRaw ↑321% |
Linn et al. 1983a |
|
0.75 ppm |
10-40 min |
10 |
23 °C, 70% RH, exercise 35 L/min |
SRaw ↑150% FEF ↓22% FEV1 ↓8% |
Schacter et al. 1984 |
|
1.0 ppm |
10-40 min |
10 |
23 °C, 70% RH, exercise 35 L/min |
SRaw ↑470% FEF ↓27% FEV1 ↓14% |
Schacter et al. 1984 |
|
1.0 ppm |
75 min |
28 |
26 °C, 70% RH, exercise 42 L/min, intermittent |
SRaw ↑300% |
Roger et al. 1985 |
|
1.0 ppm |
30 min |
10 |
26 °C, 70% RH, exercise 41 L/min (3-10 min periods separated by rests of 15 min) |
SRaw ↑172% SRaw ↑137% SRaw 106% |
Kehrl et al. 1987 |
|
1.0 ppm |
30 min |
10 |
26 °C, 70% RH, continuous exercise 41 L/min |
SRaw ↑233% |
Kehrl et al. 1987 |
|
1.0 ppm |
1 min |
8 |
22 ºC, 75% RH, exercise 60 L/min |
SRaw ↑93% |
Balmes et al. 1987 |
|
|
3 min |
|
|
SRaw ↑395% |
|
|
|
5 min |
|
|
SRaw ↑580% |
|
|
1.0 ppm |
0.5 min |
12 |
20 °C, 40% RH, exercise 40 L/min |
No SRaw effect |
Horstman et al. 1988 |
|
|
1.0 min |
|
|
No SRaw effect |
|
|
|
2.0 min |
|
|
SRaw ↑121% |
|
|
|
5.0 min |
|
|
SRaw ↑307% |
|
|
Source: Adapted from EPA 1994. |
|||||
Stacy et al. (1981) examined the effect of SO2 exposure on healthy nonsmoking males between the ages of 18 and 40 years. A total of 31 subjects were studied. Sixteen subjects were exposed to 0.75 ± 0.04 ppm SO2 and 15 were exposed to air for 2 h. All subjects had intradermal skin tests for 16 allergens common to the geographical area where the study was performed. Relative humidity in the exposure chamber was maintained at 60% and temperature at 21°C. Recirculation and reconditioning of chamber air through HEPA filters kept total particle mass to < 3 μg/m3 and particle count at 1 × 10⁵ particles/ m3, thus, creating unfavorable conditions for sulfate formation. Each subject exercised on a treadmill at 6.4 kmph and 10% incline beginning 45 min after entry into the chamber. Only parameters related to air flow resistance were significantly affected by SO2 exposure, although spirometric parameters exhibited a similar trend. At the end of the first hour of exposure, airway resistance (SRaw) was increased between 2% and 55% in 14 of 16 subjects exposed to SO2. The average increase was 14.6% compared with a mean decrease of 10.3% in air-exposed subjects. The SO2-exposed subjects positive for allergen skin-tests appeared to be more reactive to SO2 than those negative for allergen skin-tests. A component of this study examining nasal mucosa was published later (Carson et al. 1987). Nasal epithelium was obtained from 7 of the subjects and showed increases in the incidence of compound cilia accompanied by abnormal ciliary membrane ultrastructure in 4 of the 7 subjects.
In another study, Sandstrom et al. (1988) exposed eight healthy, nonsmoking subjects (ages 21-29 years, sex not specified) to 0, 0.4, 2, or 4 ppm SO2 for 20 min. During the first 5min of exposure, the electrodes on the subjects were adjusted by a technician. The subjects then worked on a bicycle ergometer at a work load of 75 W for the remaining 15 min. The exposure chamber was made of anodized aluminum and had a volume of 14.1 m3. During exposure the chamber temperature was 20°C, relative humidity was approximately 50%, and there was one air exchange every 2 min. The SO2 atmosphere in the chamber was produced by addition of a gas stream from a 1% SO2 gas tube to the chamber air inlet. The chamber air was analyzed continuously by color metric titration. There were no treatment-related effects on heart rate, breathing rate, FEV1.0, FEF25-75, FVC, gas distribution, or closing volume. Five of eight subjects reported nasal irritation at 4 ppm only. Unpleasant odor was reported more frequently (p<0.05) at the end of the exposure to 4 ppm SO2 than before exposure at the beginning of this exposure period. Throat irritation was significantly (p<0.05) increased during exposure to 2 ppm SO2. It was also reported more frequently during and at the end of 4 ppm SO2 exposure than before exposure (p<0.02) and was also more common (p<0.05) at the end of exposure to 4 ppm compared to the end of the 0.4 ppm exposure period.
Sandstrom et al. (1989a) also examined the effects of SO2 exposure on broncho-alveo-lar lavage fluid (BAL) parameters. Healthy subjects (ages 22-30 years, sex not specified) were exposed to 4 (10 subjects) or 8 ppm (4 subjects) SO2 for 20 min while exercising on a bicycle ergometer with a work
load of 75 W. The exposure chamber and test atmosphere gen-eration were the same as that described above in Sandstrom et al. (1988). An increase in alveolar macrophage activity was observed 24 h after exposure to 4 ppm SO2 as evidenced by an increase in lysozyme positive macrophages. Twenty-four hours after exposure to 8 ppm of SO2 a further increase (2 to 4 times higher than pre-exposure values) was observed and was accompanied by an increase in total numbers of macrophages and lymphocytes. Seventy-two hours postexposure, the BAL fluid from subjects exposed to 8 ppm had returned to baseline values.
In another report, Sandstrom et al. (1989b) exposed 22 healthy males (ages 22-27 years) to 8 ppm SO2 for 20 min. The exposure chamber, atmosphere generation, and exercise regimen were identical to that described above. BAL was analyzed from 8 subjects at each of the following time intervals: 2 weeks before exposure, and 4, 8, 24, and 72 h after exposure. Increased numbers of lysozyme positive macrophages, lymphocytes, and mast cells were observed 4 h after exposure. Lymphocytes, lysozyme-positive macrophages, total alveolar macrophage counts, and total cell number reached a peak at 24 h post-exposure and had returned to pre-exposure values by 72 h. Sandstrom et al. (1989c) also exposed 22 healthy males (ages 22-37 years) to 4, 5, 8, or 11 ppm SO2 for 20 min. Exposure conditions were the same as those described above; however, no exercise period was included. Mast cells, lymphocytes, lysozyme positive macrophages, and the total number of macrophages were increased in BAL fluid 24 h post-exposure. The effects were concentration dependent at 4, 5, and 8 ppm, but no further increase was detected at 11 ppm.
Kulle et al. (1984) exposed twenty healthy, nonsmoking adults (10 males and 10 females) ages 20 to 35 years-old to filtered air or 1 ppm SO2 for 4 h. Each subject served as his own control and exercised for 15 min at both 1 and 3 h into the exposure period. The exercise consisted of riding a bicycle ergonometer at a work load of 100 watts at 60 RPM and was designed to ensure a short period of increased ventilation and to simulate the type of activity engaged in by many city dwellers. The exposures were conducted in a 22.2-m3 exposure room with a ventilation rate of 8.49 m3/min, allowing for a complete air change every 2.6 min. Temperature was maintained at 22.2°C and relative humidity at 60%. Air entering the room was passed through HEPA filters and activated carbon fibers to remove contaminants. Sulfur dioxide was metered into the room by an air input diffuser and the concentration continuously monitored by a pulsed fluorescent analyzer and a flame photometric analyzer. There were no treatment-related effects on lung function as measured by spirometry, body plethysmography, and methacholine inhalation challenge. Four subjects reported upper respiratory irritation and one reported ocular irritation during SO2 exposure. Seven subjects perceived the presence of the SO2 due to odor and/or taste.
Eleven healthy male adults were exposed to 0, 1, 5, or 13 ppm SO2 for up to 30 min (most exposures were for 10 min) (Frank et al. 1962). Exposures were spaced 1 month apart and subjects were seated in a volume displacement
body plethysmograph, breathing through the mouth while respiratory measurements were made with an esophageal catheter. The SO2 was administered by occlusion of one port of a wide T-tube that led to room air through which the subjects had been breathing, and by opening the other port leading to the SO2 source. Subjects were blind to the SO2 concentration administered, with the exception of one subject who was an author of the study. Pulmonary flow resistance was increased an average of 39% above controls at 5 ppm (p<0.01) and an average of 72% above control at 13 ppm (p<0.001). Within 1 min of exposure, flow resistance increased (p<0.001), with a greater increase observed after 5 min (p<0.05). No further increase occurred after 10 min, and the authors concluded that the peak response occurred between 5 and 10 min. Cough, irritation, and increased salivation were also observed at 5 ppm. No treatment-related effects were observed at 1 ppm.
In another study, Frank et al. (1964) administered SO2 alone or in combination with a physiologically inert NaCl aerosol to 6 healthy non-smoking adult males. The SO2 concentra-tions were 1-2, 4-6, or 14-17 ppm; NaCl aerosol concentration averaged 18 mg/m3 (range 10-30 mg/m3). Techniques of exposure and measurement were similar to those described above in Frank et al. (1962). Changes in pulmonary flow resistance induced by SO2 and the SO2 -NaCl aerosol mixture were similar. No significant effect was observed at 1-2 ppm SO2 with or without NaCl. A concentration-dependent increase in pulmonary flow resistance was observed at 4-6 and 14-17 ppm SO2 with or without NaCl. Exposures lasted 30 min and as in the previous study, maximum effect was observed after 10 min and receded partially thereafter. In another study, Frank et al. (1964) compared oral and nasal SO2 administration. Oral exposures were performed similarly to those described above, while nasal exposures were accomplished through a hard plastic mask fitted over the bridge of the nose and lower face. Concentrations of SO2 were 15 or 29 ppm. Pulmonary flow resistance increased maximally at 10 min and was approximately 20% for 15 ppm mouth breathers, 65% for 28 ppm mouth breathers, 3% for 15 ppm nose breathers, and 18% for 28 ppm nose breathers. Cough or chest irritation was common in mouth breathers and rare in nose breathers.
Dautrebrande and Capps (1950) found no subjective nasal or ocular irritation in 11 healthy adults exposed to 0.55 ppm SO2 for 10 min. Douglas and Coe (1987) applied various concentrations of SO2 to the eyes of healthy adult subjects through close fitting goggles. In a separate set of experiments, various concentrations of SO2 were administered via a mouthpiece. Ocular irritation was measured subjectively, whereas lung response was measured objectively via a plethysmograph. The threshold for ocular irritation was determined to be 5 ppm and the bronchoconstriction threshold was 1 ppm. Andersen et al. (1974) exposed 15 healthy males (ages 20-28 years) to 0, 1, 5, or 25 ppm SO2 for 6 h. Sulfur dioxide was metered through rotameters to the inlet duct for ventilating air to the climate chamber. Thorough mixing was accomplished by two fans upstream in the chamber. The SO2 concentration was continuously monitored by a conductivity method. Nasal mucous flow was decreased at 5
and 25 ppm but not at 1 ppm. Decreases were concentration-dependent and ranged from 13 to 80% of controls. The decrease was greatest in the anterior portion of the nose; however, the affected area increased with increasing exposure time. An increase in nasal airflow resistance and a decrease in forced expiratory volume in one second were observed at 5 and 25 ppm, with little or no effect at 1 ppm. Five subjects complained about dryness in the nose and pharynx after exposure to 5 ppm SO2. After the 25 ppm exposure, only two subjects had no complaints of irritative effects; dryness or a slight pain in the nose and pharynx was reported by 10 subjects, rhinorrhoea was reported by two subjects, and slight conjunctival pain was reported by 3 subjects. No subjective effects were reported at 1 ppm.
Rondinelli et al. (1987) exposed 10 healthy men (ages 55-73 years) to 0.5 ppm SO2 and 1 mg/m3 sodium chloride droplet aerosol, 1 ppm SO2 and 1 mg/m3 sodium chloride droplet aerosol, or 1 mg/m3 sodium chloride droplet aerosol alone. Subjects were exposed for 20 min at rest and 10 min during moderate exercise on a treadmill. Significant (p<0.05) decreases in FEV1 were observed 2-3 min post-exercise in all treatment regimens. The decrease observed after sodium chloride aerosol and 1.0 ppm SO2 was significantly greater than that observed after sodium chloride aerosol alone; however, average decreases were in the range of only 5-8% below baseline values.
2.3.2.
Asthmatic Subjects
Schachter et al. (1984) examined the effects of SO2 on ten asthmatic (4 males, 6 females, age 27.3±5.1 years) and ten healthy (5 males, 5 females, age 26.1 ±6.3 years) humans. Subjects were exposed in a 3 × 3.7 × 2.4 m chamber with laminar airflow from floor to ceiling. The vertical flow system provided uniform gas conditions with no stagnant areas. The desired SO2 concentrations were achieved by mixing concentrated gas (0.5% SO2, balance nitrogen) with the chamber air in the circulating flow stream. Levels of SO2 were continuously monitored from all chamber areas using a fluorescent SO2 analyzer. Exposures were 0, 0.25, 0.50, 0.75, or 1.0 ppm SO2 for 40 min. During the first 10 min, subjects exercised on a cycloergometer at 450 kpm/min. On separate days, subjects were exposed to 0 or 1.0 ppm SO2 for 40 min in the absence of exercise. No significant effects were observed in pulmonary function parameters during the exercise or non-exercise protocols in nonasthmatic subjects at any SO2 concentration. No effects were observed in non-exercising asthmatics or in exercising asthmatics at 0.50 ppm or below. In exercising asthmatics exposed to 0.75 ppm SO2, effects were observed in airway resistance (150% increase), forced expiratory volume in one second (mean −8%), and maximal expiratory flow (mean −22%). In exercising asthmatics exposed to 1 ppm SO2, significant (p<0.05) effects were observed in airway resistance (470% increase), forced expiratory volume in one second (mean −14%), and maximal expiratory flow (mean −27%), suggesting a concentration-response relation-
ship. Pulmonary effects had resolved 10 min after the end of exercise even though SO2 was still present in the chamber atmosphere.
Balmes et al. (1987) exposed two female and six male nonsmoking adult asthmatics to humidified air for 5 min or 0.5 or 1.0 ppm SO2 for 1, 3, or 5 min during eucapnic hyperpnea (60 L/min). Each exposure occurred at the same time on a separate day. Metered flows of SO2 from a calibrated tank and air from a compressed air source were mixed in a 3-L glass mixing chamber. The subjects inhaled the SO2 from a mouthpiece attached and SO2 concentrations were measured continuously with a pulsed fluorescent SO2 analyzer just proximal to the mouthpiece. Bronchoconstriction, as indicated by increases in SRaw, increased over baseline with increasing exposure time and concentration. SRaw was increased 46% after exposure to 0 ppm for 5 min, and 34%, 173% and 234%, after exposure to 0.5 ppm for 1-min, 3-min, and 5-min, respectively. SRaw was increased 46% after exposure to 0 ppm for 5 min, and 93%, 395% and 580%, after exposure to 1.0 ppm for 1-min, 3-min, and 5-min, respectively. The effects observed after the 1 min exposures were confined to 2 subjects who also developed chest tightness. After each 3 and 5 min exposure, 7 of 8 subjects developed increases in SRaw accompanied by wheezing, chest tightness, or dyspnea and requested bronchodilator therapy.
Linn et al. (1985) exposed 22 young adult asthmatics (13 males and 9 females, ages 18-33 years) to all combinations of 2 atmospheric conditions (purified air and 0.6 ppm SO2), 2 temperatures (21 and 38 °C), and 2 levels of relative humidity (20 and 80%). Exposure involved exercise on a constant-load bicycle ergometer at a work load sufficient to produce a ventilation rate of 50 L/min. The exercise lasted 5 min plus a brief warm-up and cool-down period. Exposure atmospheres were produced from SO2 in a high-pressure cylinder being metered into a purified air inlet duct in a manner providing uniform stable concentrations inside the chamber. SO2 levels were continuously monitored with duplicate flame photometric analyzers. Symptom questionnaires and body plethysmographic measurements were completed before and after each exposure. Physiologic changes during clean air exposures were small under all temperature and humidity conditions. At high temperature with high humidity, no change in SRaw or SGaw were noted. At low temperature with high humidity or high temperature with low humidity, SRaw and SGaw were increased approximately 10%. At low temperature with low humidity SRaw and SGaw were increased approximately 20% during clean air exposure. Bronchoconstrictive responses were more severe in SO2 exposures compared to clean air exposures, but followed a similar pattern with regard to temperature and humidity. In SO2 exposures, mean SRaw increased 39% at high temperature and high humidity, 89% at high temperature and low humidity, 157% at low temperature and high humidity, and 206% at low temperature and low humidity. Corresponding decreases in SGaw (specific airway conductance) were 22, 44, 62, and 61%, respectively. Subjective reporting of upper and lower respiratory symptoms increased with exposure to SO2 and appeared to be mitigated by high temperature.
In another study, Linn et al. (1983a) exposed 23 young adult asthmatics (15 males, 8 females, mean age 23 years) to 0 or 0.75 ppm SO2 for 10-min during bicycle exercise (40 L/min) once while breathing unemcumbered and once via a mouthpiece while wearing nose clips. At 0 ppm, SRaw was increased 54% by either exposure route. At 0.75 ppm, SRaw was increased 186% by oronasal breathing and 321% by mouthpiece.
In another study, Linn et al. (1983b) exposed 23 young adult asthmatics (13 males, 10 females, ages 19-31 years) to 0, 0.2, 0.4, or 0.6 ppm SO2 for 5-min while exercising (48 L/min). Exposures were random order at 1-week intervals. At 0.2 ppm, there were no effects on SRaw, FEV1, FVC or Vmax25-75 compared to controls. At 0.4 ppm, SRaw was increased 69%, and Vmax25-75 was decreased 10%, but there was no effect on FEV1. At 0.6 ppm, SRaw was increased 120%, Vmax25-75 was decreased 26%, and FEV1 was decreased 13%. Addition-ally, 21 of 23 subjects reported increased symptoms (cough, irritation, wheezing, and chest tightness) at 0.6 ppm, and 3 subjects required medication to relieve symptoms. No apparent effects were noted the next day or week.
Linn et al. (1984) also exposed a group of 14 asthmatics (12 males, 2 females, ages 18-33 years) to 0 or 0.6 ppm SO2 for 6-h periods on 2 successive days. Subjects exercised (50 L/min) for 5 min near the beginning of exposure and for an additional 5 min after 5 h of exposure. At all other times, they were resting. Increases in SRaw were 136% after the first exercise period on day 1, 120% after the second exercise period on day 1, and 147% after the first exercise period on day 2, 100% after the second exercise period on day 2.
Bethel et al. (1983a) exposed ten asthmatics (8 males, 2 females, ages 22-36 years) to 0 or 0.5 ppm SO2 for 5 min during moderately heavy bicycle exercise (60 L/min). Subjects were allowed to breathe freely. Mean SRaw was increased 238% after the exposure period. Bethel et al. (1983b) also exposed nine asthmatics (3 males, 5 females, ages 20-37 years) to 0 or 0.5 ppm SO2 during low (27 L/min), moderate (41 L/min), or high exercise (61 L/min) via a mouthpiece while wearing a nose clip (oral breathing) or via a face mask (oronasal breathing). Each exposure was 5 min in duration. No SRaw effects were noted with low- or moderate exercise rates; however, SRaw was increased 219% compared to baseline at the high exercise rate.
In another study, Bethel et al. (1985) exposed 19 asthmatic adults (16 males, 3 females, ages 22–46 years) to 0 or 0.25 ppm SO2 for 5 min while performing vigorous exercise (60 L/min). SRaw increased 77% in the 0 ppm group and 134% in the 0.25 ppm group. Nine (7 males, 2 females) of these original 19 subjects then repeated the exposure, with more vigorous exercise (89-90 L/min); SRaw increased 102% in the 0 ppm group and 139% in the 0.25 ppm group.
Fourteen asthmatics (12 male, 2 female, ages 19-50 years) were exposed to 0, 0.5, or 1.0 ppm SO2 for 10 min during light, medium, or heavy exercise (average ventilation 30, 36, and 43 L/min, respectively) (Gong et al. 1995). The ventilation rates were targeted to bracket a typical adult switching point
from nasal to oronasal breathing. Exposures were con-ducted in a double-walled insulated cubical plexiglass chamber (2.2 m3). Air was supplied at a rate of 15 air changes/hour with no recirculation. SO2 was metered into the air supply from a cylinder containing 5% SO2 in nitrogen; concentration was continuously monitored with a pulsed fluorescent analyzer. At 0.5 ppm SO2 during light exercise, mild to moderate (subjective ratings on a 1 to 10 scale) respiratory effects were reported by subjects, while at 1.0 ppm and heavy exercise, effects were rated as moderate to severe. Effects included shortness of breath, wheezing, and chest tightness. Both FEV1 and SRaw showed significant (p>0.05) exposure-related effects; however, the exact magnitude is difficult to ascertain from the format of the reported data.
Roger et al. (1985) exposed 28 male asthmatics (ages 19-34) to 0, 0.25, 0.50, or 1.0 ppm SO2. Each 75-min exposure period included three 10-min periods of moderate treadmill exercise. Exposures were in a random order at approximately the same time of day and day of the week, with at least 1 week between exposures. Exposures were conducted in a 4 × 6 × 3.2 m stainless steel chamber with continuous reconditioning and recirculation of the air. The SO2 concentrations were continuously monitored with pulsed fluorescent analyzers. There was no significant effect on SRaw after the 0.25 ppm SO2 exposure. SRaw was increased two- and three-fold after exposures of 0.5 and 1.0 ppm, respectively. Increases were greatest after the first 10 min exercise periods and less after the latter two 10-min periods (with the exception of one subject whose bronchoconstriction increased with increasing exercise and who was unable to complete the protocol). Shortness of breath and chest discomfort were reported (p<0.001) after 10 min of 1.0 ppm SO2 exposure. Wheezing, deep breathing discomfort, and cough were also reported.
Horstman et al. (1986) exposed 27 male asthmatics (ages 18-35 years) to 0, 0.25, 0.50, or 1.0 ppm SO2 for periods of 10-min, each on separate days. The test chamber and exposure conditions were similar to those described above (Roger et al. 1985). During exposures, subjects breathed normally and performed moderate exercise (42 L/min). Before and 3 min after each exposure SRaw was measured by body plethysmography. Those subjects whose SRaw was not doubled by exposure to 1.0 ppm were exposed to 2.0 ppm SO2 for 10 min. Concentration-response curves of relative change in SRaw vs. SO2 concentration were constructed for each subject to determine the concentration of SO2 producing a 100% increase in SRaw over exercise in clean air. Substantial variation was observed: 25% of subjects experienced a 100% increase in SRaw at <0.5 ppm, 20% of subjects experienced a 100% increase only at concentrations >1.95 ppm. The median concentration for a 100% increase in SRaw was 0.75 ppm.
Horstman et al. (1988) exposed 12 male asthmatics (ages 22-37) to 0 or 1.0 ppm SO2 for 0, 0.5, 1.0, 2.0, or 5.0 min (in random order on separate days) to determine the shortest duration of exposure sufficient to induce bronchoconstriction significantly greater than that observed by exposure to clean air. The test chamber and exposure conditions were similar to those described
above (Roger et al. 1985). The subjects exercised (40 L/min) on a treadmill during exposure. SRaw and symptom ratings increased with increased exposure duration, with significance (p<0.025) being achieved at 2.0 min (121% increase) and 5.0 min (307% increase) exposures. Half of the subjects reported moderate or severe shortness of breath, chest discomfort, and/or wheezing after the 2- or 5-min exposures, and four subjects required bronchodilator therapy.
Sheppard et al. (1983) exposed eight asthmatic adults (4 males, 4 females, ages 22-36 years) to 0.5 ppm SO2 via mouthpiece for 3 sets of 3-min intervals while hyperventilating. Each exposure period was separated by a 30-min rest period. The exposure protocol was repeated 24-h and 1-week after the initial set of exposures. SRaw was increased 104% after the first 3-min exposure, 35% after the 30-min rest, and 30% after the third exposure. An increase in SRaw of 83% was observed at the 24-hr exposure, and 129% one week later.
Hackney et al. (1984) exposed 17 young adult asthmatics (13 males, 4 females, mean age 25 years) to 0.75 ppm SO2 for a 3-h period, exercising vigorously (45 L/min) for the first 10-min and resting thereafter. SRaw and symptoms were reported preexposure, immediately post-exercise, and after 1, 2, and 3-h of exposure. On separate occasions, comparable exposures were performed and FEV was measured after 15-min of exposure, in addition to the other tests. The exposure techniques are similar to those of Linn et al. (1985) described above except that relative humidity was 85%. In the exposure without spirometry, SRaw was increased 263% immediately after exercise (10-min into exposure), 200% at 20-min, 34% at 1-hr, 0% at 2-hr and was decreased 12% at 3-hr compared to preexposure values. In the exposure with spirometry, SRaw was increased 322% immediately after exercise (10-min into exposure), 233% at 20-min, 26% at 1-hr, 5% at 2-hr and was decreased 9% at 3-hr compared to preexposure values. FEV1 was decreased 20% after 15-min of exposure. “Symptom scores” for low- and upper-respiratory irritation and nonrespiratory (headache, fatigue) symptoms were significantly (p<0.01) increased after 10-min of exposure, and had returned to pre-exposure values at 1-, 2-, and 3-hr time points. These data suggest that effects peak within 10-min into the exposure and then subside within 1-hr.
Kehrl et al. (1987) exposed ten male asthmatics (ages 25-33 years) to 0 or 1.0 ppm SO2 while performing 3 sets of 10-min treadmill exercise (41 L/min) separated by 15-min rest periods. The test chamber and exposure conditions were similar to those described above (Roger et al. 1985). SRaw was measured by whole body plethysmography before each exposure and after each exercise. Total mean SRaw was increased 172% after the first exercise, 137% after the second exercise, and 106% after the third exercise. A separate portion of the study involved exposure to SO2 at 0 or 1.0 ppm for a continuous 30 min period while exercising, with mean SRaw increasing 233% at the end of the 30-min exposure period.
Fourteen asthmatics (10 males, 4 females, ages 20-55 years) were exposed to 0 or 0.5 ppm SO2 for 30 min while at rest (Jorres and Magnussen 1990). Subjects breathed the test atmosphere through a mouthpiece that was attached to a two-way valve and an air delivery bag. SO2 concentration was continuously monitored by a fluorescent analyzer. No increase in SRaw was observed and no exposure-related subjective symptoms were noted.
Magnussen et al. (1990) exposed 46 adult asthmatics (21 males, 25 females, ages 16-62 years) to 0 or 0.5 ppm SO2 for 20 min. During, the first 10-min of the exposure period, the subjects were at rest. The subjects then performed 10-min of isocapnic hyperventilation at a level of 30 L/min. Subjects breathed the test atmosphere through a mouth-piece, and SO2 concentration was monitored by a fluorescent analyzer. A 45% increase in SRaw was observed after exposure to air, whereas a 163% increase in SRaw was observed after exposure to 0.5 ppm SO2.
Koenig et al. (1980) exposed nine adolescent asthmatics (7 males, 2 females, ages 14-18 years) to filtered air, 1 ppm SO2 and 1 mg/m3 sodium chloride droplet aerosol, or 1 mg/m3 sodium chloride droplet aerosol alone. Seated subjects breathed the test atmospheres by mouth through a rubber facemask. Exposures lasted 60 min and were divided into 30-min sections with a brief (5 to 7 min) interruption at the end of the first 30 min for functional measurements. Maximal flow at 50 and 75% of expired vital capacity were decreased with exposure to the SO2-sodium chloride droplet aerosol. The mean change for Vmax75 was −14% after 30 min and −12% after 60 min of exposure. All nine subjects had a decrease after 30 min, and 7 were decreased after 60 min. The mean change for Vmax50 was −8% after 30 min, with effects noted in all 9 subjects. There was no effect after 60 min exposure. No other pulmonary function effects were noted in any exposure group. No subjective symptoms were reported.
Koenig et al. (1983) studied nine adolescent asthmatics (6 males, 3 females, ages 12-16 years). Exposures via mouthpiece were to 0.5 ppm SO2 and 1 mg/m3 sodium chloride droplet aerosol, or 1 ppm SO2 and 1 mg/m3 sodium chloride droplet aerosol, or 1 mg/m3 sodium chloride droplet aerosol alone. Exposures were 40-min in duration, which included 30-min at rest followed by 10-min exercising on a treadmill. No effects were noted in the sodium chloride aerosol alone group. FEV10 decreased 15% at 0.5 ppm SO2 and 23% at 1.0 ppm SO2. Total respiratory resistance increased 47% at 0.5 ppm and 71% at 1.0 ppm and Vmax50 and Vmax75 were decreased 30 and 35%, respectively at 0.5 ppm and 51 and 61%, respectively at 1.0 ppm. Seven of the subjects then similarly inhaled 0.5 ppm SO2 and 1 mg/m3 sodium chloride droplet aerosol via a face mask. No pulmonary function effects were noted.
Koenig et al. (1985) studied ten adolescent asthmatics (5 males, 5 females, ages 14-18 years). Exposures were both via mouthpiece or facemask to 0.5 ppm SO2 and were 50 min in duration, which included 30-min at rest followed by 20-min exercising on a treadmill (43 L/min). After mouthpiece exposures, nasal resistance increased 32%, FEV1 decreased 24%, and Vmax50 and
Vmax75 were decreased 46 and 56%, respectively. Total respiratory resistance increased 60%. Facemask exposure resulted in an increase in nasal resistance of 30%, a decrease in FEV1 of 16%, and Vmax50 and Vmax75 were decreased 26%.
2.4.
Developmental and Reproductive Toxicitys
Developmental and reproductive data regarding human exposure to SO2 were not available.
2.5.
Genotoxicity
Genotoxicy studies regarding acute human exposure to SO2 were not available. However, the incidence of chromosomal aberrations and sister chromatid exchanges was increased in lymphocytes from workers at an Indian fertilizer plant who were exposed to an average of 15.9 ppm SO2 (Yadav and Kaushik 1996) and in workers exposed to 0.13 to 4.57 ppm SO2 in a Chinese sulfuric acid factory (Meng and Zhang 1990). The significance of these findings is questionable since no confounding exposures were discussed. Exposure of mammalian cells to SO2 resulted in toxicity, but not mutagenicity (Thompson and Pace 1962).
2.6.
Carcinogenicity
No information suggesting an increased cancer incidence from SO2 exposure in humans was located.
2.7.
Summary
Although no specific concentrations were reported, case reports suggest that exposure to apparently high concentrations of SO2 may cause death via asphyxia secondary to pulmonary edema and irreversible airway obstruction. Epidemiological studies from occupational exposures and ambient air pollution also indicate that the respiratory system is the primary target for SO2 toxicity. With regard to air pollution, the elderly and chronically ill appear to be more sensitive than healthy young adults; however, attributing the observed toxicity to SO2 is difficult due to the presence of confounding factors such as smoke, particulates, and other air pollutants. Controlled experimental studies show that mild irritation, bronchoconstriction, and lung function changes are observed after exposure to low concentrations of SO2. Asthmatics are more sensitive than healthy people to the effects of SO2 and healthy elderly subjects may be more sensitive than healthy young people, but less sensitive than asthmatics. Exercise exacerbates the respiratory effects of SO2 in both healthy
and asthmatic subjects. Data also suggest that cold air, dry air, the presence of other parti-culates and oral, rather than nasal, breathing may enhance the toxic effects of SO2. The body of experimental data suggests that 0.25 ppm may be a threshold for bronchoconstriction in asthmatics, and that a significant proportion of asthmatics will experience bronchoconstriction requiring medication or cessation of activity at 0.4-0.5 ppm. Data also suggest that a maximum response is obtained during the first 10-min of exposure and that continued or repeated exposures do not enhance the bronchoconstrictive response. Occupational exposures suggest that SO2 may be clastogenic; however, because confounding factors, such as exposure to other chemicals, were not considered, no definitive conclusions can be made regarding genotoxicity. No information concerning reproductive/developmental toxicity or carcinogenicity was available.
3.
ANIMAL TOXICITY DATA
3.1.
Acute Lethality
3.1.1.
Mice
Hilado and Machado (1977) exposed groups of four Swiss-albino mice to nominal SO2 concentrations (no analytical data were presented) of 1190 to 14,286 ppm and monitored time to first sign of incapacitation, time to convulsions, and time to death. Animals were exposed in a 4.2 liter, polymethyl methacrylate chamber. The SO2 was injected with a 60 ml syringe which had been filled from a gas supply cylinder. Time to first sign of incapacitation was under 3 min for 3500 to 14,300 ppm SO2 and increased to 6 min as SO2 concentration was decreased to 1100 ppm. Average time to staggering increased from 1 to 6 min and average time to convulsions increased from 2 to 8 min as SO2 concentration decreased from 14,300 to 3500 ppm. Average time to death increased from 3 to 8 min as SO2 concentration decreased from 14,300 to 4800 ppm. There were no deaths in animals exposed to 1190 ppm SO2 for 30 min.
Bitron and Aharonson (1978) exposed groups of 14 male albino mice (21±1 g, 1 month old) to 900 ppm SO2 for 25-640 min (9 exposure groups), 1400 ppm SO2 for 15 to 180 min (13 exposure groups), or 1900 ppm SO2 for 10 to 75 min (9 exposure groups). Median lethal exposure time (Lt50) for each concentration was calculated to be 200 min, 38 min, and 10 min for the 900, 1400, and 1900 ppm SO2 concentrations, respectively.
3.1.2.
Rats
Groups of eight male CD outbred rats (150 g) were exposed to varying concentrations of SO2 in a portable stainless-steel chamber for 4 h and observed for 14 days (Cohen et al. 1973). The test atmospheres were maintained
by metering SO2 directly into the incoming air and were monitored at frequent intervals by an iodometric procedure. The actual SO2 concentrations were maintained within 5% throughout exposures. Data are summarized in Table 9-5. An LC50 of 1057 ppm and BMCL05 of 573 ppm were calculated (by the author of this document) using the Litchfield and Wilcoxon method.
Male Swiss Albino rats (250-300 g) were exposed to 0 (51 rats) or 0.87 ppm SO2 (50 rats) for 24 h (Baskurt 1988). The experimental atmosphere was obtained by continuous mixing of filtered ambient air at a flow rate of 30 L/min with SO2 gas at a constant rate. Air samples were obtained from the exposure chamber with an impinger and the SO2 concentration was measured by a hydrogen peroxide-acid titration method. Hematocrit values were increased (p<0.005) in the SO2 exposed group compared to controls (43.55±0.41% vs 41.97±0.35%). Sulfhemoglobin values were also increased (p<0.05) in the SO2 exposed group compared to controls (0.6±0.08% vs. 0.08±0.02%).
3.2.
Nonlethal Toxicity
3.2.1.
Rats
In another study, Langley-Evans et al. (1997) examined the effect of a low protein maternal diet on later susceptibility to pulmonary injury from SO2 exposure. Rats were fed diets containing 180 g casein/kg diet (control diet), or 120, 90, or 60 g casein/kg diet (experimental diets). After acclimation to the diets for 14 days, the rats were mated and maintained on the same diet until parturition. Within 12 h of parturition, all dams were transferred to standard diets and the same diet was used to wean the pups. At 7 weeks of age, groups of 4 to 16 male rats were exposed to 0 or 0.11 ppm SO2, 5 h/day for 28 days. The exposure chamber had a volume of 0.5 m3 and a flow rate of 7 L/min. The test atmosphere was produced by mixing the contents of SO2 from cylinders with compressed air. The SO2 concentration was monitored with an “industrial monitor. Rats exposed to 90 or 60 g/casein/kg diet in utero exhibited greater pulmonary injury, as evidenced by broncho-alveolar lavage, than those exposed to control diet in utero. Maternal diet or SO2 exposure influenced liver GSH concentrations. GSH was lower in livers of rats exposed to the 120 g casein/kg maternal diet than in the 180 g/kg diet controls. Rats exposed to 60 g/kg diets had higher hepatic GSH levels than the 120 g/kg rats. SO2 exposure had no effect on hepatic GSH in the 180 or 90 g/kg diet group. In the 60 g/kg diet group, hepatic GSH was lowered by SO2 exposure. Conversely, rats exposed to the 120 g/kg diet had greater hepatic GSH in response to SO2 exposure.
TABLE 9-5 Mortality in Rats Exposed to Sulfur Dioxide for 4 Hours
|
SO2 Concentration (ppm) |
Mortality |
|
224 |
0/8 |
|
593 |
0/8 |
|
965 |
3/8 |
|
1168 |
5/8 |
|
1319 |
8/8 |
3.2.2.
Guinea Pigs
Amdur (1959) exposed groups of 10 to 30 guinea pigs to approximately 2.6, 20, 100, 200, or 750 ppm SO2 in a dynamic exposure chamber for 1 h. (SO2 concentrations are approximations from a graph). The SO2 atmosphere was generated by metering 1% SO2 in air from a cylinder into the main air stream. The air sample was collected in hydrogen-peroxide sulfuric acid reagent and the increase in conductivity was measured. Increased airway resistance was observed at all exposure concentrations. Data are summarized in Table 9-6.
Amdur (1959) also exposed a group of six guinea pigs to 24 ppm SO2 for 3 h. Increased airway resistance progressed from 20% at the end of the first hour to 86% at the end of the third hour. Three hours after exposure, the resistance had returned to control levels.
3.2.3.
Rabbits
Groups of 21 rabbits were exposed to 0 or 0.57 ppm SO2 for 10 min (Islam and Oberbarnscheidt 1994). Respiratory flow was slightly decreased and respiratory resistance was slightly increased in SO2 exposed animals compared to controls. There were no effects on tidal volume or dynamic compliance. The magnitude of the changes was difficult to assess since all results were presented graphically.
TABLE 9-6 Increased Airway Resistance in Guinea Pigs Exposed to Sulfur Dioxide for 1 Hour
|
SO2 Concentration |
Number of Animals |
% Increase in Airway Resistancea |
|
2.6 ppm |
16 |
20% |
|
20 ppm |
18 |
25% |
|
100 ppm |
10 |
70% |
|
200 ppm |
30 |
140% |
|
750 ppm |
13 |
300% |
|
aApproximate values estimated from graph. |
||
3.2.4.
Dogs
Anesthetized, intubated mongrel dogs (20-30 kg) were exposed to 0 (3 dogs) or 500 ppm (7 dogs) SO2 for 1 h (Hulbert et al. 1989). The SO2 atmosphere was generated by mixing pure SO2 with air using a Matheson dyna blender and flow controller. Four SO2-exposed dogs were sacrificed, in pairs, at 1 and 6 h after exposure, and their tracheas removed and fixed for microscopic examination. Three dogs were sacrificed immediately after the SO2 exposure, their tracheas removed, epithelium isolated and maintained in vitro (in buffer) before being fixed for microscopic examination 1 and 6 h postexposure. Tracheal epithelial damage was not observed in any controls, but was observed in all dogs exposed to SO2. Findings were similar whether tissues were obtained fresh or had been maintained in vitro. At 1 h, injury was difficult to assess because the tracheal surfaces were covered with exfoliated cells or were in total disarray. After 6 h, the lesions were well defined and large flattened cells covered the basement membranes where mucosal cells had exfoliated.
In another study, Jackson and Eady (1988) exposed 8 anesthetized and intubated beagle dogs of both sexes to 400 ppm SO2 for 2 h. Each dog was artificially respired with the SO2-air mixture (12 mL/kg, 20 breaths/min) which was analyzed with a Drager gas sampling system. Exposure to SO2 caused an immediate increase in lung reactivity to histamine aerosol. The lungs were most reactive immediately after exposure and lung reactivity had returned to control levels 2 h after exposure. The total number of cells obtained from BAL fluid increased after SO2 exposure; initially, the increase was due to an increase in epithelial cells (0.25 and 1 h) and later by neutrophils (1, 2, 3, and 4 h). No changes were observed in lymphocyte, macrophage, eosinophils, goblet cells, or mast cells in lavage fluid.
3.3.
Developmental and Reproductive Toxicity
Murray et al. (1979) exposed groups of 40 and 32 CF-1 mice to 0 and 23.9 ppm SO2, respectively, during days 6 through 15 of gestation, and groups of 20 New Zealand white rabbits to 0 or 70 ppm SO2 from days 6 through 18 of gestation. Animals were exposed under dynamic airflow conditions in stainless steel and glass Rochester chambers with a 4.3 m3 volume. The chamber airflow was 800 L/min and the SO2 atmosphere was generated by metering SO2 at known rates through rotometers into the airstream being drawn into the chamber. Concentrations were analyzed by infrared spectrometry. A marginal, although statistically significant (p<0.05), decrease in mouse fetal body weight was noted (1.05±0.11 g for controls vs 1.00±0.08 g for test animals). No other treatment-related, biologically significant effects were noted in either mice or rabbits.
Pregnant CD-1 albino mice were exposed to 0, 32, 65, 125, or 250 ppm SO2 from days 7 to 17 of gestation (Singh 1982). The exposure duration for each day was not reported. Exposures were conducted in plexiglass chambers with a total gas flow rate of 450 mL/min. The SO2 concentration was monitored at each chamber inlet via infrared spectrometry. The mice were sacrificed on day 18 of gestation. No signs of maternal toxicity were noted during the exposure period and no treatment related developmental effects were noted. In a similar study, Singh (1989) exposed pregnant CD-1 mice to 0, 32, or 65 ppm SO2 from days 7 to 18 of gestation. Again, the duration of exposure each day was not reported. Dams were allowed to deliver. Increased time for righting reflex was observed for pups exposed to both SO2 concentrations compared to controls on postnatal day 1. Increased negative geotaxis was noted in exposed offspring on postnatal day 10. Birth weights of 65 ppm pups were 89% of controls. No other effects were noted.
Petruzzi et al. (1996) exposed adult male and female CD-1 mice to 0, 5, 12, or 30 ppm SO2 for 24 days, from 9 days before the formation of breeding pairs through pregnancy day 12-14. Exposures were near-continuous, covering approximately 80% of the total time and were conducted in stainless steel exposure chambers with a hatch glass in the front door. SO2 was delivered from aluminum bottles and differing concentrations were obtained by varying the flow and gas pressure from the bottles. SO2 concentrations were monitored with an ultra-violet SO2 analyzer. Actual concentrations were within 10% of target concentrations. Within 1 h of the start of exposure, increased rearing and social interactions were observed and were more evident in males than in females. Observations on days 3, 6, and 9 showed dose-dependent decreased grooming and increased digging. Food and water consumption decreased in treated animals and increased in controls after the formation of breeding pairs. No effects were noted for reproductive performance or neurobehavioral development of the offspring. In another report from the same laboratory, the male CD-1 mice prenatally exposed to 0, 5, 12, or 30 ppm SO2 from the Petruzzi et al. (1996) study were examined for changes in behavior as adults (Fiore et al. 1998). At adulthood, following a 4 week isolation period, they underwent a 20 min aggressive encounter with a CD-1 male opponent. Dose-related increases were noted for body sniffing and nonsocial activities, whereas freezing, tail rattling, and defensive behaviors were decreased.
3.4.
Genotoxicity
Genotoxic studies regarding animal exposure to SO2 were not available. However, high bisulfite concentrations formed from SO2 at nonphysiological pH were positive in assays with phage T4 (Summers and Drake 1971), phage T (Hayatsu and Miura 1970), E. coli (Mukai et al. 1970), and S. cerevisiae (Dorange and Dupuy 1972). The biological significance of this mutagenic response is questionable as the effect may be due to the pH shift.
3.5.
Carcinogenicity
Peacock and Spence (1967) exposed mice to 0 (41 males, 39 females) or 500 ppm (35 males, 30 females) SO2 5 min/day, 5 days/week for 2 years. Data suggested possible treatment-related lung tumors; however, since only one concentration was tested these data are of limited use. In females, the incidence of lung adenomas and carcinomas was 13/30 in treated animals and 5/30 in controls. In males, the incidence of lung adenomas and carcinomas was 15/28 in treated animals and 11/35 in controls.
3.6.
Summary
Well-conducted animal lethality studies are limited to a mouse study defining median lethal time to death (Lt50) and a rat study yielding a 4-h LC50 of 1057 ppm and a BMCL05 of 573 ppm SO2. Non-lethal toxicity studies are more abundant and show that, as in humans, relatively low concentrations of SO2 induce bronchoconstriction and associated increase in airway resistance in a number of animal species. Respiratory tract pathology is observed at higher SO2 concentrations. SO2 was generally not a developmental or reproductive toxicant. Genotoxic studies regarding exposure to SO2 are equivocal and the carcinogenicity study, although suggesting a possible increase in pulmonary tumors, is of poor quality and thus of limited use.
4.
SPECIAL CONSIDERATIONS
4.1.
Metabolism and Disposition
Although the main effects of SO2 are on the respiratory tract, much of an inhaled dose may be transferred into systemic circulation. During inhalation, SO2 may react with water in the respiratory tract to form sulfurous acid or may be oxidized to form sulfur trioxide. Sulfur trioxide reacts rapidly with water to form sulfuric acid. Sulfurous acid dissociates to sulfite and bisulfate ions, which are in chemical equilibrium. Bisulfite ions react by sulfonation, autooxidation, and by addition to cytosine. Most inhaled SO2 is detoxified in the liver by the sulfite-oxidase pathway, which forms S-sulfonates that can be found in the plasma and sulfates that are excreted in the urine. The S-sulfonates are long-lived and supply the circulation with bisulfite that may reach many tissues. In rabbits exposed to 10 ppm SO2, the half-life for clearance of plasma protein S-sulfonates was 4.1 days. Some circulating S-sulfonates may decompose to SO2 which is exhaled (WHO 1984).
4.2.
Mechanism of Toxicity
SO2 is a water-soluble irritant which causes upper-airway irritation and may induce increased airway resistance via reflex bronchoconstriction. The exact mechanism responsible for SO2 -induced bronchoconstriction is not known. However, the rapid onset and reversibility of SO2-induced bronchoconstriction observed in asthmatics is likely due to decreased airway caliber caused by contraction of airway smooth muscle. Constriction of airway smooth muscle in response to environmental stimuli can be induced by intrinsic chemical and/or physical stimuli, acting via neural and/or humoral pathways. SO2 may act either directly on smooth muscle or may cause the release of chemical mediators from the tissue, especially the release of histamine from mast cells. Other potential pharmacological mediators of SO2 -induced bronchoconstriction are leukotrienes and prostaglandin F2-alpha, both of which are released in the airways and may cause smooth muscle contraction (Horstman and Folinsbee 1989).
4.3.
Temporal Extrapolation
The impact of exposure duration on the magnitude of low-concentration SO2-induced bronchoconstriction in asthmatics and healthy humans appears to decrease with extended exposure. For example, asthmatics exposed to 0.75 ppm SO2 for 3-h exhibited increases in SRaw of 322% 10-min into the exposure, 233% 20-min into the exposure, 26% 1-hr into the exposure, and 5% 2-h into the exposure. At the end of the 3-h exposure period, SRaw was decreased 12%. These, and other data presented in Tables 4 and 5, suggest that a major portion of the SO2-induced bronchoconstriction occurs within 10-min and increases minimally or resolves beyond 10-min of exposure. Furthermore, there is no evidence that any other effect is relevant at low sulfur dioxide concentrations; the respiratory response is a first-level, sensitive response to SO2 exposure. This phenomenon is also observed with healthy humans. For example, maximum pulmonary flow resistance was observed within 5 to 10 min when healthy adult males were exposed to 5 or 13 ppm SO2 for up to 30 min (Frank et al. 1962) or 4-6 or 14-17 ppm SO2 for up to 30 min (Frank et al. 1964). Therefore, time scaling will not be utilized for AEGL values for SO2.
Data are not sufficient to ascertain whether a maximal response to SO2 for a lethal end point is obtained within 10 min. Therefore, time scaling will be utilized in the derivation of AEGL-3 values. It has been shown that the concentration-exposure time relation-ship for many irritant and systemically acting vapors and gases may be described by Cn × t = k, where the exponent n ranges from 0.8 to 3.5 (ten Berge et al. 1986). Data were unavailable for an empirical derivation of n for sulfur dioxide. Therefore, an n of 3 may be applied to extrapolate to shorter time periods, and n of 1 may be used for ex-
trapolation to the 8-h time period to provide AEGL values that would be protective of human health (NRC 2001).
4.4.
Concurrent Exposure
As previously stated, the relationship between SO2 exposure in polluted air and human health effects is confounded by the presence of other air pollutants, especially nitrogen oxides, ozone, smoke and particulate matter. Several controlled human studies have examined the health effects resulting from concurrent exposure to SO2 and other chemicals. As previously described, inert sodium chloride aerosols had no added effect when administered to healthy subjects in conjunction with SO2 (Frank et al. 1964; Rondinelli et al. 1987). In human asthmatics, Jorres and Magnussen (1990) demonstrated an amplified response to SO2 after a 30 min exposure to 0.75 ppm NO2. Data from a study by Rigas et al. (1997) suggests that exposure to SO2 may enhance absorption of ozone in the lungs of healthy adult males. In asthmatic subjects, exposure to a combination of 400 ppb NO2 + 200 ppb SO2 enhanced the airway response to an inhaled allergen (Dermatophagoides pteronyssinus) (Rusznak et al. 1996).
Amdur (1959) examined the effect of concurrent exposure of SO2 and sulfuric acid mist or inert sodium chloride aerosol on guinea pigs and found that particle size was a factor in the magnitude of response. When animals were exposed to 0.8μ sulfuric acid mist particles and SO2, a synergistic response was observed with regard to bronchoconstriction; however, when 2.5μ sulfuric acid particles were administered with SO2, no synergism was observed. The response was actually slightly less than the response to SO2 alone. When sodium chloride aerosols of 0.04μ and 2.5μ were administered in combination with SO2, a similar response was noted with regard to bronchoconstriction; potentiation was observed with the smaller particles but not by the larger particles.
5.
RATIONALE AND AEGL-1
5.1.
Human Data Relevant to AEGL-1
Upper respiratory and throat irritation were noted in healthy males (Amdur et al. 1953; Frank et al. 1962) exposed to 5 ppm SO2 for 10-30 min. Throat and nasal irritation were reported in healthy, exercising subjects exposed to 2 or 4 ppm SO2 for 20 min (Sandstrom et al. 1988). Upper respiratory and ocular irritation were noted in healthy adults exposed to 1 ppm SO2 for 4 h with intermittent exercise (Kulle et al. 1984). No treatment-related effects were noted in exercising asthmatics exposed to 0.2 ppm for 5 min (Linn et al. 1983b), 0.25 ppm for 10-40 min (Schacter et al. 1984), 0.25 ppm for 75 min (Roger et al. 1985), or 0.5 ppm for 10-40 min (Schacter et al. 1984). An increase in
SRaw of 134-139% was observed in exercising asthmatics exposed to 0.25 ppm for 5 min (Bethel et al. 1985).
5.2.
Animal Data Relevant to AEGL-1
Amdur (1959) observed a 20% and 25% increase in airway resistance in guinea pigs exposed to 2.6 and 20 ppm SO2, respectively, for 1 h.
5.3.
Derivation of AEGL-1
A weight of evidence approach utilizing the human asthmatic data will be utilized to derive AEGL-1 values for SO2. The body of experimental data suggests that 0.20 ppm may be a NOEL for bronchoconstriction in exercising asthmatics, based on the fact that no treatment-related effects were noted in asthmatics exposed to 0.2 ppm for 5 min (Linn et al. 1983b), 0.25 ppm for 10-40 min (Schacter et al. 1984), 0.25 ppm for 75 min (Roger et al. 1985), 0.5 ppm for 10-40 min (Schacter et al. 1984), or 0.5 ppm for 30 min (Jorres and Magnussen 1990). However, an increase in SRaw of 134-139% was observed in exercising asthmatics exposed to 0.25 ppm for 5 min (Bethel et al. 1985); the increase in SRaw in this study, but not in the other studies, may be attributed to the lower relative humidity (36%) in the Bethel et al. (1985) compared to the other studies (70-85%). No uncertainty factors will be applied because the weight of evidence approach utilized studies from a sensitive human population, that of exercising asthmatics. The role of exposure duration to the magnitude of SO2-induced bronchoconstriction in asthmatics appears to decrease with extended exposure. For example, asthmatics exposed to 0.75 ppm SO2 for 3-h exhibited increases in SRaw of 322% 10-min into exposure, 233% 20-min into the exposure, 26% 1-hr into the exposure, 5% 2-h into the exposure, and a decrease of 12% at the end of the 3-h exposure period. These, and other data presented in Tables 3 and 4, suggest that a major portion of the SO2-induced bronchoconstriction occurs within 10-min and increases minimally or resolves beyond 10-min of exposure. Therefore, AEGL-1 values for SO2 will be held constant across all time points. The AEGL-1 values for SO2 are presented in Table 9-7, and the calculations for these AEGL-1 values are presented in Appendix A.
Exposure to these AEGL-1 values are expected to have no effect in healthy individuals, but are consistent with the definition of AEGL-1 for asthmatic individuals.
TABLE 9-7 AEGL-1 Values for Sulfur Dioxide
|
Classification |
10-min |
30-min |
1-h |
4-h |
8-h |
|
AEGL-1 |
0.20 ppm (0.52 mg/m3) |
0.20 ppm (0.52 mg/m3) |
0.20 ppm (0.52 mg/m3) |
0.20 ppm (0.52 mg/m3) |
0.20 ppm (0.52 mg/m3) |
6.
RATIONALE AND AEGL-2
6.1.
Human Data Relevant to AEGL-2
A 72% increase in pulmonary flow resistance accompanied by cough, irritation, and increased salivation was observed in healthy males exposed to 13 ppm SO2 for 10 min (Frank et al. 1962). A 65% increase in pulmonary flow resistance, cough, and chest irritation were observed in healthy male mouth-breathers exposed to 28 ppm SO2 for 10 min (Frank et al. 1962). Asthmatics developed increased airway resistance of 5- to 322% after exposure to 0.75 ppm SO2 for up to 3 h (Hackney et al. 1984). An increase in SRaw of 150%, decrease in FEF of 22%, and decrease in FEV1 of 8% were observed in exercising asthmatics exposed to 0.75 ppm SO2 for 10-40 min (Schacter et al. 1984).
6.2.
Animal Data Relevant to AEGL-2
Amdur (1959) observed a 70% increase in airway resistance in guinea pigs exposed to 100 ppm SO2 for 1 h and an increase of 85% in guinea pigs exposed to 24 ppm for 3 h. Tracheal pathology was observed in anesthetized dogs exposed to 500 ppm SO2 for 1 h.
6.3.
Derivation of AEGL-2
A weight of evidence approach utilizing the human asthmatic data will be utilized to derive AEGL-2 values for SO2. Data suggest that 0.75 ppm induces moderate respiratory response in exercising asthmatics for exposure durations of 10-min to 3-h (Hackney et al. 1984; Schacter et al. 1984). No uncertainty factors will be applied because the weight of evidence approach utilized studies from a sensitive human population, that of exercising asthmatics. The role of exposure duration to the magnitude of SO2-induced bronchoconstriction in asthmatics appears to decrease with extended exposure. For example, asthmatics exposed to 0.75 ppm SO2 for 3-h exhibited increases SRaw of 322% 10-min into exposure, 233% 20-min into the exposure, 26% 1-hr into the exposure, 5% 2-h into the exposure, and a decrease of 12% at the end of the 3-h exposure period. These, and other data presented in Tables 3 and 4, suggest that a major portion of the SO2-induced bronchoconstriction occurs within 10-min and increases minimally or resolves beyond 10-min of exposure. Therefore, AEGL-2 values for SO2 were held constant across all time points. The AEGL-2 values for SO2 are presented in Table 9-8, and the calculations for these AEGL-2 values are presented in Appendix A.
Exposure to these AEGL-2 values are expected to have no effect in healthy individuals, but are consistent with the definition of AEGL-2 for asthmatic individuals.
TABLE 9-8 AEGL-2 Values for Sulfur Dioxide
|
Classification |
10-min |
30-min |
1-h |
4-h |
8-h |
|
AEGL-2 |
0.75 ppm (1.95 mg/m3) |
0.75 ppm (1.95 mg/m3) |
0.75 ppm (1.95 mg/m3) |
0.75 ppm (1.95 mg/m3) |
0.75 ppm (1.95 mg/m3) |
7.
RATIONALE AND AEGL-3
7.1.
Human Data Relevant to AEGL-3
No human data were relevant to establishing the AEGL-3 values.
7.2.
Animal Data Relevant to AEGL-3
No deaths were observed in mice exposed to 1190 ppm (nominal concentration) SO2 for 30 min (Hilado and Machado 1977). No deaths occurred in rats exposed to 593 ppm SO2 for 4 h; an LC50 of 1057 ppm; and an BMCL05 of 573 ppm were also calculated from the same study (Cohen et al. 1973).
7.3.
Derivation of AEGL-3
The AEGL-3 values will be based on a calculated BMLC05 in rats exposed to SO2 for 4-h (573 ppm) (Cohen et al. 1973). An uncertainty factor of 10 will be applied for intraspecies extrapolation due to the wide variability in response to SO2 exposure between healthy and asthmatic humans. An uncertainty factor of 3 was applied for interspecies variability; this factor of 3 was considered sufficient because no deaths were reported in guinea pigs exposed to 750 ppm SO2 for 1 h (Amdur 1959), in dogs exposed to 400 ppm SO2 for 2 h (Jackson and Eady 1988), or in rats exposed to 593 ppm for 4-h (Cohen et al. 1973). Furthermore, a median lethal exposure time (Lt50) of 200 min was reported for mice exposed to 900 ppm SO2 (Bitron and Aharonson 1978), and three of eight rats died when exposed to 965 ppm for 240 min (Cohen et al. 1973), suggesting limited interspecies variability. Data are not sufficient to ascertain whether a maximal response to SO2 for a lethal end point is obtained within 10 min. Therefore, time scaling will be utilized in the derivation of AEGL-3 values. It has been shown that the concentration-exposure time relationship for many irritant and systemically acting vapors and gases may be described by Cn × t = k, where the exponent n ranges from 0.8 to 3.5 (ten Berge et al. 1986). Data were unavailable for an empirical derivation of n for sulfur dioxide. Therefore, an n of 3 was applied to extrapolate to the 1-h time period, and n of 1 was used for extrapolation to the 8-h time period to provide AEGL values that would be protective of human health (NRC 2001). The 1-h
AEGL-3 value was also adopted as 10-min and 30-min values because asthmatic humans are highly sensitive to sulfur dioxide at short time periods. The AEGL-3 values for SO2 are presented in Table 9-9, and the calculations for these AEGL-3 values are presented in Appendix A.
8.
SUMMARY OF AEGLS
8.1.
AEGL Values and Toxicity End Points
The derived AEGL values for various levels of effects and durations of exposure are summarized in Table 9-10. A weight-of-evidence approach from studies in exercising asthmatics was used to derive AEGL-1 (NOEL for bronchoconstriction) and AEGL-2 (moderate respiratory effects) values. A calculated BMCL05 in rats was used as the basis for AEGL-3.
8.2.
Other Exposure Criteria
Standards and guidance levels for workplace and community exposures for sulfur dioxide are listed in Table 9-11. In addition to the standards listed in Table 9-11, air quality standards have also been developed for SO2. The National Ambient Air Quality Standard is 0.14 ppm, with a significant harm level of 1.0 ppm for a 1-h average (64 Fed. Reg. 42530[1999]).
8.3.
Data Adequacy and Research Needs
The data base for human exposure for effects defined by AEGL-1 and AEGL-2 is relatively good as controlled chamber studies with both asthmatic and otherwise healthy volunteers are available. These studies, when considered together, provide good threshold-response information and are appropriate for derivation of AEGL-1 and AEGL-2 values. Case reports of accidental human exposure to sulfur dioxide leading to effects consistent with the definitions of AEGL-3 did not include concentration or duration parameters adequate for derivation of values. Studies sufficient for derivation of AEGL-3 values were limited to animal data.
TABLE 9-9 AEGL-3 Values for Sulfur Dioxide
|
Classification |
10-min |
30-min |
1-h |
4-h |
8-h |
|
AEGL-3 |
30 ppm (78 mg/m3) |
30 ppm (78 mg/m3) |
30 ppm (78 mg/m3) |
19 ppm (49 mg/m3) |
9.6 ppm (25 mg/m3) |
TABLE 9-10 Summary of AEGL Values for Sulfur Dioxide
|
Classification |
0-min |
30-min |
1-h |
4-h |
8-h |
|
AEGL-1 (Nondisabling) |
0.20 ppm (0.52 mg/m3) |
0.20 ppm (0.52 mg/m3) |
0.20 ppm (0.52 mg/m3) |
0.20 ppm (0.52 mg/m3) |
0.20 ppm (0.52 mg/m3) |
|
AEGL-2 (Disabling) |
0.75 ppm (1.95 mg/m3) |
0.75 ppm (1.95 mg/m3) |
0.75 ppm (1.95 mg/m3) |
0.75 ppm (1.95 mg/m3) |
0.75 ppm (1.95 mg/m3) |
|
AEGL-3 (Lethality) |
30 ppm (78 mg/m3) |
30 ppm (78 mg/m3) |
30 ppm (78 mg/m3) |
19 ppm (49 mg/m3) |
9.6 ppm (25 mg/m3) |
TABLE 9-11 Extant Standards and Guidelines for Sulfur Dioxide
|
Guideline |
Exposure Duration |
||||
|
10-min |
30-min |
1-h |
4-h |
8-h |
|
|
AEGL-1 |
0.20 ppm |
0.20 ppm |
0.20 ppm |
0.20 ppm |
0.20 ppm |
|
AEGL-2 |
0.75 ppm |
0.75 ppm |
0.75 ppm |
0.75 ppm |
0.75 ppm |
|
AEGL-3 |
30 ppm |
30 ppm |
30 ppm |
19 ppm |
9.6 ppm |
|
ERPG-1(AIHA)a |
0.3 ppm |
|
|
|
|
|
ERPG-2 (AIHA)a |
3 ppm |
|
|
|
|
|
ERPG-3 (AIHA)a |
15 ppm |
|
|
|
|
|
EEGL(NRC)b |
30 ppm (10 min) |
20 ppm (30 min) |
10 ppm (60 min) |
|
5 ppm (24 hr) |
|
IDLH (NIOSH)c |
100 ppm |
|
|
|
|
|
REL-TWA (NIOSH)d |
|
|
|
|
2 ppm |
|
PEL-TWA(OSHA)e |
|
|
|
|
5 ppm |
|
TLV-TWA(ACGIH)f |
|
|
|
|
2 ppm |
|
REL-STEL (NIOSH)g |
5 ppm |
|
|
|
|
|
TLV-STEL(ACGIH)h |
5 ppm |
|
|
|
|
|
MAK (Germany)i |
|
|
|
|
0.5 ppm |
|
MAC(The Netherlands)j |
|
|
|
|
2 ppm |
|
OELV- LLV (Sweden)k |
|
|
|
|
2 ppm |
|
OELV- CLV (Sweden)k |
5 ppm |
|
|
|
|
|
aERPG (Emergency Response Planning Guidelines, American Industrial Hygiene Association (AIHA 2002). The ERPG-1 is the maximum airborne concentration below which it is believed nearly all individuals could be exposed for up to 1 h without experiencing other than mild, transient adverse health effects or without perceiving a clearly defined objectionable odor. The ERPG-1 for SO2 is based on increased airway resistance in exercising asthmatics. The ERPG-2 is the maximum airborne concentration below which it is believed nearly all individuals could be exposed for up to 1 h without experiencing or developing irreversible or other serious health effects or symptoms that could impair an individual's ability to take protection action. The ERPG-2 for SO2 is based on bronchoconstriction requiring bronchodilation therapy in asthmatics exposed to 5 ppm for 10-min. |
|||||
9.
REFERENCES
ACGIH (American Conference of Governmental Industrial Hygienists). 2003. TLVs and BEIs: Threshold Limit Values for Chemical Substances and Physical Agents and Biological Exposure Indices. American Conference of Governmental Industrial Hygienists, Cincinnati, OH.
AIHA (American Industrial Hygiene Association). 2002. Emergency Response Planning Guidelines. Fairfax, VA: AIHA Press.
Amdur, M.O. 1959. The physiological response of guinea pigs to atmospheric pollutants. Int. J. Air Pollut. 1(3):170-183.
Amdur, M.O., W.W. Melvin, and P. Drinker. 1953. Effects of inhalation of sulphur dioxide by man. Lancet 265(6789):758-759.
Andersen, I.B., G.R. Lundqvist, P.L. Jensen, and D.F. Proctor. 1974. Human response to controlled levels of sulfur dioxide. Arch. Environ. Health 28(1):31-39.
Archer, V.E., C.D. Fullmer, and C.H. Castle. 1979. Sulfur dioxide exposure in a smelter: III. Acute effects and sputum cytology. J. Occup. Med. 21(5):359-364.
ATSDR (Agency for Toxic Substances and Disease Registry). 1998. Toxicological Profile for Sulfur Dioxide. U.S. Department of Health and Human Services, Public Health Service, Agency for Toxic Substances and Disease Registry, Atlanta, GA. December 1998 [online]. Available: http://www.atsdr.cdc.gov/toxprofiles/tp116.pdf [accessed Oct. 14, 2008].
Balmes, J.R., J.M. Fine, and D. Sheppard. 1987. Symptomatic bronchoconstriction after short-term inhalation of sulfur dioxide. Am. Rev. Respir. Dis. 136(5):1117-1121.
Baskurt, O.K. 1988. Acute hematologic and hemorheologic effects of sulfur dioxide inhalation. Arch. Environ. Health 43(5):344-348.
Bethel, R.A., J. Epstein, D. Sheppard, J.A. Nadel, and H.A. Boushey. 1983a. Sulfur dioxide-induced bronchoconstriction in freely breathing, exercising, asthmatic subjects. Am. Rev. Respir. Dis. 128(6):987-990.
Bethel, R.A., D.J. Erle, J. Epstein, D. Sheppard, J.A. Nadel, and H.A. Boushey. 1983b. Effect of exercise rate and route of inhalation on sulfur dioxide-induced bronchoconstriction in asthmatic subjects. Am. Rev. Respir. Dis. 128(4):592-596.
Bethel, R.A., D. Sheppard, B. Geffroy, E. Tam, J.A. Nadel, and H.A. Boushey. 1985. Effect of 0.25 ppm sulfur dioxide on airway resistance in freely breathing, heavily exercising, asthmatic subjects. Am. Rev. Respir. Dis. 131(4):659-661.
Bitron, M.D., and E.F. Aharonson. 1978. Delayed mortality of mice following inhalation of acute doses of CH2O, SO2, Cl2, and Br2. Am. Ind. Hyg. Assoc. J. 39(2):129-138.
Braback, L., A. Breborowicz, S. Dreborg, A. Knutsson, H. Pieklik, and B. Bjorksten. 1994. Atopic sensitization and respiratory symptoms among Polish and Swedish school children. Clin. Exp. Allergy 24(9):826-835.
Braun-Fahrlander, C., J.C. Vuille, F.H. Sennhauser, U. Neu, T. Kunzle, L. Grize, M. Gassner, C. Minder, C. Schindler, H.S. Varonier, and B. Wuthrich. 1997. Respiratory health and long-term exposure to air pollutants in Swiss schoolchildren. Am. J. Respir. Crit. Care Med. 155(3):1042-1049.
Carson, J.L., A.M. Collier, S. Hu, C.A. Smith, and P. Stewart. 1987. The appearance of compound cilia in the nasal mucosa of normal human subjects following acute, in vivo exposure to sulfur dioxide. Environ. Res. 42(1):155-165.
Castellsague, J., J. Sunyer, M. Saez, and J.M. Anto. 1995. Short-term association between air pollution and emergency room visits for asthma in Barcelona. Thorax 50(10):1051-1056.
Charan, N.B., C.G. Myers, S. Lakshminarayan, and T.M. Spencer. 1979. Pulmonary injuries associated with sulfur dioxide inhalation. Am. Rev. Respir. Dis. 119(4):555-560.
Cohen, H.J., R.T. Drew, J.L. Johnson, and K.V. Rajagopalan. 1973. Molecular basis of the biological function of molybdenum: The relationship between sulfite oxidase and the acute toxicity of bisulfite and SO2. Proc. Natl. Acad. Sci. USA 70(12):3655-3659.
Dautrebrande, L., and R. Capps. 1950. Studies on aerosols. IX. Enhancement of irritating effects of various substances on the eye, nose, and throat by particulate matter and liquid aerosols in connection with pollution of the atmosphere. Arch. Int. Pharmacodyn. Ther. 82(4):505-528.
DFG (Deutsche Forschungsgemeinschaft). 2002. List of MAK and BAT Values 2002. Maximum Concentrations and Biological Tolerance Values at the Workplace Report No. 38. Weinheim, Federal Republic of Germany: Wiley VCH.
Dorange, J.L., and P. Dupuy. 1972. Demonstration of the mutagenic action of sodium sulfite on yeast [in French]. C.R. Acad. Sci. Hebd. Seances Acad. Sci. D 274(20):2798-2800.
Douglas, R.B., and J.E. Coe. 1987. The relative sensitivity of the human eye and lung to irritant gases. Ann. Occup. Hyg. 31(2):265-267.
EPA (U.S. Environmental Protection Agency). 1994. Supplement to the Second Addendum (1986) to Air Quality Criteria for Particulate Matter and Sulfur Oxides (1982). Assessment of New Findings on Sulfur Dioxide Acute Exposure Health Effects in Asthmatic Individuals. EPA/600/FP-93/002. Environmental Criteria and Assessment Office, Office of Health and Environmental Assessment, Office of Research and Development, U.S. Environmental Protection Agency, Research Triangle Park, NC. August 1994.
Fiore, M., S. Petruzzi, G. Dell’Omo, and E. Alleva. 1998. Prenatal sulfur dioxide exposure induces changes in the behavior of adult male mice during agonistic encounters. Neurotoxicol. Teratol. 20(5):543-548.
Frank, N.R. 1964. Studies on the effects of acute exposure to sulphur dioxide in human subjects. Proc. R. Soc. Med. 57(10 Pt.2):1029-1033.
Frank, N.R., M.O. Amdur, and J.L. Whittenberger. 1964. A comparison of the acute effects of SO2 administered alone or in combination with NaCl particles in the respiratory mechanics of healthy adults. Int. J. Air Water Pollut. 8:125-133.
Frank, N.R., M.O. Amdur, J. Worcester, and J.L. Whittenberger. 1962. Effects of acute controlled exposure to SO2 on respiratory mechanics in healthy male adults. J. Appl. Physiol. 17:252-258.
Frank, N.R., M.O. Amdur, and J.L. Whittenberger. 1964. A comparison of the acute effects of SO2 administered alone or in combination with NaCl particles in the respiratory mechanics of healthy adults. Air Water Pollut. 8:125-133.
Galea, M. 1964. Fatal sulfur dioxide inhalation. Can. Med. Assoc. J. 91:345-347.
Goldstein, I.F., and A.L. Weinstein. 1986. Air pollution and asthma: Effects of exposures to short-term sulfur dioxide peaks. Environ. Res. 40(2):332-345.
Gong, H., P.A. Lachenburch, P. Harber, and W.S. Linn. 1995. Comparative short-term health responses to sulfur dioxide exposure and other common stresses in a panel of asthmatics. Toxicol. Ind. Health 11(5):467-487.
Hackney, J.D., W.S. Linn, R.M. Bailey, C.E. Spier, and L.M. Valencia. 1984. Time course of exercise-induced bronchoconstriction in asthmatics exposed to sulfur dioxide. Environ. Res. 34(2):321-327.
Harkonen, H., H. Nordman, O. Korhonen, and I. Winbald. 1983. Long-term effects of exposure to sulfur dioxide. Lung function after a pyrite dust explosion. Am. Rev. Respir. Dis. 128(5):890-893.
Hayatsu, H., and A. Miura. 1970. The mutagenic action of sodium bisulfite. Biochem. Biophys. Res. Commun. 39(1):156-160.
Higgins, B.G., H.C. Francis, C.J. Yates, C.J. Warburton, A.M. Fletcher, J.A. Reid, C.A. Pickering, and A.A. Woodcock. 1995. Effects of air pollution on symptoms and peak expiratory flow measurements in subjects with obstructive airways disease. Thorax 50(2):149-155.
Hilado, C.J., and A.M. Machado. 1977. Effect of sulfur dioxide on Swiss albino mice. J. Combust. Toxicol. 4(2):236-245.
Hoek, G., and B. Brunekreef. 1993. Acute effects of a winter air pollution episode on pulmonary function and respiratory symptoms of children. Arch. Environ. Health 48(5):328-335.
Horstman, D.H., and L.J. Folinsbee. 1989. Sulfur dioxide-induced bronchoconstriction in asthmatics exposed for short durations under controlled conditions: A selected review. Pp. 195-206 in Susceptibility to Inhaled Pollutants, M.J. Utell, and R. Frank, eds. STP 1024. Pittsburgh, PA: American Society for Testing and Materials International.
Horstman, D.H., L.J. Roger, H. Kehrl, and M. Hazucha. 1986. Airway sensitivity of asthmatics to sulfur dioxide. Toxicol. Ind. Health 2(3):289-298.
Horstman, D.H., E. Seal, L.J. Folinsbee, P. Ives, and L.J. Roger. 1988. The relationship between exposure duration and sulfur dioxide-induced bronchoconstriction in asthmatic subjects. Am. Ind. Hyg. Assoc. J. 49(1):38-47.
Hulbert, W.C., S.F. Man, M.K. Rosychuk, G. Braybrook, and J.G. Mehta. 1989. The response phase- the first six hours after acute airway injury by sulfur dioxide inhalation: An in vivo and in vitro study. Scanning Microsc. 3(1):369-378.
IPCS (International Programme on Chemical Safety). 1979. Sulfur Oxides and Suspended Particulate Matter. Environmental Health Criteria 8. Geneva: World Health Organization [online]. Available: http://www.inchem.org/documents/ehc/ehc/ehc008.htm [accessed Oct. 17, 2008].
Islam, M.S., and J. Oberbarnscheidt. 1994. The effect of a short-term SO2 exposure on the respiratory function of sensitized non-anesthetized rabbits [in German]. Zentralbl. Hyg. Umweltmed. 196(2): 104-113.
Jackson, D.M., and R.P. Eady. 1988. Acute transient SO2-induced airway hyperreactivity: Effects of nedocromil sodium. J. Appl. Physiol. 65(3):1119-1124.
Jorres, R., and H. Magnussen. 1990. Airways response of asthmatics after a 30 min exposure, at resting ventilation to 0.25 ppm NO2 or 0.5 ppm SO2. Eur. Respir. J. 3(2):132-137.
Kehrl, H.R., L.J. Roger, M.J. Hazucha, and D.H. Horstman. 1987. Differing response of asthmatics to sulfur dioxide exposure with continuous and intermittent exercise. Am. Rev. Respir. Dis. 135(2):350-355.
Koenig, J.Q., W.E. Pierson, and R. Frank. 1980. Acute effects of inhaled sulfur dioxide plus sodium chloride droplet aerosol on pulmonary function in asthmatic adolescents. Environ. Res. 22(1):145-153.
Koenig, J.Q., W.E. Pierson, M. Horike, and R. Frank. 1983. A comparison of the pulmonary effects of 0.5 ppm versus 1.0 ppm sulfur dioxide plus sodium chloride droplets in asthmatic adolescents. J. Toxicol. Environ. Health 11(1):129-139.
Koenig, J.Q., M.S. Morgan, M. Horike, and W.E. Pierson. 1985. The effects of sulfur oxides on nasal and lung function in adolescents with extrinsic asthma. J. Allergy Clin. Immunol. 76(6):813-818.
Kulle, T.J., L.R. Sauder, F. Shanty, H.D. Kerr, B.P. Farrell, W.R. Miller, and J.H. Milman. 1984. Sulfur dioxide and ammonium sulfate effects on pulmonary function and bronchial reactivity in human subjects. Am. Ind. Hyg. Assoc. J. 45(3): 156-161.
Langley-Evans, S.C., G.J. Phillips, and A.A. Jackson. 1997. Fetal exposure to low protein maternal diet alters the susceptibility of young adult rats to sulfur dioxide-induced lung injury. J. Nutr. 127(2):202-209.
Linn, W.S., D.A. Shamoo, C.E. Spier, L.M. Valencia, U.T. Anzar, T.G. Venet, and J.D. Hackney. 1983a. Respiratory effects of 0.75 ppm sulfur dioxide in exercising asthmatics: Influence of upper-respiratory defenses. Environ. Res. 30(2):340-348.
Linn, W.S., T.G. Venet, D.A. Shamoo, L.M. Valencia, U.T. Anzar, C.E. Spier, and J.D. Hackney. 1983b. Respiratory effects of sulfur dioxide in heavily exercising asthmatics: A dose-response study. Am. Rev. Respir. Dis. 127(3):278-283.
Linn, W.S., E.L. Avol., D.A. Shamoo, T.G. Venet, K.R. Anderson, J.D. Whynot, and J.D. Hackney. 1984. Asthmatics’ response to 6-hr sulfur dioxide exposures on two successive days. Arch. Environ. Health 39(4):313-319.
Linn, W.S., D.A. Shamoo, K.R. Anderson, J.D. Whynot, E.L. Avol, and J.D. Hackney. 1985. Effects of heat and humidity on the responses of exercising asthmatics to sulfur dioxide exposure. Am. Rev. Respir. Dis. 131(2):221-225.
Magnussen, H., R. Jorres, H.M. Wagner, and G. von Nieding. 1990. Relationship between the airway response to inhaled sulfur dioxide, isocapnic hyperventilation, and histamine in asthmatic subjects. Int. Arch. Occup. Environ. Health 62(7):485-491.
Meng, Z.Q., and L.Z. Zhang. 1990. Chromosomal aberrations and sister-chromatid exchanges in lymphocytes of workers exposed to sulfur dioxide. Mutat. Res. 241(1):15-20.
MSZW (Ministerie van Sociale Zaken en Werkgelegenheid). 2004. Nationale MAC-lijst 2004: Zwaveldioxide. Den Haag: SDU Uitgevers [online]. Available: http://www.lasrook.net/lasrookNL/maclijst2004.htm [accessed Oct. 24, 2008].
Mukai, F., I. Hawryluk, and R. Shapiro. 1970. The mutagenic specificity of sodium bisulfite. Biochem. Biophys. Res. Commun. 39(5):983-988.
Murray, F.J., B.A. Schwetz, A.A. Crawford, J.W. Henck, J.F. Quast, and R.E. Staples. 1979. Embryotoxicity of inhaled sulfur dioxide and carbon monoxide in mice and rabbits. J. Environ. Sci. Health C 13(3):233-250.
NIOSH (National Institute of Occupational Safety and Health). 1996. Documentation for Immediately Dangerous to Life or Health Concentrations (IDLH): NIOSH Chemical Listing and Documentation of Revised IDLH Values (as of 3/1/95)-Sulfur Dioxide. U.S. Department of Health and Human Services, Centers for Disease Control and Prevention, National Institute of Occupational Safety and Health. August 1996 [online]. Available: http://www.cdc.gov/niosh/idlh/7446095.html [accessed Oct. 16, 2008].
NIOSH (National Institute of Occupational Safety and Health). 2005. NIOSH Pocket Guide to Chemical Hazards: Sulfur Dioxide. U.S. Department of Health and
Human Services, Centers for Disease Control and Prevention, National Institute of Occupational Safety and Health, Cincinnati, OH. September 2005 [online]. Available: http://www.cdc.gov/niosh/npg/npgd0575.html [accessed Oct. 16, 2008].
NRC (National Research Council). 2001. Standing Operating Procedure for Developing Acute Exposure Guideline Levels for Hazardous Chemicals. Washington, DC: National Academy Press.
NRC (National Research Council). 1993. Guidelines for Developing Community Emergency Exposure Levels for Hazardous Substances. Washington, DC: National Academy Press.
NRC (National Research Council). 1984. Sulfur dioxide. Pp. 95-102 in Emergency and Continuous Exposure Limits for Selected Airborne Contaminants, Vol. 2. Washington, DC: National Academy Press.
O’Neil, M.J., A. Smith, P.E. Heckelman, J.R. Obenchain, Jr., J. Gallipeau, and M.A. D’Arecca. 2001. Sulfur dioxide. Pp. 1600 in The Merck Index: An Encyclopedia of Chemicals, Drugs, and Biologicals, 13th Ed. Whitehouse Station, NJ: Merck.
Partti-Pellinen, K., O. Marttila, V. Vilkka, J.J. Jaakkola, P. Jappinen, and T. Haahtela. 1996. The South Karelia air pollution study: Effects of low-level exposure to malodorous sulfur compounds on symptoms. Arch. Environ. Health 51(4):315-320.
Peacock, P.R., and J.B. Spence. 1967. Incidence of lung tumors in LX mice exposed to (1) free radicals; (2) SO2. Br. J. Cancer 21(3):606-618.
Peters, A., D.W. Dockery, J. Heinrich, and H.E. Wichmann. 1997. Short-term effects of particulate air pollution on respiratory morbidity in asthmatic children. Eur. Respir. J. 10(4):872-879.
Petruzzi, S., G. Dell’Omo, M. Fiore, F. Chiarotti, G. Bignami, and E. Alleva. 1996. Behavioural disturbances in adult CD-1 mice and absence of effects on their offspring upon SO2 exposure. Arch. Toxicol. 70(11):757-766.
Rabinovitch, S., N.D. Greyson, W. Weiser, and V. Hoffstein. 1989. Clinical and laboratory features of acute sulfur dioxide inhalation poisoning: Two-year follow-up. Am. Rev. Respir. Dis. 139(2):556-558.
Rahlenbeck, S.I., and H. Kahl. 1996. Air pollution and mortality in East Berlin during the winters of 1981-1989. Int. J. Epidemiol. 25(6):1220-1226.
Rao, M., P. Steiner, Q. Qazi, R. Padre, J.E. Allen, and M. Steiner. 1973. Relationship of air pollution to attack rate of asthma in children. J. Asthma Res. 11(1):23-26.
Rigas, M., A. Ben-Jebria, and J.S. Ultman. 1997. Longitudinal distribution of ozone absorption in the lung: Effects of nitrogen dioxide, sulfur dioxide, and ozone exposures. Arch. Environ. Health 52(3):173-178.
Roger, L.J., H.R. Kehrl, M. Hazucha, and D.H. Horstman. 1985. Bronchoconstriction in asthmatics exposed to sulfur dioxide during repeated exercise. J. Appl. Physiol. 59(3):784-791.
Rondinelli, R.C., J.Q. Koenig, and S.G. Marshall. 1987. The effects of sulfur dioxide on pulmonary function in healthy nonsmoking male subjects aged 55 years and older. Am. Ind. Hyg. Assoc. J. 48(4):299-303.
Rusznak, C., J.L. Devalia, and R.J. Davies. 1996. Airway response of asthmatic subjects to inhaled allergen after exposure to pollutants. Thorax 51(11):1105-1108.
Sandstrom, T., B. Kolmodin-Hedman, N. Stjernberg, M.C. Andersson, and G. Löfvenius. 1988. Challenge test for sulfur dioxide-symptom and lung function measurements. Scand. J. Work Environ. Health 14(Suppl. 1):77-79.
Sandstrom, T., N. Stjernberg, M.C. Andersson, B. Kolmodin-Hedman, R. Lundgren, and T. Angström. 1989a. Is the short-term limit value for sulfur dioxide exposure safe? Effects of controlled chamber exposure investigated with bronchoalveolar lavage. Br. J. Ind. Med. 46(3):200-203.
Sandstrom, T., N. Stjernberg, M.C. Andersson, B. Kolmodin-Hedman, R. Lundgren, L. Rosenhall, and T. Angström. 1989b. Cell response in bronchoalveolar lavage fluid after exposure to sulfur dioxide: A time-response study. Am. Rev. Respir. Dis. 140(6):1828-1831.
Sandstrom, T., N. Stjernberg, M.C. Andersson, B. Kolmodin-Hedman, R. Lundgren, and L. Rosenhall. 1989c. Cell response in bronchoalveolar lavage fluid after sulfur dioxide exposure. Scand. J. Work Environ. Health 15(2):142-146.
Saric, M., M. Fugas, and O. Hrustic. 1981. Effects of urban air pollution on school-age children. Arch. Environ. Health 36(3):101-108.
Savic, M., J. Siriski-Sasic, and D. Djulizibaric. 1987. Discomforts and laboratory findings in workers exposed to sulfur dioxide. Int. Arch. Occup. Environ. Health 59(5):513-518.
Schachter, E.N., T.J. Witek, G.J. Beck, H.B. Hosein, G. Colice, B.P. Leaderer, and W. Cain. 1984. Airway effects of low concentrations of sulfur dioxide: Dose-response characteristics. Arch. Environ. Health 39(1):34-42.
Schwartz, J., D.W. Dockery, L.M. Neas, D. Wypij, J.H. Ware, J.D. Spengler, P. Koutrakis, F.E. Speizer, and B.G. Ferris, Jr. 1994. Acute effects of summer air pollution on respiratory symptom reporting in children. Am. J. Respir. Crit. Care Med. 150(5 Pt.1):1234-1242.
Sheppard, D., J. Epstein, R.A. Bethel, J.A. Nadel, and H.A. Boushey. 1983. Tolerance to sulfur dioxide-induced bronchoconstriction in subjects with asthma. Environ. Res. 30(2):412-419.
Singh, J. 1982. Teratological evaluation of sulphur dioxide. Pp. 144-145 in Enhancement of Quality through Environmental Technology: 28th Annual Technical Meeting, Atlanta, GA, April 21-23, 1982. Mt. Prospect, III: Institute of Environmental Sciences.
Singh, J. 1989. Neonatal development altered by maternal sulfur dioxide exposure. Neurotoxicology 10(3):523-527.
Soyseth, V., J. Kongerud, P. Broen, P. Lilleng, and J. Boe. 1995. Bronchial responsiveness, eosinophilia, and short-term exposure to air pollution. Arch. Dis. Child. 73(5):418-422.
Stacy, R.W., D. House, M. Friedman, M. Hazucha, J. Green, L. Raggio, and L.J. Roger. 1981. Effects of .75 ppm sulfur dioxide on pulmonary function parameters of normal human subjects. Arch. Environ. Health 36(4):172-178.
Stebbings, J.H., and C.G. Hayes. 1976. Panel studies of acute health effects of air pollution: I. Cardiopulmonary symptoms in adults, New York, 1971-1972. Environ. Res. 11(1):89-111.
Summers, G.A., and J.W. Drake. 1971. Bisulfite mutagenesis in bacteriophage T4. Genetics 68(4):603-607.
Swedish Work Environment Authority. 2005. Occupational Exposure Limit Value and Measures against Air Contaminants. AFS 2005:17 [online]. Available: http://www.av.se/dokument/inenglish/legislations/eng0517.pdf [accessed Oct. 21, 2008].
Thompson, J.R., and D.M. Pace. 1962. The effects of sulphur dioxide upon established cell lines cultivated in vitro. Can. J. Biochem. Physiol. 40:207-217.
Touloumi, G., S.J. Pocock, K. Katsouyanni, and D. Trichopoulos. 1994. Short-term effects of air pollution on daily mortality in Athens: A time-series analysis. Int. J. Epidemiol. 23(5):957-967.
ten Berge, W.F., A. Zwart, and L.M. Appelman. 1986. Concentration-time mortality response relationship of irritant and systemically acting vapours and gases. J. Hazard. Mater. 13(3):301-309.
Vedal, S., M.B. Schenker, A. Munoz, J.M. Samet, S. Batterman, and F.E. Speizer. 1987. Daily air pollution effects on children’s respiratory symptoms and peak expiratory flow. Am. J. Public Health 77(6):694-698.
WHO (World Health Organization). 1984. Sulfur dioxide. Pp. 115-150 in Recommended Health-based Occupational Exposure Limits for Respiratory Irritants.
WHO Technical Report Series 707. Geneva: World Health Organization.
Wunderlich, V.P., W. Leupold, W. Mittenzwey, and E. Rupprecht. 1982. Severe lung damage by inhalation of sulfur dioxide [in German]. Deut. Gesundheitswes. 37(11):519-524.
Yadav, J.S., and V.K. Kaushik. 1996. Effect of sulfur dioxide exposure on human chromosomes. Mutat. Res. 359(1):25-29.
APPENDIX A
Time-Scaling Calculations for Sulfur Dioxide
Derivation of AEGL-1
|
Key Study: |
Weight-of -evidence approach suggests 0.20 ppm is NOEL for bronchoconstriction in exercising asthmatics (see table below) |
|
Concentration |
Duration |
Subjects |
Exposure Parameters |
Effect |
Reference |
|
0.2 ppm |
5 min |
8 |
23 °C, 85% RH, exercise 48 L/min |
None |
Linn et al. 1983b |
|
0.25 ppm |
10-40 min |
10 |
23 °C, 70% RH, exercise 35 L/min |
None |
Schacter et al. 1984 |
|
0.25 ppm |
5 min |
19 9 |
23 °C, 36% RH, exercise 60 L/min |
SRaw ↑134% |
Bethel et al. 1985 |
|
|
|
|
23 °C, 36% RH, exercise 80-90 L/min |
SRaw ↑139% |
|
|
0.25 ppm |
75 min |
28 |
26 °C, 70% RH, exercise 42 L/min intermittent |
None |
Roger et al. 1985 |
|
0.4 ppm |
5 min |
23 |
23 °C, 85% RH, exercise 48 L/min |
SRaw ↑69% Vmax25-75 ↑10% |
Linn et al. 1983b |
|
0.5 ppm |
10-40 min |
10 |
23 °C, 70% RH, exercise 35 L/min |
None |
Schacter et al. 1984 |
|
Toxicity end point: |
NOEL for bronchoconstriction in exercising asthmatics |
|
Scaling: |
Data suggest that a major portion of the SO2-induced bronchoconstriction occurs within 10-min and increases minimally or resolves beyond 10-min of exposure. Therefore, AEGL-1 values for SO2 will be held constant across all time points. |
|
Uncertainty factors: |
None: subjects were exercising asthmatics 10-min, 30-min, 1-h, 4-h, and 8-h AEGL-1 = 0.20 ppm |
Derivation of AEGL-2
|
Key study: |
Weight-of -evidence approach suggests 0.75 ppm induces moderate respiratory response in exercising asthmatics for exposure durations of 10-min to 3-h ppm (see table below) |
|
Toxicity end point: |
Moderate, but reversible, respiratory effects in exercising asthmatics |
|
Scaling: |
Data suggest that a major portion of the SO2-induced bronchoconstriction occurs within 10-min and increases minimally or resolves beyond 10-min of exposure. Therefore, AEGL-2 values for SO2 were held constant across all time points. |
|
Uncertainty factors: |
None: subjects were exercising asthmatics 10-min, 30-min, 1-h., 4-h, and 8-h AEGL-2 = 0.75 ppm |
|
0.75 ppm |
10-40 min |
10 |
23 °C, 70% RH, exercise 35 L/min |
SRaw ↑150% FEF ↓22% FEV1 ↓8% |
Schacter et al. 1984 |
|
0.75 ppm |
3 h |
17 |
22 °C, 85% RH, exercise 45 L/min (first 10-min of exposure) |
SRaw ↑: 322% (at 10-min) 233% (at 20-min) 26% (at 1-hr) 5% (at 2-hr) FEV1 : ↓20% (at 15-min) |
Hackney et al. 1984 |
|
1.0 ppm |
10-40 min |
10 |
23 °C, 70% RH, exercise 35 L/min |
SRaw ↑470% FEF ↓27% FEV1 ↓14% |
Schacter et al. 1984 |
|
1.0 ppm |
75 min |
28 |
26 °C, 70% RH, exercise 42 L/min, intermittent |
SRaw ↑300% |
Roger et al. 1985 |
|
1.0 ppm |
30 min |
10 |
26 °C, 70% RH, exercise 41 L/min (3-10 min periods separated by rests of 15 min) |
SRaw ↑172% SRaw ↑137% SRaw 106% |
Kehrl et al. 1987 |
|
1.0 ppm |
30 min |
10 |
26 °C, 70% RH, continuous exercise 41 L/min |
SRaw ↑233% |
Kehrl et al. 1987 |
|
1.0 ppm |
1 min |
8 |
22 °C, 75% RH, exercise 60 L/min |
SRaw ↑93% |
Balmes et al. 1987 |
|
3 min |
|
SRaw ↑395% |
|||
|
5 min |
|
SRaw ↑580% |
|||
|
1.0 ppm |
0.5 min |
12 |
20 °C, 40% RH, exercise 40 L/min |
No SRaw effect |
Horstman et al. 1988 |
|
1.0 min |
|
No SRaw effect |
|||
|
2.0 min |
|
SRaw ↑121% |
|||
|
5.0 min |
|
SRaw ↑307% |
Derivation of AEGL-3
|
Key study: |
Cohen et al. 1973 |
|
BMCL05 in rats exposed for 4 h (573 ppm) |
|
|
Scaling: |
C3 × t = k (573 ppm)3 × 4 h = 752530068 ppm·h |
|
|
C1 × t = k (573 ppm)1 × 4 hr = 2292 ppm·h |
|
Uncertainty factors: |
10 for intraspecies variability 3 for interspecies variability |
|
10-min AEGL-3 |
1-h AEGL-3 value adopted as 10-min value because asthmatic humans are highly sensitive to sulfur dioxide at short time periods |
|
30-min AEGL-3 |
1-h AEGL-3 value adopted as 30-min value because asthmatic humans are highly sensitive to sulfur dioxide at short time periods |
|
1-h AEGL-3 |
C3 × 1 h = 752530068 ppm·h C3 = 752530068 ppm C = 909 1-h AEGL-3 = 909 ppm/30 = 30 ppm |
|
4-h AEGL-3 |
4-h AEGL-3 = 573 ppm/30 = 19 ppm |
|
8-h AEGL-3 |
C1 × 8 hr = 2292 ppm·hr C1 = 287 ppm C = 287 8-h AEGL-3 = 287 ppm/30 = 9.6 ppm |
APPENDIX B
Derivation Summary of AEGLs for Sulfur Dioxide
AEGL-1 VALUES
|
10 min |
30 min |
1 h |
4 h |
8 h |
|
0.20 ppm |
0.20 ppm |
0.20 ppm |
0.20 ppm |
0.20 ppm |
|
Weight-of -evidence approach suggests 0.20 ppm is NOEL for bronchoconstriction in exercising asthmatics |
||||
|
Time Scaling: Data suggest that a major portion of the SO2-induced bronchoconstriction occurs within 10-min and increases minimally or resolves beyond 10-min of exposure. Therefore, AEGL-1 values for SO2 will be held constant across all time points. |
||||
|
Data adequacy: Robust data base of controlled studies in both healthy and asthmatic humans. |
||||
Weight of Evidence for AEGL-1
|
Concentration |
Duration |
Subjects |
Exposure Parameters |
Effect |
Reference |
|
0.2 ppm |
5 min |
8 |
23 °C, 85% RH, exercise 48 L/min |
None |
Linn et al. 1983b |
|
0.25 ppm |
10-40 min |
10 |
23 °C, 70% RH, exercise 35 L/min |
None |
Schacter et al. 1984 |
|
0.25 ppm |
5 min |
19 9 |
23 °C, 36% RH, exercise 60 L/min |
SRaw ↑134% |
Bethel et al. 1985 |
|
|
|
|
23 °C, 36% RH, exercise 80-90 L/min |
SRaw ↑139% |
|
|
0.25 ppm |
75 min |
28 |
26 °C, 70% RH, exercise 42 L/min intermittent |
None |
Roger et al. 1985 |
|
0.4 ppm |
5 min |
23 |
23 °C, 85% RH, exercise 48 L/min |
SRaw ↑69% Vmax25-75 ↓10% |
Linn et al. 1983b |
|
0.5 ppm |
10-40 min |
10 |
23 °C, 70% RH, exercise 35 L/min |
None |
Schacter et al. 1984 |
AEGL-2 VALUES
|
10 min |
30 min |
1 h |
4 h |
8 h |
|
0.75 ppm |
0.75 ppm |
0.75 ppm |
0.75 ppm |
0.75 ppm |
|
Weight-of -evidence approach suggests 0.75 ppm induced moderate bronchoconstriction in exercising asthmatics. |
||||
|
10 min |
30 min |
1 h |
4 h |
8 h |
|
0.75 ppm |
0.75 ppm |
0.75 ppm |
0.75 ppm |
0.75 ppm |
|
Time Scaling: The role of exposure duration to the magnitude of SO2-induced bronchoconstriction in asthmatics appears to decrease with extended exposure. Data suggest that a major portion of the SO2-induced bronchoconstriction occurs within 10-min and increases minimally or resolves beyond 10-min of exposure. Therefore, AEGL-2 values for SO2 were held constant across all time points. |
||||
|
Data adequacy: Robust data base of controlled studies in both healthy and asthmatic humans. |
||||
Weight of Evidence for AEGL-2
|
0.75 ppm |
3 h |
17 |
22 °C, 85% RH, exercise 45 L/min (first 10-min of exposure) |
SRaw ↑: 322% (at 10-min) 233% (at 20-min) 26% (at 1-hr) 5% (at 2-hr) FEV1 : ↓20% (at 15-min) |
Hackney et al. 1984 |
|
0.75 ppm |
10-40 min |
10 |
23 °C, 70% RH, exercise 35 L/min |
SRaw ↑150% FEF ↓22% FEV1 ↓8% |
Schacter et al. 1984 |
|
1.0 ppm |
10-40 min |
10 |
23 °C, 70% RH, exercise 35 L/min |
SRaw ↑470% FEF ↓27% FEV1 ↓14% |
Schacter et al. 1984 |
|
1.0 ppm |
75 min |
28 |
26 °C, 70% RH, exercise 42 L/min, intermittent |
SRaw ↑300% |
Roger et al. 1985 |
|
1.0 ppm |
30 min |
10 |
26 °C, 70% RH, exercise 41 L/min (3- 10 min periods separated by rests of 15 min) |
SRaw ↑172% SRaw ↑137% SRaw 106% |
Kehrl et al. 1987 |
|
1.0 ppm |
30 min |
10 |
26 °C, 70% RH, continuous exercise 41 L/min |
SRaw ↑233% |
Kehrl et al. 1987 |
|
1.0 ppm |
1 min |
8 |
22 °C, 75% RH, exercise 60 L/min |
SRaw ↑93% |
Balmes et al. 1987 |
|
|
3 min |
|
SRaw ↑395% |
||
|
|
5 min |
|
SRaw ↑580% |
||
|
1.0 ppm |
0.5 min |
12 |
20 °C, 40% RH, exercise 40 L/min |
No SRaw effect |
Horstman et al. 1988 |
|
|
1.0 min |
|
No SRaw effect |
||
|
|
2.0 min |
|
SRaw ↑121% |
||
|
|
5.0 min |
|
SRaw ↑307% |
AEGL-3 VALUES
|
10 min |
30 min |
1 h |
4 h |
8 h |
|
30 ppm |
30 ppm |
30 ppm |
19 ppm |
9.6 ppm |
|
Reference: Cohen, H.J., R.T. Drew, J.L. Johnson, and K.V. Rajagopalan. 1973. Molecular basis of the biological function of molybdenum: The relationship between sulfite oxidase and the acute toxicity of bisulfite and SO2. Proc. Natl. Acad. Sci. USA 70(12):3655-3659. |
||||
|
Test Species/Strain/Sex/Number: CD outbred rats/8 males/concentration. |
||||
|
Exposure Route/Concentrations/Durations: Rats/Inhalation: 224, 593, 965, 1168, or 1319 ppm/4 h (BMCL05 of 573 ppm, was determinant for AEGL-3). |
||||
|
End Point/Concentration/Rationale: BMCL05/ 573 ppm/ threshold for death for 4 h exposure in rats. |
||||
|
Effects: Concentration: Mortality |
||||
|
224 ppm |
0/8 |
|
|
|
|
593 ppm |
0/8 |
|
|
|
|
965 ppm |
3/8 |
|
|
|
|
1168 ppm |
5/8 |
|
|
|
|
1319 ppm |
8/8 |
|
|
|
|
Uncertainty Factors/Rationale: Total uncertainty factor: 30 Intraspecies = 10: due to the wide variability in response to SO2 exposure between healthy and asthmatic humans. Interspecies = 3: considered sufficient because no deaths were reported in guinea pigs exposed to 750 ppm SO2 for 1 h (Amdur 1959), in dogs exposed to 400 ppm SO2 for 2 h (Jackson and Eady 1988), or in rats exposed to 593 ppm for 4-h (Cohen et al. 1973). Furthermore, a median lethal exposure time (Lt50) of 200 min was reported for mice exposed to 900 ppm SO2 (Bitron and Aharonson 1978) and three of eight rats died when exposed to 965 ppm for 240 min (Cohen et al. 1973), suggesting limited interspecies variability. |
||||
|
Modifying Factor: Not applicable. |
||||
|
Animal to Human Dosimetric Adjustment: Insufficient data. |
||||
|
Time Scaling: Data are not sufficient to ascertain whether a maximal response to SO2 for a lethal end point is obtained within 10 min. Therefore, time scaling was utilized in the derivation of AEGL-3 values. An n of 3 was applied to extrapolate to the 1-h time period, and n of 1 was used for extrapolation to the 8-h time period to provide AEGL values that would be protective of human health (NRC 2001). The 1-h AEGL-3 value was also adopted as 10-min and 30-min values because asthmatic humans are highly sensitive to sulfur dioxide at short time periods. |
||||
|
Data adequacy: Well-conducted study with appropriate end point for AEGL-3. |
||||