
A13
INFLUENZA (H1N1) PANDEMIC 2009
Osvaldo Uez, Karina Balbuena, Martina Iglesias, María del Carmen Weis, Christian Hertlein, Ana Balanzat, Cora Santandrea, Sebastián Genero, Teresa Varela, Alicia Manana, Claudia Ling, Luis Carlino Ministry of Health, Republic of Argentina
Surveillance of Mortality and Morbidity of Respiratory Disease
The influenza surveillance system in Argentina is composed of Sentinel Units that report influenza-like illness (ILI) by case definition and confirm a representative sample by laboratory; the National Laboratory of respiratory viruses; the disease notification system of influenza type by case definition; and typing and subtyping of influenza strains circulating each year in relation to the vaccine formula, which takes place in the three National Influenza Centers of the World Health Organization (WHO). All systems report to the National Surveillance System and National Health Laboratory Surveillance. As shown in Figure A13-1, surveillance had been in place before the new virus alert was declared.
The first case of 2009-H1N1 influenza A was detected in Puerto Madryn, Argentina in a citizen who had returned from Mexico and developed symptoms on April 25, 2009. Because at that time the primers recommended by the Centers for Disease Control and Prevention (CDC) were not available in Argentina for specific diagnosis, culture isolation and partial sequencing of the virus was done at the Instituto Carlos G. Malbrán. The diagnosis took 10 days with the consequences of the expected spread.
In the first week of May, the director of Epidemiology of Chubut was investigating contacts and their chemoprophylaxis. Argentina’s Ministry of Health sent a rapid response team to conduct an intervention and provide chemoprophylaxis for the schoolmates of the index case’s daughter, who was also symptomatic. After the investigation, it was serologically determined that the virus was circulating in the area and that the treatment and chemoprophylaxis that were completed managed to stop the circulation.
Starting on May 16th, 2009, the first indigenous cases detected in Argentina, which were associated with a school outbreak, originating from a class trip to the United States (Figure A13-1). As shown in Figure A13-2, the virus spread freely from the index case until May 23rd when an intervention was performed with treatment of cases, chemoprophylaxis of contacts, and school closings on May 25th, all of which helped to contain the outbreak (Figure A13-3).
Figure A13-3 illustrates that in a study of close contacts (green columns) of the students, only a few became ill (blue columns). With this relationship, it was
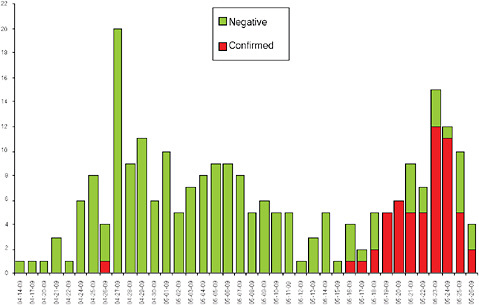
FIGURE A13-1 Cases of 2009-H1N1 influenza A by date of onset of symptoms, April-May 2009, Argentina (n = 250).
SOURCE: Ministry of Health National Surveillance System.
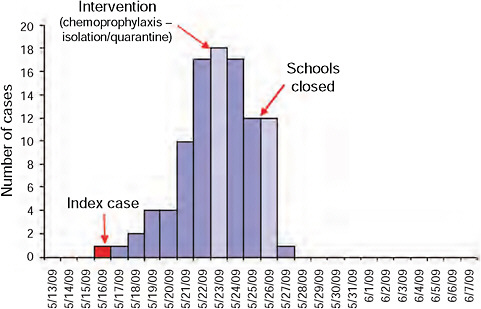
FIGURE A13-2 Distribution of confirmed cases by date of onset of symptoms (n = 99).
SOURCE: Ministry of Health National Surveillance System.
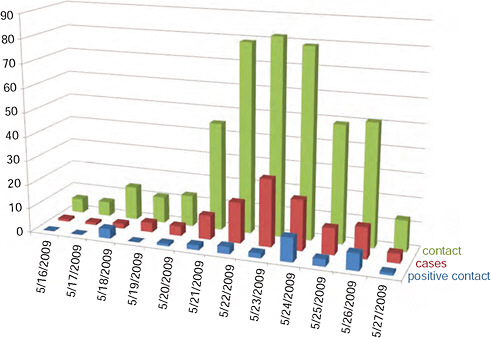
FIGURE A13-3 Temporal presentation of cases and contacts in the school population under study, May 16-31, 2009 (n = 102).
SOURCE: Ministry of Health National Surveillance System.
estimated that the transmission to close contacts at home was 1.1 percent versus 8.7 percent in school. It was also found that the incubation period at school was 48 hours and that dissemination rate was R0 = 2.4.
By that time a large number of schools that had been affected or were highly suspected to be affected were identified, given the high interaction of students in extracurricular programs ranging from academics to sports and social activities (Figure A13-4).
Based on the school data and the estimated population of schools north of Greater Buenos Aires, Ciudad Autónoma de Buenos Aires (CABA), a mathematical model estimated that of 100,000 people, 8,000 cases would appear in 13 days, which would be sufficient for spread through the general population. For this reason, the national health authorities recommended closing schools from June 8th to 19th in the indicated area. Unfortunately, this did not happen because health and education authorities in these jurisdictions did not believe the measure was appropriate.
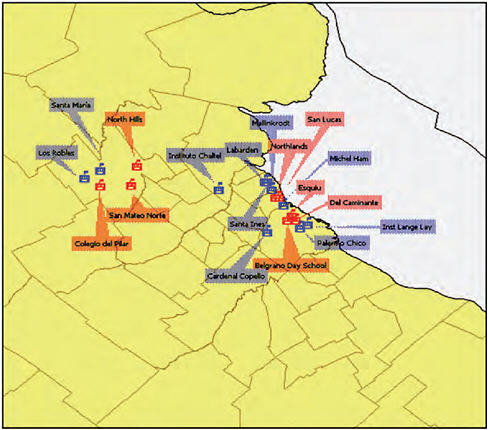
FIGURE A13-4 Affected schools, May 2009 (Red: confirmed case. Blue: clinical case).
SOURCE: Ministry of Health National Surveillance System.
Soon, viral spread in the metropolitan area and CABA became sustained, with serious and fatal cases. Between April and July in the Province of Buenos Aires and CABA (Figure A13-5), the majority of cases at the beginning of the outbreak belonged to the group of schoolchildren 5-15 years old. The recommendation to close schools from June 8th to 19th may have helped to reduce transmission to other age groups, since it would have limited the transmission among the primary spreaders. This measure could also have avoided the high spread to other parts of Argentina. As shown in Figure A13-6, the outbreak in the interior showed the same start for all age groups, with the majority of cases in the 15-44 years old age cohort (Figure A13-6).
The first fatality occurred on June 15th and, 10 days later, 17 more fatalities were reported in the Province of Buenos Aires and 5 in CABA.
The lack of epidemic containment in CABA and the metropolitan area of theProvince of Buenos Aires led to the spread in major cities within the Province of Buenos Aires as well as several provincial capitals, starting with Santa Fe.
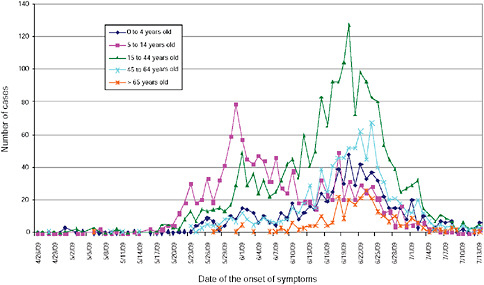
FIGURE A13-5 Distribution of confirmed cases and cases under study by age and date of onset of symptoms, city of Buenos Aires and Province of Buenos Aires, April-July 2009 (n = 5,145).
SOURCE: Ministry of Health National Surveillance System.
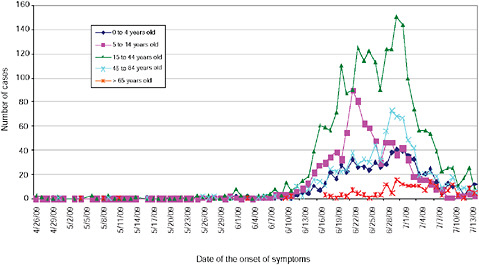
FIGURE A13-6 Distribution of confirmed cases and cases under study by age and date of onset of symptoms, rest of country (except Buenos Aires and Province of Buenos Aires), April-July 2009 (n = 5,030).
SOURCE: Ministry of Health National Surveillance System.
In the last week of June, the virus had spread throughout most of the country (Figure A13-7).
By July 11, 2009, Argentina had 100 fatalities (mostly in patients 20-40 years old) and 3,000 confirmed cases. It was estimated that 2009-H1N1 influenza A cases would be 100,000 by that date. Most cases occured in children and young adults, with fewer cases in adults over 65 years of age, probably because of prior immunity to H1N1 strains that circulated in the 1950s.
The estimated cases up to week 37 were 1,100,000 and an accumulated rate of 275.2 per 10,000; however, at week 37 the rate was 6.1 per 10,000, and
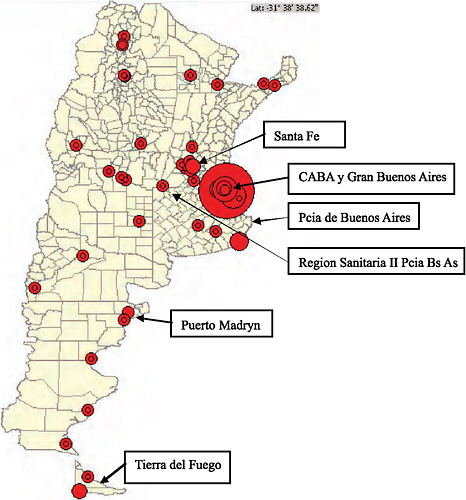
FIGURE A13-7 Distribution of confirmed cases in the country by jurisdiction, Argentina, April-July 2009.
SOURCE: Ministry of Health National Surveillance System.
the maximum rate at week 27 was 36.6 per 10,000. From the epidemic curve in Figure A13-8, we can observe the different actions taken during the epidemic, the curve of confirmed deaths is superimposed to gauge the effect of the measures. At first, treatment was performed in all cases and prophylaxis in all contacts, as was held in Puerto Madryn in the first case by stopping the chain of transmission. The same was done in the school outbreaks, which is the first peak shown in the curve. Had schools been closed as recommended between June 8th to 19th, the virus probably would not have spread as far and there may have been fewer deaths. An increase in deaths resulted because of the lack of early treatment by shifting to mitigation and only treating cases of severe acute respiratory infection (SARI), as discussed below in the description of the deceased. By recommending treatment for pregnant women, risk groups, and those who are ill, the number of deaths seems to have declined. In addition, school closures and vacations in some jurisdictions appears to have diminished number of cases and deaths.
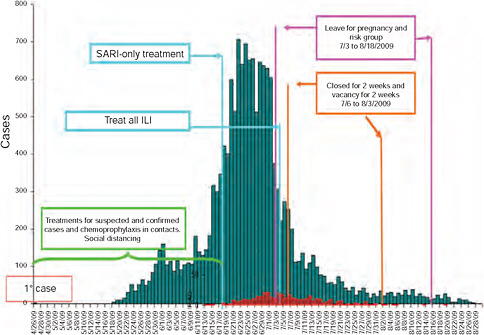
FIGURE A13-8 Confirmed and under study cases of influenza and pandemic influenza (H1N1) 2009 by date of onset of symptoms (n = 15,455), Argentina, April-September 2009.
SOURCE: Ministry of Health National Surveillance System.
Virological Surveillance
The virological diagnosis performed well with the surveillance methods more specific to the 2009-H1N1 influenza A virus. It should be noted that diagnosis was first performed at the Institute Malbran, after which another 18 laboratories were enabled to perform real-time (RT)-PCR, three of which are the National Influenza Center of the WHO, which also performed culture and serology for this virus. The percentage of positivity for the new virus was 43.3 percent (8,851/20,409). In the weekly distribution, the circulation of respiratory syncytial virus (RSV) is seen during the whole period but the peak of diagnosis occurred in weeks 25 and 26 for the new virus (Figure A13-9).
Figure A13-10 illustrates that RSV is dominant for children up to age one; however, the 2009-H1N1 influenza A virus was dominant for all other age groups.
Analysis of Severe Acute Respiratory Infections and Death
The age distribution of cases of SARI showed that the largest group affected were the 0- to 4-year-olds, but we must consider that some of these correspond to cases of RSV observed in the laboratory diagnosis. The hospitalization rate was 23.4 per 100,000 inhabitants (Figure A13-11).
The time distribution for hospitalized patients shows a peak in late June, about a week after the peak of the ILI epidemic curve, and the beginning of severe cases shifted by 15 days for ILI during the period in which cases were given treatment and prophylaxis was given to their contacts. As of early July, the intensity
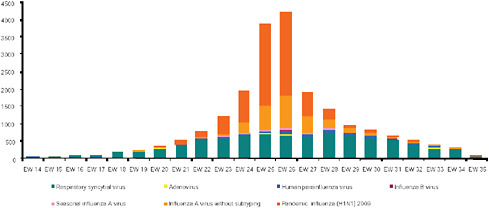
FIGURE A13-9 Distribution of respiratory viruses by epidemiological week, Argentina 2009.
SOURCE: Ministry of Health National Surveillance System.
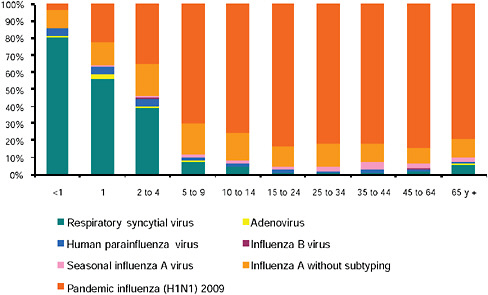
FIGURE A13-10 Distribution of respiratory viruses by age group, Argentina 2009.
SOURCE: Ministry of Health National Surveillance System.
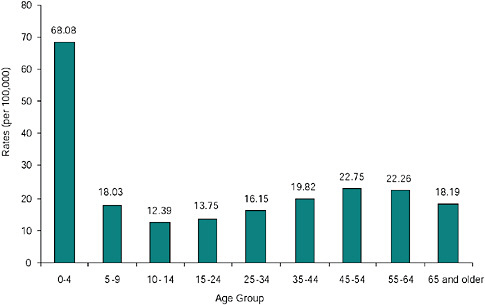
FIGURE A13-11 Distribution of SARI by age group, rates per hundred thousand inhabitants, Argentina 2009 (n = 8,872).
SOURCE: Ministry of Health National Surveillance System.
began to decrease, often coinciding with the new implementation of treatment to all cases of ILI (Figure A13-12).
At week 37 there were 538 confirmed deaths. The age distribution shows that most cases occurred in 40- to 59-year-old adults, but with importance given to the 0- to 9-year-olds for the years of life prematurely lost. However, it is emphasized that only the 20- to 39-year-old group shows female predominance due to the deaths of pregnant women (Figure A13-13). In the distribution of cases and deaths of pregnant women, it is observed that the number of deaths increased when treatment is only for disease mitigation; however, if treatment is implemented for all ILI cases, the number of deaths decreased (Figure A13-14).
Enhanced surveillance was implemented for cases and mortality from infection of the 2009-H1N1 influenza A virus in pregnant women through epidemiological clinical records. A “confirmed case” was defined as a case of acute respiratory illness or positive viral culture via real-time RT-PCR. From May 16, 2009, to July 31, 2009, 15 provinces reported 300 cases of 2009-H1N1 influenza A in pregnant women, 121 of which were confirmed and 85 (70.2 percent) of which were admitted to the hospital.
The incidence rate for 2009-H1N1 influenza A in pregnant women in the study period was 1.72 per 10,000, 1.28 per 10,000 versus the general population at risk (p 0.003). Pregnant women were twice as likely to be hospitalized
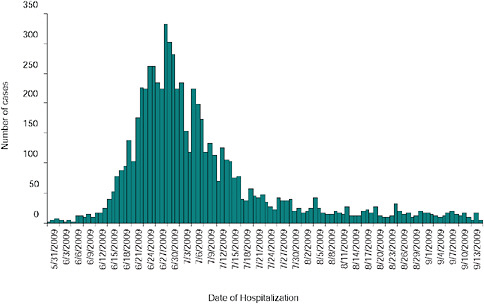
FIGURE A13-12 Distribution of SARI by epidemiological week of onset of symptoms, Argentina 2009 (n = 10,397 EW37).
SOURCE: Ministry of Health National Surveillance System.
FIGURE A13-13 Distribution of confirmed fatalities by age group and sex, rates per hundred thousand inhabitants, Argentina 2009 (n = 505).
SOURCE: Ministry of Health National Surveillance System.
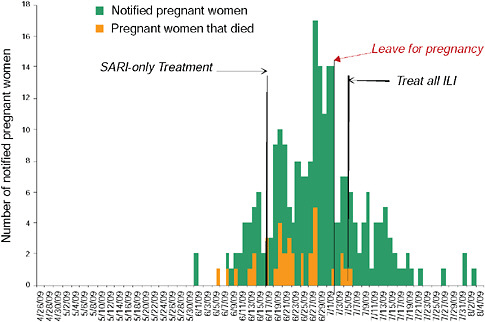
FIGURE A13-14 Number of H1N1 cases among pregnant women, 2009 by day according to date of symptom onset, Argentina 2009 (n = 243).
SOURCE: M inistry of Health National Surveillance System.
than the general population (RR = 1.70, 95 percent CI 1.51-192 p 0.0000). Of the 85 pregnant women hospitalized, 30 deaths were confirmed cases of 2009-H1N1 influenza A, of which 19 developed pneumonia and acute respiratory distress, and 9 required mechanical ventilation in the intensive care unit. The rest of the fatalities were studied by examining medical records following the instrument suggested by WHO and with modifications by PAHO consultants used in Chile. It was applied to 246 deaths in various localities. The underlying conditions predominated in all age groups, ranging from 62 to 93 percent (Figure A13-15).
Figure A13-16 shows the time elapsed between the onset of disease and death, which stands between the date of onset of symptoms and the start of antiviral treatment, which was 6.1 days on average; despite query, the health system treatment implementation was delayed 3.5 days (Figures A13-16 and A13-17). Only 23 percent of deaths showed no underlying conditions. For the age groups and underlying conditions presented, it is shown that the group under 15 years of age predominated neonatal pathology, oncology, immune deficiency, neurological, and congenital conditions. In the 15- to 44-year-old group, obesity, oncology, immune deficiency, and pregnancy predominated. In the 45-year old and over group, metabolic, immune deficiency, and oncology were the most frequent underlying conditions (Table A13-1).
In order to determine the secondary attack rate, a telephone survey was performed, collecting information from1 in 10 confirmed cases (subjects who
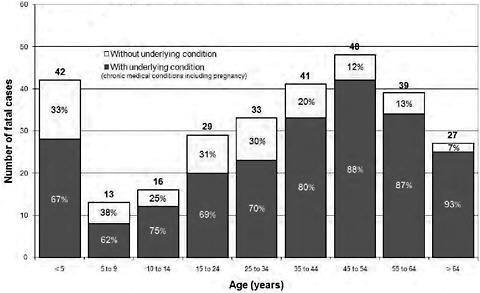
FIGURE A13-15 Fatal cases by underlying conditions and age.
SOURCE: Ministry of Health National Surveillance System.
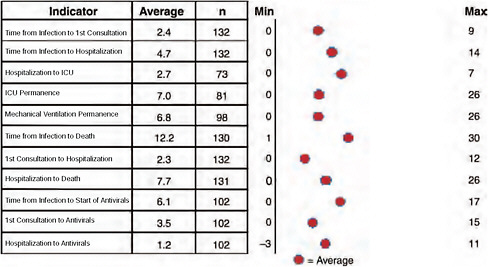
TABLE A13-1 Underlying Conditions Present by Age Group
|
Underlying Condition |
<15 years n = 62 |
15-44 years n = 85 |
>45 n = 88 |
|
Drug addiction |
0 |
8 |
16 |
|
Cardiovascular |
6 |
5 |
19 |
|
Diabetes |
0 |
6 |
19 |
|
Pregnancy |
0 |
12 |
0 |
|
Hematologic |
8 |
9 |
9 |
|
Hepatic |
1 |
4 |
2 |
|
Arterial hypertension |
2 |
7 |
45 |
|
Congenital malformation |
10 |
0 |
0 |
|
Neurological |
12 |
2 |
5 |
|
Obesity |
3 |
21 |
31 |
|
Oncology and immunodeficiencies |
16 |
17 |
24 |
|
Neonatal pathology |
22 |
0 |
0 |
|
Kidney |
5 |
6 |
18 |
|
Respiratory |
8 |
8 |
35 |
|
Genetic syndromes |
12 |
2 |
1 |
|
HIV |
0 |
8 |
1 |
|
SOURCE: Ministry of Health National Surveillance System. |
|||
had access to a telephone), giving 81 cases for the survey. We collected information from 270 of these contacts and found that 32 had symptoms, giving a high rate of 14 percent (32 of 232). We also found that in these households there were 37 clinical cases taken prior to the survey and the prevalence of disease in these households was confirmed at 43 percent (150 of 351). This sampling was conducted when chemoprophylaxis was given partially; the effectiveness of it was determined. Symptoms were found in 17 out of 71 persons with no chemoprophylaxis and in 8 out of 93 that had received chemoprophylaxis. Therefore, the risk of illness is higher in those who did not have chemoprophylaxis (RR = 2.78, 95 percent CI 1.2-6.8; p = 0.006). During the epidemic there were jurisdictions for which the supply of drugs was low for the period when chemoprophylaxis and treatment were performed for severe cases or for all ILI treatment, as in the Health Region II of the Province Buenos Aires. Also, in other jurisdictions, like the Province of Tierra del Fuego, there was not a mitigation step introducing a transition phase in which treatment of all cases continued, but chemoprophylaxis was not given. This strategy showed a considerable difference in the rate of hospitalization and in mortality, as seen in the pyramids of each region (Figures A13-18 and A13-19).
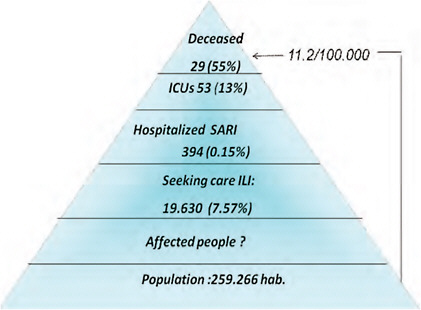
FIGURE A13-18 Descriptive analysis of epidemiological data 2009-H1N1 influenza A pandemic, Health Region II, Province of Buenos Aires, Argentina, May 21 through August 30, 2009 (minimum interventions).
SOURCE: Ministry of Health National Surveillance System.
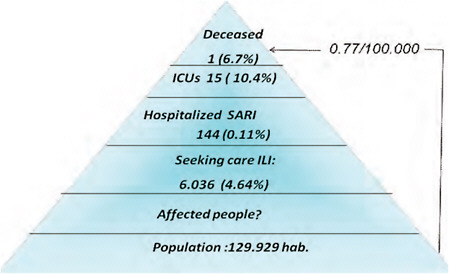
FIGURE A13-19 Descriptive analysis of epidemiological data 2009-H1N1 influenza A pandemic, Tierra del Fuego, Argentina, May 21 through August 30, 2009 (intensive health care and treatment of ILI).
SOURCE: Ministry of Health National Surveillance System.


