
4
Preservation and Physical Property Roles of Sodium in Foods
Historically, the main reason for the addition of salt to food was for preservation. Because of the emergence of refrigeration and other methods of food preservation, the need for salt as a preservative has decreased (He and MacGregor, 2007), but sodium levels, especially in processed foods, remain high. As discussed in Chapter 3, the tastes and flavors associated with historical salt use have come to be expected, and the relatively low cost of enhancing the palatability of processed foods has become a key rationale for the use of salt in food (Van der Veer, 1985). However, taste is not the only reason for the continued use of high levels of sodium in foods. For some foods, sodium still plays a role in reducing the growth of pathogens and organisms that spoil products and reduce their shelf life. In other applications, sodium levels remain high because salt plays additional functional roles, such as improving texture. A number of other sodium-containing compounds are also used for increasing the safety and shelf life of foods or creating physical properties.
This chapter begins with a review of the non-taste or flavor-related roles of salt and other sodium-containing compounds in food. The second part of the chapter briefly discusses the role that sodium plays in various food categories and provides examples of the sodium content of various foods.
FOOD SAFETY AND PRESERVATION
As mentioned previously, the first major addition of sodium to foods was as salt, which acted to prevent spoilage. Prior to refrigeration, salt was
one of the best methods for inhibiting the growth and survival of undesirable microorganisms. Although modern-day advances in food storage and packaging techniques and the speed of transportation have largely diminished this role, salt does remain in widespread use for preventing rapid spoilage (and thus extending product shelf life), creating an inhospitable environment for pathogens, and promoting the growth of desirable microorganisms in various fermented foods and other products. Other sodium-containing compounds with preservative effects are also used in the food supply.
Salt’s Role in the Prevention of Microbial Growth
Salt is effective as a preservative because it reduces the water activity of foods. The water activity of a food is the amount of unbound water available for microbial growth and chemical reactions. Salt’s ability to decrease water activity is thought to be due to the ability of sodium and chloride ions to associate with water molecules (Fennema, 1996; Potter and Hotchkiss, 1995).
Adding salt to foods can also cause microbial cells to undergo osmotic shock, resulting in the loss of water from the cell and thereby causing cell death or retarded growth (Davidson, 2001). It has also been suggested that for some microorganisms, salt may limit oxygen solubility, interfere with cellular enzymes, or force cells to expend energy to exclude sodium ions from the cell, all of which can reduce the rate of growth (Shelef and Seiter, 2005).
Today, few foods are preserved solely by the addition of salt. However, salt remains a commonly used component for creating an environment resistant to spoilage and inhospitable for the survival of pathogenic organisms in foods. Products in the modern food supply are often preserved by multiple hurdles that control microbial growth (Leistner, 2000), increase food safety, and extend product shelf life. Salt, high- or low-temperature processing and storage, pH, redox potential, and other additives are examples of hurdles that can be used for preservation. As shown in Figure 4-1, no single preservation method alone would create a stable product; when combined, however, these methods result in a desirable, stable, and safe product. For example, a food might be protected by a combination of salt, refrigeration, pH, and a chemical preservative.
Multiple-hurdle methods offer the additional benefit of improving other qualities of some foods. For example, hurdle methods can be used to reduce the severity of processing needed, allow for environmentally friendly packaging, improve the nutritional quality of foods (by achieving microbiological safety with less salt, sugar, etc.), and reduce the use of preservatives that are undesirable to some consumers (Leistner and Gould, 2005).
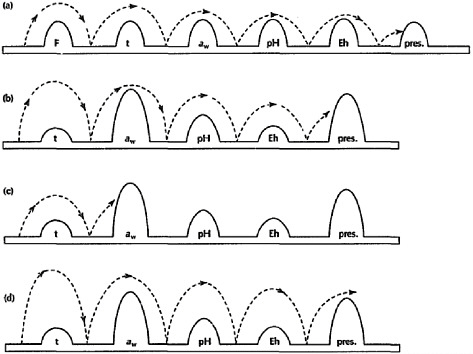
FIGURE 4-1 Examples of the multiple-hurdle method for reducing microbial activity in foods. At the level employed in many foods, individual hurdles may not provide adequate protection from spoilage or pathogenic microorganisms. When multiple hurdles are combined, each hurdle plays a role in reducing microbial activity (displayed as →) until, eventually, the microbial population is so weakened that it cannot cross any further hurdles and the food is protected from spoilage and pathogen survival (letters a, b, and c). If hurdles are insufficient to reduce microbial growth, food products may not be adequately protected (letter d).
NOTE: aw = water activity; Eh = redox potential; F = heating; pH = acidity; pres = preservatives; t = chilling.
SOURCE: Reprinted from Trends in Food Science and Technology, 6(2), Leistner and Gorris, Food preservation by hurdle technology, 41–46, Copyright © 1995, with permission from Elsevier.
Salt’s Role in Fermentation to Preserve Foods
Salt commonly plays a central role in the fermentation of foods. Fermentation is a common process for preserving foods, in which fresh foods are transformed to desirable foods that can be preserved for longer periods of time than their fresh counterparts due to the actions of particular types of microbes (Potter and Hotchkiss, 1995). Products such as pickles, sauerkraut, cheeses, and fermented sausages owe many of their characteristics
to the action of lactic acid bacteria. Salt favors the growth of these more salt-tolerant, beneficial organisms while inhibiting the growth of undesirable spoilage bacteria and fungi naturally present in these foods (Doyle et al., 2001). Salt also helps to draw water and sugars out of plant tissues during fermentation of vegetables. This water aids fermentation by filling any air pockets present in fermentation vats, resulting in reduced oxygen conditions that favor growth of lactic acid bacteria. The release of water and sugars also promotes fermentation reactions in the resulting brine, increasing the rate of the fermentation process (Doyle et al., 2001; Potter and Hotchkiss, 1995).
Role of Other Sodium Compounds
A number of other sodium-containing compounds provide preservative effects in foods. There is a wide variety of these preservatives with various product uses. Preservatives can act to reduce microbial activity and also may, like salt, act as a hurdle to microbial growth and survival. Some additives may also play a role in preserving food quality by reducing undesirable chemical reactions, such as lipid oxidation and enzymatic browning. In some cases, the compounds can have more than one function in a food product, with preservative effects being one of several reasons for use.
A brief listing of common sodium-containing compounds used for food preservation and the foods with which they are associated can be found in Table 4-1.
TABLE 4-1 Common Sodium-Containing Compounds Used for Food Preservation
|
Compound Name |
Food to Which the Compound Is Added |
|
Disodium ethylenediaminetetraacetic acid (EDTA) |
Salad dressing, mayonnaise, canned seafood, fruit fillings |
|
Sodium acetate |
Baked goods, seafood |
|
Sodium ascorbate |
Meat products |
|
Sodium benzoate |
Beverages, fermented vegetables, jams, fruit fillings, salad dressings |
|
Sodium dehydroacetate |
Squash |
|
Sodium diacetate |
Condiments |
|
Sodium erythorbate |
Meat, soft drinks |
|
Sodium lactate |
Meat products |
|
Sodium nitrate |
Cured meats |
|
Sodium nitrite |
Cured meats |
|
Sodium phosphates |
Meat products, cheese, puddings or custards |
|
Sodium propionate |
Cheese, baked goods |
|
Sodium sulfite |
Fruit and vegetable products, seafood |
|
SOURCE: Doyle et al., 2001. |
|
Challenges and Innovations for Lowering Sodium While Maintaining Safety and Shelf Life
For many foods, reducing the sodium content of the product should not create food safety or spoilage concerns. Such foods include frozen products, products that are sufficiently thermally processed to kill pathogenic organisms (e.g., canned foods), acidic foods (pH < 3.8), and foods in which water activity remains low when sodium is removed (e.g., foods with low water activity due to high sugar content) (Reddy and Marth, 1991; Stringer and Pin, 2005). For other foods, reducing sodium content has the potential to increase food spoilage rates and the presence of pathogens. For these foods, product reformulation, changes in processing, and changes in handling may be required to ensure that the product has an adequate shelf life and to prevent pathogen growth. Such efforts do incur additional costs and require careful attention to ensure that new formulations and processes are sufficient to ensure product safety. These issues are discussed further in Chapters 6 and 8.
Foods using sodium as a hurdle to retard microbial growth and survival present a reformulation challenge, since changing the sodium content alters the impact (or height) of the water activity hurdle. Changing this single hurdle may impact the safety and quality of the food because other hurdles that are present (pH, temperature, etc.) may work only in combination with the original sodium level. To maintain a safe, good-quality product, reformulation may have to include the introduction of additional hurdles or an increase in the impact of existing hurdles. If such additional measures are not taken during sodium reduction efforts, the remaining products may not be stable. For example, in cured meats, reducing the sodium content (by removing both salt and sodium nitrite) could allow for rapid growth of lactic acid bacteria and action by proteolytic microorganisms, resulting in a product that spoils more rapidly (Roberts and McClure, 1990; Stringer and Pin, 2005). In some foods, pathogen growth, rather than spoilage, may become a concern.
There is speculation that some past salt reduction efforts may not have adequately accounted for the need to adjust additional hurdles to microbial growth. In the United Kingdom, salt reduction efforts in chilled, ready-to-eat foods were cited as one factor that may have contributed to an increase in the incidence of listeriosis from 2001 to 2005 (Advisory Committee on the Microbiological Safety of Food, 2008). Listeriosis is caused by Listeria monocytogenes, which has a high thermal stability and is able to grow and survive at refrigeration temperatures and elevated salt levels (Zaika and Fanelli, 2003). To decrease the risk of listeriosis, a draft report of the United Kingdom’s Advisory Committee on the Microbiological Safety of Food called on the Food Standards Agency to work closely with food
manufacturers to ensure that the microbial safety of food products would not decrease with changes in formulation to reduce salt (Advisory Committee on the Microbiological Safety of Food, 2008).
There is also evidence suggesting that reductions in salt might result in greater risk of toxin formation by Clostridium botulinum (the organism responsible for botulism) in certain foods if additional hurdles are not incorporated. This is particularly the case for foods that have not been heated sufficiently to inactivate C. botulinum spores and have little oxygen present. Processed cheese (Glass and Doyle, 2005; Karahadian et al., 1985), meat products (Barbut et al., 1986), and sous vide products (products that are prepared in vacuum-sealed plastic pouches and heated at low temperatures for long times1) have been recognized as having potential for C. botulinum control problems when sodium is reduced (Simpson et al., 1995). For example, decreases in salt content from 1.5 to 1.0 percent by weight greatly reduced the time needed for C. botulinum type A and B spores to produce toxins in sous vide spaghetti and meat sauce products when stored at typical refrigeration temperatures. At salt concentrations at or above 1.5 percent, no toxin production was detected from the inoculated products during the 42-day storage period, while at 1.0 percent salt addition, toxins were produced within 21 days (Simpson et al., 1995). Similarly, turkey frankfurters inoculated with C. botulinum and held at 27°C showed more rapid toxin production when salt content was 2.5 percent than when it was 4.0 percent (Barbut et al., 1986).
In addition to C. botulinum and L. monocytogenes, the growth of other foodborne pathogens may be more rapid in foods with reduced contents of salt and other sodium-containing preservatives. These pathogens include Bacillus cereus, Staphylococcus aureus, Yersinia enterocolitica, Aeromonas hydrophila, Clostridium perfringens, and Arcobacter (D’Sa and Harrison, 2005; Reddy and Marth, 1991; Stringer and Pin, 2005).
While the pathogens described above must be taken into account, product developers and researchers have been able to accomplish sodium reductions even in products such as processed cheese and processed meats (Reddy and Marth, 1991). A number of hurdles can be added or increased when sodium is reduced to ensure that a product’s safety is maintained. Examples of additional hurdles are listed in Table 4-2. This list includes a number of emerging technologies (e.g., high-pressure processing, electron beam irradiation) that may have wider applications in the future.
Compounds, such as potassium chloride (Barbut et al., 1986) and mixtures of potassium lactate and sodium diacetate (Devlieghere et al., 2009), that might be used to replace salt and other sodium-containing pre-
|
1 |
Available online: http://amath.colorado.edu/~baldwind/sous-vide.html (accessed October 25, 2009). |
TABLE 4-2 Hurdles That Could Be Added to Counteract Microbial Activity in Sodium-Reduced Foods
|
Chemical |
Physical |
Biological |
|
Organic acids Nitrites Phosphates Fatty acid esters Ingredients with natural antimicrobial properties (e.g., spice extracts, smoke) Potassium chloride |
Additional heating Cooler storage Drying Irradiation (e.g., electron beam) Hydrostatic pressure processing Controlled-atmosphere storage or packaging |
Bacteriocins (e.g., nisin) Protective cultures |
|
SOURCES: Barbut et al., 1986; Doyle et al., 2001; Rybka-Rodgers, 2001. |
||
servatives have been shown to be somewhat effective at retarding growth and toxin production by pathogens. The effectiveness of alternative salts relative to sodium chloride seems to vary based on the pathogen of interest (Barbut et al., 1986).
Partially replacing salt with other compounds, such as potassium chloride and calcium chloride, may also be possible in fermented products (Bautista-Gallego et al., 2008; Reddy and Marth, 1991; Yumani et al., 1999). However, these alternatives may be less effective than salt so higher concentrations may be needed in formulations to achieve the same functionality (Bautista-Gallego et al., 2008).
Some predictive models have been developed that may be promising methods of screening new product formulations for their potential to grow pathogenic microorganisms. A large study conducted by Kraft foods (Legan et al., 2004) modeled the impact of salt on the growth of L. monocytogenes and used this modeling technique to establish no-growth formulations of cured meat products that contain lactate and diacetate to prevent growth of L. monocytogenes.
PHYSICAL PROPERTIES OF FOOD
Salt can play a role in the development of physical properties of foods that are beneficial for processing or developing final product qualities. For example, salt levels play an important role in controlling the stickiness of some doughs, easing the processing of some baked goods (Hutton, 2002; Vetter, 1981). In meats, cheeses, and extruded snack products (e.g., cheese balls, shaped potato snacks), salt can help develop the characteristic texture expected by consumers (Desmond, 2007; Guinee and Fox, 2004; Guinee and O’Kennedy, 2007; Hedrick et al., 1994). For example, in cheeses, salt
acts to remove excess water, creating a firmer texture and, in some cases, a rind (Guinee and Fox, 2004). Salt also contributes to characteristics such as meltability, shredding, stretching, and flow (Reddy and Marth, 1991).
Other sodium-containing compounds are also used to establish physical properties of food products. Some of the more common sodium-containing compounds are used in baked goods (e.g., sodium bicarbonate, also known as baking soda) for leavening and to condition dough for easier processing. For a variety of products, such as sauces and dressings, emulsification and thickening agents may contain sodium. Examples of sodium-containing compounds that impact the physical properties of foods, along with their functions, are provided in Box 4-1.
The practice of enhancing raw poultry, beef, pork (Baublits et al., 2006; Brashear et al., 2002), and seafood products (Rattanasatheirn et al., 2008; Thorarinsdottir et al., 2004) with solutions that contain sodium is also worth noting. Typically, these enhancement solutions include salt and sodium phosphates. One reason for the use of this processing technique is to improve the tenderness (which consumers may perceive as juiciness) of leaner cuts of meat. Such cuts of meat can become tough due to their low fat content, which, in the case of beef and pork, is a result of genetic advances made to produce leaner animals (Detienne and Wicker, 1999). Increasing product yield may be another driver for the use of this technique (Detienne and Wicker, 1999). Clearly, salt and sodium phosphates increase the sodium content of the overall product. For example, a regular serving of meat (114 g, reference amount commonly consumed) without enhancement contains 68 mg of sodium, but that same serving of meat injected up to 10 percent of its weight with brine containing 4.5 percent sodium tripolyphosphate and 3.6 percent salt results in 384 mg sodium per serving (DeWitt, 2007).
Challenges and Innovations for Lowering Sodium While Maintaining Physical Properties
The difficulty of reducing sodium without losing desirable physical properties is dependent on the specific food application and the availability of other ingredients that can fulfill similar functions. In some foods (e.g., certain cheeses and processed meats), the salt used to create special physical properties may be impossible to remove, given current technologies. As previously mentioned in the discussion of challenges to reduce sodium while maintaining food safety, reformulation has a number of costs that are described further in Chapter 6.
Still, for many products, more salt may be added than is truly needed for the desired physical property. In these cases, research to determine critical salt levels may be necessary to quantify the amount of salt that can be
|
BOX 4-1 Common Sodium-Containing Compounds and Their Functions in Food Emulsifying Agents: Sodium pyrophosphate Dioctyl sodium sulfosuccinate Disodium hydrogen phosphate Sodium alginate Sodium caseinate Sodium phosphate Trisodium citrate Trisodium phosphate Sodium stearoyl lactylate Buffering Agents: Aluminum sodium sulfate Disodium hydrogen phosphate Sodium adipate Sodium dihydrogen citrate Sodium dihydrogen phosphate Sodium DL-malate Sodium hydrogen carbonate Sodium phosphate Trisodium citrate Trisodium phosphate Anticaking Agents: Sodium aluminosilicate Sodium ferrocyanide Flavor-Enhancing Agents: Monosodium glutamate Disodium 5′-guanylate Disodium 5′-inosinate Disodium 5′-ribonucleotides Leavening Agents: Sodium bicarbonate Disodium pyrophosphate Sodium acid pyrophosphate Sodium aluminum phosphate Sodium hydrogen carbonate Dough-Conditioning Agents: Sodium stearoyl lactylate Sodium stearyl fumarate Stabilizing Agents: Disodium ethylenediaminetetraacetic acid (EDTA) Disodium pyrophosphate Potassium sodium L-tartrate Sodium alginate Sodium carboxymethylcellulose Sodium caseinate Trisodium citrate Sodium stearoyl lactylate Neutralizing Agents: Trisodium phosphate Sodium sesquicarbonate Sodium phosphate Sodium DL-malate Sodium dihydrogen phosphate Sodium dihydrogen citrate Sodium citrate Sodium adipate Aluminum sodium sulfate Sodium potassium tartrate Sodium acetate Thickening Agents: Sodium alginate Sodium carboxymethylcellulose Moisture-Retaining Agents: Sodium hydrogen DL-malate Sodium lactate Sodium lauryl sulfate Texture-Modifying Agents: Sorbitol sodium Sodium tripolyphosphate Pentasodium triphosphate Disodium hydrogen phosphate Bleaching Agent: Sodium metabisulfite SOURCE: Lewis, 1989. |
removed. For example, attempts to reduce sodium in natural and processed cheese products while maintaining desirable textures and achieving a safe product have been successful using new technologies, such as ultrafiltration (Reddy and Marth, 1991; Van der Veer, 1985). Similarly, in enhanced meat, some brine injection may be desirable to increase the palatability of leaner cuts of meat (Detienne and Wicker, 1999) and help consumers avoid fattier meats that are naturally more tender. However, it is likely that, for many of these products, additional brine is added to further reduce moisture loss (or purge) that normally occurs in the product during its retail shelf life. The benefit that may result from additional brine at that point may be more for economic than sensory reasons, and the brine may not be needed to create acceptable products. In other products, additional salt may be added for enhanced taste and flavor.
Table 4-3 shows the difference in sodium content of similar foods in
TABLE 4-3 Differences in Sodium Content of Similar Foods
which sodium plays a role in creating a physical property or in preservation. The varied sodium levels suggest that the sodium levels in some products may be greater than those needed for these functions. Cases such as these may provide opportunities to lower the sodium content of some foods. A similar conclusion was reached by researchers who surveyed the sodium content of processed foods in Australia and found variation in the salt concentration of comparable foods, frequently ≥ 50 percent between the highest- and lowest-salt foods within a category (Webster et al., 2010). Another survey2 found differences in the salt content of the same brand name foods, including fast food restaurant items, among different countries. Many branded food manufacturers operate internationally and may participate in sodium reduction programs in other countries.
Alternatives that can replace the texture development functions of sodium are limited. However, advances in ingredient technologies have made it possible to replace some salt. Restructured and emulsified items (e.g., sausages, deli meats), for example, are products for which lower-sodium ingredient options have been identified. In these products, functional proteins (e.g., soy or milk), hydrocolloids (e.g., gums or alginates), and starches have replaced some of the functionality of the salt-soluble proteins that form a gel network and “glue” the meat pieces together in higher-salt products (Desmond, 2006). In addition, sodium tripolyphosphate, potassium phosphates, and transglutaminase have been used to improve the stability of reduced-salt emulsified meats in which there may be less salt-soluble protein available to coat and stabilize fat particles (Ruusunen et al., 2002). In their review on sodium reduction, Reddy and Marth (1991) described several studies successfully demonstrating that sodium reduction in meats could result in products evaluated to have acceptable functionality and flavor. In pork, they described a modified processing procedure referred to as emulsion coating that reduced the salt content by 50 percent in chunked and formed ham products. Successful reductions in sodium were also reported for fresh pork sausage, frankfurters, bologna, and comminuted meat batters.
Another method of reducing sodium in foods is to find alternatives to other (non-salt) sodium-containing additives. A number of alternatives have been developed. Table 4-4 provides examples (although not an exhaustive list) of alternatives to sodium-containing compounds that are often used for leavening, dough conditioning, and emulsifying.
Some industries are conducting their own research or funding universities to research alternative processing methods as another strategy to reduce sodium. For example, these approaches include use of pre-rigor mortis muscle in emulsified and restructured meat products (Desmond, 2006)
|
2 |
Available online: http://www.worldactiononsalt.com/media/international_products_survey_2009.xls (accessed February 22, 2010). |
TABLE 4-4 Alternatives to Sodium-Containing Compounds
|
Sodium Compound(s) |
Sodium Alternative(s) |
Comments |
Reference |
|
Leavening Agents: Sodium bicarbonate Sodium acid pyrophosphate Sodium aluminum phosphate Sodium hydrogen carbonate |
Monocalcium phosphate Dicalcium phosphate Potassium bicarbonate |
Gas may be released at a different time than with sodium-based leavening compounds, and processing changes may be needed to accommodate these difference |
Kilcast and Angus, 2007; Reducing sodium, a matter of taste, 2007 |
|
Calcium acid pyrophosphate |
Timing of gas release is closer to that of sodium-based leavening compounds |
Reducing sodium, a matter of taste, 2007 |
|
|
Ammonium bicarbonate |
Has been found to increase the potential for acrylamide formation, creating concern about its use |
European Commission, 2003 |
|
|
Sodium acid pyrophosphate (SAPP) |
Glucono-δ-lactone |
Suitable for use in combination with sodium bicarbonate to reduce use of SAPP in cake-like products |
Reichenbach and Singer, 2008 |
|
Sodium metabisulfite as a dough conditioner |
Cysteine |
Provides similar dough-softening action, but is more costly than sodium metabisulfite |
Cauvain, 2003 |
|
Sodium phosphates as water-binding agents |
Potassium phosphates |
Provides water binding in deli meats and hams similar to that of sodium phosphates |
Ruusenen et al., 2002 |
|
Sodium phosphates and sodium citrates as emulsifying salts |
Potassium citrates, potassium phosphates, calcium phosphates |
Can be used as a replacement in some processed cheese products |
Guinee and O’Kennedy, 2007 |
and the elimination of sodium-containing emulsifying salts in certain processed cheeses (Guinee and O’Kennedy, 2007). These and other changes in processing techniques may have the potential to allow significant sodium reduction, but more research is needed to further develop and implement these technologies.
FUNCTIONS OF SODIUM IN SPECIFIC FOOD CATEGORIES
Since sodium plays different roles in specific food types, it is helpful to discuss the functions of sodium in the context of food categories. This section integrates the role of sodium in preservation and physical properties with its role in taste and flavor (described in Chapter 3) to provide a more complete picture of the multifunctional roles of sodium.
For each of the nine categories described below, data are provided on the average sodium content for representative items from that category (Tables 4-5 to 4-14). These data are derived from the U.S. Food and Drug Administration (FDA) Total Diet Study, which samples approximately 280 foods that are major components of the U.S. diet from four geographic locations around the country. The foods are sampled four times per year and tested for various contaminants and nutrients, including sodium (FDA, 2007). From the Total Diet Study data, both the number of milligrams of sodium per 100 g of food and the number of milligrams of sodium per reference amount customarily consumed (RACC) have been computed (HHS/FDA, 1993).
Grains
Whole grains are naturally low in sodium. Table 4-5 lists the typical sodium content of commonly consumed grains. However, a number of products made from grains have added sodium, and these products are major contributors to sodium intake.
Ready-to-Eat Cereals
Salt is frequently added to breakfast cereals to improve flavor and texture (Brady, 2002). A survey of children’s cereals from around the world found that, on average, these products are about 1 percent salt by weight. When products are reformulated to reduce sugar content, the addition of
salt may be particularly relied upon to maintain the taste of the product (Lobstein et al., 2008).
Rice and Pasta
Rice and most pastas are very low in sodium (Brady, 2002; Van der Veer, 1985); however, salt is often added for flavor during preparation. Many flavored rice and pasta products contain salt in the seasoning, with salt sometimes being used as a bulk carrier to evenly distribute flavorings used in smaller quantities.
Baked Goods
Sodium plays multiple roles in breads and other baked goods. Salt, sodium bicarbonate, and sodium salts of leavening acids are the main sources of sodium in baked goods, accounting for 95 percent of the sodium in these products (Reichenbach and Singer, 2008). In most baked goods, salt is used to improve product taste and flavor. Without salt, many baked goods have an insipid taste (Van der Veer, 1985).
Salt is also responsible for fermentation control and texture in yeast-raised breads. In the mass production of bread, salt levels are used as a tool to control yeast activity. Salt reduces yeast activity by reducing water activity and damaging the membrane of the yeast cells. If too much salt is used, doughs may rise too slowly. However, if too little is added, fermentation may proceed too quickly or “wild” fermentations may occur, resulting in doughs that are gassy and sour with poor texture (Hutton, 2002; Vetter, 1981). Fermentation that occurs too quickly can also create major problems on production lines (Hui, 2007), resulting in poor-quality products or complete loss of large production batches. Table 4-6 lists the sodium content of selected grain products. Salt can also interact with gluten, one of the major proteins in flour responsible for the texture of baked goods, to ease the handling of dough during processing. The result of this interaction reduces the stickiness of the dough (Hutton, 2002; Vetter, 1981).
Quick breads, cakes, and cookies typically rely on chemical leavening agents rather than yeast to quickly create airy textures. Some of the most popular leavening agents contain sodium, including baking soda (sodium bicarbonate) and baking powder (a combination of sodium bicarbonate and one or a combination of the following: potassium hydrogen tartrate, sodium aluminum sulfate, sodium acid pyrophosphate, and calcium acid phosphate) (Bender, 2006).
Other additives used in bread may contribute minor amounts of sodium. One of these additives is sodium stearoyl lactylate, an emulsifier used to improve the volume of breads as well as to maintain the textural
TABLE 4-6 Sodium Content of Grain Products
quality of frozen baked goods. Another sodium-containing additive is sodium metabisulfite. This acts as a dough-softening agent that can increase the extensibility of dough or be used to speed up dough development when high-speed mixing methods are not desirable (e.g., when fruit is incorporated into the dough and would be damaged by high-speed mixing) (Cauvain, 2003).
Salt also helps to control the growth of molds and the Bacillus species of bacteria, thus extending the shelf life of baked goods (Betts et al., 2007). The Bacillus species is capable of forming rope-like structures, off-flavors, and discoloration, especially in baked goods high in sugar or fats (Doyle et al., 2001). However, sugars, not salt, are the primary means of controlling water activity in many baked products; therefore many of the food preservation concerns with bakery products are not dependent on control by salt (Smith et al., 2004).
Muscle Foods
Fresh Meats
Unprocessed cuts of meat have some naturally occurring sodium, but are generally considered low in sodium. However, as described earlier, in recent years, fresh meat products increasingly have been injected with salt-and phosphate-containing brines, increasing the sodium content of fresh products.
Processed Meats
Once meat is further processed into sausages or deli meats, the sodium content increases substantially. Sodium is used in meats not only for the flavor it imparts, but also for its role as a preservative and its impact on the textural qualities of the final product. Similar to fresh meats, salt addition to processed meats can help increase water binding in the muscle tissues, leading to increased yields (more product to sell) and greater tenderness. The mechanism by which salt increases water binding is not fully understood, but it is thought to be related to the ability of salt to create repulsion between myofibrillar proteins (Desmond, 2007). At times, phosphate salts containing sodium are also used to improve water binding of muscle foods and to lengthen the time before products turn rancid (Hedrick et al., 1994).
Salt is also used in the processing of products such as sausages and restructured meats. The presence of salt can solubilize myofibrillar proteins that are insoluble in water alone. Salting, in combination with processing steps such as blending and tumbling, helps to extract these salt-soluble proteins to the surface of the meat. Solubilization of salt-soluble proteins is also important for holding pieces of meat together in batters and restructured meats. In these products, small pieces of meat are often molded and heated to form a log or loaf. Salt-soluble proteins extracted to the surface of the meat pieces are responsible for “gluing” the small pieces of meat together as they form a gel network during heating. In meat products made from batters (bologna, frankfurters, etc.), salt-soluble proteins coat fat particles, thereby keeping the fat and protein components from separating. If fat is not sufficiently emulsified in these types of products, it can melt during thermal processing and rise to form a cap of fat on the top of the product (Hedrick et al., 1994).
In cured meat products, such as hot dogs, smoked meats, bacon, and sausages, sodium can be introduced from three ingredients: salt, sodium nitrite, and the reductants sodium ascorbate and sodium erythorbate. Salt imparts flavor and plays a role in preservation by reducing water activity. The action of salt in reducing water activity is one hurdle against microbial growth in processed meats (Matthews and Strong, 2005). However, current levels of salt alone are too low to provide sufficient protection against spoilage and pathogen growth. Instead, sodium, in combination with other compounds such as sodium nitrite and with environmental conditions such as pH and storage temperature, works synergistically to create safe food products (Doyle et al., 2001; Matthews and Strong, 2005). Sodium nitrite is the ingredient responsible for the characteristic pink color of cured meats and for the preservation of meaty flavor. The color is created by the reaction of nitric oxide (formed from sodium nitrite) with myoglobin to form nitric
oxide myoglobin. Once the meat is heated, this is converted to color-stable nitrosyl hemochromogen due to the denaturation of myoglobin (Hedrick et al., 1994). Sodium nitrite also has the function (in combination with salt) of inhibiting the growth of Clostridium botulinum (Doyle et al., 2001). If sodium nitrite and salt were not used in certain processed meat and seafood products, especially those that are vacuum or modified-atmosphere packaged, these products could no longer be produced or handled because they would pose a risk of botulism outbreaks (Betts et al., 2007; Hedrick et al., 1994; Matthews and Strong, 2005). The final sodium-containing cure ingredients are reductants. Sodium ascorbate and sodium erythorbate are commonly used reductants that play a role in increasing the rate of color formation in cured meats. Both of these compounds can convert nitrite to nitric oxide and convert iron present in myoglobin to the form needed for color formation. Although the reduction of nitrite and myoglobin iron often occurs naturally, reductants can speed up this process (Hedrick et al., 1994). The other essential role of sodium ascorbate or erythorbate is to retard the formation of N-nitrosamines, carcinogenic compounds that can form from residual nitrite especially during high-temperature cooking (Doyle et al., 2001). Table 4-7 lists the sodium content of select muscle foods.
Kosher Meats
Salting also plays a role in the kosher processing for meats. All blood must be removed from the tissues for a meat or poultry product to be considered kosher. To achieve this, meat is soaked and then salted. While the salt is used only on the surface of the meat, some is still able to penetrate, leading to increased salt content (Curtis, 2005).
TABLE 4-7 Sodium Content of Muscle Foods
Dairy Foods
The sodium content of selected dairy foods is listed in Table 4-8.
Milk
Cow’s milk—as a source of essential nutrients for a growing mammal—naturally contains some sodium. Whole, low-fat, and skim milk all contain similar levels of sodium.
Cheese
Sodium in cheese is due to sodium naturally present in milk as well as added salt. While the characteristic salt taste of cheese is popular with consumers, salt also plays roles in the cheese making process that contribute to the texture, shelf life, and safety of the end product.
A function of salt in most cheese production is to draw water or whey out of cheese curds. Cheese curds are formed during the initial stages of cheese production when casein proteins in milk coagulate. The coagulation process also traps other milk components, such as fat, carbohydrates (lactose), minerals, and water. Often, more water is trapped in the curd than is desired in the final product. Commonly, cheese curds will be pressed prior to the ripening process to remove this excess water, but pressing alone is usually insufficient. Addition of salt by brine solution or dry rub is used to remove additional water by osmosis to reach desired moisture levels (Potter and Hotchkiss, 1995; Walstra et al., 1999).
TABLE 4-8 Sodium Content of Dairy Foods
Removal of water from cheese curds helps to reduce the water available for microbial growth, reducing the likelihood of microbial spoilage and pathogen growth. For some types of cheese, salting creates a hard rind that protects the cheese during ripening and transport. In addition, the presence of salt in the resulting moisture-reduced cheese decreases the water activity of the product. Lowering water activity controls the growth of cheese starter cultures, which can influence the pH, texture, and ripening of cheese (Guinee and Fox, 2004).
Texture is also altered by the removal of excess water and by the overall sodium content of the cheese. Cheeses with lower salt content are typically soft, pasty, and adhesive, while those with higher content are harder, drier, and crumblier (Guinee and Fox, 2004). For example, ricotta and Swiss cheese have a lower sodium content than firmer cheeses, such as cheddar and gouda, which in turn have a lower sodium content than hard cheeses, such as parmesan (Van der Veer, 1985). Salt also impacts physical characteristics, such as meltability, shredding, stretching, and flow (Reddy and Marth, 1991). Texture is also altered by the activity of proteolytic enzymes, and the activity of proteolytic enzymes is altered by salt (Guinee and Fox, 2004). Processed cheeses can have additional sodium in the form of sodium phosphates and sodium citrates, which are emulsifying agents important to the formation and final texture of these products (Guinee and O’Kennedy, 2007).
Non-salty tastes are also affected by the presence of salt. Undesirable bitterness in cheese is thought to be related to insufficient salt levels (Guinee and Fox, 2004). In addition, the activity of starter cultures is impacted by salt level and time of addition. Starter cultures are responsible for the production of a number of flavor compounds in addition to acid (Doyle et al., 2001).
Butter
Salt was initially added to butter as a preservative prior to widespread use of refrigeration. Salt still plays a preservation role today, but it is less important because access to refrigeration is possible throughout the supply chain. Instead, taste and flavor development are the main drivers for common levels of salt in butter and margarine (Brady, 2002; Hutton, 2002).
Other Dairy Products
Other dairy products, such as yogurt, ice cream, and puddings, contain sodium naturally, from low levels of sodium-containing additives, such as sodium alginate and carrageenan (both thickening agents) (Goff, 1995; Lal et al., 2006), or from added flavorings.
Sauces, Gravies, Stocks, Salad Dressings, and Condiments
As shown in Table 4-9, sauces, gravies, stocks, salad dressings, and condiments are often high in sodium. Reasons for sodium use include flavor, preservation, and improving the stability of emulsions (by improving the solubility of emulsifiers). Flavor is a main reason for adding salt to these products, and saltiness is often one of the major characteristics of these items (Hutton, 2002).
In most condiments, salt also plays a role in preservation (Brady, 2002), combined with other hurdles to microbial growth. Sodium-containing additives also may be added to salad dressings, sauces, and condiments to act as emulsifiers or preservatives. For soy sauce, which is very high in sodium, salt is needed to influence the fermentation process in its production (Doyle et al., 2001).
Fruits, Vegetables, Beans, and Legumes
Fresh fruits and vegetables are generally very low in sodium, although salt may be added to fresh produce during home or foodservice preparation. Fruits that are processed further typically remain low in sodium (Van der Veer, 1985). Frozen vegetables generally do not have additional sodium unless components such as breadings or sauces are added to the product (Van der Veer, 1985). Dried pulses (beans, lentils, peas) are naturally low in sodium but they are often salted during home and foodservice cooking.
Canned vegetables are typically much higher in sodium than their fresh counterparts. In canning, a liquid medium is important for heat transfer during processing, and a salt brine is generally used because salt enhances the consistency and flavor of vegetables (Hutton, 2002; Van der Veer,
TABLE 4-9 Sodium Content of Sauces, Gravies, Stocks, Salad Dressings, and Condiments
1985). However, salt is not essential for the canning process and no-salt-added canned vegetables are marketed. One study (Jones and Mount, 2009) that tested multiple brands of five types of popular canned beans showed that draining the beans for 2 minutes reduced sodium by 36 percent, and the draining treatment plus 10 seconds of rinsing followed by an additional 2 minutes of draining reduced sodium by 41 percent. According to one survey, draining and rinsing of canned beans is a relatively common food preparation technique (Bush Brothers and Company, 2009). Other studies have shown that treatment involving draining, rinsing, and/or soaking of various canned and packaged foods results in sodium reduction (Sinar and Mason, 1975; Vermeulen et al., 1983; Weaver et al., 1984). The sodium content of selected fruits, vegetables, beans, and legumes is shown in Table 4-10.
Pickled vegetables such as sauerkraut and cucumbers are also high in sodium because of the salt added to drive the fermentation process and to maintain a crisp texture (Brady, 2002).
Mixed Dishes
Combination foods, such as pizza, soups, stews, casseroles, and ready-to-eat meals, are usually high in sodium, as shown in Table 4-11. Sodium in these foods comes from many sources and has multiple functions; when combined into a single serving, the sodium from these varied sources can
TABLE 4-10 Sodium Content of Fruits, Vegetables, Beans, and Legumes
TABLE 4-11 Sodium Content of Mixed Dishes
easily contribute significant levels to the total diet. Pepperoni pizza is a good example of this because each of the major ingredients contains sodium. The pepperoni has sodium for preservation, meat binding, and flavoring. Sodium in the cheese contributes to texture and preservation as well as taste and flavor. Tomato sauce is seasoned with salt in addition to other herbs and spices. Finally, the crust contains sodium to control the leavening process and dough stickiness. The combination of these ingredients leads to an average sodium content of 668 mg/100 g, according to FDA’s Total Diet Study market basket data (FDA, 2007).
Soups are classic examples of complex, high-sodium foods. Some soups have high-sodium ingredients, such as cheese or sausage. However, even foods made from low-sodium ingredients, such as vegetables, are high in sodium due to the use of salt for flavoring. In soups, salt contributes not only to salt taste, but also to overall flavor, as discussed in Chapter 3 (Gillette, 1985; Rosett et al., 1997).
In chilled foods, sodium-containing compounds can play a role in preventing the growth of pathogens. Vacuum and modified-atmosphere packaging can create oxygen-free environments that favor the growth of Clostridium botulinum. Salt, in addition to other hurdles, can help prevent the growth of this organism. If oxygen is present, Listeria monocytogenes is often a concern because it can grow even at low temperatures. Salt addition can serve as one hurdle to the viability of this organism (Hutton, 2002).
Refrigerated or frozen meals often contain sauces or gravies. Besides contributing flavor, these sauces have a secondary role of preventing or masking warmed-over flavors. The fats in precooked meats have a tendency to experience lipid oxidation upon storage, resulting in rancid and “painty” odors and flavors (Hedrick et al., 1994). Using strongly flavored sauces can help to mask these flavors, and coating meats in sauces before storing can help to exclude the oxygen needed for these reactions to take place (Kuntz, 2000). Unfortunately, the sauces are often high in sodium.
Savory Snacks
Most savory snacks, including chips, nuts, pretzels, popcorn, French fries, and extruded snacks (cheese balls, shaped potato snacks, etc.), have added sodium in the form of salt. The function of salt in these foods is to contribute to salt taste and overall flavor. For many flavored snack products, salt is used to distribute minor ingredients, such as flavors and colors. Mixing minor ingredients with salt before application can help to ensure even distribution of these components over the surface of the snack (Matz, 1993). In fried products, antioxidants may also be incorporated in these mixtures to prevent the development of rancidity (Ainsworth and Plunkett, 2007). The sodium content of selected savory snacks is shown in Table 4-12.
Secondary functions of sodium in some extruded products are to modify texture and color. Extruded products have a puffy texture and the degree of expansion and airiness has been found to change with the salt concentration of the extrudate and is thought to be due to interactions between salt and starch (a main component of these snacks). Color has also been found to change with salt content, and this relationship has been proposed to be due to the ability of salt to change the water activity of the extrudate and thus change the rate of browning reactions (Ainsworth and Plunkett, 2007).
Confections
As shown in Table 4-13, hard candies are generally low in sodium, and other confections may have low levels of sodium-containing leavening or texture-modifying agents (Saulo, 2002). Dairy-based confections will contribute to sodium intake due to the sodium naturally present in milk. Chocolates may also contain small amounts of sodium to contribute to flavor and texture. Some confections are likely to contain added salt for flavoring purposes, particularly those with fillings, such as crèmes or jams
TABLE 4-12 Sodium Content of Savory Snacks
TABLE 4-13 Sodium Content of Confections
(Van der Veer, 1985). Other confections that may include salt for flavoring purposes are caramels, taffy, and nut-containing candy.
Beverages
Water is relatively low in sodium, but sodium levels vary by water source and with the use of water-softening systems (Bradshaw and Powell, 2002; Pehrsson et al., 2008). Tea and coffee are also very low in sodium, although the level may increase slightly with the addition of milk and cream.
Sodium-containing preservatives are sometimes added to carbonated beverages and fruit drinks (Doyle et al., 2001). Even though these beverages contain sodium, the levels are generally low compared to those of many other solid food items.
The vegetable juice category of beverages is one in which sodium levels are traditionally quite high. Taste and flavor improvements are the reasons for addition of salt to tomato, carrot, and vegetable blend drinks. The sodium content of selected beverages is shown in Table 4-14.
Salt is often present in sports drinks for the stated purpose of rehydrating the body during or after physical activity, although the medical justification for the sodium contained in these drinks under the conditions consumed (e.g., high school sports activities) is not clearly demonstrated (Jeukendrup et al., 2009; Shirreffs et al., 2007). While no data on the sodium content of sports drinks was available from the Total Diet Study, data from USDA’s National Nutrient Database3 suggest that such drinks contain 100 mg or less per 8 oz. (240 mL) serving. It is reported that the sodium in these products is not added for taste or preservative effects (Man, 2007).
|
3 |
Available online: http://www.nal.usda.gov/fnic/foodcomp/search/ (accessed January 27, 2010). |
TABLE 4-14 Sodium Content of Beverages
REFERENCES
Advisory Committee on the Microbiological Safety of Food (ad hoc Group on Vulnerable Groups). 2008. Increased incidence of listeriosis in the UK (draft report).
Ainsworth, P., and A. Plunkett. 2007. Reducing salt in snack products. In Reducing salt in foods: Practical strategies, edited by D. Kilcast and F. Angus. Cambridge, UK: Woodhead. Pp. 296-315.
Barbut, S., N. Tanaka, and A. J. Maurer. 1986. Effects of varying levels of chloride salts on Clostridium botulinum toxin production in turkey frankfurters. Journal of Food Science 51(5):1129-1131.
Baublits, R. T., F. W. Pohlman, A. H. Brown Jr., E. J. Yancey, and Z. B. Johnson. 2006. Impact of muscle type and sodium chloride concentration on the quality, sensory, and instrumental color characteristics of solution enhanced whole-muscle beef. Meat Science 72(4):704-712.
Bautista-Gallego, J., F. N. Arroyo-Lopez, M. C. Duran-Quintana, and A. Garrido-Fernandez. 2008. Individual effects of sodium, potassium, calcium, and magnesium chloride salts on Lactobacillus pentosus and Saccharomyces cerevisiae growth. Journal of Food Protection 71(7):1412-1421.
Bender, D. A. 2006. Benders’ dictionary of nutrition and food technology. 8th ed. Boca Raton, FL: CRC Press.
Betts, G., L. Everis, and R. Betts. 2007. Microbial issues in reducing salt in food products. In Reducing salt in foods: Practical strategies, edited by D. Kilcast and F. Angus. Cambridge, UK: Woodhead. Pp. 174-200.
Bock, M. A. 1991. Minor constituents of cereals. In Handbook of cereal science and technology, edited by K. J. Lorenz and K. Kulp. New York: Marcel Dekker. P. 576.
Bradshaw, M. H., and G. M. Powell. 2002. Sodium in drinking water. Manhattan, KS: Kansas State University Agricultural Experiment Station and Cooperative Extension Service.
Brady, M. 2002. Sodium: Survey of the usage and functionality of salt as an ingredient in UK manufactured food products. British Food Journal 104(2):84-125.
Brashear, G., M. S. Brewer, D. Meisinger, and F. K. McKeith. 2002. Raw material pH, pump level and pump composition on quality characteristics of pork. Journal of Muscle Foods 13(3):189-204.
Bush Brothers and Company. 2009. Enjoying nutrient-rich canned beans with less sodium (fact sheet). Knoxville, TN: Bush Brothers and Company.
Cauvain, S. P. 2003. Bread making: Improving quality. Boca Raton, FL: CRC Press.
CSPI (Center for Science in the Public Interest). 2008. Salt assault: Brand-name comparisons of processed foods. 2nd ed. Washington, DC: Center for Science in the Public Interest.
Curtis, P. A. 2005. Guide to food laws and regulations. 1st ed. Ames, IA: Wiley-Blackwell.
Davidson, P. M. 2001. Chemical preservatives and natural antimicrobial compounds. In Food microbiology: Fundamentals and frontiers, edited by M. P. Doyle, L. R. Beauchat, and T. J. Montville. Washington, DC: ASM Press.
Desmond, E. 2006. Reducing salt: A challenge for the meat industry. Meat Science 74(1): 188-196.
Desmond, E. 2007. Reducing salt in meat and poultry products. In Reducing salt in foods: Practical strategies, edited by D. Kilcast and F. Angus. Cambridge, UK: Woodhead. Pp. 233-255.
Detienne, N. A., and L. Wicker. 1999. Sodium chloride and tripolyphosphate effects on physical and quality characteristics of injected pork loins. Journal of Food Science 64(6):1042-1047.
Devlieghere, F., L. Vermeiren, E. Bontenbal, P.-P. Lamers, and J. Debevere. 2009. Reducing salt intake from meat products by combined use of lactate and diacetate salts without affecting microbial stability. International Journal of Food Science & Technology 44(2):337-341.
DeWitt, C. A. 2007. Response from the authors re: letter to the editor re: Evaluation of solubilized proteins as an alternative to phosphates for meat enhancement. Journal of Food Science 72(5):x-xii.
Doyle, M. P., L. R. Beuchat, and T. J. Montville, eds. 2001. Food microbiology: Fundamentals and frontiers. 2nd ed. Washington, DC: ASM Press.
D’sa, E. M., and M. A. Harrison. 2005. Effect of pH, NaCl content, and temperature on growth and survival of Arcobacter spp. Journal of Food Protection 68(1):18-25.
European Commission. 2003. Information on ways to lower the levels of acrylamide formed in food. Acrylamide Workshop, October 20–21, 2003.
FDA (Food and Drug Administration). 2007. Total Diet Study statistics on element results: Revision 4.1, market baskets 1991–1993 through 2004–2005. College Park, MD: Food and Drug Administration.
Fennema, O. R. 1996. Food chemistry. 3rd ed. New York: Marcel Dekker.
Gillette, M. 1985. Flavor effects of sodium chloride. Food Technology 39(6):47-52.
Glass, K., and M. E. Doyle. 2005. Safety of processed cheese. FRI Briefings. Madison, WI: Food Research Institute.
Goff, D. 1995. Ice cream ingredients: Dairy science and technology education series, University of Guelph, Canada. http://www.foodsci.uoguelph.ca/dairyedu/icingr.html (accessed 2008).
Guinee, T. P., and P. F. Fox. 2004. Salt in cheese: Physical, chemical and biological aspects. In Cheese: chemistry, physics and microbiology. 3rd ed. 2 vols. Vol. 1, edited by P. F. Fox, P. L. H. McSweeney, T. M. Cogan, and T. P. Guinee. San Diego, CA: Elsevier Academic Press. Pp. 207-259.
Guinee, T. P., and B. T. O’Kennedy. 2007. Reducing salt in cheese and dairy spreads. In Reducing salt in foods: Practical strategies, edited by D. Kilcast and F. Angus. Cambridge, UK: Woodhead. Pp. 316-357.
He, F. J., and G. A. MacGregor. 2007. Dietary salt, high blood pressure and other harmful effects on health. In Reducing salt in foods: Practical strategies, edited by D. Kilcast and F. Angus. Cambridge, UK: Woodhead. Pp. 18-54.
Hedrick, H. B., E. D. Aberle, J. C. Forrest, M. D. Judge, and R. A. Merkel. 1994. Principles of meat science. 3rd ed. Dubuque, IA: Kendall/Hunt.
HHS (U.S. Department of Health and Human Services)/FDA. 1993. Food labeling; Serving sizes; final rule. Federal Register 58(3):2294-2298.
Hui, Y. H., ed. 2007. Food chemistry workbook. 2nd ed. West Sacramento, CA: Science Technology System.
Hutton, T. 2002. Sodium: Technological functions of salt in the manufacturing of food and drink products. British Food Journal 104(2):126-152.
Jeukendrup, A. E., K. Currell, J. Clarke, J. Cole, and A. K. Blannin. 2009. Effect of beverage glucose and sodium content on fluid delivery. Nutrition and Metabolism 6:9.
Jones, J. B., and J. R. Mount. 2009. Sodium reduction in canned bean varieties by draining and rinsing. Presented at the Institute of Food Technologists Annual Meeting, June 6–10, 2009, Anaheim, CA.
Karahadian, C., R. C. Lindsay, L. L. Dillman, and R. H. Deibel. 1985. Evaluation of the potential for botulinal toxigenesis in reduced-sodium processed American cheese foods and spreads. Journal of Food Protection 48(1):63-69.
Kilcast, D., and F. Angus, eds. 2007. Reducing salt in foods: Practical strategies. Cambridge, UK: Woodhead.
Kuntz, L. A. 2000. Fighting warmed-over flavor. Food Product Design, http://www.foodproductdesign.com/articles/1100ffocus.html (accessed November 10, 2008).
Lal, S. N. D., C. J. O’Connor, and L. Eyres. 2006. Application of emulsifiers/stabilizers in dairy products of high rheology. Advances in Colloid and Interface Science 123-126(special issue):433-437.
Legan, J. D., D. L. Seman, A. L. Milkowski, J. A. Hirschey, and M. H. Vandeven. 2004. Modeling the growth boundary of Listeria monocytogenes in ready-to-eat cooked meat products as a function of the product salt, moisture, potassium lactate, and sodium diacetate concentrations. Journal of Food Protection 67(10):2195-2204.
Leistner, L. 2000. Basic aspects of food preservation by hurdle technology. International Journal of Food Microbiology 55(1-3):181-186.
Leistner, L., and L. G. Gorris. 1995. Food preservation by hurdle technology. Trends in Food Science and Technology 6(2):41-46.
Leistner, L., and J. W. Gould. 2005. Update on hurdle technology approaches to food preservation. In Antimocrobials in food. 3rd ed., edited by P. M. Davidson, J. N. Sofos, and B. A. Larry. Boca Raton, FL: Taylor and Francis. Pp. 621-631.
Lewis, R. J., Sr. 1989. Food additives handbook. New York: Van Nostrand Reinhold.
Lobstein, T., J. Macmullan, T. McGrath, and J. Witt. 2008. Cereal offences: A wake-up call on the marketing of unhealthy food to children. Junk Food Generation. London: Consumers International.
Man, C. M. 2007. Technological functions of salt in food products. In Reducing salt in foods: Practical strategies, edited by D. Kilcast and F. Angus. Cambridge, UK: Woodhead. Pp. 157-173.
Matthews, K., and M. Strong. 2005. Salt: Its role in meat products and the industry’s action plan to reduce it. Nutrition Bulletin 30(1):55-61.
Matz, S. A. 1993. Snack food technology. 3rd ed. New York: Van Nostrand Reinhold.
Pehrsson, P., K. Patterson, and C. Perry. 2008. The mineral content of U.S. drinking and municipal water. Paper presented at 32nd National Nutrient Databank Conference, May 12–14, Ottawa, Ontario, Canada.
Potter, N. N., and J. H. Hotchkiss. 1995. Food science. 5th ed., Food science texts series. New York: Chapman & Hall.
Rattanasatheirn, N., S. Benjakul, W. Visessanguan, and K. Kijroongrojana. 2008. Properties, translucence, and microstructure of Pacific white shrimp treated with mixed phosphates as affected by freshness and deveining. Journal of Food Science 73(1).
Reddy, K. A., and E. H. Marth. 1991. Reducing the sodium content of foods: A review. Journal of Food Protection 54(2):138-150.
Reducing sodium, a matter of taste. 2007. Prepared Foods (January 1), 1-6.
Reichenbach, K., and R. Singer. 2008. Jungbunzlauer is rising to the task of supplying natural leavening agents. Food Manufacture—Food Ingredients, Health and Nutrition Supplement, September 23, 2008.
Roberts, T. A., and P. J. McClure. 1990. Food preservatives and the microbiological consequences of their reduction or omission. Proceedings of the Nutrition Society 49:1-12.
Rosett, T. R., T. Hamill, K. Morris, and B. P. Klein. 1997. Taste qualities of reduced-sodium soups as affected by serving temperature. Journal of Food Science 62(2):421-424.
Ruusunen, M., M. Niemisto, and E. Puolanne. 2002. Sodium reduction in cooked meat products by using commercial potassium phosphate mixtures. Agricultural and Food Science in Finland 11(3):199-207.
Rybka-Rodgers, S. 2001. Improvement of food safety design of cook-chill foods. Food Research International 34(5):449-455.
Saulo, A. A. 2002. Common food additives in candy. Food Safety and Technology Food Safety and Technology Report No. 9. Honolulu, HI: Cooperative Extension Service, College of Tropical Agriculture and Human Resources, University of Hawaii at Manoa.
Shelef, L. A., and J. Seiter. 2005. Indirect and miscellaneous antimicrobials. In Antimocrobials in food. 3rd ed., edited by P. M. Davidson, J. N. Sofos, and B. A. Larry. Boca Raton, FL: Taylor and Francis. Pp. 573-598.
Shirreffs, S. M., D. J. Casa, and R. Carter III. 2007. Fluid needs for training and competition in athletics. Journal of Sports Sciences 25(Supplement 1):83-91.
Simpson, M. V., J. P. Smith, K. Dodds, H. S. Ramaswamy, B. Blanchfield, and B. K. Simpson. 1995. Challenge studies with Clostridium botulinum in a sous-vide spaghetti and meat-sauce product. Journal of Food Protection 58(3):229-234.
Sinar, L. J., and M. Mason. 1975. Sodium in four canned vegetables. Journal of the American Dietetic Association 66(2):155-157.
Smith, J. P., D. P. Daifas, W. El-Khoury, J. Koukoutsis, and A. El-Khoury. 2004. Shelf life and safety concerns of bakery products: A review. Critical Reviews in Food Science and Nutrition 44(1):19-55.
Stringer, S. C., and C. Pin. 2005. Microbial risks associated with salt reduction in certain foods and alternative options for preservation: Technical report. Norwich, UK: Institute of Food Research.
Thorarinsdottir, K. A., G. Gudmundsdottir, S. Arason, G. Thorkelsson, and K. Kristbergsson. 2004. Effects of added salt, phosphates, and proteins on the chemical and physicochemical charactersitics of frozen cod (Gadus morhua) fillets. Journal of Food Science 69(4).
Van der Veer, O. 1985. The human intake of salt and the development of low-sodium and no-salt-added processed foods and salt substitutes; A review of literature. Wageningen, Netherlands: University of Agriculture, Department of Human Nutrition.
Vermeulen, R. T., F. A. Sedor, and S. Y. S. Kimm. 1983. Effect of water rinsing on sodium content of selected foods. Journal of the American Dietetic Association 82(4):394-396.
Vetter, J. L. 1981. Technology of sodium in bakery products. Cereal Food World 6:64-66.
Walstra, P., T. J. Geurts, A. Noomen, A. Jellema, and M. A. J. S. van Boekel. 1999. Dairy technology: Principles of milk properties and processes. Food Science and Technology. New York: Marcel Dekker.
Weaver, C. M., C. Y. Troyer, and S. Pinter. 1984. Removal of electrolytes from institutionally packaged foods. Journal of the American Dietetic Association 84(3):319-322.
Webster, J. L., E. K. Dunford, and B. C. Neal. 2010. A systematic survey of the sodium contents of processed foods. American Journal of Clinical Nutrition 91(2):413-420.
Yumani, M. I., F. G. A. Hammouth, M. A. Humeid, and R. K. Robinson. 1999. Production of fermented cucumbers and turnips with reduced levels of sodium chloride. Tropical Science 39:233-237.
Zaika, L. L., and J. S. Fanelli. 2003. Growth kinetics and cell morphology of Listeria monocytogenes Scott A as affected by temperature, NaCl, and EDTA. Journal of Food Protection 66(7):1208-1215.


