
5
Sodium Intake Estimates for 2003–2006 and Description of Dietary Sources
There is no question that Americans exceed the recommended levels of sodium intake by significant amounts. High intake levels are evident regardless of life stage, gender, race/ethnicity, and income. Further, estimated intake has trended upward when compared to the first National Health and Nutrition Examination Survey (NHANES) conducted in 1971–1974.
Very little sodium occurs naturally in foods, and the majority of sodium in the U.S. diet is from sodium added during food processing and by restaurants and other foodservice operations such as cafeterias and catering services. Salt is the greatest contributor of sodium to the diet, but data are inadequate to quantify with any certainty the proportions attributable to sodium chloride (i.e., salt) compared to other dietary sources of sodium such as sodium bicarbonate, sodium benzoate, and sodium ascorbate.
The 2005 Dietary Guidelines for Americans recommends that persons 2 or more years of age consume less than 2,300 mg of sodium per day (USDA/HHS, 2005). These recommendations further specify that many persons will benefit from further reductions in salt intake, including people with hypertension, African Americans, and middle- and older-aged adults (DGAC, 2005). The Centers for Disease Control and Prevention (CDC) recently reported that these special at-risk persons now constitute approximately 69 percent of the U.S. adult population (CDC, 2009).
The Institute of Medicine (IOM) established reference values for so-
dium for the first time in 2005 (IOM, 2005). An Adequate Intake1 (AI) was established by the IOM ranging from 1,000 to 1,500 mg for persons 2 or more years of age depending on age, and is a value that reflects the recommended average daily intake level based on observed or experimentally determined approximations or estimates of nutrient intake.2 The IOM also established a Tolerable Upper Level of Intake3 (UL) for sodium ranging from 1,500 to 2,300 mg depending upon age, which is the highest daily intake level that is likely to pose no risk of adverse health effects to almost all individuals in the general population (IOM, 2005).
In setting the stage for the committee’s deliberations, Chapter 2 provides an overview of existing information about sodium intake in relation to evaluating the effectiveness of the major national public health initiatives. This chapter presents the results of analyses4 conducted for the committee’s study using data from NHANES,5 a large nationally representative survey conducted by CDC. Specifically, data from the 2003–2006 NHANES period were analyzed in order to specify current sodium intake. These dietary intake data are collected in the component of the NHANES known as What We Eat in America, but for the purposes of simplicity this chapter refers to them as NHANES data. The 2003–2006 NHANES data were also used to characterize current contributions to the diet based on food categories and to examine contributions to intake made by foods “from home” versus those “away from home.” Issues of monitoring and surveillance of intake and related factors are also considered.
Background information on the NHANES and the methodologies used
|
1 |
Adequate Intake: IOM reference value: the recommended average daily intake level based on observed or experimentally determined approximations of estimates of nutrient intake by a group (or groups) of apparently healthy people that are assumed to be adequate (IOM, 2006). |
|
2 |
The AI of 1,500 mg for adults 19 through 50 years of age was derived based on the following rationale: a diet that provides an average of 1,500 mg/day of sodium can meet recommended intakes of other nutrients; this level exceeds the levels of sodium intake that have been associated with adverse effects on blood lipid concentrations and insulin resistance, and this level allows for excess sodium loss in sweat by unacclimitized persons who are exposed to high temperatures or who are moderately physically active (IOM, 2005). The AIs for children and adolescents 1–18 years of age (1,000 mg/day for 1–3 years of age; 1,200 mg/day for 4–8 years of age; and 1,500 mg/day for 9–18 years of age) were extrapolated down from the AI for adults using the average of median energy intake levels of the age groups for adults and for children as the basis for extrapolation. The AI for adults 51 years and older (1,300 mg/day for 51–70 years of age and 1,200 mg/day for > 70 years of age) was extrapolated from younger individuals based on energy intake (IOM, 2005). |
|
3 |
Tolerable Upper Intake Level: IOM reference value: the highest average daily nutrient intake level that is likely to pose no risk of adverse health effects to almost all individuals in the general population. As intake increases above the UL, the potential risk of adverse effects may increase. |
|
4 |
Analytical support provided by Mathematica Policy Research, Washington, DC. |
|
5 |
Available online: http://www.cdc.gov/nchs/nhanes.htm (accessed November 17, 2009). |
to analyze data for this study are described in Appendix E. Information from the analyses is summarized below, and more detailed data tables can be found in Appendix F.
ESTIMATING SODIUM INTAKE
Although data based on the “disappearance” of sodium in the food supply, as described in Chapter 2, can provide some information, two general methods of assessing the population’s intake of sodium are considered to provide reasonably accurate estimates: (1) dietary self-reports (interviews, food records, diaries, food frequency questionnaires of individuals) and (2) urinary sodium measures of individuals.
The more accurate and reliable method of estimating sodium intake is the analysis of urine collected during a 24-hour period, which reflects about 90 percent or more of the ingested sodium (Clark and Mossholder, 1986; Luft et al., 1982; McCullough et al., 1991; Schachter et al., 1980). However, such measures are not currently included in national surveys carried out in the United States. Therefore, available information on the U.S. population’s sodium intake is based currently on national survey data derived from self-reported dietary intake of respondents. These large-scale national surveys provide representative estimates for the total population and large race/ethnic subgroups. However, NHANES data sets from 2003–2004 and 2005–2006 were combined for this study to provide larger sample sizes for subgroup analysis (see Appendix F). Clinical trials and smaller-scale studies can also provide dietary information for subgroups or special populations that cannot be gleaned from national surveys, but these cannot be relied upon to be representative.
For population-level or group intake estimates, multiple 24-hour dietary recalls are the preferred method (IOM, 2000). Other methods are feasible, but require greater respondent effort and may alter behavior (e.g., food records and diaries) or overestimate food and energy intake (e.g., food frequency questionnaires) (Thompson and Subar, 2008). The strengths of the 24-hour dietary recall include the use of a standardized protocol to quantify the types and amounts of foods consumed over the course of a day, reduced respondent burden, and the provision of valid dietary intake estimates for groups and usual nutrient intake if two or more 24-hour recalls are collected for at least a subsample of the group. Also, individual intake data permit calculation of intake distributions for groups so that the prevalence of high and low intake can be estimated. Additionally, they reflect the sodium content of foods as consumed.
The major limitation of any dietary intake method is that there is some degree of misreporting and measurement error (Thompson and Subar, 2008). For example, overweight persons may underreport intake, omitting certain foods or reducing the reported amounts; furthermore, parents may
overreport their young children’s intake and be unable to estimate amounts accurately (Basch et al., 1990; Briefel et al., 1997; Devaney et al., 2004). Twenty-four hour recalls are also labor intensive to collect, and at least two non-consecutive days of data are needed to estimate usual intake.
Over the years, improvements in methodologies have been made as part of the National Nutrition Monitoring and Related Research Program (Woteki, 2003), and the quality and validity of data from 24-hour recalls have been improved. Efforts have focused on training dietary interviewers to use standardized probes to elicit complete and accurate reports of intake, using appropriate measurement aids to help respondents report amounts, and developing statistical adjustments to allow better estimation of usual intake (Dwyer et al., 2003). Nonetheless, the intake estimates for sodium derived from NHANES are likely to underestimate the population’s true total intake. However, despite the inherent measurement errors in dietary data collection and the underestimation of true total intake of sodium by the population, these measures provide useful and relevant information.
CURRENT SODIUM INTAKE OF THE U.S. POPULATION
For the purposes of this study, intake data from the NHANES covering 2003–2006 (i.e., combination of the 2003–2004 and 2005–2006 surveys) were used and designated as “current.” For analyses related to quantitative sodium intake, estimates are provided as usual intake (see Appendix E); analyses related to food categories as well as non-food contributions to the diet are reported as 1-day means, as is sodium intake from earlier NHANES.
As shown in Table 5-1, sources of dietary sodium include foods, salt added at the table, tap water, and dietary supplements. The sodium content of foods reflects salt added in cooking and food preparation. Methodologies for estimating table salt, tap water, and dietary supplements are described in Appendix E. Information on the contribution from medications was not available for the committee’s analysis. Drugs including anti-inflammatories, antacids, and laxatives can contribute to sodium intake.6 For example, sodium bicarbonate is often used to alleviate heartburn and acid indigestion.7,8 Although individuals with certain health conditions and their physicians may need to be concerned about the sodium content of some
|
6 |
Available online: http://www.megaheart.com/pdf/sodiuminmedications.pdf (accessed June 3, 2009). |
|
7 |
Available online: http://www.medicinenet.com/sodium_bicarbonate-oral/article.htm (accessed November 11, 2009). |
|
8 |
For example, commercial antacid tablets have 10 mg of sodium per two tablets (ingredient is sodium polyphosphate), according to the 2008 Nutrition Dietary System for Research database. |
TABLE 5-1 Mean 1-Day Sodium Intake from All Dietary Sources for Persons 2 or More Years of Age
|
|
Dietary Source (mg/d) |
Total All Sources |
SE |
|||||||
|
Fooda |
SE |
Table Saltb |
SE |
Tap Water |
SE |
Supplements |
SE |
|||
|
All ages 2+ years |
3,407 |
13.8 |
178 |
1.4 |
27 |
0.3 |
2 |
0.2 |
3,614 |
14.1 |
|
Children |
|
|
|
|
|
|
|
|
|
|
|
2–5 years |
2,388 |
26.4 |
33 |
1.5 |
9 |
0.3 |
1 |
0.1 |
2,432 |
26.6 |
|
6–18 yearsc |
3,371 |
23.5 |
89 |
1.1 |
19 |
0.4 |
1 |
0.2 |
3,481 |
23.7 |
|
Adults |
|
|
|
|
|
|
|
|
|
|
|
Men, 19+ years |
4,122 |
29.8 |
226 |
3.0 |
30 |
0.6 |
2 |
0.6 |
4,380 |
30.2 |
|
Women, 19+ yearsc |
2,874 |
21.0 |
197 |
2.9 |
30 |
0.6 |
2 |
0.2 |
3,103 |
21.5 |
|
Total adults, 19+ yearsc |
3,491 |
19.4 |
211 |
2.1 |
30 |
0.4 |
2 |
0.3 |
3,734 |
19.8 |
|
NOTES: Sodium intake from food is reported as a 1-day mean rather than usual intake to be consistent with reporting method for other dietary sources; d = day; mg = milligram; SE = standard error. aIncludes salt added in cooking and food preparation. bSalt added by the consumer at the table. cExcludes pregnant and lactating women; data for these persons are shown in Appendix F, Table F-1. SOURCE: NHANES 2003–2006. |
||||||||||
medicines (Szarfman et al., 1995; Ubeda et al., 2009), on a population level, medications overall contribute small amounts of sodium.
The mean 1-day intake from all sources combined for persons 2 or more years of age during the 2003–2006 period is 3,614 mg/d, as shown in Table 5-1. The Dietary Guidelines for Americans recommends < 2,300 mg/d for this age group. Although recent data from 2009 are not available, indirect measures of estimating sodium intake (including trends in caloric intake, rates of obesity, observational studies, and the lack of consumer education) provide no indication that there is a decline in sodium intake since the 2003–2006 NHANES.
Usual mean total sodium intake from all dietary sources (foods, table salt, tap water, dietary supplements9) increases with age from 2–3 years
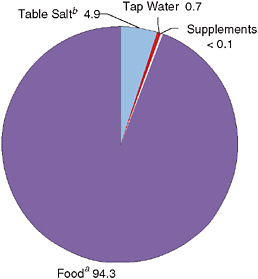
FIGURE 5-1 Percentage contribution of dietary sources to total intake of sodium for persons 2 or more years of age.
NOTES: Mean intake, 1 day, weighted 24-hour dietary recall data (n = 16,822); sodium intake from food is reported as a 1-day mean rather than usual intake to be consistent with the data available for other dietary sources.
aIncludes salt added in cooking and food preparation.
bSalt added by the consumer at the table.
SOURCE: NHANES 2003–2006.
through childhood and early adulthood, peaks at age 19–30 years, and then declines (Appendix F, Table F-1). On average, other dietary sources beyond foods provide an additional 207 mg/d of sodium, resulting in a mean total sodium intake of 3,614 mg for the population ages 2 years and older. More detailed information on mean intake and percentile distribution for usual intake is presented in Appendix F, Tables F-1 and F-2, respectively.
Additional analyses reveal that the proportion of the population meeting the 2005 Dietary Guidelines for Americans recommendation of < 2,300 mg/d for sodium is only 10 percent (standard error [SE] = 0.5 percent); when only food sources are considered, 15 percent (SE = 0.6 percent) of the U.S. population ages 2 years and older meets the recommendation. Older women (71 years and older) are the most likely to meet the recommendation, but still only 36 percent (SE = 3 percent) consume < 2,300 mg/d.
Foods contribute the vast majority of dietary sodium, estimated at 3,407 mg/d for persons 2 or more years of age for 2003–2006 (Appendix F, Table F-1). As shown in Figure 5-1, sources other than food contribute less than 6 percent of dietary sodium. For this reason, intake from food is discussed first.
Intake from Foods
By Age
Usual mean daily sodium intake estimates from foods are about 2,200 mg at ages 2–3 years, peak at about 3,800 mg at ages 19–30 years, and decline slowly to about 2,600 mg above age 70 (see Figure 5-2 and Appendix F, Table F-5). Significant numbers within all age groups exceed the UL. Appendix F, Table F-3 contains more detailed information on usual intake percentile distributions for Dietary Reference Intake (DRI) age and gender subgroups.
Median intake was compared to usual mean intake and found to be slightly lower, an average of 50–150 mg lower per day, but median intake tracks closely with mean intake (see Table 5-2 and Figure 5-2). More details on median values can be found in Appendix F, Table F-3.
Usual mean sodium intake from foods exceeds the AI for all age groups, shown for children and adults in Figures 5-3 and 5-4, respectively. This indicates that there are no concerns about inadequate sodium intake in the U.S. population.
Indeed, about 88 percent of Americans ages 2 years and older have excessive sodium intake from foods, that is, intake above the UL. As shown in Figure 5-5, sodium intake for a vast majority of people in all age groups exceeds the UL. Persons over 70 years are the largest percentage with intake below the UL; about one-third have usual sodium intake below the UL.
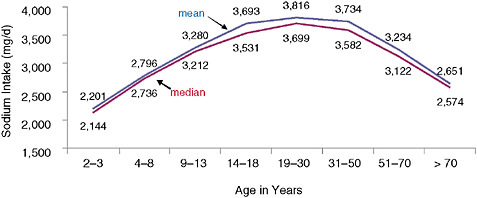
FIGURE 5-2 Usual daily mean and median sodium intake from foods for persons 2 or more years of age.
NOTE: d = day; mg = milligram.
SOURCE: NHANES 2003–2006.
TABLE 5-2 Usual Sodium Intake from Foodsa with Percentile Distributions for Persons 2 or More Years of Age
|
|
Usual Intake Percentiles (mg/d) |
Excessive Intake |
||||||||
|
5th |
10th |
25th |
Median |
SE |
75th |
90th |
95th |
% > UL |
SE |
|
|
All ages 2+ years |
1,846 |
2,114 |
2,615 |
3,268 |
9 |
4,044 |
4,879 |
5,454 |
88 |
1 |
|
Children |
|
|
|
|
|
|
|
|
|
|
|
2–5 years |
1,455 |
1,619 |
1,922 |
2,311 |
16 |
2,767 |
3,250 |
3,579 |
87 |
2 |
|
6–18 yearsa |
2,028 |
2,268 |
2,711 |
3,272 |
13 |
3,920 |
4,607 |
5,083 |
93 |
1 |
|
Adults |
|
|
|
|
|
|
|
|
|
|
|
Men, 19+ years |
2,324 |
2,648 |
3,243 |
3,995 |
18 |
4,861 |
5,761 |
6,365 |
95 |
1 |
|
Women, 19+ yearsb |
1,679 |
1,897 |
2,293 |
2,794 |
13 |
3,364 |
3,952 |
4,357 |
75 |
1 |
|
All adults, 19+ yearsb |
1,845 |
2,126 |
2,654 |
3,344 |
13 |
4,166 |
5,048 |
5,652 |
86 |
1 |
|
NOTE: d = day; mg = milligram; SE = standard error; UL = Tolerable Upper Intake Level (see Appendix F, Table F-3). aIncludes salt added in cooking and food preparation. bExcludes pregnant and lactating women; data for these persons are shown in Appendix F, Table F-3 SOURCE: NHANES 2003–2006. |
||||||||||
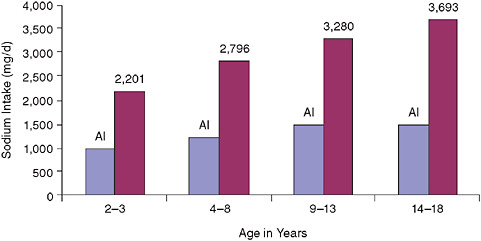
FIGURE 5-3 Usual mean sodium intake from foods versus Adequate Intake (AI) for children.
NOTE: d = day; mg = milligram.
SOURCE: NHANES 2003–2006.
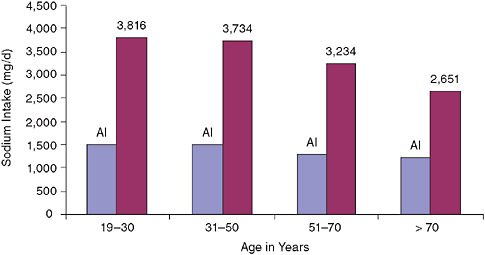
FIGURE 5-4 Usual mean sodium intake from foods versus Adequate Intake (AI) for adults.
NOTE: d = day; mg = milligram.
SOURCE: NHANES 2003–2006.
Sodium intake among children is often overlooked as a public health concern. Consistent with findings from NHANES 2003–2006, data from the Third School Nutrition and Dietary Assessment (SNDA-III) Study (Gordon and Fox, 2007), conducted in 2005 by Mathematica Policy Research and funded by the U.S. Department of Agriculture (USDA), show similar high intake estimates for school-age children. The SNDA-III data reveal a mean sodium intake from foods of 3,402 ± 46.4 mg among public school students on an average school day (Clark and Fox, 2009). Nearly 92 percent of all public school children (ages 6–18 years) were above the UL for sodium from food alone; this was highest among elementary school-age children (96 percent).
Sodium intake for children younger than 2 years is not addressed by the Dietary Guidelines for Americans, but data collected and analyzed by Mathematica Policy Research for the 2002 Feeding Infants and Toddlers Study (FITS) indicate that high sodium intake begins early in life (Heird et al., 2006; Ziegler et al., 2006). Mean sodium intake, as estimated by this data set, exceeds the AI for infants ages 4–5 months (mean of 188 mg/d), infants 6–11 months (mean of 493 mg/d), and toddlers 12–24 months (mean of 1,638 mg/d) (Heird et al., 2006). Among toddlers, 58 percent exceed
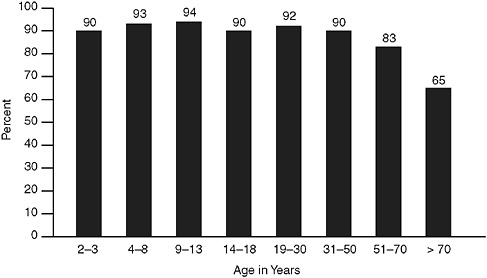
FIGURE 5-5 Percentage of persons 2 years of age or more exceeding the Tolerable Upper Intake Level (UL) for sodium from foods.
SOURCE: NHANES 2003–2006.
the UL for sodium. Preliminary findings from the 2008 FITS10 indicate that a large proportion of toddlers and preschoolers continue to have sodium intake above the UL.
By Gender
Beginning with the school-age period, boys have higher sodium intake than girls, a pattern consistent with higher energy intake (see Figure 5-6). Among older children and adults, women over 70 years have the lowest mean sodium intake (2,398 mg/d)—only preschoolers are lower. At each age group, the higher usual sodium intake by men is associated with a greater percentage with intake above the UL compared to women. Nine out of 10 adult men have excessive sodium intake.
By Sodium Intake Density
Sodium intake increases with increased calorie intake (Loria et al., 2001). As shown in Table 5-3, analyses for age and gender groups using
|
10 |
Nestle Nutrition Institute, presented at American Dietetic Association, Food & Nutrition Conference and Expo, Denver, CO, October 2009. Available online: http://www.foodnavigator-usa.com/Science-Nutrition/Preschoolers-diets-mimic-unhealthy-adult-eating (accessed November 9, 2009). |
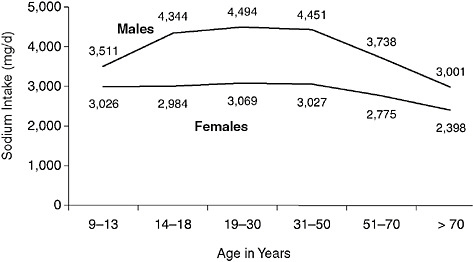
FIGURE 5-6 Usual daily mean sodium intake from foods by gender.
NOTES: d = day; mg = milligram; excludes pregnant and lactating women; data for these persons are shown in Appendix F, Table F-3.
SOURCE: NHANES 2003–2006.
NHANES 2003–2004 indicate correlation values for calories-to-sodium intake greater than 0.70 for most groups.
Expressing sodium intake per 1,000 calories—sodium intake density—allows comparison of intakes without confounding related to associations between total calorie intake and total sodium intake. Appendix F (Table F-4) gives specific information for sodium intake density measures based on NHANES 2003–2006 for the DRI age and gender groups. Overall, other than children ages 2–8 years, sodium intake density values are quite similar, suggesting that many of the differences in sodium intake are a reflection of differences in calorie intake. Both men and women ages 50–71 years show the highest sodium intake density, while among adults, women 51–70 years of age show the highest sodium intake density. As would be expected, higher energy requirements are associated with higher sodium intake. Sodium intake density is considered relative to time trends in a later section.
Intake from Foods for Subpopulations of Interest
Race/Ethnicity
As shown in Table 5-4, sodium intake levels are high among all racial/ethnic groups.
TABLE 5-3 Correlation Values for Sodium-to-Calorie Intake
|
|
Correlation (mg to kcal) |
|
All ages 2+ years |
0.79 |
|
Children |
|
|
2–3 years |
0.78 |
|
4–8 years |
0.77 |
|
Males |
|
|
9–13 years |
0.81 |
|
14–18 years |
0.83 |
|
19–30 years |
0.75 |
|
31–50 years |
0.75 |
|
51–70 years |
0.72 |
|
> 70 years |
0.68 |
|
Females |
|
|
9–13 years |
0.75 |
|
14–18 years |
0.78 |
|
19–30 years |
0.76 |
|
31–50 years |
0.74 |
|
51–70 years |
0.71 |
|
> 70 years |
0.67 |
|
Pregnant and lactating womena |
0.72 |
|
Pregnant women |
0.74 |
|
Lactating women |
0.63 |
|
NOTES: Based on Day 1 intake. kcal = calorie; mg = milligram. aEleven women were pregnant and lactating. SOURCE: NHANES 2003–2006. |
|
Non-Hispanic African American children ages 2–3 and 4–8 years have the highest mean sodium intake compared to non-Hispanic white and Mexican American children, but by ages 9–13 years there are no differences. Among adolescents and adults, non-Hispanic whites have higher mean sodium intake than non-Hispanic African Americans, and non-Hispanic whites have higher means than Mexican Americans. Since observed differences between racial/ethnic groups may be related to differences in dietary patterns (i.e., the types and amounts of foods consumed) and/or differences in accuracy of dietary reporting, these data should be interpreted with caution. Further, while parents serving as respondents for very young children may overreport intake (Devaney et al., 2004), little is known about the accuracy of parents’ dietary reporting based on their race/ethnicity and socioeconomic characteristics. Further details about intake by race/ethnicity can be found in Appendix F (Table F-5).
TABLE 5-4 Usual Mean Sodium Intake from Foods by Race/Ethnicity for Persons 2 or More Years of Age
Income
Distributions of usual sodium intake from foods show that sodium intake is high across all income levels in the population (see Appendix F, Table F-6). For the purposes of this report and consistent with standards for reporting nutrition and statistical data for the evaluation of nutrition assistance programs (Federation of American Societies for Experimental Biology, Life Sciences Research Office, 1995), low-income is defined as an annual household income level of 130 percent of poverty or less, the income eligibility for the Supplemental Nutrition Assistance Program (SNAP), formerly called the food stamp program; intermediate income is between 130 percent and 185 percent of the poverty line (185 being the income eligibility cut-off for free- or reduced-price school meals and the Special Supplemental Nutrition Program for Women, Infants, and Children [WIC] program); and higher-income is defined as annual household income above 185 percent of poverty. Mean sodium intake from foods is highest among low-income and higher-income adults ages 19–30 years and higher-income adults ages 31–50 years.
Special At-Risk Subpopulations Identified by the Dietary Guidelines for Americans
The 2005 Dietary Guidelines for Americans recommend an intake of no more than 1,500 mg/d of sodium for individuals with hypertension as well as for African Americans and middle- and older-aged adults (USDA/HHS, 2005). The NHANES 2003–2006 reports intake information on the basis of race/ethnicity and age. However, the survey classifies an individual as hypertensive if (1) measurement of systolic blood pressure is greater than or equal to 140 mm Hg, or (2) diastolic blood pressure is greater than or equal to 90 mm Hg, or (3) the person is being treated with a prescription medication (NHLBI, 2003). Therefore, the interpretation of intake values associated with this group is problematic given that it includes persons who may or may not have known they were hypertensive as well as persons receiving specific medications for hypertension.
In any case, as shown in Figure 5-7, nearly all persons in these at-risk population subgroups exceed 1,500 mg/d of sodium. More specific information on non-Hispanic African Americans and middle-aged and older subpopulations is presented earlier in this chapter. In the case of adults with hypertension, information on sodium intake percentile distributions by age and gender from NHANES 2003–2006 can be found in Appendix F (Table F-7). Usual mean intake for persons ages 19–30 years, 31–50 years,
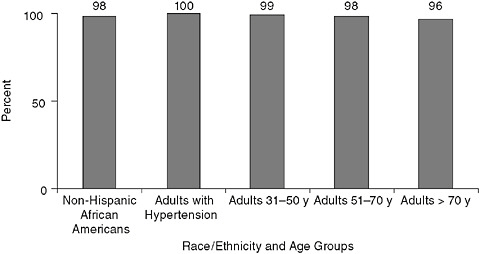
FIGURE 5-7 Percentage of at-risk populations with mean usual sodium intake from foods exceeding 1,500 mg/d.
NOTE: y = years.
SOURCE: NHANES 2003–2006.
51–70 years, and > 70 years is 4,808, 3,734, 3,179, and 2,589 mg/d, respectively.
Sodium from Dietary Sources Other Than Foods
Intake from Salt Added at the Table
Data from NHANES 2003–2006 on all sources of sodium included salt added at the table. On average, 5 percent of total sodium (178 mg of 3,614 mg) is estimated to be from salt added at the table (see Table 5-1 and Appendix F, Table F-1). The proportion of total sodium contributed by table salt is similar across age and gender groups. These data are consistent with those of Mattes and Donnelly (1991) who reported a similar estimate in 1991 using a sample of 62 adults.
Intake from Water
Approximately 1 percent (0.7 percent or 27 of 3,614 mg) of sodium intake is contributed by water, as shown in Table 5-1 and Appendix F (Table F-1). These data agree with the earlier, small study of Mattes and Donnelly (1991). Factors contributing to the sodium content of natural water include the evaporation of ocean spray particles that turn into raindrops, contamination of freshwater aquifers with seawater, road salt that is carried into water supplies by melting snow or rainwater, and the use of home water softeners (Korch, 1986). The sodium content of tap water varies by geographic location and even by source within the same locality (Azoulay, 2001). In the United States, sodium has been found to range from 0.1 to 39.1 mg/100 g in water supplies (Pehrsson et al., 2008), with an average 50 mg/L in tap water (Hoffman, 1988) and less than 10 mg/L in bottled water (according to the USDA National Nutrient Database for Standard Reference11).
Use of water softeners also contributes sodium to water (Bradshaw and Powell, 2002). Water softeners convert hard water characterized by a high calcium and magnesium content into softer water by an ion-exchange process that swaps sodium for these minerals. The amount of sodium added by a water softener is a function of the hardness of the water; the harder the water, the more sodium is needed to soften it. One study (Korch, 1986) found that the amount of sodium added by a water softener ranges up to 100 mg/L. Another study (Yarows et al., 1997) examined sodium concentrations in samples of softened water compared to sodium concentrations
|
11 |
Available online: http://www.nal.usda.gov/fnic/foodcomp/search/ (accessed November 11, 2009). |
of water samples from local municipal sources, finding a mean sodium concentration of 278 mg/L (similar to the mean of 269 mg/L reported in other literature) with a range of 172–1,219 mg/L. Municipal water averaged 110 mg sodium per liter, with a range of 0–253 mg/L. The authors concluded that an average daily consumption of 2.5 liters of water could provide up to an average of 695 mg sodium, or up to 3,047 mg sodium from the water with the highest concentrations. A report from the Mayo Clinic suggests that, in general, an 8-ounce glass of softened tap water contains around 12 mg of sodium.12
Dietary Supplements
On average, the intake of sodium due to use of dietary supplements is very low (i.e., less than 1 percent of total sodium intake in NHANES 2003–2006) (see Table 5-1 and Appendix F, Table F-1). However, although these estimates are low on a population basis, supplements can be a meaningful source of sodium for some individuals. For example, in NHANES 2003–2006, the estimated daily contribution from supplements ranged from 0.02 to 540 mg13 among supplement users.
Measures Based on Urine Analysis
Although estimates of sodium intake based on 24-hour dietary recall methods provide important and useful estimates of intake, they likely underestimate the true total intake of sodium in the population. Mean urinary sodium excretion over a 24-hour period is generally considered to be the gold standard for accurately estimating the sodium intake of individuals. The main route of sodium disposal is through urine, with only small losses through perspiration and stool. Studies in which sodium intake and excretion were very carefully monitored showed that a 24-hour urinary sodium excretion captures about 90 percent or more of the ingested sodium (Clark and Mossholder, 1986; Luft et al., 1982; McCullough et al., 1991; Ovesen and Boeing, 2002; Reinivuo et al., 2006; Schachter et al., 1980).
Obtaining 24-hour urine collections from individuals is challenging (Elliott, 1989). It requires the willing participation of individuals who must carry a container to collect their urine for a full 24 hours. Less challenging collections include measuring urinary sodium excretion in “casual”
|
12 |
Available online: http://www.mayoclinic.com/health/sodium/AN00317 (accessed June 3, 2009). |
|
13 |
One survey respondent reported use of a performance workout supplement containing 4,600 mg of sodium per serving dose; the next-highest reported daily amount from supplements was 540 mg. |
samples, samples from the first urination in the morning, and timed overnight samples, but these have not proven satisfactory (Dyer et al., 1997). Even in the case of 24-hour urine collection, as pointed out by Dyer et al. (1997), intake changes from day to day in individuals, and there is large intra-individual variation in salt consumption thereby necessitating large sample sizes, high-quality collection and analysis, and estimates of within-person variability to ensure accurate estimates.
Due to heavy respondent burden and other logistical challenges including costs, 24-hour urine collection has not been a component of the NHANES; therefore nationally representative estimates of sodium intake based on this urinary measure are not available from the data set. However, dietary recalls are also considered to be a valid method for assessing sodium intake (Espeland et al., 2001; Reinivuo et al., 2006). Some information about the U.S. population based on urinary measures is available from two international studies and from a survey of approximately 1,000 persons ages 27–37 years. These estimates are generally consistent with findings based on dietary intake methods and confirm that sodium intake in the United States is above recommended levels.
INTERSALT
INTERSALT is the largest study, and among the most often referenced in the literature, relating electrolyte intake to blood pressure. INTERSALT conducted a single 24-hour urine collection from subjects in 32 countries during 1985–1987. Energy intake was not estimated (INTERSALT Cooperative Research Group, 1986; Loria et al., 2001). The study was carried out under the auspices of the Council on Epidemiology and Prevention of the International Society and Federation of Cardiology, with funding from the Wellcome Trust; the National Heart, Lung, and Blood Institute (NHLBI); the International Society on Hypertension; the World Health Organization (WHO); the Heart Foundations of Canada, Great Britain, Japan, and The Netherlands; the Chicago Health Research Foundation; the Belgian National Research Foundation; and Parastatal Insurance Company, Brussels. Field work began in 1984 and was completed in the mid-1980s (INTERSALT Cooperative Research Group, 1988). INTERSALT assessed more than 10,000 men and women ages 20–59 years at 52 centers in 32 countries. Observers were centrally trained, and a central laboratory was used to ensure standardization and quality control. The measures included urinary sodium, blood pressure, and several potentially confounding variables. Sodium intake was determined by a single timed 24-hour urine collection. The INTERSALT Cooperative Research Group, comprised of a number of investigators in participating centers, reported the results.
Among the four centers in the United States, urinary sodium levels
(milligrams per 24 hours) ranged from 2,232 among African American men in Goodman, Mississippi, to 4,012 among African American men in Jackson, Mississippi. Measures from men in the other centers—Chicago and Hawaii—were between 3,550 and 3,650. Urinary sodium levels for women among the four centers ranged from 2,538 among African Americans in Goodman to 3,035 among Hawaiians (Loria et al., 2001). These 1985–1987 urinary estimates are consistent with the observed pattern increase in mean daily dietary sodium intake between NHANES II (1976–1980) and NHANES III (1988–1994).
INTERMAP
INTERMAP is an international cooperative study that aimed to clarify the role of multiple dietary factors in blood pressure among middle-aged and older individuals in East Asian and Western countries (Zhou et al., 2003). The investigators recognized advances in knowledge of the relationships between nutrient intake and blood pressure—furthered by INTERSALT and the Dietary Approaches to Stop Hypertension (DASH) feeding trials, for example—and used those advances as a reference point and rationale for INTERMAP’s design and methods. The cross-sectional study of nearly 4,700 men and women ages 40–59 years was conducted by INTERMAP staff in China, Japan, the United States, and the United Kingdom. Research support came from NHLBI; the Chicago Health Research Foundation; and national agencies in China, Japan, and the United Kingdom. Mean daily sodium intake was determined from two timed 24-hour urine collections. INTERMAP participants were recruited from 1997 to 1999.
Urinary sodium levels (milligrams per 24 hours) were 4,202 among U.S. men and 3,272 among U.S. women (Zhou et al., 2003). These are consistent with the dietary data obtained from NHANES showing that intake is well above recommended levels and suggest somewhat greater underreporting of dietary intake among women. The available 24-hour urinary sodium measures support the NHANES time trend of increasing sodium intake between the early 1970s and the 1990s (Briefel and Johnson, 2004).
CARDIA Study
The Coronary Artery Risk Development in Young Adults (CARDIA) study, conducted in the United States, included a trio of consecutive 24-hour urinary sodium collections for a subsample of the cohort in 1990–1991 (Loria et al., 2001). Complete data were obtained for 920 participants, ages 25–37 years, half of whom were Caucasian, the other half African American. However, energy intake was not estimated. Urinary sodium levels (milligrams per 24 hours) were 4,430 for African American men, 4,550
for white men, 3,584 for African American women, and 3,612 for white women. These data complement data from national surveys and support the finding that dietary intake was well above recommended levels (Loria et al., 2001). The urinary sodium estimates are closer to the self-reported dietary estimates for men than for women in the 1988–1994 NHANES, providing additional evidence that dietary reports underestimate total sodium intake for some groups.
TRENDS IN SODIUM INTAKE: NHANES 1971–1974 THROUGH 2003–2006
This section enhances the information available on changes in sodium intake over time by adding information from NHANES 2003–2006 to existing data on time trends. Background information on the analyses and data derivation can be found in Appendix E. As described in the appendix, as is always the case with time trends data, changes in intake over time must be cautiously interpreted because of limitations in these data, particularly in older data with differences in methodologies.
Intake from Foods Over Time
While the completeness and accuracy of early NHANES data is unknown, in the four decades that sodium intake has been monitored, estimates of mean sodium intake appear to have not decreased and, in fact, have trended upward since 1971–1974 across age and gender groups. There is a less consistent upward pattern between 1988–1994 and 2003–2006 (Table 5-5).
Reasons for these changes in estimates cannot be specified with certainty. The general pattern is consistent with observed calorie increases in the population during the same period (Smiciklas-Wright et al., 2003). As discussed earlier, sodium intake is positively correlated with energy intake, so increases in energy intake are generally associated with increases in sodium. Further, different food composition databases have been used to estimate sodium intake over time, there are challenges in estimating sodium from all sources that may have changed over time, and there are likely methodological changes in assessing salt use and food composition data.
Sodium Intake Density Over Time
As described earlier, expressing sodium intake on the basis of milligrams of sodium per 1,000 calories provides another means of assessing sodium intake over time and between groups. This expression of sodium intake density can be calculated for estimates of sodium intake collected in
TABLE 5-5 Mean 1-Day Sodium Intake (mg/d; SE) from Foodsa by Age and Gender
|
|
NHANES I 1971–1974 |
NHANES II 1976–1980 |
NHANES III 1988–1994 |
NHANES 1999–2000 |
|
|
Both Sexes |
|
|
|
|
|
|
1–2 years |
1,631 (38) |
1,828 (31) |
1,983 (29) |
2,148 (69) |
1,929 (26) |
|
3–5 years |
1,925 (32) |
2,173 (27) |
2,594 (47) |
2,527 (84) |
2,483 (34) |
|
6–11 years |
2,393 (38) |
2,716 (34) |
3,164 (67) |
3,255 (125) |
3,119 (30) |
|
Males |
|
|
|
|
|
|
12–15 years |
2,923 (75) |
3,405 (85) |
4,240 (158) |
3,858 (171) |
3,947 (69) |
|
16–19 years |
3,219 (97) |
4,030 (92) |
4,904 (138) |
4,415 (206) |
4,367 (67) |
|
20–39 years |
3,043 (64) |
3,760 (59) |
4,680 (68) |
4,334 (103) |
4,558 (58) |
|
40–59 years |
2,681(57) |
3,413 (79) |
4,177 (88) |
4,132 (112) |
4,119 (52) |
|
60–74 years |
2,318 (46) |
2,934 (34) |
3,513 (82) |
3,557 (110) |
3,487 (52) |
|
20–74c years |
2,780 (40) |
3,486 (45) |
4,288 (53) |
4,127 (74) |
4,300 (34) |
|
Females |
|
|
|
|
|
|
12–15 years |
2,094 (49) |
2,567 (49) |
3,200 (127) |
3,034 (123) |
2,952 (45) |
|
16–19 years |
1,812 (60) |
2,336 (58) |
3,160 (91) |
3,048 (95) |
2,995 (45) |
|
20–39 years |
1,883 (26) |
2,383 (40) |
3,167 (53) |
3,161 (75) |
3,136 (35) |
|
40–59 years |
1,754 (25) |
2,256 (37) |
2,852 (52) |
2,978 (87) |
2,932 (38) |
|
60–74 years |
1,529 (34) |
2,053 (29) |
2,543 (53) |
2,633 (79) |
2,628 (38) |
|
20–74c years |
1,774 (17) |
2,278 (27) |
2,939 (34) |
3,002 (62) |
3,003 (22) |
|
NOTE: d = day; mg = milligram; NHANES = National Health and Nutrition Examination Survey; SE = standard error. aIncludes salt used in cooking and food preparation, but not salt added to food at the table. bEstimated on basis of 1-day intake in order to be consistent with earlier surveys. cAge-adjusted to the 2000 Census. SOURCES: Briefel and Johnson (2004) for 1971–2000 data (reproduced with permission of Annual Reviews, Inc. from “Secular trends in dietary intake in the United States,” Vol 24; permission conveyed through Copyright Clearance Center, Inc.); NHANES for 2003–2006 data. |
|||||
NHANES beginning in 1971–1974 (see Table 5-6). More detailed information can be found on NHANES 2003–2006 in Appendix F (Table F-4).
The differences in sodium intake that are observed among children and adult men and women disappear to a large degree when expressed as measures of sodium intake density. This suggests that on a calorie-per-calorie basis, age and gender subgroups within the U.S. population are taking in equivalent amounts of sodium and larger intake among men, for example, when compared to women is primarily a function of consuming more food, not different foods. Further, the difference in measures of sodium intake density for virtually all population groups between 1971–1974 and 2003–2006 also suggest that foods, as consumed, may have had an increase in the amount of sodium on a per 1,000 calories basis during this time period. As
TABLE 5-6 Mean 1-Day Sodium Intake Density (mg/1,000 kcal) from Foodsa by Age and Gender
|
|
NHANES I 1971–1974 |
NHANES II 1976–1980 |
NHANES III 1988–1994b |
NHANES 1999–2000 |
|
|
Both Sexes |
|
|
|
|
|
|
1–2 years |
1,208 |
1,420 |
1,538 |
1,422 |
1,367 |
|
3–5 years |
1,149 |
1,385 |
1,630 |
1,558 |
1,462 |
|
6–11 years |
1,170 |
1,386 |
1,672 |
1,607 |
1,521 |
|
Males |
|
|
|
|
|
|
12–15 years |
1,114 |
1,367 |
1,645 |
1,568 |
1,578 |
|
16–19 years |
1,069 |
1,322 |
1,583 |
1,506 |
1,520 |
|
20–39 years |
1,093 |
1,366 |
1,578 |
1,533 |
1,563 |
|
40–59 years |
1,164 |
1,474 |
1,627 |
1,595 |
1,549 |
|
60–74 years |
1,209 |
1,539 |
1,669 |
1,675 |
1,643 |
|
20–74c years |
1,135 |
1,308 |
1,608 |
1,576 |
1,561 |
|
Females |
|
|
|
|
|
|
12–15 years |
1,096 |
1,410 |
1,741 |
1,525 |
1,534 |
|
16–19 years |
1,044 |
1,385 |
1,614 |
1,527 |
1,507 |
|
20–39 years |
1,140 |
1,450 |
1,617 |
1,559 |
1,581 |
|
40–59 years |
1,162 |
1,532 |
1,643 |
1,629 |
1,612 |
|
60–74 years |
1,154 |
1,553 |
1,671 |
1,650 |
1,621 |
|
20–74c years |
1,150 |
1,497 |
1,635 |
1,599 |
1,597 |
|
NOTE: kcal = calorie; mg = milligram; NHANES = National Health and Nutrition Examination Survey. aIncludes salt used in cooking and food preparation, but not salt added to food at the table; 1-day mean intake calculated using the population proportion method; weighted data from NHANES. bAnalyzed using 1-day mean intake data from NHANES 2003–2006 to be consistent with previous analyses. cAge-adjusted to the 2000 Census. SOURCES: Briefel and Johnson (2004) for 1971–2000 data; NHANES for 2003–2006 data. |
|||||
compared to a sodium intake density of < 1,150 mg per 1,000 calories per day needed to achieve a Dietary Guidelines for Americans recommended daily intake of < 2,300 mg sodium, and assuming a 2,000-calorie reference diet, all groups had intakes that exceeded guideline levels, even during the earlier periods when sodium intake density appeared lower than in more recent years.
In sum, despite the confounding that may occur relative to the observed upward trend in sodium intake since 1971–1974 due to increases in calorie intake and methodological differences among surveys, it is very likely that true increases in sodium intake from foods have occurred. Consistencies across population subgroups in NHANES over five national surveys, consistencies with smaller studies and clinical trials that included urinary sodium
assessments, and information on the sodium density of the food supply lend support to the upward intake trend during the past 30 to 40 years.
CHARACTERIZING SODIUM IN THE FOOD SUPPLY
Identifying Food Sources of Sodium
The ability to characterize the food sources that contribute sodium to the diet helps to clarify the nature of the food supply and to suggest those food categories that are the major contributors. The analyses reported here are based on the same 2003–2006 NHANES used to provide the estimates of sodium intake described earlier in this chapter. The description of the methods for defining and sorting food categories can be found in Appendix E. Eleven major food categories were specified. Examples of several products that demonstrate variation in sodium content among different brands for similar foods are discussed in Chapter 4.
Contribution on Basis of 11 Food Categories
Figure 5-8 shows the percentage contribution to sodium intake from 11 major food categories. Mixed dishes, which consist of foods such as sandwiches, casseroles, pasta entrées, and pizza, contribute nearly half (44 percent) of the total sodium from foods. Other major food categories include meat and meat alternates, including cheese and eggs (16 percent), grains (11 percent), and vegetables (9 percent).14 The remaining food categories each contribute 5 percent or less of total sodium intake from foods (see Appendix F, Table F-8).
Beyond the food categories “fruit” and “fats/oils,” it is difficult to comment on differences over time in these relative contributions because the major grouping schemes used to categorize foods have not remained consistent.
Further, Table 5-7 displays the top five foods that contribute sodium to the diets of persons 2 or more years of age in rank order within each of the 11 major food categories. For example, within the food category of mixed dishes—the category that is the largest contributor to dietary sodium—the main contributors (in rank order) are sandwiches (excluding burgers), pizza, hamburgers/cheeseburgers, Mexican entrées, and pasta dishes. For most food categories, the top 20 foods (see Appendix F, Table F-8) account for all or nearly all of the sodium contributed by that food category.
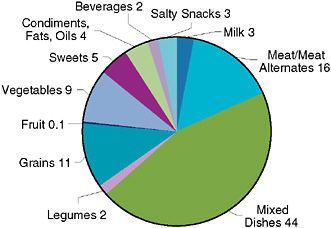
FIGURE 5-8 Percentage contributions to sodium intake by food category for persons 2 or more years of age.
SOURCE: NHANES 2003–2006.
Further, the kinds of foods that are the major contributors to sodium intake are similar across age and gender groups, as shown in Appendix F (Table F-9).
Finally, Table 5-8 provides an example to illustrate that relative to the food category that is the primary contributor to sodium intake—mixed dishes—the sodium in the mixed dish is derived from an array of items added to the dish as part of its preparation.
Contribution on Basis of Prepared Away from Home versus Prepared at Home
The definitions of foods eaten at home and those eaten away from home are given in Appendix E. As shown in Figure 5-9, in 2003–2006 about 37 percent of sodium came from food away from home. By comparison, the contribution of away-from-home foods to sodium intake is reported to have increased from 27 to 34 percent from 1987 to 1995 (Lin et al., 1999). Currently, for foods obtained at the store (and eaten at home), the main source of sodium is sandwiches, followed by pasta dishes, cereal, bread, and cheese. At restaurants, the main source is also sandwiches and then pizza, hamburgers, chicken, Mexican entrées, and salads (see Appendix F, Table F-10).
Because of the confounding effect of calories on estimates of sodium intake—persons consuming more calories have higher sodium intakes—
TABLE 5-7 Top Five Food Contributors to Sodium Intake Within Food Categories for Persons 2 or More Years of Age
|
Food Group |
Food Item |
Percentage of Sodium Contributed in Food Groupa |
|
Mixed dishes = 44% of total daily sodium |
Sandwiches (excluding burgers) |
35.3 |
|
Pizza with meat |
12.2 |
|
|
Hamburgers/cheeseburgers |
8.5 |
|
|
Mexican entrées |
6.9 |
|
|
Pasta dishes, Italian style |
6.5 |
|
|
Sum |
69.4 |
|
|
Meat, meat alternates = 15.5% of total |
Chicken |
25.0 |
|
Cheese |
15.3 |
|
|
Eggs |
12.1 |
|
|
Bacon/sausage |
10.6 |
|
|
Beef |
7.7 |
|
|
Sum |
70.7 |
|
|
Grains = 11.4% of total |
Bread |
21.5 |
|
Cold cereal |
18.5 |
|
|
Rice |
10.9 |
|
|
Pancakes, waffles, French toast |
9.6 |
|
|
Crackers |
9.0 |
|
|
Sum |
69.5 |
|
|
Vegetables = 9.3% of total |
Salad (greens)b |
30.0 |
|
Cooked potatoes, not fried |
16.7 |
|
|
Cooked potatoes, fried |
15.2 |
|
|
Cooked tomatoes |
9.2 |
|
|
Cooked green beans |
4.3 |
|
|
Sum |
75.4 |
|
|
Sweets = 5.0% of total |
Cookies |
22.0 |
|
Cake/cupcakes |
21.6 |
|
|
Ice cream |
10.5 |
|
|
Pies/cobblers |
9.3 |
|
|
Doughnuts |
7.8 |
|
|
Sum |
71.2 |
|
|
Condiments, oils, fats = 4.3% of total |
Catsup, mustard, relish, soy sauce |
39.9 |
|
Gravy |
12.3 |
|
|
Salad dressing |
11.7 |
|
|
Garnishes such as pickles or olives |
10.6 |
|
|
Margarine |
7.4 |
|
|
Sum |
81.9 |
|
|
Salty snacks = 3.4% of total |
Corn-based salty snacks |
32.1 |
|
Popcorn |
25.9 |
|
|
Potato chips |
23.0 |
|
|
Pretzels/party mix |
19.1 |
|
|
Sum |
100.0 |
|
Food Group |
Food Item |
Percentage of Sodium Contributed in Food Groupa |
|
Milk = 2.9% of total |
Unflavored 2% milk |
28.8 |
|
Unflavored whole milk |
19.2 |
|
|
Unflavored skim milk |
12.9 |
|
|
Unflavored 1% milk |
9.9 |
|
|
Yogurt |
5.8 |
|
|
Sum |
76.6 |
|
|
Beverages = 2.2% of total |
Noncarbonated sweetened drink |
28.0 |
|
Regular soda |
25.2 |
|
|
Sugar-free soda |
12.8 |
|
|
Coffee |
11.7 |
|
|
Beer |
7.3 |
|
|
Sum |
85.0 |
|
|
Beans, nuts, and seeds = 2.1% of total |
Baked or refried beans |
37.6 |
|
Nuts |
18.7 |
|
|
Beans |
16.8 |
|
|
Protein or meal enhancement |
12.4 |
|
|
Peanut or almond butter |
6.9 |
|
|
Sum |
92.4 |
|
|
Fruit = 0.1% of total |
Citrus juice |
25.8 |
|
Non-citrus juice |
24.5 |
|
|
Avocado, guacamole |
13.8 |
|
|
Fresh melon |
12.4 |
|
|
Other fresh fruit |
4.5 |
|
|
Sum |
81.0 |
|
|
aPercentage shown within each major category reflects the percentage of sodium contributed by that food item within the food category (e.g., sandwiches provide 35% of the sodium in the mixed dish category). bIncludes additions to salads such as salad dressing, cheese, meat, croutons, and other condiments. SOURCE: NHANES 2003–2006. |
||
comparisons of relative intake from different food supply sources are best expressed on the basis of sodium intake density, specifically as milligrams per 1,000 calories consumed. Currently, as shown in Table 5-9, mean sodium intake density is lowest for foods consumed at home (obtained at the store and prepared or consumed at home) and highest for foods consumed away from home, notably from restaurants and fast food establishments (as defined by NHANES).
As discussed in Chapter 2, data collected between 1987 and 1995 (Lin et al., 1999) reveal sodium intake density measures for foods consumed at home to be similar to those from away-from-home sources (see Figure 2-4).
TABLE 5-8 Sources of Sodium in Sandwiches and Hamburgers/Cheeseburgers by Percentage of Item for Persons 2 or More Years of Age
|
Sandwiches (Excluding Burgers) Contribution to Total Sodium in Sandwich (%) |
Hamburgers/Cheeseburgers Contribution to Total Sodium in Hamburger (%) |
||
|
Cold cuts |
23.9 |
Ground beef |
36.7 |
|
Bread |
19.2 |
Rolls |
19.6 |
|
Cheese |
11.2 |
Cheese |
18.8 |
|
Hot dogs |
9.2 |
Catsup, mustard, relish, etc. |
8.1 |
|
Rolls |
7.3 |
Garnishes such as pickles, olives |
6.4 |
|
Bacon/sausage |
4.1 |
Bread |
4.9 |
|
Catsup, mustard, relish, etc. |
2.7 |
Mayonnaise |
1.8 |
|
Chicken |
2.4 |
Bacon/sausage |
1.7 |
|
Fish |
2.3 |
Cooked tomatoes |
0.5 |
|
Ham |
1.8 |
Salad dressing |
0.4 |
|
SOURCE: NHANES 2003–2006. |
|||
Likewise, foods eaten at fast food restaurants and schools for that period show sodium densities similar to those classified as eaten at home, suggesting generally similar salt additions to foods in most food preparation and manufacturing locations, or similar food coding rules. The more recent data from NHANES 2003–2006 (see Table 5-9 and also Figure 2-4) reveal greater differences in the sodium intake density of foods obtained from the store (and prepared or eaten at home) versus all away-from-home sources. This suggests that within the U.S. food supply, away-from-home food sources are richer in sodium than foods consumed at home. Further, in the past two decades, the sodium intake density increased the most for fast food restaurants (see Figure 2-4).
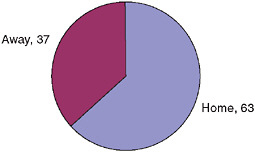
FIGURE 5-9 Percentage of sodium intake from home and away-from-home foods.
SOURCE: NHANES 2003–2006.
TABLE 5-9 Sodium Density for Foods from Home and Away for Persons 2 or More Years of Age
Other Approaches to Characterizing the Sodium Content of the Food Supply
Other approaches can be used to describe the sodium content of the food supply beyond examining the main contributors of sodium to the diet on the bases of food category and types of eating establishments. However, as a general matter, the food supply as a whole has not been systematically tracked or monitored through surveys designed for this purpose. Alternatively, the sodium content of the food supply can be described using salt disappearance data (which can also be used to derive gross estimates of sodium intake). So-called “market basket” studies, such as the survey conducted by the Food and Drug Administration (FDA), could also be useful, although currently it is designed primarily for other purposes. The national databases related to food composition—which include sodium content and are maintained by USDA—cannot themselves characterize the sodium content of the food supply, but are instead a key component of the process of estimating sodium intake based on dietary recalls from a nationally representative sample of the U.S. population. However, selective comparisons of changes in food composition over time within these databases could provide some useful trend data on changes in sodium in the food supply. The only available study of this type did not include information on sodium (Ahuja et al., 2006).
Salt Disappearance Data
Monitoring intake from disappearance data allows for a reasonably accurate estimate of time trend patterns because common methods of collecting and accounting for use have remained similar over time. Salt disap-
pearance data can be used to estimate time trend patterns in the availability of sodium for human consumption, with the understanding that there are losses and wastage that cannot be accounted for. As described in Chapter 2, the annual per capita salt disappearance data show a steady increase in per capita availability between 1983 and 1998. While this does not definitively indicate that there has been an increase in the overall sodium content of the food supply, it is suggestive. More recently, values appear to be leveling off or decreasing slightly. The peak levels in 1998 indicate that approximately 5,700 mg of sodium were available per person per day. Although the pattern of use over time suggests that early educational and program initiatives (such as in the early 1980s) were associated with a reduction in salt use, subsequent programs, including the implementation of a mandatory declaration of sodium content on all food labels in 1993 and multiple calls for food processors and food service operators to reduce the sodium content of foods since 1969, appear to have had little or no impact on salt availability for human use.
Market Basket Study: FDA’s Total Diet Study
The Total Diet Study (TDS) is an ongoing FDA program that determines levels of various contaminants and nutrients in foods.15 From this information, dietary intake of those substances by the U.S. population can be estimated. Since its inception in 1961 as a program to monitor radioactive contamination of foods, the TDS has expanded to include pesticide residues, industrial chemicals, and toxic and nutrient elements.
The TDS involves purchasing samples of food throughout the United States, preparing the foods as they would be consumed (table-ready), and analyzing the foods to measure the levels of select contaminants and nutrients. Dietary intake of these substances by the U.S. population is then calculated by multiplying the levels found in TDS foods by the average consumption amounts for each food. The outcomes for sodium are reported as milligrams per kilogram of food. The number of different foods sampled in the TDS has increased from 82 food items when the study was initiated in the early 1960s to about 280 foods in the current program.
Sample collections (also referred to as market baskets) are generally conducted four times each year, once in each of four geographic regions of the country (West, North Central, South, and Northeast). Food samples are purchased by FDA personnel from supermarkets, grocery stores, and fast food restaurants in three cities in each region and are shipped to a central FDA laboratory.
|
15 |
Available online: http://www.fda.gov/Food/FoodSafety/FoodContaminantsAdulteration/TotalDietStudy/default.htm (accessed November 18, 2009). |
The TDS analyzes sodium on composites, reports these as milligrams per kilogram of food, and does not convert the results for composites back to representative diets, thereby limiting the utility of the data on sodium relative to the food supply. Further, it is unclear whether the sampling scheme, food preparation, and documentation of product samples are sufficient or appropriate for sodium. For example, issues related to the proportioning of the sampling of vegetables among fresh, frozen, and canned may require a different approach for sodium (which should be based on how consumers consume them), given that the current focus is on contaminants and pesticides.
National Food Composition Databases
In theory, national food composition databases offer the opportunity to monitor changes in the sodium content of the food supply, but interpretation of such data is problematic. There can be a confounding effect due to improvements in the food composition data and changes in the approaches used to determine the listings for the sodium values of foods. Currently, about 70 percent of the sodium values in the food composition database used to code and assess sodium in NHANES 2003–2006 are analytical values, 5 percent are from food labels, 11 percent from manufacturers, and 15 percent imputed. Moreover, during the time dietary trends have been measured, the food composition database has been updated and expanded to include more brand names and fast food items as well as a few other restaurant foods.16 Maintaining an up-to-date database on the sodium content of foods is a challenging but essential task.
Ahuja et al. (2006) examined the effect of improved food composition data on intake estimates in the United States through a reanalysis of data using multiyear versions of the tables of food composition. Sodium was not included in their analysis, but for the more than 25 nutrients and food components examined, results showed minor but statistically significant differences in mean intake estimates for most nutrients.
MONITORING
Monitoring intake of sodium and describing the nature of sodium sources in the food supply is fundamental to implementing and sustaining strategies to reduce sodium intake. While estimates of sodium intake based on dietary recall methodologies are useful and readily reveal the high intake levels among the U.S. population, more accurate methods for estimating intake are available, including the 24-hour urine sample.
The collection of 24-hour urine specimens to assess sodium intake reflects the gold standard for estimating sodium intake, however this method has not been included in the NHANES because of the complexity and cost of such collections. NHANES has collected “casual” urine specimens to assess environmental analytes, determine the possibility of pregnancy, and measure kidney function and iodine status.17 However, these have not been analyzed for sodium, and it is recognized that casual specimens are not likely to provide a desirable level of accuracy for the purposes of estimating intake. Nonetheless, because surplus collections of these samples have been stored since NHANES became a continuous survey in 1999, these samples offer the opportunity to carry out pilot studies relative to comparisons, given that NHANES plans to collect a second urine specimen as part of the recently initiated 2009–2010 survey.
All of the usual improvements frequently called for relative to estimating intake through dietary recall methods also apply to sodium. These include advances in recall methods and probing techniques, enhancement of food composition tables for sodium content of foods, and timely, userfriendly releases of data. More frequent analysis and reporting of distributions of usual sodium intake (and energy for calculations of sodium density) and food sources of sodium are warranted to better monitor sodium intake and initiatives to reduce sodium. Of particular importance in the case of sodium for food composition tables is the ability to incorporate into such tables the sodium content of menu items offered by the major chain restaurant/foodservice operations.
Finally, there is considerable utility to be gained through the implementation of appropriate market basket studies and innovative approaches to characterizing the sodium content of the food supply. The committee considered these in more depth as described in Chapter 8.
REFERENCES
Ahuja, J. K. C., J. D. Goldman, and B. P. Perloff. 2006. The effect of improved food composition data on intake estimates in the United States of America. Journal of Food Composition and Analysis 19(Supplement):S7-S13.
Azoulay, A., P. Garzon, and M. J. Eisenberg. 2001. Comparison of the mineral content of tap water and bottled waters. Journal of General Internal Medicine 16(3):168-175.
Basch, C. E., S. Shea, R. Arliss, I. R. Contento, J. Rips, B. Gutin, M. Irigoyen, and P. Zybert. 1990. Validation of mothers’ reports of dietary intake by four to seven year-old children. American Journal of Public Health 80(11):1314-1317.
Bradshaw, M. H., and G. M. Powell. 2002. Sodium in drinking water. Manhattan, KS: Kansas State University Agricultural Experiment Station and Cooperative Extension Service.
|
17 |
Available online: http://www.cdc.gov/nchs/nhanes/nhanes_questionnaires.htm (accessed November 18, 2009). |
Briefel, R. R., and C. L. Johnson. 2004. Secular trends in dietary intake in the United States. Annual Review of Nutrition 24:401-431.
Briefel, R. R., C. T. Sempos, M. A. McDowell, S. Chien, and K. Alaimo. 1997. Dietary methods research in the third National Health and Nutrition Examination Survey: Under-reporting of energy intake. American Journal of Clinical Nutrition 65(4, Supplement): S1203-S1209.
CDC (Centers for Disease Control and Prevention). 2009. Application of lower sodium intake recommendations to adults—United States, 1999–2006. Morbidity and Mortality Weekly Report 58(11):281-283.
Clark, A. J., and S. Mossholder. 1986. Sodium and potassium intake measurements: Dietary methodology problems. American Journal of Clinical Nutrition 43(3):470-476.
Clark, M. A., and M. K. Fox. 2009. Nutritional quality of the diets of US public school children and the role of the school meal programs. Journal of the American Dietetic Association 109(2):S44-S56.
Devaney, B., P. Ziegler, S. Pac, V. Karwe, and S. I. Barr. 2004. Nutrient intakes of infants and toddlers. Journal of the American Dietetic Association 104(Supplement 1):14-21.
DGAC (Dietary Guidelines Advisory Committee). 2005. Report of the Dietary Guidelines Advisory Committee on the Dietary Guidelines for Americans, 2005. A Report to the Secretary of Health and Human Services and the Secretary of Agriculture. Washington, DC: U.S. Department of Agriculture and U.S. Department of Health and Human Services.
Dwyer, J., M. F. Picciano, D. J. Raiten, P. P. Basiotis, M. M. Bender, B. K. Bindewald, A. L. Carriquiry, A. K. Courtney, N. T. Crane, K. W. Dodd, K. Egan, K. C. Ellwood, S. E. Gebhardt, J. F. Guthrie, J. M. Harnly, J. M. Holden, C. Johnson, S. M. Krebs-Smith, P. M. Kuznesof, C. E. Lang, M. McDowell, A. Moshfegh, P. R. Pehrsson, K. Radimer, A. F. Subar, C. A. Swanson, and W. R. Wolf. 2003. Collection of food and dietary supplement intake data: What we eat in America-NHANES. Journal of Nutrition 133(2):590S-600S.
Dyer, A., P. Elliott, D. Chee, and J. Stamler. 1997. Urinary biochemical markers of dietary intake in the INTERSALT study. American Journal of Clinical Nutrition 65(Supplement 4):1246S-1253S.
Elliott, P. M. 1989. The INTERSALT Study: An addition to the evidence on salt and blood pressure, and some implications. Journal of Human Hypertension 3:289-298.
Espeland, M. A., S. Kumanyika, A. C. Wilson, D. M. Reboussin, L. Easter, M. Self, J. Robertson, W. M. Brown, and M. McFarlane. 2001. Statistical issues in analyzing 24-hour dietary recall and 24-hour urine collection data for sodium and potassium intakes. American Journal of Epidemiology 153(10):996-1006.
Federation of American Societies for Experimental Biology, Life Sciences Research Office (Prepared for the Interagency Board for Nutrition Monitoring and Related Research). 1995. Third report on nutrition monitoring in the United States: Executive summary. Washington, DC: U.S. Government Printing Office.
Gordon, A., and M. K. Fox. 2007. School Nutrition Dietary Assessment Survey-III: Summary of findings. Washington, DC: USDA Food and Nutrition Service.
Heird, W. C., P. Ziegler, K. Reidy, and R. Briefel. 2006. Current electrolyte intakes of infants and toddlers. Journal of the American Dietetic Association 106(1, Supplement): S43-S51.
Hoffman, C. J. 1988. Does the sodium level in drinking water affect blood pressure levels? Journal of the American Dietetic Association 88(11):1432-1435.
INTERSALT Cooperative Research Group. 1986. INTERSALT Study: An international cooperative study on the relation of blood pressure to electrolyte excretion in populations. I. Design and methods. Journal of Hypertension 4(6):781-787.
INTERSALT Cooperative Research Group (Rose, G., Stamler, J., Stamler, R., Elliott, P., Marmot, M., Pyorala, K., Kesteloot, H., Joossens, J., Hansson, L., Mancia, G., Dyer, A., Kromhout, D., Laaser, U., Sans, S.). 1988. INTERSALT: An international study of electrolyte excretion and blood pressure. Results for 24-hour urinary sodium and potassium excretion. British Medical Journal 297(6644):319-328.
IOM (Institute of Medicine). 2000. Dietary Reference Intakes: Applications in dietary assessment. Washington, DC: National Academy Press.
IOM. 2005. Dietary Reference Intakes for water, potassium, sodium, chloride, and sulfate. Washington, DC: The National Academies Press.
IOM. 2006. Dietary Reference Intakes: The essential guide to nutrient requirements, edited by J. J. Otten, J. P. Hellwig, and L. D. Meyers. Washington, DC: The National Academies Press.
Korch, G. C. 1986. Sodium content of potable water: Dietary significance. Journal of the American Dietetic Association 86(1):80-83.
Lin, B.-H., J. Guthrie, and E. Frazão. 1999. Nutrient contribution of food away from home. In America’s eating habits: Changes and consequences, edited by E. Frazão. Agriculture Information Bulletin No. 750. Washington, DC: U.S. Department of Agriculture, Economic Research Service, Food and Rural Economics Division. Pp. 213-242.
Loria, C. M., E. Obarzanek, and N. D. Ernst. 2001. Choose and prepare foods with less salt: Dietary advice for all Americans. Journal of Nutrition 131(2, Supplement 1): 536S-551S.
Luft, F. C., N. S. Fineberg, and R. S. Sloan. 1982. Overnight urine collections to estimate sodium intake. Hypertension 4(4):494-498.
Mattes, R. D., and D. Donnelly. 1991. Relative contributions of dietary sodium sources. Journal of the American College of Nutrition 10(4):383-393.
McCullough, M. L., J. F. Swain, C. Malarick, and T. J. Moore. 1991. Feasibility of outpatient electrolyte balance studies. Journal of the American College of Nutrition 10(2): 140-148.
NHLBI (National Heart, Lung, and Blood Institute). 2003. JNC 7 Express: The seventh report of the Joint National Committee on Prevention, Detection, Evaluation, and the Treatment of High Blood Pressure. NIH Publication No. 03-5233. Bethesda, MD: National Institutes of Health.
Ovesen, L., and H. Boeing. 2002. The use of biomarkers in multicentric studies with particular consideration of iodine, sodium, iron, folate and vitamin D. European Journal of Clinical Nutrition 56(Supplement 2):S12-S17.
Pehrsson, P., K. Patterson, and C. Perry. 2008. The mineral content of U.S. drinking and municipal water. Paper presented at 32nd National Nutrient Databank Conference, May 12–14, Ottawa, Ontario, Canada.
Reinivuo, H., L. M. Valsta, T. Laatikainen, J. Tuomilehto, and P. Pietinen. 2006. Sodium in the Finnish diet: II Trends in dietary sodium intake and comparison between intake and 24-h excretion of sodium. European Journal of Clinical Nutrition 60(10):1160-1167.
Schachter, J., P. H. Harper, and M. E. Radin. 1980. Comparison of sodium and potassium intake with excretion. Hypertension 2(5):695-699.
Smiciklas-Wright, H., D. C. Mitchell, S. J. Mickle, J. D. Goldman, and A. Cook. 2003. Foods commonly eaten in the United States, 1989–1991 and 1994–1996: Are portion sizes changing? Journal of the American Dietetic Association 103(1):41-47.
Szarfman, A., T. Kuchenberg, J. Soreth, and S. Lajmanovich. 1995. Declaring the sodium content of drug products [7]. New England Journal of Medicine 333(19):1291.
Thompson, F. E., and A. F. Subar. 2008. Dietary assessment methodology. In Nutrition in the prevention and treatment of disease. 2nd ed., edited by A. M. Coulston and C. Boushey. Boston, MA: Academic Press. Pp. 3-39.
Ubeda, A., J. Llopico, and M. T. Sanchez. 2009. Blood pressure reduction in hypertensive patients after withdrawal of effervescent medication. Pharmacoepidemiology and Drug Safety 18(5):417-419.
USDA/HHS (U.S. Department of Agriculture/U.S. Department of Health and Human Services). 2005. Dietary Guidelines for Americans. 6th ed, Home and Garden Bulletin No. 232. Washington, DC: U.S. Government Printing Office.
Woteki, C. E. 2003. Integrated NHANES: Uses in national policy. Journal of Nutrition 133(2):582S-584S.
Yarows, S. A., W. E. Fusilier, and A. B. Weder. 1997. Sodium concentration of water from softeners. Archives of Internal Medicine 157(2):218-222.
Zhou, B. F., J. Stamler, B. Dennis, A. Moag-Stahlberg, N. Okuda, C. Robertson, L. Zhao, Q. Chan, and P. Elliott. 2003. Nutrient intakes of middle-aged men and women in China, Japan, United Kingdom, and United States in the late 1990s: The INTERMAP Study. Journal of Human Hypertension 17(9):623-630.
Ziegler, P., C. Hanson, M. Ponza, T. Novak, and K. Hendricks. 2006. Feeding infants and toddlers study: Meal and snack intakes of Hispanic and non-Hispanic infants and toddlers. Journal of the American Dietetic Association 106(1 Supplement):S107-S123.


