
6
The Food Environment: Key to Formulating Strategies for Change in Sodium Intake
As often pointed out, the United States has one of the most diverse and plentiful food supplies in the world. On balance, food is relatively inexpensive and readily available. However, the food supply is also characterized by high levels of sodium. Very little of the sodium in foods is naturally occurring; most of it is added by the food industry in the form of sodium chloride, but other sodium-containing compounds make a contribution. Further, as described in Chapter 5, the amount of salt added to foods at the table and during cooking currently contributes only minor amounts to the overall diet of Americans.
An important consideration for this report is not only that the food supply contains high levels of sodium, but also that increasing amounts of the food consumed by Americans are formulated by entities outside the home (see Chapter 5). These range from single items typically regarded as processed foods, such as canned soups and baked goods, to entire meals and sometimes entire diets. This is mirrored in the steady growth of the processed food industry, the high consumer demand for convenience and ready-to-serve products, and changes in the types of stores selling foods (Martinez, 2007).
The food environment framework reflects an interaction of multiple components: manufacturers, retailers, restaurant/foodservice operations, consumers, regulation/policy, and communication/advertising (Glanz et al., 2005). This chapter outlines the nature of the first four components. It begins with an overview of U.S. food manufacturing and retailing industries, then continues with an overview of restaurant/foodservice operations. Large-scale government programs that provide foods to individuals and
households are also discussed. The chapter concludes with a discussion of consumer interactions with the food environment, looking specifically at how the food environment influences consumer choice and at current understanding of consumer behavior change models.
MANUFACTURING AND RETAILING OF PROCESSED FOODS WITHIN THE FOOD ENVIRONMENT
Since the late 1800s, the U.S. food environment has experienced tremendous growth and changes in the food manufacturing and retailing sectors, which continue to evolve (Beckley et al., 2007). Today, the majority of food undergoes some type of processing before reaching consumers. Some processing is so extensive that little or no preparation of the food is needed before consumption. As discussed in Chapter 5, processed foods are major contributors to sodium intake, making the food manufacturing and retailing sectors of key interest to the committee. This section provides an overview of food manufacturing and retailing in the United States, information on how food products are developed, and examples of efforts taken by the food industry to reduce sodium intake and the levels of sodium in the foods it produces.
Characteristics of the Processed Food Industry
Processed food represents one of the largest sectors of the U.S. manufacturing industry, accounting for 10 percent of manufacturing shipments and valued at $538 billion in 2006. The U.S. Department of Commerce defines food manufacturing as an industry that “transforms livestock and agricultural products into products for intermediate or final consumption.”1 Although the definition of processing may include minimal manipulation, such as cutting meat or slicing fresh produce, the term “processed foods” is most closely associated with more complex products, such as baked goods, canned soups, and frozen meals. Restaurant foods and food served by commercial foodservice operations are considered in the following sections.
Table 6-1 shows the wholesale value of shipments for various food categories. To produce these goods, the food manufacturing industry employed 1,476,300 people as of September 2009.2 There are approximately 31,000 food and beverage processing plants in the United States; however, most of the output of the processed food industry is derived from a relatively
|
1 |
Available online: http://www.trade.gov/td/ocg/report08_processedfoods.pdf (accessed July 20, 2009). |
|
2 |
Available online: http://www.bls.gov/iag/tgs/iag311.htm#workforce (accessed October 12, 2009). |
TABLE 6-1 Value of Shipments by the U.S. Food Manufacturing Industry in 2006
|
Type of Shipment |
Value (billions of U.S. dollars) |
|
Meat |
145 |
|
Dairy |
69 |
|
Other food |
71 |
|
Grain and oilseed milling |
52 |
|
Fruit, vegetable, and specialty food |
54 |
|
Bakeries and tortilla |
49 |
|
Sugar and confectionery |
28 |
|
Seafood |
10 |
|
SOURCE: U.S. Department of Commerce Processed Food Outlook, 2008. Available online: http://www.trade.gov/td/ocg/report08_processedfoods.pdf (accessed July 20, 2009). |
|
small number of large manufacturing plants. Large plants (100 or more employees) comprised only 12 percent of all processing plants in 2005, yet produced 77 percent of products by value. Small plants (1–19 employees) comprised 69 percent of all plants in 2005, while producing only 4 percent of products by value.3 Further, the size of the domestic manufacturing system does not provide a complete picture because substantial amounts of the food sold for consumption in the United States are processed overseas. In 2007, more than $60 billion in consumer-ready processed foods were imported, an increase from approximately $30 billion in 1998. Canada, the European Union, Mexico, and China were the top four exporters of these products (Brooks et al., 2009). In addition, many ingredients for foods processed in the United States are imported.4
Table 6-2 lists the top 20 food processors in the United States and Canada on the basis of food sales in 2008. The top food manufacturers in the United States are multinationals that create and sell a variety of products under numerous national brand names. National brands are typically those that are well known and advertised, and most have strong customer loyalty.5 In addition to large multinationals, thousands of small- and medium-sized companies make products that are sold nationally or regionally. For example, it is estimated that the average supermarket stocks products from more than 16,000 food processing companies (Harris et al., 2002), many of which produce far fewer products than large multinationals. Both large
|
3 |
Available online: http://ers.usda.gov/Briefing/FoodMarketingSystem/processing.htm (accessed August 1, 2009). |
|
4 |
Available online: http://www.foodprocessing.com/articles/2008/037.html (accessed November 11, 2009). |
|
5 |
Available online: http://www.fmi.org/glossary/index.cfm (accessed October 12, 2009). |
TABLE 6-2 Top Food Processors in the United States and Canada
|
Company Name |
2008 Food Sales (millions of U.S. dollars) |
|
Nestlé |
26,477 |
|
Tyson Foods Inc. |
26,325 |
|
PepsiCo Inc. |
25,346 |
|
Kraft Foods Inc. |
23,956 |
|
Anheuser-Busch InBev |
15,571 |
|
Dean Foods Co. |
12,455 |
|
General Mills Inc. |
12,100 |
|
Smithfield Foods Inc. |
10,726 |
|
Kellogg Co. |
8,457 |
|
Coca-Cola Co. |
8,205 |
|
ConAgra Foods Inc. |
8,031 |
|
Pilgrim’s Pride Corp. |
8,025 |
|
JBS USA |
8,000 |
|
Dole Food Co. Inc. |
7,620 |
|
Mars Inc. |
7,000 |
|
Sara Lee Corp. |
6,828 |
|
Hormel Foods Corp. |
6,755 |
|
Unilever North America |
6,647 |
|
Saputo Inc. |
5,793 |
|
Dr Pepper Snapple Group |
5,710 |
|
SOURCE: Food Processing, 2009. |
|
and small manufacturers produce private label products for retailers and products for the restaurant/foodservice sector in addition to well-known brand name products.
Private label products are those sold under retailer brands.6 On average, private label goods account for 16 percent of supermarket sales (Leader and Cuthill, 2008), but the dominance of such products varies greatly by food category. Although still less prevalent than brand name products, private label products are an important component of the processed food supply, especially given their current rate of growth, which is higher than that of national brand name products (Martinez, 2007).
Overall, the U.S. food manufacturing sector can be characterized as having a multitude of players of varied sizes. The sector ranges from large multinationals selling brand name and private label products in a range of food categories to small processing plants with only a few employees to produce a single regional brand or product. As discussed later, this land-
|
6 |
Available online: http://www.plmainternational.com/en/private_label_en3.htm (accessed July 31, 2009). |
scape creates both challenges and opportunities for reducing the sodium content of the U.S. food supply.
Characteristics of the Food Retailing Industry
Food retailers are increasingly important in the food environment, not only because of their longstanding role as key distributors for and promoters of processed foods, but also because their increasing concentration and data-gathering technologies have given them the ability to influence the types of products developed by manufacturers. Over the past decade, the food retail sector has seen dramatic changes driven by the growth of non-traditional food retailers such as big box supercenters (Martinez, 2007) and changes in technology that have revolutionized sales tracking (Leader and Cuthill, 2008). Supercenters (e.g., Wal-Mart, Super Target) and warehouse clubs (e.g., Costco, BJ’s) increased their shares of food-at-home expenditures from 4 percent in 1994 to 17 percent in 2005 at the expense of traditional food retailers (Martinez, 2007). Wal-Mart alone increased its number of supercenters from 672 U.S. stores in 1995 to 2,349 in 2005 (Martinez, 2007). Table 6-3 shows the share of food-at-home expenditures in 2005 by outlet type, and a list of the top 10 food retailers in the United States and Canada and their 2008 sales is provided in Table 6-4.7
Supermarkets commonly carry 30,000 to 40,000 stock keeping units (or distinguishable products) (Leader and Cuthill, 2008) but space remains limited, even in the largest of retailers. Convenience stores, drugstores, and dollar stores are also important parts of the food retailing industry. These retailers have more limited offerings than supermarkets, but have expanded their food offerings in recent years (Martinez, 2007).
Because of their purchasing power, large retailers gained the ability to influence the types of products produced by food manufacturers by determining which products will reach the limited space on retail shelves (Martinez, 2007). The introduction of checkout scanners and automated inventory control has given retailers powerful tools for determining which items sell best and, in turn, helped retailers determine which products they are willing to sell. With thousands of food products introduced to the market each year, products must compete for limited space on retail shelves, and manufacturers must develop products that will generate high profits for retailers in order to stay in the marketplace (Leader and Cuthill, 2008). To convince retailers that a new product should be carried, manufacturers often give them detailed sales pitches, including information on expected
|
7 |
Available online: http://supermarketnews.com/profiles/top75/2009-top-75/ (accessed July 31, 2009). |
TABLE 6-3 Share of Food-at-Home Expenditures by Type of Outlet, 2005
|
Type of Outlet |
Percentage |
|
Traditional Grocery Retailers |
|
|
Supermarkets |
58.2 |
|
Convenience stores |
2.9 |
|
Other grocery stores |
3.6 |
|
Specialty food stores |
2.7 |
|
Nontraditional Grocery Retailers |
|
|
Supercenters (e.g., Wal-Mart, Super Target, Super Kmart, Meijer, Fred Meyer) and warehouse clubs (e.g., Costco, Sam’s Club, BJ’s) |
17.1 |
|
Mass merchandisers (e.g., traditional Wal-Mart, Target, and Kmart stores) |
1.8 |
|
Other stores (e.g., Walgreens, Dollar General) |
8.7 |
|
Home-delivered and mail order |
4.0 |
|
SOURCE: Martinez, 2007. |
|
TABLE 6-4 Top 10 Retailers in the United States and Canada
|
Company Name |
2008 Sales (billions of U.S. dollars) |
|
Wal-Mart Stores |
258.5 |
|
Kroger Co. |
77.2 |
|
Costco Wholesale Corp. |
72.5 |
|
Supervalu |
45.0 |
|
Safeway |
44.8 |
|
Loblaw Cos. |
31.5 |
|
Publix Super Markets |
24.0 |
|
Ahold USA |
21.8 |
|
Delhaize America |
19.2 |
|
C&S Wholesale Grocers |
19.0 |
|
NOTE: Sales volume includes revenues from both food and non-food merchandise in North America. SOURCE: Supermarket News, 2009. Available online: http://supermarketnews.com/profiles/top75/2009-top-75/ (accessed July 31, 2009). |
|
sales, marketing plans, and consumer research on the product category (FTC, 2003).
Retailers also often control what products are sold and where they are placed on retail shelves by creating slotting fees. Slotting fees are one-time payments made by food processors to retailers in exchange for placement of new products on store shelves (FTC, 2003). Some manufacturers are charged as much as $40,000 per store to stock a new food item (Desiraju, 2001).
Some retailers have also created programs to pressure manufacturers into making changes in the product characteristics of the items they sell. A recent example is Wal-Mart’s work to encourage suppliers to improve the sustainability of product packaging.8 Although not from the United States, another example is the requirement that ASDA supermarkets (which are owned by Wal-Mart) in the United Kingdom placed on their private label manufacturers to meet certain standards for fat, saturated fat, sugar, and salt in their products and to remove artificial colors and flavors (Hattersley, 2009).
Because a relatively small number of retailers are responsible for a large volume of processed foods sales, they can be the gatekeeper to new product success. If manufacturers are unable to convince major retailers that a new or reformulated product will appeal to consumers or if the company cannot safely take the risk of paying high slotting fees, its product has little chance of succeeding in the marketplace. These factors have become a major consideration in the development and reformulation of processed foods.
Product Development Process
In 2005, 18,722 new food and beverage products were introduced by food manufacturers (Martinez, 2007). The breakdown of these products by type is provided in Table 6-5.
To create new products, the largest processed food manufacturers have
TABLE 6-5 New Product Introductions in 2005
|
Type of Product |
Percentage of Total |
|
Candy, gum, snacks |
27.7 |
|
Beverages |
25.1 |
|
Condiments |
10.2 |
|
Dairy |
7.2 |
|
Baking ingredients |
6.0 |
|
Processed meat |
5.0 |
|
Meals and entrées |
4.7 |
|
Bakery foods |
4.1 |
|
Fruit and vegetables |
3.4 |
|
Pasta and rice |
2.2 |
|
Soups |
1.6 |
|
Cereals |
1.4 |
|
Desserts |
0.8 |
|
SOURCE: Martinez, 2007. |
|
|
8 |
Available online: http://walmartstores.com/Sustainability/9125.aspx (accessed October 12, 2009). |
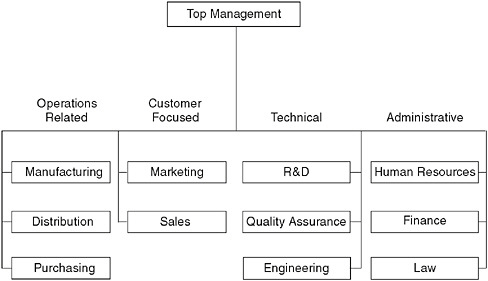
FIGURE 6-1 Business groups involved with product development.
SOURCE: Adapted from Beck, 2002. In Organizing human resources: By project? By discipline? As a matrix? Copyright © 2002 Iowa State Press. Reproduced with permission of John Wiley & Sons, Inc.
large groups of employees with a range of skills. As shown in Figure 6-1, these groups include employees with operations, customer, technical, and administrative expertise, including market researchers, food scientists, nutritionists, engineers, chemists, and microbiologists. Research and development teams within these companies are involved in both developing new products and reformulating existing products. Multinational manufacturers may conduct some of their research and development activities at international research centers (Nestle, 2007).
In smaller companies, research and development staff may be limited (Beck, 2002). For these manufacturers, a single scientist may be responsible for multiple functions.
All sizes of food manufacturers are relying more on ingredient suppliers, external contract developers, and consultants to be part of the product development process (Beckley et al., 2007; Thomas, 2007). These groups are useful in providing expertise that may otherwise be lacking in the company or conducting research at a lower cost than the company could do in-house (Beckley et al., 2007; Fuller, 2005). Consultants may be from private companies or from universities that see consulting as a useful way to apply their research and to generate revenues (Fuller, 2005). State Coop-
erative Extension Services also provide expertise, particularly to small food processors and entrepreneurs.9
The reasons companies undergo the costly and time-consuming process of new product development include the following (Fuller, 2005):10
-
New or reformulated products are needed for manufacturers to maintain and expand their business as products end their life cycle and suffer from reduced sales;
-
New market demands arise (e.g., more demand for healthful products);
-
New technologies may make possible the creation of new products that were not feasible in the past;
-
Changes in government regulations and policies may make it necessary to reformulate existing products or create incentives for new product development and reformulation (e.g., to meet requirements for health or content claims); and
-
New or reformulated products are needed to respond to new or improved competitive products.
Steps to Develop New Products and Reformulate Existing Products
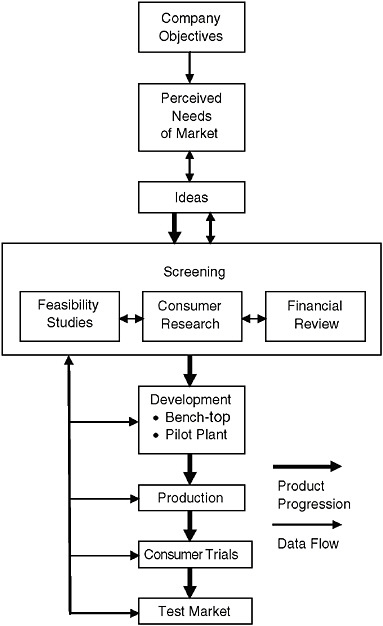
The product development process generally involves a series of steps that are depicted in Figure 6-2, although the ordering of initial steps may vary from project to project.
Valdovinos (2009) more simply categorized this process into four steps: (1) idea generation; (2) concept development; (3) plan and design; and (4) launch and produce. A more detailed description of these steps is provided below.
Idea generation Ideas for new products come from a variety of internal and external sources. Examples of these sources are provided in Box 6-1. Large companies have marketing teams devoted to searching consumer data and gathering information on the existing food market. This work is intended to produce insights into how to fill consumer needs and, in the process, generate successful products (Straus, 2009). Marketing, business, and research and development personnel work to brainstorm ideas and determine which ideas are promising (Straus, 2009; Thomas, 2007; Topp, 2007).
Several considerations are needed in screening ideas. Questions asked
|
9 |
Available online: http://www.uga.edu/nchfp/business/starting_business.html#ceslinks and http://www.ces.ncsu.edu/index.php?page=foodsafetyprocessing (accessed October 15, 2009). |
|
10 |
Personal communication, J. Ruff, Kraft Foods (retired), October 2009. |
|
BOX 6-1 Sources of Product Ideas Internal Sources
External Sources
SOURCES: Straus, 2009; Topp, 2007. |
include the following (Heyhoe, 2002; Moskowitz et al., 2009; Straus, 2009):
-
How closely does the new product idea fit with the corporation’s strength in the market (i.e., does the company have closely related products that are successful)?
-
How technically feasible is the project?
-
How well can the product idea be protected from competition (i.e., can patents or commercial secrets ensure that competitors will be unable to easily copy the product)?
-
What capital expenditures will be needed?
-
What is the expected life of the product (1 year, 3–5 years, etc.)?
-
What is the spinoff potential of the product for line extensions and related products?
-
How well do consumers rate the product compared to products with known success?
Another consideration that has emerged with greater importance in recent years is determining what will influence a retailer to stock the product. Retailers are the first customers and their acceptance is needed (Topp, 2007) because their willingness to stock a new product will be a major factor in its success (van Boekel, 2009).
With the above questions in mind, business teams can estimate the costs of production and the potential profit the product might generate and then
decide which product ideas are most likely to be successful in moving forward. When project ideas are abandoned, it is usually due to low projected profit margins (Topp, 2007).
Concept development Once a product concept is chosen for further development, benchtop product development begins. Benchtop work includes creating prototypes and making initial plans for processing parameters (Kramer, 2002). Knowledge of food science, engineering, chemistry, microbiology, and packaging is used to create prototypes that can meet the product concept within the constraints of modern food processing and without exceeding the intended cost of the product. As prototypes are developed, the most promising formulations may be tested for mass production using pilot plants.
Sensory scientists and marketing groups are employed to determine how the prototypes are received by consumers, using both focus groups to test how well consumers receive the product concept and sensory panel testing to determine how well consumers like the taste and appearance of the product (Cox and Delaney, 2009; Moskowitz, 2009). Based on focus group and sensory study feedback, prototypes may be adjusted to meet consumer desires (Kramer, 2002). Shelf life studies are also conducted to ensure product quality and safety (Saguy and Peleg, 2009).
Plan and design As prototypes are finalized, plans are made for large-scale manufacturing. Company engineers and business units determine what facilities are needed and whether the product should be produced by company-owned plants or contracted co-packers (Weinstein, 2002). Purchasing units within the company work to procure the needed ingredients and packaging materials (Fuller, 2005). Business and sales groups make plans for the product launch, including plans for advertising and target markets (de la Huerga and Topp, 2007). In addition, sales staff often meet with retailers to pitch new products,11 and regulatory teams ensure that the product and its packaging comply with government standards (Fuller, 2005). If a new product meets the definition of an acidified food or low-acid canned food, federal regulations require processors to file their processes with the Food and Drug Administration (FDA) for each product, product style, container size and type, and processing method.12 Replacement process forms must be filed if a processor makes changes to a process, the container size that will be used for a product, or factors critical to the adequacy of the process
(such as temperature changes or product formulation).13 Such requirements are an important step in helping to ensure the safety of such foods.
Launch and produce The final launch and production step may seem as though it is the final step in product development; however, most companies continue to test products after an initial launch and may make additional changes. To reduce the risk of large product failures in the marketplace, some firms choose to initially launch the product in a test market. The degree of success in the test market may lead to a larger rollout or may identify problems in the product that need further research and development (Fuller, 2005).
Further, companies are constantly working to reformulate products for a variety of purposes, including the following (Fuller, 2005):14
-
to improve sensory or nutritional characteristics (including the removal of ingredients seen by consumers as undesirable due to media coverage and new health information);
-
to overcome problems with ingredient availability;
-
to reduce ingredient or production costs;
-
to incorporate new technologies;
-
to create a new market niche for the product;
-
to maintain the legal marketability of products when the legal status of an ingredient is changed; and
-
to meet nutritional health claim or other criteria to allow for front-of-package labeling (Webster, 2009).
Today, the primary driver of continued industry profitability is competition with others in the market on price, and reducing processing and ingredient costs is the primary means of staying competitive (Watzke and German, 2009). To reformulate existing products, issues similar to those that factor into new product development must be considered. In addition, companies test products to ensure that the reformulated product is considered by consumers to be of equal or better quality than the original version so as not to lose market share, according to a participant in the public information-gathering workshop held by the committee (March 30, 2009).
|
13 |
Available online: http://www.fda.gov/Food/FoodSafety/Product-SpecificInformation/AcidifiedLow-AcidCannedFoods/EstablishmentRegistrationThermalProcessFiling/Instructions/ucm125810.htm (accessed January 21, 2010). |
|
14 |
Personal communication, J. Ruff, Kraft Foods (retired), October 2009. |
Differences in the Product Development Process for Smaller Companies and Private Label Foods
It is important to note that the product development process for smaller companies may be different from the processes used by large manufacturers. Smaller companies generally have limited resources for new product idea generation and testing and may have limited expertise and budgets for cutting-edge scientific research. In addition, advertising budgets may be non-existent, and product sales may be limited to smaller retailers due to the prohibitive expense of slotting fees to sell products in larger retailers (Fuller, 2005).
Product development for private label products also differs from the product development carried out for large national brands. Most private label foods are produced by contracted manufacturers or retailer co-ops, although a few retailers own their manufacturing plants (Leader and Cuthill, 2008). At times, processors of brand name products will also make private label products to utilize excess plant capacity (Ward et al., 2002). Typically, private label products aim to copy product concepts that were developed initially by brand name manufacturers. This allows the products to be produced with fewer research and development costs and allows retailers to sell items for which the product concept has already been tested as successful in the marketplace (Leader and Cuthill, 2008). This marketing strategy, along with the absence of slotting fees and lower sales force and advertising costs, allows private label products to be sold at lower prices than brand name products. On average, retailers generate 25–30 percent more profits on sales of private label products than brand name products (Private eyes, 2007).
Challenges to Introducing New or Reformulated Products with Reduced Sodium
There are a number of challenges to reducing the sodium content of processed foods. As mentioned in the description of the role of sodium in foods (Chapters 3 and 4), product taste, shelf life and safety, and other physical attributes of foods can change and become unacceptable if too much sodium is removed and not replaced with other functional ingredients. In addition, costs of reformulation are seen as prohibitive for some products. Further, certain types of products, such as organic products, may be limited in the types of sodium replacements that are allowed for use.15 Of these challenges, food industry participants in the committee’s public information-gathering workshop (March 30, 2009) cited concerns about
product taste and reformulation expenses as the main reasons for the lack of product reformulation.
Research has found that many consumers cite taste above other concerns, such as price and healthfulness, when making food choices (IFIC, 2008). Therefore, according to food industry representatives at the public information-gathering workshop held by the committee (March 30, 2009), manufacturers want to ensure that their products taste better than those of their competitors and that reformulated products maintain their likability so that market share is not lost to competitors who have not made similar changes.
Food industry representatives at the public workshop also said manufacturers fear that sodium reductions that create changes in product taste will result in a loss of market share to competitors’ more flavorful products. In addition, manufacturers have experienced product failures in past efforts to market foods with claims of lowered sodium content. These products may have failed for a number of reasons, including the unwillingness of consumers to make the trade-off between the taste of these reformulated products and health, given the lack of immediate health results from consuming these foods (Wolf, 2009).
Cost of reformulation is another obstacle. While reformulation is a common event, it is usually done to reduce the cost of producing foods, and the savings derived from production cost reductions pay for the costs of research and development to make the reformulation possible (Kramer, 2002). Salt is a relatively inexpensive ingredient, so there may be few profits derived from reformulation. Further, if simple salt removal is insufficient, salt substitutes and other alternative ingredients may be needed, resulting in high reformulation costs, since these ingredients are usually more expensive than salt.16 The same may be true for other sodium-containing compounds and reduction technologies (Ball et al., 2002; Cauvain, 2003). These factors create little financial incentive for manufacturers to take on the time-consuming and costly process of reformulation unless there are other market-driven reasons, such as demand from consumers or other market or social forces. New product development with lower sodium at baseline, however, may be less costly than reformulating existing products with established consumer taste expectations.
The Industry’s Efforts to Reduce Sodium in Foods
The processed food and retailing industries have taken steps toward encouraging reductions in sodium intake. Other than complying with label-
|
16 |
Available online: http://www.culinologyonline.com/articles/healthy-r-d-perspectives.html (accessed October 15, 2009). |
ing regulations, which are described further in Chapter 7, such efforts have been voluntary and not adopted by all. Types of efforts include:
-
marketing lower-sodium foods with label claims;
-
marketing foods that have been silently reformulated to lower their sodium content;
-
funding research to discover sodium substitutes and enhancers and other new technologies for lowering sodium in foods;
-
providing information on sodium and healthy diets on packaging, in brochures, in advertisements, and on websites; and
-
providing point-of-purchase nutrition rating information.
It is notable that the industry has used two different approaches to reduce the sodium content of the American food supply through reformulating existing products. The first approach is to make changes in the sodium content of products in order for those products to qualify for sodium content claims and then to market these items to consumers interested in reduced-sodium products. As previously discussed in Chapter 2, initial attempts to use low- and reduced-sodium claims did not see overwhelming success in the marketplace. This may be because consumers associate poor taste with low- and reduced-sodium foods (Heidolph, 2008; IFIC, 2009), which may be similar to the way that consumers demonstrated lowered expectations of the sensory properties of reduced-fat products (Kahkonen and Tuorila, 1998; Kahkonen et al., 1999; Tuorila et al., 1994.) Nonetheless, Campbell’s (as described in Box 6-2) has recently used the claims approach to market a number of lower-sodium products and sees this approach as successful, according to a participant at the committee’s public information-gathering workshop (March 30, 2009).
The second approach is to make gradual reductions that generally go unadvertised to the general public. Such reductions are commonly called “silent reductions” and are designed to lower sodium gradually so that regular consumers of the product will not notice the change and can slowly ratchet down their taste preferences for salt in the product (Wrick, 2009). As stated by industry representatives at the committee’s public information-gathering workshop (March 30, 2009), many of the companies making silent reductions do so in hopes of avoiding losses in market share that sometimes occurred in past attempts to advertise reductions.
Given that some sodium reductions have occurred silently, it is difficult to produce a comprehensive review of the extent of sodium reductions over the past few decades. To fully catalogue all reductions that have taken place over the past 40 years, the industry would have to supply historical formulation information (especially for periods before sodium labeling was mandatory). While silent reductions have taken place for some foods, it ap-
pears that the reductions have not had a far reach across the food supply. The Center for Science in the Public Interest (CSPI), a consumer advocacy group, revealed that its tracking survey carried out since 1983 demonstrates only a 5 percent decrease in the sodium content of the foods tracked for the period 1983–2004 (CSPI, 2008).
In contrast to information about sodium content reduction, more information is available for the number of foods that have been marketed with a sodium content claim. As discussed in Chapter 2, the percentage of products with sodium content claims fluctuated between 5 and 13 percent from the early 1990s to 2007.17 Throughout much of the 1990s, the number of new products introduced with sodium content claims dropped (CSPI, 2005). This decrease in the number of products with such claims may have been due to industry concerns that consumers viewed foods with a reduced-sodium content claim in a negative light, but it may have also been a result of the industry turning its attention to other nutrients of concern, such as fat. There has been a slight rebound in the number of products with sodium content claims in recent years, which may be a result of increased attention to sodium intake and/or more recent food science innovations that have made further reductions possible.
With renewed attention to salt and sodium reduction around the world, food manufacturers have created sodium reduction initiatives in recent years. These initiatives have been driven primarily by pressure from international initiatives to reduce sodium, such as the work taking place in the United Kingdom, petitions to FDA to reconsider the regulatory status of salt, and, most recently, the National Salt Reduction Initiative coordinated by New York City. These initiatives are described further in Chapters 2, 7, and 8 and Appendixes B and G. Examples of industry efforts in recent years are provided in Box 6-2. This list is by no means comprehensive and reflects only publicly available information, but it does provide a sample of the types of efforts being undertaken with renewed interest in sodium.
To aid their ability to make advertised and silent reductions in the sodium content of their products, leading food manufacturers have invested in research to find new technologies. Research includes work in-house as well as funding for universities, research centers, and ingredient company projects (Nestle Ltd., 2007).18 As described in Chapter 3 and in this chapter, a variety of technologies have been developed to reduce levels of salt and other sodium-containing ingredients. Research to find replacements for sodium has not been as successful as research to find replacements for other nutritional components of health concern. For example, the sodium-reducing
|
17 |
Personal communication, M. Brandt, FDA, December 17, 2008. |
|
18 |
Available online: http://www.senomyx.com/collaborations/ and http://www.monell.org/ (accessed October 27, 2009). |
|
BOX 6-2 Examples of Recent Efforts by the Processed Food Industry to Reduce Sodium Intake Campbell’s expanded the number of foods marketed as lower in sodium from 24 in 2005 to 100 in 2009. Reductions included lowering sodium by 32 percent in its original tomato soup and offering 11 varieties of Pepperidge Farm reduced- or low-sodium breads. Efforts have also included reducing sodium levels in 45 soups (Khoo, 2009) and 100 percent of the V8 beverage portfolioa to those required for a healthy claim (≤ 480 mg) and reducing the sodium content of existing Healthy Request soup lines from 480 to 410 mg per serving.b ConAgra reduced the annual sodium usage in its products by 2.8 million pounds over a period of several years, ending in 2007.c More recently, ConAgra announced plans to cut its overall sodium use by 20 percent by 2015, by reducing sodium in more than 160 products.d General Mills instituted a sodium reduction plan across all of its business categories and has silently reduced the sodium levels in Progresso, Hamburger Helper, and Cheerios products (Wiemer, 2009), and has six reduced-sodium soups with 450–480 mg sodium per serving.e In its 2010 Corporate Social Responsibility Report, General Mills pledged to further reduce sodium in more than 600 of its products by 20 percent, on average, by 2015. The sodium reduction initiative represents about 40 percent of its products and covers 10 product categories.f Kraft announced in March 2010 that it plans to reduce sodium by an average of 10 percent across its North American portfolio over the next 2 years, including reductions up to 20 percent in some products. Some sodium reductions have already occurred; since 2008 two Kraft Light salad dressings were reduced by more than 30 percent and all Oscar Mayer white turkey deli meat products by at least 15 percent. The company also has more than 100 products that are low, reduced, or no sodium.g Nestlé set a worldwide policy to make reductions in all products with sodium contents greater than 100 mg/100 calories. Under this initiative, plans have been made to reduce sodium by 25 percent in each of these products over a 5-year period. Thus far, more than 15 million pounds of salt have been removed from products worldwide (Fern, 2009). |
technologies invented or discovered thus far are not as useful as artificial sweeteners that can be used in a wide variety of applications to completely replace sugar. The lack of similar discoveries for sodium may have slowed the progress in developing more reduced-sodium products, although sodium reductions are possible without the use of salt replacements.
Food manufacturers and retailers have also directed their efforts toward providing health information about sodium to consumers. This is usually intended to lead consumers to purchase the manufacturer’s lower-sodium products, but such efforts can also be a useful means of distributing health
|
Pepsi introduced a line of Pinch of Salt Frito Lay products in 2008 that contain 30–50 percent less sodium than the original products.h However, these products were discontinued shortly after their introduction.i Sara Lee at the end of 2009 announced its commitment to reduce salt, by an average of 20 percent over the next 5 years, in key product categories including fresh bread, hot dogs, lunch meat, breakfast foods, and cooked sausage. This effort will be in addition to the 266,000 pounds of sodium that the company has already removed from its products. The company reports that the approach will be stepwise and include periodic reassessment of goals.j Unilever created a worldwide Nutrition Enhancement Program to reduce levels of sodium and other nutrients of concern. Thus far, the program has removed 9,100 tons of salt from products around the world, and there are plans to reduce sodium in 22,000 products.k According to a representative at the committee’s public information-gathering session, reductions have included 25 percent in Knorr Side Dishes and over 40 percent (of silent reductions) in Ragu Old World Style pasta sauce (Balentine, 2009). |
information to consumers. Historically, information has been included in advertisements, brochures, and product packaging. In more recent years, companies such as Campbell’s Soup, Kellogg’s, and General Mills have added information on sodium and health to their websites or sponsored more general nutrition and wellness websites.19 Packaged food manufacturers have also provided sodium content information on the Nutrition Facts
|
19 |
Available online: http://www.campbellwellness.com/subcategory.aspx?subcatid=3, http://www.kelloggsnutrition.com/know-nutrition/sodium.html, and http://www.eatbetteramerica.com/diet-nutrition/heart-health/try-a-sodium-shake-down.aspx (accessed October 12, 2009). |
panel for many years as required by law. Retailers have also long played a role in distributing health information to customers, such as through store magazines and product pamphlets. Health and sodium content information is intended to educate consumers and provide them with tools they can use to help them reduce their sodium intake. However, as described in Chapter 2, such knowledge and tools like the Nutrition Facts panel have remained insufficient in reducing sodium content levels to those recommended by the Dietary Guidelines for Americans.
In recent years, some food manufacturers and retailers have begun using front-of-package and point-of-purchase nutrition rating systems to help consumers identify more healthful foods. Rating systems, including Smart Choices, which has postponed active operations,20 Smart Spot,21 Heart Check Mark,22 the Choices Stamp,23 and Sensible Solutions,24 have been introduced by several manufacturers. For most front-of-package systems currently on the market, products receive only a logo indicating that they are a more healthful choice because certain nutrient requirements are met. Some programs have been developed by manufacturers to help market their own products. Other systems, such as the Heart Check Mark and Smart Choices, have been developed by outside organizations that license the use of the rating system to any manufacturer if the product meets nutritional requirements and the manufacturer pays a fee for its use.
Similarly, some retailers have recently begun efforts to help their customers make more healthful food selections by using nutrition scoring systems. Two of the systems being introduced to the market are NuVal and Guiding Stars. Both of these systems score foods based on a number of nutrition criteria, including sodium, and place that product’s score along with its price on the product shelf tag.25,26 These systems are different from front-of-package rating systems in that they are intended to rate all food products sold by retailers. While the primary goal of this system is
|
20 |
Available online: http://www.smartchoicesprogram.org/index.html (accessed January 27, 2010). |
|
21 |
Available online: http://www.pepsico.com/Purpose/Health-and-Wellness/Smart-Spot.html (accessed October 15, 2009). |
|
22 |
Available online: http://www.americanheart.org/presenter.jhtml?identifier=2115 (accessed October 12, 2009). |
|
23 |
Available online: http://www.choicesinternational.org/index.php?option=com_content&task=view&id=30&Itemid=53 (accessed October 13, 2009). |
|
24 |
Available online: http://www.kraftfoods.com/kf/healthyliving/sensiblesolution/sensiblesolution_landing.aspx (accessed October 13, 2009). |
|
25 |
Available online: http://www.nuval.com/How (accessed February 11, 2010). |
|
26 |
Available online: http://www.guidingstars.com/what-is-guiding-stars/how-it-works/ (accessed February 11, 2010). |
to educate consumers, a side benefit may be efforts by manufacturers to reformulate foods in order to achieve a higher rating.27
Front-of-package and shelf tag scoring systems vary in their thresholds and scoring methods for the content of sodium and other nutrients, which has created debate within the nutrition community as to whether the nutrient criteria are adequate. There have also been questions about the effectiveness of these programs in helping consumers make positive dietary changes. As a result, FDA recently announced steps to address the use of front-of-package and shelf label claims concerning the nutritional quality of a food.28
It is clear that food manufacturers and retailers have taken some steps to help the American public reduce sodium intake; however, such efforts have been limited. Not all companies have dedicated resources to this concern, and the intensity of sodium reduction efforts appears to have fluctuated over time.
PRODUCTION AND DELIVERY OF RESTAURANT/FOODSERVICE FOODS WITHIN THE FOOD ENVIRONMENT
Characteristics of the Restaurant/Foodservice Industry
The restaurant/foodservice industry plays a major role in providing food to the U.S. population. As described in Chapter 5, the amount of food eaten away from home has grown in recent years and now accounts for 48.5 percent of total food expenditures29 in the United States and one-third of the calories consumed by Americans (Lin et al., 1999). Estimates from the National Restaurant Association indicate that in 2009, more than 130 million Americans per day consumed restaurant/foodservice items from 945,000 restaurant/foodservice locations throughout the country.30
The U.S. Department of Agriculture (USDA) defines foodservice as the dispensing of prepared meals and snacks intended for on-premise or immediate consumption (Harris et al., 2002). The committee considers this definition to include “take-out foods” that are consumed in the home or another location outside the restaurant/foodservice establishment and to
|
27 |
Available online: http://www.examiner.com/x-1943-Fitness-Examiner~y2009m7d13-GuidingStars?cid=exrss-Fitness-Examiner and http://www.journalgazette.net/article/20090503/NEWS10/305039938/1031/BIZ (accessed October 13, 2009). |
|
28 |
Available online: http://www.fda.gov/Food/LabelingNutrition/LabelClaims/ucm187369.htm (accessed October 27, 2009). |
|
29 |
Available online: http://www.ers.usda.gov/Briefing/CPIFoodAndExpenditures/Data/Expenditures_tables/table10.htm (accessed July 30, 2009). |
|
30 |
Available online: http://www.restaurant.org/pdfs/research/2009Factbook.pdf (accessed June 28, 2009). |
|
BOX 6-3 Types of Restaurant/Foodservice Operations as Classified by the National Restaurant Association Full-service restaurants
Limited service (quick-service) restaurants
Cafeterias, grill-buffets, buffets Social caterers Snack and nonalcoholic beverage bars Bars and taverns Foodservice contractors Mobile food services SOURCE: Personal Communication, M. Sommers, National Restaurant Association, Washington, DC, September 22, 2009. |
exclude foods purchased at supermarkets, grocery stores, and other retail establishments, except for “fresh, prepared, deli foods” purchased from retailers or foods from quick-service establishments located within retail stores.
Restaurant/foodservice operations range from those that serve foods consumed on premise to those that sell ready-prepared foods for “carry out,” and from multibillion-dollar restaurant chains and contract food-service companies to upscale dining restaurants as well as independent “mom-and-pop” eateries and mobile wagons on street corners. Box 6-3 lists restaurant/foodservice operations as classified by the National Restaurant Association.31 Definitions of each of these restaurant/foodservice categories are provided in the glossary (Appendix A).
Restaurant/foodservice operations include both commercial and non-commercial establishments. As shown in Figure 6-3, the majority of restaurant/foodservice sales in the United States is by commercial establishments (National Restaurant Association, 2008). The leading restaurant
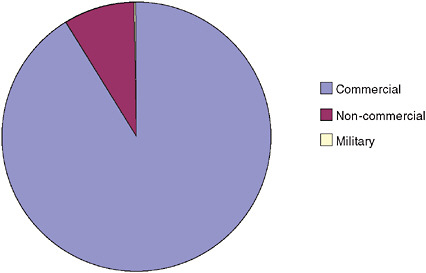
FIGURE 6-3 Restaurant/foodservice sales in 2008.
SOURCE: National Restaurant Association, 2008.
TABLE 6-6 Top Restaurant/Foodservice Companies
|
Company Name |
2005 Sales (billions of U.S. dollars) |
|
McDonald’s Corp. |
26.9 |
|
Yum! Brands |
17.4 |
|
Wendy’s International, Inc. |
8.0 |
|
Burger King |
7.9 |
|
Doctor’s Associates, Inc. |
7.2 |
|
Starbucks Corp. |
5.8 |
|
Darden Restaurants, Inc. |
4.8 |
|
Allied Domecq |
4.5 |
|
Applebee’s International, Inc. |
4.2 |
|
Brinker International |
4.2 |
|
SOURCE: Martinez, 2007. |
|
companies, as reported by Martinez (2007) on the basis of sales, are shown in Table 6-6, with the top companies reflecting fast food operations. According to USDA estimates, full-service and fast food restaurants account for more than 77 percent of away-from-home food sales.32
Commercial operations are open to the public such as fast food and fine dining restaurants. Commercial operations can be further classified as in-
|
32 |
Available online: http://ers.usda.gov/Briefing/FoodMarketingSystem/foodservice.htm (accessed August 1, 2009). |
dependent or chain establishments (Walker, 2009). Independent operations are not associated with a national or regional brand or name, the owners usually play a role in the day-to-day operations of the facility, and they may have greater flexibility in the types of foods served than do chain restaurants. A company or individual may own multiple independent restaurants, but because each location operates with a different menu or concept for the dining experience, these restaurants are still considered independent establishments. In contrast, chain restaurants are a group of restaurants that have the same name and marketing strategy, and menu items that are generally standardized across locations (Walker, 2009). For these reasons, consumers expect the same food and service regardless of the individual location. According to the National Restaurant Association, 206,000 of the restaurant locations around the country are part of large chains with 20 or more units.33 With multiple locations, chains generally serve far more customers and provide more meals than independent restaurants. While the definition of “restaurants” may vary among groups that track information about the nature of such operations, data from the consumer and retail market research information company NPD Group, as reported by Bassett et al. (2008), suggest that nearly three-quarters of all restaurant “traffic” nationally is represented by fast food chain restaurants.
In contrast to commercial establishments, non-commercial establishments are typically located in or contracted by organizations that are not focused on foodservice as their primary business. These operations include corporate and school cafeterias and foodservice kitchens for health-care facilities (Walker, 2009). Military feeding operations can also be categorized as non-commercial foodservice operations. Generally, non-commercial or institutional foodservice operations provide large quantities of a limited variety of menu options, some of which are not standardized and may be rotated on a daily basis. Some institutions have their own in-house food-service staff; however, it is increasingly common for institutions to contract with a managed services company, such as Sodexo, Compass Group, and Aramark. These companies often cater to thousands of locations with varied food needs (Walker, 2009).
The National Restaurant Association (2008) in its annual sales reports for the entire restaurant/foodservice sector provides data on the basis of more specific subcategories. These include full-service restaurants ($181 billion); limited-service (fast food) restaurants ($157 billion); cafeterias, grill-buffets, and buffets ($5 billion); social caterers ($6 billion); snack and non-alcoholic beverage bars ($20 billion); commercial foodservice contractor/managed services ($38 billion); commercial lodging restaurants
($27 billion); non-commercial restaurant services ($47 billion); and military foodservice ($2 billion). While these data relate to total volume of sales, they cannot be interpreted relative to the number of people consuming food at these locations or the relative contribution each makes to total sodium intake.
Menu and Menu Item Development
Menu and menu item development is part of the operations of any restaurant/foodservice establishment, regardless of its size. Menu development is the process of determining what types of foods will be offered at the establishment (Walker, 2009), and menu items are discrete, prepared foods that are listed on restaurant/foodservice menus with a price. Menu items may include appetizers, entrées, and desserts, as well as “combos,” “sides,” and beverages. A menu or menu item may also include “extras” or “options” for which an additional charge may or may not be made—for example, with multiple sandwich ingredient options or buffet options.
Developing menus and menu items is a complex task in which restaurant/foodservice operators consider multiple, competing concerns, including consumer needs and desires, staff skills, kitchen facilities’ capacity, availability of ingredients, costs of ingredients and production, and nutrient content of foods (Thomas, 2007; Walker and Lundberg, 2005). These concerns and others are shown in Figure 6-4.
Menu development decisions include determining how many items to offer as well as deciding the characteristics of such items (Walker and Lundberg, 2005). For example, decisions may involve determining how many chicken, fish, and vegetarian options to offer or how many fried items to include versus (presumably) more healthful steamed items. Menu expansion to include more offerings can provide consumers with more options that may allow them to make more healthful choices, but it may also result in increased costs and management concerns for the restaurant/foodservice operation (Lattin, 2009). Menu item development is similar to processed food product development, in that it involves research to determine the best amounts and types of ingredient to use, as well as the best preparation techniques. Reformulation of existing menu items to improve nutrition or substitute an ingredient also requires research and development to ensure that the product can be prepared easily and will continue to be liked by consumers.
For independent operations, menu and menu item development decisions are typically made by owners or head chefs, and changes to the menu may occur frequently (Walker and Lundberg, 2005). New menu items can be created from scratch or from completely or partially prepared processed foods. Many menu items, for large and small operations, are assembled
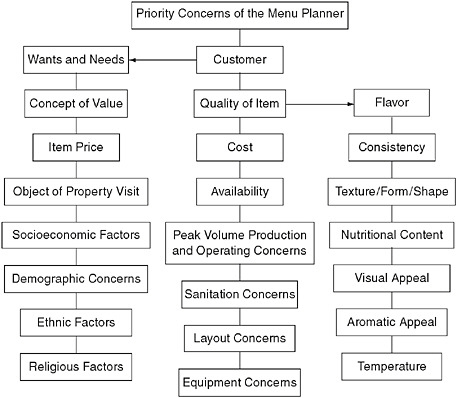
FIGURE 6-4 Priority concerns of the menu planner.
SOURCE: Lattin, 2009. Reprinted with permission.
from ingredients that have already been processed in order to facilitate quick preparation, ensure a uniform product, and reduce the need for skilled labor (Connor and Schiek, 1997). A participant at the committee’s public information-gathering workshop (March 30, 2009) stated that in some cases, these items may be identical to processed foods sold to the public by retailers, but in other cases, these products are specially designed to meet the needs of restaurant/foodservice operations.
For large chains, menu and menu item development are more complex. Like large manufacturers, chains often employ marketing personnel (Lattin, 2009), corporate chefs, nutritionists, and food scientists to develop menus and menu items that will be successful and standardized across all locations (Thomas, 2007). This process often encompasses brainstorming ideas at the chain headquarters, testing the ideas with consumers, developing prototypes, and testing the new item in a limited market area before launching it across the entire chain (Walker and Lundberg, 2005). A recent survey of menu development executives at leading fast food and casual dining res-
taurants indicated that the top concerns when altering menus are how the changes will attract or maintain the customer base and how the changes will affect sales and profits (Glanz et al., 2007).
To develop and supply the exact ingredient or product they desire, large chains go through a product development process that is similar to that used to develop packaged foods for retail sale. In fact, large chains often establish relationships with food processors and suppliers to help develop and manufacture menu items (Connor and Schiek, 1997). For large chains, food processors may even develop proprietary recipes and produce standardized products exclusively for one company (Cobe, 2008). Because consumers expect menu items to have the same tastes, textures, nutrient content, and portion sizes regardless of the location at which they are purchased, chain restaurants work with their contracted manufacturers to create ingredient and preparation specifications to ensure a standard product (Walker and Lundberg, 2005).
Challenges to Introducing New or Reformulated Menu Items with Reduced Sodium
Introducing or changing menu items may be a challenging and time-consuming process regardless of the size of the restaurant/foodservice operation. Changes require efforts to ensure a sufficient supply of ingredients, revisions to printed menus or menu boards, and training for many food preparers with varied education and skill levels. Because of the costs of changing menus and menu items, restaurant/foodservice operations are unlikely to make changes to reduce the sodium content of their offerings unless such items are expected to generate profits (Glanz et al., 2007).
Some menu planners may believe that lower-sodium foods will be unsuccessful. A survey of more than 400 chefs found that only 39 percent believed that foods would taste good if they were designed to meet Dietary Guidelines for Americans recommendations (Reichler and Dalton, 1998). Along the same lines, a survey of menu developers from chains showed that these personnel believe that most customers are seeking an indulgent experience when they consume foods away from home and that the demand for more healthful foods is low. Even for menu planners who are interested in creating more healthful options, fat, calorie, and fruit and vegetable content are more top-of-mind issues than sodium content (Glanz et al., 2007). While redesigning menus and menu items to lower calories or include more fruits and vegetables may have the added benefit of reducing sodium content, this may not be the case for all items. In some cases, sodium content may not be reduced to the same extent or may even increase in the absence of menu planners who are concerned and knowledgeable about its health implications.
A related concern is the widely held reputation of salt among chefs and other food preparers as the preeminent ingredient for enhancing savory flavors (Dornenburg and Page, 2008) and flavors of foods (Nachay, 2008). Food preparers may lack knowledge of health concerns related to sodium (thinking, as many of their customers do, that sodium is a health issue only for certain individuals and therefore best handled on a special request or special menu selection basis) and may lack the skills to reduce sodium using a variety of preparation techniques or alternative flavor strategies.
Education may be useful at all levels of restaurant/foodservice operations to raise awareness of these issues. Trade groups, industry associations, culinary colleges and schools, and public health agencies are seen by menu planners as potentially valuable partners in providing information and tools to improve the health of their offerings (Glanz et al., 2007).
Another challenge for restaurant/foodservice operators related to reducing sodium may be the limited availability of lower-sodium ingredient options. As mentioned earlier, restaurant/foodservice operations use processed foods to reduce both preparation time and the need to train food preparers. Therefore, substantial amounts of sodium may be coming from sources outside of the direct control of the restaurant/foodservice operator. Restaurant/foodservice operations typically purchase foods from foodservice distributors. The foodservice distribution sector is dominated by a few multibillion-dollar companies (e.g., Sysco and U.S. Foodservice).34 Such a concentrated supplier market could limit the restaurant’s ability to procure lower-sodium options if they are not carried by distributors; however, it also offers the ability to target suppliers with education and outreach on the importance of carrying lower-sodium products. For large chains, another challenge is the time delay related to introducing new items. When a new product is introduced by a large number of chain outlets, there can be a spike in demand for ingredients (Connor and Schiek, 1997), and a lag time may be needed for suppliers to produce sufficient quantities to meet this new demand.
Yet another challenge for the restaurant/foodservice industry is the regular practice of aggregating high-sodium, high-flavor ingredients to create memorable taste and flavor experiences for its patrons. Examples are numerous and include such popular sandwiches as the double-bacon cheese-burger and breakfast specials that combine multiple meats and cheeses. Like the supersizing of portions, which is associated with increases in sodium intake, this marketing and menu development strategy will be harder to unwind than to create. Finally, the extent to which the restaurant/foodservice
|
34 |
Available online: http://www.hoovers.com/company/SYSCO_Corporation/rrctyi-1.html and http://www.hoovers.com/company/US_Foodservice_Inc/cfthci-1.html (accessed November 20, 2009). |
industry offers “customized” menu options to its patrons, even in so-called standardized menus of chain restaurants, creates something of a moving target, making it difficult to know exactly what sodium levels patrons are choosing and how to adjust accordingly. Some restaurant/foodservice businesses, such as buffet restaurants or “build-your-own” burrito, sandwich, or salad operations, are nearly completely about options, with just a few suggested combinations to help guide the customer.
The Industry’s Efforts to Reduce Sodium in Foods
The abovementioned challenges are obstacles to reducing sodium in menu items and are likely reasons why the committee was unable to find much evidence that reducing sodium in foods has been a major initiative of the restaurant/foodservice industry in the past. This is not to say that individual restaurant/foodservice companies have not made efforts to lower sodium across their menus or to provide lower-sodium options.
More recently, there have been movements to give health concerns increased consideration during research and development—shifting the paradigm that taste, flavor, and consumers’ desires are the sole drivers to research and development (Scarpa, 2009). A few specific examples of recent industry efforts, although not a comprehensive list, are provided in Box 6-4.
As consumer interest in more healthful foods grows, corporate chefs and other menu decision makers are adding more whole grains, fruits and vegetables, and other more healthful fare to their menus (Berta, 2006; Maes, 2008; Ram, 2009; Weisberg, 2006). Conferences such as Worlds of Healthy Flavors, sponsored by the Culinary Institute of America and the Harvard School of Public Health, have helped support such actions by educating restaurant/foodservice leaders about diet concerns and techniques for improving the nutritional quality of menus and menu items (Hayden, 2004).
To improve awareness and encourage more restaurant/foodservice companies to reduce the sodium content of their offerings, the National Restaurant Association held a conference for industry leaders in 2008.35 Trade magazine articles report that chefs are experimenting with altering ingredients and preparation steps to enhance the flavors of menu items so that less salt can be used (Berry, 2009; Ram, 2008).36
There have also been efforts to provide consumers with more infor-
|
35 |
National Restaurant Association, 2008. Available online: http://www.restaurant.org/pressroom/pressrelease.cfm?ID=1635 (accessed December 12, 2008). |
|
36 |
Restaurants and Institutions, 2009. Available online: http://www.rimag.com/article/CA6704106.html (accessed February 11, 2010). |
|
BOX 6-4 Examples of Recent Efforts by the Restaurant/ Foodservice Industry to Reduce Sodium Intake Aramark has introduced a menu icon system to inform consumers of menu items that are considered more healthful choices. For a menu item to receive a Heart Healthy icon, it must contain 480 mg of sodium or less.a Aramark offers lower-sodium foods in elementary school cafeteriasb and has committed to meet the Institute of Medicine’s (IOM’s) sodium standards through a 5 percent annual reduction over the next 10 years as part of a White House initiative on childhood obesity.c Burger King has introduced several reduced-sodium items and meals in recent months, including reformulated chicken tenders, chicken sandwiches, and multiple kids’ meals with 600 mg of sodium or less.d Chartwells School Dining Services, as part of a White House initiative on childhood obesity, plans to meet IOM’s sodium standards over the next 10 years by pursuing discussions with suppliers to develop products that meet the standards.e Compass Group has a menu icon system to inform consumers that certain menu items are more healthful choices. Two of the icons have requirements for sodium: the Fit icon (600 mg of sodium or less) and the Reduced Sodium icon (servings must have 25 percent less sodium than the original version).f In order to use the icon system, chefs and managers must complete a 10-hour web-based nutrition program and answer test questions with 100 percent accuracy, and chefs must complete a day-long, hands-on training that includes reduced-sodium production techniques, which they then teach to others in their units.g ConAgra announced in January 2008 that it would offer all of its Chef Boyardee food-service products with lower sodium content. The new line of canned pasta products contain fewer than 820 mg of sodium per serving.h Denny’s recently made 20–25 percent reductions in the sodium content of its hash browns, shrimp skewers, and cheese sauce and has plans to make additional modifications to items it provides as part of its “Better for You” and children’s menus (Scarpa, 2009). Jason’s Deli reduced the sodium in kids’ meals by more than 20 percent in 2009i |
mation about the nutrient content of restaurant/foodservice items. Chain restaurants often provide nutrition information, including sodium content, on brochures, menus, websites, or tray liners. Some restaurants are also experimenting with adding nutrition information on purchased items to customer receipts.37
|
37 |
Available online: http://www.chainleader.com/article/CA6694989.html?q=menu+labeling (accessed November 16, 2009). |
|
McCain, a food manufacturer that produces foodservice items, recently introduced reduced-sodium oven-roasted potatoes and Smiles fries for kids.j McDonald’s provides information on small changes in ordering that can reduce sodium and has a list of foods that are lower in sodium on the company website.k Sodexo introduced Your Health Your Way meals in mid-2009. These meals must contain less than 800 mg of sodium.l Sodexo and its U.S. industry partners also recently committed to working toward meeting the IOM’s sodium standards through a 5 percent annual reduction over the next 10 years as part of a White House initiative on childhood obesity.m Souplantation/Sweet Tomatoes began testing lower-sodium versions of some soups in 2008 (Cobe, 2008). Subway provides tips on reducing sodium intake on the company website.n |
In general, it appears that efforts to help Americans reduce sodium intake have been less prominent in the restaurant/foodservice industry than in the food processing industry. This may be due to a lack of consumer pressure on restaurant/foodservice companies in past initiatives to reduce the sodium content of foods, in part because of the relatively limited nutritional information readily available to the public in these venues, and it may also be closely tied to the notion that it is a special occasion to consume meals at restaurants. Sodium reduction has been perceived by the industry as less
of a priority than trans fat elimination, saturated fat reduction, the addition of whole grains, the use of more fresh fruit and vegetables, and perhaps even other challenges, such as portion sizes and the perceived overreliance on sales of soda and other sugary beverages.38
LARGE-SCALE GOVERNMENT FOOD PROCUREMENT AND FOOD ASSISTANCE PROGRAMS
Federal government agencies as well as state and local governments are providers of food and should not be overlooked as part of the food environment. Various government programs procure food for their own restaurant/foodservice operations or provide assistance to allow others to do so. These programs range from food purchases for military operations to foods sold in vending machines in city parks. Because of the large scale of such operations, they warrant consideration in regard to strategies to reduce sodium intake.
As shown in Table 6-7, there are a number of federal programs that use government funds for the purchase of food (GAO, 2000).
The committee focused on four programs that reflect the spectrum of possibilities: a reimbursement program (the National School Lunch Program and School Breakfast Program), two assistance programs (the Supplemental Nutrition Assistance Program [SNAP] and the Special Supplemental Nutrition Program for Women, Infants, and Children [WIC]), and one direct procurement program (the military). Each federal program may have different abilities to institute sodium reduction efforts, given its purpose, operating constraints, and reach. It is notable that sodium intake has been a concern for some federal programs, and, as described below, limited efforts have been taken to reduce sodium in some programs.
National School Lunch Program and School Breakfast Program
Operating under the aegis of the Food and Nutrition Service of USDA, the National School Lunch Program and the School Breakfast Program provide meals for the nation’s children. The National School Lunch Program offers nutritious lunches in 99 percent of U.S. public schools and in 83 percent of private and public schools combined (Fox et al., 2004). The School Breakfast Program offers breakfasts in approximately 85 percent of public schools that offer the National School Lunch Program (Gordon and Fox, 2007). In fiscal year (FY) 2009, an average of 31.2 million schoolchildren participated in the National School Lunch Program on each school day,
TABLE 6-7 Federal Agencies and Programs That Directly Purchase, Use, or Set Standards for Food Purchases
|
Agency |
Program |
|
Department of Agriculture |
National School Lunch Program School Breakfast Program Supplemental Nutrition Assistance Program (SNAP) Summer Food Service Program Child and Adult Care Food Program Commodity Supplemental Food Program Food Distribution Program on Indian Reservations Nutrition Program for the Elderly The Emergency Food Assistance Program Food Assistance for Disaster Relief Fresh Fruit and Vegetable Program Special Supplemental Nutrition Program for Women, Infants, and Children (WIC) Nutrition Services Incentive Program |
|
Department of Defense |
Regular feeding of troops Fresh Fruit and Vegetable Program Defense Supply Center Philadelphia’s Subsistence Directorate (link between the Armed Forces and the food industry, provides subsistence for military personnel and federal agencies worldwide) |
|
Department of Justice (Bureau of Prisons) |
Subsistence program purchases food for prisons |
|
Department of Veterans Affairs |
Food purchases for Veterans Affairs facilities |
|
Department of Labor |
Job Corps Center (provides training and employment for severely disadvantaged youths, generally in a residential setting) |
|
SOURCES: Defense Logistics Agency (2009), http://www.dscp.dla.mil/ (accessed November 18, 2009); FNS (2009), http://www.fns.usda.gov/fns/ (accessed November 18, 2009); GAO, 2000. |
|
and an average of 11 million children participated in the School Breakfast Program each school day (ERS, 2010). In FY 2008, participating schools served about 5.2 billion lunches at a cost to USDA of approximately $9.3 billion and about 1.8 billion breakfasts at a cost of $2.3 billion (IOM, 2009).39 Schools receive per-meal cash reimbursements for the meals they serve to low-income students who meet certain qualifications. In addition, schools receive food from USDA’s Commodity Distribution Program, which is intended to both supplement the per-meal cash reimbursements and support the agricultural economy during times of overproduction. Nationwide,
|
39 |
Available online: http://www.fns.usda.gov/pd/annual.htm (accessed November 18, 2009). |
about 1.9 billion pounds of food is distributed through the Commodity Distribution Program on a yearly basis.40
Currently, schools must offer meals consistent with the National School Lunch and Child Nutrition Act Amendments.41 These regulations require that school meals provide a minimum percentage of the Recommended Dietary Allowance for calories, protein, iron, and vitamins A and C, while ensuring that total fat and saturated fat comprise less than 30 and 10 percent of calories, respectively. Under current regulations, it is recommended that schools work to decrease the level of sodium in the meals they serve, but no specific sodium levels are established (USDA/FNS, 1995). A recent IOM (2009) report focused on updating the nutrition standards to be more consistent with the Dietary Guidelines for Americans. The report recommends a gradual stepwise approach for reducing sodium in school meals in hopes of making changes indiscernible to participants and feasible for restaurant/foodservice operators and suppliers.
To help schools reduce the sodium content of meals, they are offered lower-sodium foods through the USDA’s Commodity Distribution Program. In the past, the Commodity Distribution Program’s Commodity Improvement Council conducted a review to identify potential reductions in fat, sodium, and/or sugar levels of products. Sodium modifications were adopted for 10 products. Significantly, however, other products were excluded from further change due to the belief that recipients would find additional modifications unacceptable (USDA, 1995). More recently, USDA has been looking to further decrease the sodium content of some of these products as well as various cheeses.42
USDA also encourages elementary schools to improve the nutritional content of the foods provided to children through the HealthierUS School Challenge. Started in 2004, the program encourages and recognizes changes in the school nutrition environment, including providing lower-sodium foods to school-age children and youth. The criteria reflect the 2005 Dietary Guidelines for Americans and require foods to contain < 480 mg of sodium per non-entrée or < 600 mg of sodium per entrée to receive recognition. A gold award of distinction, the highest level of recognition, is awarded if non-entrées contain < 200 mg of sodium and entrées contain < 480 mg.43 So far, 275 schools have earned lower levels of recognition. However, only
|
40 |
Available online: http://www.fns.usda.gov/cga/FactSheets/Commodity_Foods.pdf (accessed November 24, 2009). |
|
41 |
Public Law 94-105, 1975. |
|
42 |
Personal communication, R. Orbeta, USDA Food and Nutrition Service, November 10, 2008. |
|
43 |
Available online: http://www.fns.usda.gov/TN/HealthierUS/all_chart.pdf (accessed November 16, 2009). |
one school has received the gold award of distinction, demonstrating the difficulty in reaching stricter sodium levels.44
Supplemental Nutrition Assistance Program
SNAP (formerly known as Food Stamps) is overseen by USDA. This program is designed to supplement the purchasing power of low-income families in hopes of helping them maintain a nutritious diet (GAO, 2008). On average, more than 33 million people participated in the program in 2009 and received approximately $50.4 billion in food benefits.45
Qualification for benefits is based on income—one’s gross household income must not exceed 130 percent of the federal poverty level, and net income cannot exceed 100 percent of the federal poverty level. Program recipients receive an Electronic Benefit Transfer (EBT) in the form of a card that operates like a debit card. Participants are provided a monthly EBT allotment, which is allocated by state agencies and can be used at the approximately 165,000 retailers that accept these benefits (GAO, 2008). SNAP has only a few limitations on items that can be purchased using its benefits, such as food products that contain alcohol or tobacco, vitamins and supplements, and foods sold hot at the point of sale are not eligible.46
Recently, there has been more interest in encouraging more healthful food purchases using SNAP funds, and it has been recognized that the size of SNAP offers an impressive opportunity to promote dietary change. The 2008 Farm Bill provided $20 million in mandatory funding for a project to test point-of-purchase incentives for healthful foods in SNAP and authorized appropriations for similar projects.47 In addition, the Government Accountability Office (GAO, 2008) reviewed what is known about the effectiveness of financial incentives for purchasing healthful foods and provided a discussion of options available to implement financial incentives in SNAP. The committee is not aware of any efforts to include sodium in such initiatives, but it may be possible to do so.
|
44 |
Available online: http://www.fns.usda.gov/TN/HealthierUS/silvergoldtn.html (accessed November 24, 2009). |
|
45 |
Available online: http://www.fns.usda.gov/pd/SNAPsummary.htm (accessed October 15, 2009). |
|
46 |
Available online: http://www.fns.usda.gov/FSP/retailers/pdfs/eligibile_foods.pdf (accessed October 15, 2009). |
|
47 |
Available online: http://www.fns.usda.gov/FSP/rules/Legislation/about.htm (accessed October 15, 2009). |
Women, Infants, and Children Feeding Program
USDA’s WIC program is designed to provide nutritious foods to supplement the diets of low-income pregnant, postpartum, and breastfeeding women and children ages 5 years or under.48 In 2009, more than 9.1 million Americans received WIC benefits, and more than $4.6 billion in food purchases were made by the program.49
Unlike SNAP, which, with few exceptions, provides funds for the purchase of most foods, the WIC program allocates funds for certain kinds of foods. WIC benefits are generally provided as monthly checks or vouchers that are distributed through state agencies. These checks and vouchers can be used to purchase designated foods at retailers. A few state agencies also provide foods to participants directly through WIC warehouses and home distribution.50 To receive benefits, WIC participants must have incomes less than 185 percent of the federal poverty guidelines and be determined to be at “nutritional risk.”51
Currently, foods that qualify for purchase with WIC dollars are high in one or more of the following nutrients: protein, calcium, iron, and vitamins A and C. These requirements were established because populations that qualify for WIC often have deficiencies of these nutrients.52 The WIC program has instituted limited requirements in an effort to promote healthful dietary choices with respect to sodium. In some, but not all, food categories, food must not exceed certain sodium levels or not have added sodium to qualify as a product that can be purchased with WIC vouchers (USDA/FNS, 2007).
Military
There are more than 1.4 million people on active duty in the U.S. military.53 To feed military personnel, the U.S. military purchases more than $800 million in food (GAO, 2000).
The Defense Logistics Agency’s Defense Supply Center in Philadelphia
|
48 |
Available online: http://www.fns.usda.gov/wic/WIC-Fact-Sheet.pdf (accessed October 15, 2009). |
|
49 |
Available online: http://www.fns.usda.gov/pd/wisummary.htm (accessed October 15, 2009). |
|
50 |
Available online: http://www.fns.usda.gov/wic/WIC-Fact-Sheet.pdf (accessed October 15, 2009). |
|
51 |
Available online: http://www.fns.usda.gov/wic/WIC-Fact-Sheet.pdf (accessed October 15, 2009). |
|
52 |
Available online: http://www.fns.usda.gov/wic/FAQs/FAQ.HTM (accessed October 15, 2009). |
|
53 |
Available online: http://siadapp.dmdc.osd.mil/personnel/MILITARY/history/hst0903.pdf (accessed October 15, 2009). |
is the central controller of military food procurement (Grasso, 2008). Procurement is currently handled by a prime vendor program in which a single vendor supplies all of the food products needed by military operations in a specified geographic region.54 Prime vendors are often foodservice wholesalers that are contracted for 1 year with options to extend for additional years (ERS, 1998).
The military sets its own nutrition standards for active-duty personnel that are different from those developed for the general public, and it sets menu standards to help servicemen and servicewomen meet these nutritional requirements (Departments of the Army, Navy, and Air Force Headquarters, 2001). Since 1981, the Armed Forces Recipe Service has worked to ensure that the development of all new and revised recipes includes consideration of Dietary Guidelines for Americans recommendations. Throughout the 1980s and 1990s, a concerted effort was made to reduce both the salt and fat content of all military food recipes. Significant reductions in salt use were made for many recipes by modifying preparations, using different ingredients, or using smaller amounts of high-sodium ingredients. The degree of sodium reduction was determined by consumer testing, and changes were not incorporated unless adequate hedonic ratings could be maintained (Wollmeringer, year unknown). Attention to the salt content of military meals continues today. The Department of Defense Combat Feeding Program continues efforts to improve the healthfulness of new and revised recipes.55
STATE AND LOCAL GOVERNMENTS
Beyond federal programs, state and local governments are often relatively large purchasers of food. Local and state governments purchase foods or contract with restaurant/foodservice operators to supply the foods sold in employee cafeterias, correctional facilities, schools and child care centers, public hospitals, senior centers, parks, and numerous other facilities.
By instituting nutrition standards that include sodium criteria for all foods purchased with government dollars, local and state authorities can reduce the amount of salt consumed by their residents across a variety of environments, model more healthful eating, and potentially drive reformulation as companies respond to new product specifications. In September 2008, New York City put in place formal nutrition standards for all foods purchased or served by the city. These standards apply to the more than
|
54 |
Available online: http://www.dscp.dla.mil/subs/pv/pvguide.pdf (accessed September 2, 2009). |
|
55 |
Available online: http://www.natick.army.mil/about/pao/pubs/warrior/02/novdec/healthy.htm (accessed October 15, 2009). |
225 million snacks and meals served each year (New York City Department of Health and Mental Hygiene, 2008). They include restrictions on sodium through specifications of maximum levels allowed per serving for all products purchased and maximum sodium content levels allowed in meals served. The standards also make provisions for those locations providing for populations with specific nutritional needs, such as seniors and patients under therapeutic care. The standards are designed to be reviewed and revised regularly, taking into account updated nutritional guidelines and changes in food availability.56
Local and state governments have also been involved in establishing nutritional policies that apply only to select settings under their authority, such as schools, workplaces, and parks. A recent report surveying state school nutrition policies for foods outside of federally funded and regulated school meals identified only five states with policies in place restricting sodium for at least some grade levels (CSPI, 2007).
The introduction of nutrition standards for snacks and drinks sold in vending machines located on government-owned or government-operated property, most commonly schools and hospital systems, is another area of recent local government engagement. When nutrition standards (including sodium criteria) for foods sold in machines are incorporated into vending machine contracts, government further supports normalizing the consumption of lower-sodium foods.
Local and state governments can have considerable influence over a number of diverse food purchase and distribution locations. The introduction of nutrition standards, including sodium specifications, is an area of increasing activity and opportunity to influence population intake.
THE CONSUMER
Given the acknowledged failures to change sodium intake by setting strategies aimed largely at the consumer, it would be helpful if these outcomes could be better understood, set in context, and used to inform future efforts to better engage consumers in the role they must play in the future. Unfortunately, the lack of specific data in this regard relative to sodium intake is noteworthy. In discussions below regarding the consumer and the food environment, paradigms from related fields of study—including economic theory and health behavior theory—are highlighted as useful and can be applied to future work on sodium reduction targeted to consumers. But a specific analysis of reasons for the past experiences and outcomes relative to the interface between consumers and sodium intake reduction is
|
56 |
Available online: http://www.cspinet.org/new/pdf/nyc_agency_food_standards.pdf (accessed November 18, 2009). |
challenged by limited data. Conjecture and reaching beyond the data should be avoided, but several hypotheses can be outlined.
The consumer message that sodium is linked with hypertension has been consistent throughout the years. However, messages on who should reduce sodium, and best methods for reducing intake have shifted. Initially, messages most strongly encouraged higher-risk groups (e.g., African Americans and older adults) to reduce sodium, and use of salt at the table and during cooking was emphasized. As in most areas of emerging scientific research, as evidence became stronger that sodium should be a concern throughout the lifespan and as new data emerged on major sources of intake, messages were adjusted to include the entire population, and to encourage consumers to consume processed and restaurant/foodservice foods that were lower in sodium. It is reasonable to expect some consumers to be confused by—or even dismissive of—the slight change in messaging or to never adopt the revised message. This may have limited some consumer interest in reducing intake or in seeking information about how to best accomplish reductions.
Motivation may have also been a challenge. Some consumers may see hypertension as a commonplace, treatable condition in our society, and not recognize the serious ramifications of excess sodium intake. The low levels at which consumers recognize the potential for sodium intake to influence risk of heart disease, speak to this point. The channels used for dispersing sodium messages may have also been insufficient. In addition, it is possible that a portion of the population may simply be uninterested in health messages, and no amount of consumer messaging will motivate behavior change.
Sustainability of consumer interest and concern is another obvious problem. Although early public health initiatives increased awareness, concern levels, and intentions to alter sodium intake, these levels of awareness and concern subsequently declined. Competing messages in the food environment about the importance of a range of nutrients are likely to impact the sustainability of consumer interest and concern over sodium. The problem of public health messages competing for consumer attention is not unique to sodium.
The above mentioned factors cannot be documented and are largely hypotheses, but it seems apparent that even those personally concerned about sodium were also unable to reduce intake. The food supply undoubtedly played a key role in challenging such consumers, but it is also likely that consumer skills for interpreting the sodium content of their diet may have been lacking. Further, while the food industry did make a number of efforts to introduce lower sodium foods during the long history of sodium initiatives, many low-sodium products failed in the marketplace. Likely reasons for these failures were detailed further and include the lack of satisfactory
sodium replacements and the possibility that the reductions needed to make label claims were relatively large and may have challenged manufacturers’ abilities to make palatable products for consumers who generally have taste preferences tuned for saltier foods. As a result, consumers that did make an effort to try these products found them unacceptable and producers shied away from using such claims. In addition, there are those who would hypothesize that reformulation efforts to reduce other emerging nutrients of concern like fat and calories may have drawn the industry’s focus away from sodium reduction. In fact, such efforts may have even discouraged active efforts to reduce sodium because salt is a useful ingredient for improving the taste and flavor attributes of reduced-fat and reduced-calorie products.
It would now be useful to carefully examine the factors that are important to motivating consumer change in the area of sodium reduction which, when coupled with the overarching effort to reduce the sodium content of the food supply, inform the activities needed to assist consumers in selecting diets more in line with overall sodium intake reduction. Understanding and working with the interface between consumers and the food environment is critical to the success of such efforts.
THE CONSUMER WITHIN THE FOOD ENVIRONMENT
Previous chapters of this report include discussions on the lack of success in motivating consumers to make dietary changes that result in meaningful sodium intake reduction. Such reductions could be perceived as requiring consumers to accept relatively unpalatable foods or make special dietary changes, such as increasing intake of fruits and vegetables or decreasing calories. To achieve even the highest recommended limit of sodium intake of 2,300 mg/d, the average adult would have to cut daily salt intake by at least one-third. In the current food environment, this would require complex and sustained behavior changes, such as tracking and adding the sodium content of all foods eaten over the course of a day and making other special dietary changes. Past initiatives placed considerable, if not the primary, burden on the consumer to act to reduce sodium intake. Going forward, the possibility has been raised that gradual changes in the food supply are likely to help consumers become acclimated to foods lower in sodium, especially if these reductions occur across a broad range of foods and thus significantly assist in lowering sodium intake. Even with a focus on changes in the food supply, it must nonetheless be recognized that consumers would still have a role to play in decreasing sodium intake, and efforts to promote changes in consumer behavior would be worthwhile.
Not surprisingly, a variety of factors influence consumers’ food choices and actions to decrease their sodium intake. Studies of food choice behav-
ior have identified both individual and environmental factors that shape the complex process of decision making (Bisogni et al., 2002; Booth et al., 2001; Devine, 2005; Drewnowski, 1997; Galef, 1996; Lutz et al., 1995; Nestle et al., 1998; Raine, 2005; Shepherd, 2005; Wetter et al., 2001). The social ecological model provides a useful framework for exploring these interacting influences across multiple levels—from the individual level of knowledge and attitudes, to social factors, to organizational and institutional factors, to macro-level factors such as the policies that influence the food supply (McLeroy et al., 1988; Story et al., 2008). This report focuses particularly on the pivotal role of the environment in consumer dietary patterns, with the food supply playing an obvious central role. The environment includes locations at which food is consumed, accessibility of foods (Burger et al., 1999), cultural traditions (Willows, 2005), and pricing (Hanson et al., 1994), as well as the information environment—for example, point-of-purchase labeling in restaurants or grocery stores. At the interpersonal or social level, food choices may be influenced by social networks, perceived norms, social support, and related social factors. At the individual level, when consumers are asked what is most important when choosing food, taste is the most likely response (Drewnowski, 1997). A variety of other individual factors also influence consumer food choices, including motivations, attitudes, and beliefs, as well as personal characteristics such as age, gender, education, and race/ethnicity (Bisogni et al., 2002; Booth et al., 2001; Devine, 2005; Drewnowski, 1997; Galef, 1996; Honkanen et al., 2005; Lutz et al., 1995; Nestle et al., 1998).
This section describes key considerations relevant to better understanding approaches to motivating consumers even within the context of changes in the food supply. To understand the multi-tiered food environment and the complex ways in which consumers interact with this environment, the committee applied the diverse disciplinary lenses of economic and behavioral theories, each of which frames discussions about consumer behaviors and food choices. These theories also guide considerations of two possible strategies for influencing consumer behaviors—warning labels (also referred to in this report as “special labeling/disclosure statements”) and health communication campaigns—in the context of reducing sodium in the food supply. These theoretical perspectives provide further justification for an incremental approach to sodium reduction.
Applying Economic Theory to Sodium Intake Reduction
Economic theory provides a conceptual framework for how individuals and households make choices regarding food purchases, and ultimately food consumption, and the resulting implications for sodium reduction efforts. Consumers choose foods based on foods’ characteristics (including
salt taste) within the limitations of their budgets. Consumers must understand the importance of sodium reduction through education efforts so that this information can influence the level of satisfaction they obtain from consumption of foods. Furthermore, it would be helpful to reduce sodium using an incremental approach to assist consumers in adjusting their preferences for salt taste in foods. The price of foods with lower sodium content influences consumer choices and thus is also a factor affecting sodium reduction strategies. When considering consumers as part of households, changes in the way households allocate their time for food preparation have implications for sodium consumption because households are increasingly relying on processed and prepared foods from grocery stores and foods from restaurants and other foodservice operations. These changes in household time allocation make it more difficult for households to understand and control the sodium content of their diets and thus imply a need to change the sodium content of the food supply.
Consumer “Value” Associated with Food
The field of consumer theory suggests that consumers derive utility from the properties or characteristics of goods purchased and consumed. The term “utility” in this case means the satisfaction obtained from consuming a product, and the term “goods” would include foods. In the context of food choices, consumers derive utility from consuming individual foods depending on characteristics such as taste, nutrient content, calories, and sensory characteristics. Because the taste of some foods is derived from the presence of salt and because salt improves other flavors, salt taste and the presence of salt can be among the many characteristics of food from which consumers derive utility. Furthermore, goods consumed in combination possess characteristics different from those of the individual goods (Lancaster, 1966). Thus, foods may be combined or prepared in a way that alters the joint set of characteristics. In other words, a consumer may add salt to foods to alter their taste or may combine ingredients with varying levels of salt.
As with all types of goods, consumers faced with a set of food choices will choose a set of foods to maximize utility within the limitations of their budgets (Lancaster, 1966). Consumers consider the combinations of characteristics of different foods while making purchasing decisions. Thus, if consumers have optimized their food choices based on the existing set of characteristics, a noticeable change in the characteristics of foods might reduce their utility if there is no other type of compensating change. In the context of sodium content, a noticeable reduction in the salt taste of a food might decrease consumer utility unless there is a corresponding change in how consumers derive utility from consumption of foods. One possible
method in which consumer utility functions may be altered is through consumer education efforts regarding the health effects of sodium consumption. This means, in essence, that an initially less palatable food may be accepted if the consumer wishes or is motivated to act on a health education message about the benefits of lower-sodium food. This may not, however, be necessary if the change in taste is minor or not readily perceived. It is important to note that in a recent consumer survey, when Americans were asked about the impact that convenience, healthfulness, price, and taste had on their decision to buy foods and beverages, taste was the highest ranked, the top choice by more than 80 percent of those surveyed (IFIC, 2008).
The value of each characteristic of a food can be estimated using a hedonic price function. Salt taste, as one characteristic, has an implicit value associated with it. Many analyses have estimated hedonic price functions for foods (Shi and Price, 1998), but they have not specifically addressed salt taste, a potentially positive attribute, or sodium content, a potentially negative attribute, in the analyses. Although specific values associated with salt taste and sodium content are not available in the literature, consumer theory suggests some considerations. Specifically, it will be essential for consumers to understand the importance of reducing sodium intake through education efforts that alter their utility functions. Furthermore, because consumers may understand the importance of reducing sodium intake but still have a preference for high salt content based on taste, existing consumer theory would support an incremental approach to adjusting taste preferences if possible. However, an inevitable unknown is specifically to what extent and at what speed salt taste preferences can be changed. This, in turn, suggests that efforts to encourage consumers to avoid certain practices, such as combining foods to enhance salt taste or automatically salting foods without tasting first, may be beneficial.
In addition to preferences for the characteristics of foods, food prices also influence consumer purchases. In general, most foods have inelastic price elasticities of demand (see, for example, Huang and Lin, 2000), which means that consumers are not very sensitive to changes in the prices of foods; they will reduce their purchases by only a small amount if the price increases. Low-income households tend to be more price sensitive than high-income households, but the differences are quite small (Lin and Guthrie, 2007). However, if prices of foods with lower sodium content are sufficiently higher than those with higher sodium content, consumer purchases of these foods can be substantially reduced even with relatively inelastic price elasticities of demand. Reduced-fat and reduced-sodium products often cost more than their regular counterparts (Frazao and Allshouse, 1996; Liese et al., 2007). A 1993 survey of 37 food categories found that nutritionally improved versions of foods in 81 percent of the surveyed food categories cost more than regular versions (Frazao and Allshouse, 1996).
From 2001 to 2004, between 24 and 34 percent of Americans cited the cost of healthful foods as a major reason for not eating as healthful a diet as they should (Food Marketing Institute, 2005). Data from 2004 indicate that cost is not just a concern for those with a low income; nearly 40 percent of shoppers with household incomes between $50,000 and $75,000 cite cost as a major barrier to a more healthful diet (Food Marketing Institute, 2005). Furthermore, foods naturally low in sodium often have higher prices. A survey of food prices from 1950 to 2007 found that real fruit and vegetable prices—foods that are naturally low in sodium when unprocessed—have increased since the 1950s even though general food costs have declined in recent decades (Christian and Rashad, 2009). Consumer education could play a role in informing consumers of the benefits of lower-sodium foods, thus increasing their demand for these foods (and their associated willingness to pay), and educating consumers on how to select lower-sodium foods within their budgets.
Household “Value” Associated with Food Preparation
Household production theory broadens the concept of consumer utility discussed above to address the fact that individuals within households are both utility maximizers and producing units. Households combine time and market goods to produce commodities for consumption. In this context, households maximize utility from consumption of goods, including foods, but are subject to not only the limitations of their budgets but also the limitations of their time. The full price of consumption includes the direct cost of purchasing a commodity and the indirect cost of time spent on production within the household (Becker, 1965). In the context of food, households purchase foods at various levels of preparation and apply time toward food preparation and consumption within the home or toward consuming meals away from home. Becker (1965) noted, in particular, that an increase in the value of a household member’s time may induce that individual to enter the labor force and spend less time cooking by using pre-cooked foods. Underlying the concept of production within the household is the level of human capital in the household for preparing foods (i.e., the knowledge and ability to prepare foods from raw ingredients) and also its preferences for certain goods and activities (Pollak and Wachter, 1975).
The trend over time has been for households to allocate more time toward working outside the home and less time to household production, particularly as more women have entered the workforce (Redman, 1980). As a result of this change, households purchase more prepared or convenience foods for use within the home and more away-from-home meals (Capps et al., 1985; Kinsey, 1983; McCracken and Brandt, 1987; Redman, 1980). When consuming prepared foods and food away from home, individuals
have little control over the nutrient content, including the sodium content, of the foods they purchase. Although they can substitute among prepared foods and select foods with lower sodium content, they may lack the information or knowledge to do so. Prepared foods have nutrition labels stating sodium content, but the set of choices may all have relatively high levels of sodium. In addition, away-from-home meals are rarely labeled with sodium content, so individuals can only infer sodium content based on the type of food. Thus, as households have allocated less time to meal preparation in the home, they have ceded some degree of control over the foods they consume to food manufacturers and restaurant/foodservice operations.
It is also important to highlight the relationship between time allocation and changes in the food environment. As households have changed their allocation of time away from food preparation, the food environment has changed in response. Correspondingly, changes in the food environment have likely also facilitated changes in the way households allocate their time by reducing the time required to prepare foods and increasing the availability and ease of access to prepared foods and restaurant and other foodservice foods.
Between the 1970s and the 1980s the percentage of the household food dollar spent on food purchases away from home increased (Tippett et al., 1999). Total expenditures on food away from home increased within all racial/ethnic groups and at all income levels. Households with higher incomes spent more on food away from home than those with lower incomes. About one-third more Americans (57 percent total) ate away from home daily between 1994–1996 than between 1977–1978. The most likely age group to eat away from home were adolescent boys, whereas persons ages 60 years and older were the least likely. Sixty-five percent of persons with higher incomes ate away from home, while only 45 percent of those with lower incomes did so (Briefel and Johnson, 2004). Popular items consumed away from home include French-fried potatoes, sandwiches (especially burgers), lettuce salads (with salad dressings and other additions), pizza, and Mexican dishes—items that contain significant sodium. In 1994–1996 and 1998, 37 percent of adults and 42 percent of children consumed fast food. This was associated with significantly higher intake of sodium, energy, and fat, and significantly lower intake of fruits and vegetables (Paeratakul et al., 2003).
Consumption of larger portion sizes is common when foods are consumed away from home. National data from 1995 show that 34 percent of calories were consumed outside of the home, while only 27 percent of eating occasions took place away from home. This indicates that consumers either eat larger portions away from home or consume more energy-dense foods (Lin et al., 1999). Rolls (2003) found that consumers typically eat 30 to 50 percent more when offered large portions at restaurants. Continu-
ing Survey of Food Intake by Individuals data from 1994 to 1998 show that fast food portions are often the largest compared to those prepared by full-service restaurants and those prepared in the home (Nielsen and Popkin, 2003). Zoumas-Morse et al. (2001) found that meals consumed at restaurants provided 55 percent more calories than meals from home. The larger portion sizes found at many restaurant/foodservice establishments combined with the sometimes higher sodium density of these foods may make meeting dietary recommendations for sodium intake a greater challenge for those consuming many meals away from home compared to those that have more control in the preparation of foods at home.
In summary, as households have changed the way they allocate their time for food preparation, and thus consume more foods away from home and from prepared grocery items, it has become more difficult for individuals to understand and control the nutrient content, including the sodium content, of their diets. The resulting implication is that changes in the food environment will be essential to allow individuals to purchase and consume lower-sodium foods.
Applying Health Behavior Theory to Sodium Intake Reduction
Behavioral theories provide guidance about the determinants of a given health behavior—in this case, reducing salt intake. Understanding these determinants is useful in planning strategies to promote change. There are many theories of behavioral prediction, although there is growing consensus about a limited number of variables needed for predicting behavior change (Fishbein, 2000; Glanz et al., 2008; IOM, 2002; Petraitis et al., 1995). Three prominent theories provide important guidance on these influences: social cognitive theory (Bandura, 1994); the theory of reasoned action (Ajzen and Fishbein, 1980; Fishbein et al., 1991); and the health belief model (Rosenstock et al., 1994). The committee draws from a summary of these behavioral theories presented in a prior IOM report Speaking of Health: Assessing Health Communication Strategies for Diverse Populations (IOM, 2002), recognizing that a wide array of resources are available that apply social and behavior theories to health behavior in general and, more specifically, to nutrition (Glanz et al., 2008; IOM, 2007; Story et al., 2008). Although the synopsis provided here simplifies the health behavior change process, it is intended to apply the guidance from social and behavioral theory specifically to salt intake.
Intention to change is a major predictor of behavior change. Generally, people are able to convey the probability that they will engage in a particular behavior, such as reducing salt intake, and their own estimate of the likelihood of behavior change is generally a leading indicator of actual change. Nonetheless, people do not always behave as they intend to behave.
The environment may pose unexpected barriers, although, alternatively, it may facilitate health behavior change. The lack of reduced-sodium food choices clearly constrains one’s ability to limit sodium intake. Similarly, another barrier to changing health behaviors is the lack of skills to perform the behavior, for example, knowing how to read a nutrition label to choose lower-sodium products. If an individual has a strong intention to perform a given health behavior but is unable to perform that behavior, interventions may be focused on removing the environmental constraints or barriers and “skills training.”
If individuals are not performing the behavior because of low intentions to do so, the intervention needs to focus on building intention to change. Behavioral change theories suggest that several key variables can directly influence the strength of intentions. First, beliefs and attitudes are important precursors to intentions to change behavior. Intentions to change behavior are strengthened when a person believes that performing the behavior will lead to positive consequences and prevent negative consequences (“outcome expectations”). In the case of sodium intake, changing attitudes may require strengthening beliefs that reducing salt intake will result in positive outcomes, such as lowering the risk of hypertension and coronary heart disease, and will not be related to certain negative outcomes, such as reducing the flavor of foods.
Second, intentions to change may be strengthened through perceived norms, defined as the degree to which a given behavior is seen as appropriate or normative within one’s social network or society as a whole. These norms indicate the amount of social pressure one feels to perform the behavior. Family or peer social norms around sodium intake may be one important source of perceived norms. Third, intentions to change behavior may also be influenced by personal agency or self-efficacy, which reflects the belief that one can perform the behavior even when circumstances are not favorable.
Accordingly, effective communication interventions aim to remove or address environmental barriers to change; increase skills; and change intention, including through changing attitudes, norms, and self-efficacy. The relative importance of these variables depends both on the health behavior—here, reducing salt intake—and the intended population.
Use of Health Communication Campaigns
As noted previously in this report, prior health communication strategies have not been successful in their attempts to influence consumer salt intake, but they have made some progress in increasing awareness. In the context of recommended changes of sodium levels in the food supply, however, a coordinated effort to communicate the risks of sodium and in-
crease consumers’ motivation to reduce salt consumption may be a useful supplemental tool. The IOM report Speaking of Health: Assessing Health Communication Strategies for Diverse Populations (IOM, 2002), discussed above, also provides guidance on the application of social and behavioral theory to the design of health communication campaigns.
A first step in the development of a health communication campaign is to define the specific behavior targeted by the intervention—in this case, sodium intake of less than 2,300 mg/d. In the case of sodium intake, however, the committee recognizes that reduction does not rely exclusively on consumer actions, and reductions of sodium in the food supply may be the greatest contributor to overall reduction of sodium intake. Accordingly, the objectives for a health communication campaign may include increasing consumers’ knowledge of the impact of sodium on health outcomes and the benefits of sodium intake reductions for all groups; building support for government actions to reduce sodium in the food supply; and building skills to make food choices in line with reductions in sodium intake.
Given that reductions in sodium intake are important across the lifespan, regardless of other risk factors, it is important that a campaign be developed for a broad audience. That said, the effectiveness of health communication messages can be increased by framing the messages according to the attitudes and beliefs of different audience segments. For example, campaign planners may develop different messages and delivery strategies for school-based interventions for children and adolescents, compared to messages to be delivered through health-care providers for persons diagnosed as hypertensive. In addition to developing different messages to different age groups, tailoring messages to specific cultural groups and dispersing these messages through communication channels that are known to reach specific groups, may be beneficial as it can assist these groups in identifying the specific food preparation and consumption behaviors that are the largest contributors to their sodium intake. This area has limited data and is not well researched. Furthermore, messages evoking positive emotions, as opposed to those evoking negative emotions (such as fear), may have a greater impact with the target audience (Monahan, 1995).
In developing the messages, it is important to consider the current beliefs of the intended audience. Hornik and Woolf (1999) note that beliefs to be targeted for change should be strongly related to intention to change or the behavior to be changed and should be feasible to be changed; in addition, it is important that there be a sufficient part of the population who do not already hold the belief to warrant trying to change it. For example, as discussed in Chapter 2, one belief to be addressed in a communication campaign may be the belief that sodium intake is associated with increased risk of high blood pressure and heart disease; only 40–50 percent of consumers are aware of this relationship between sodium intake and hyperten-
sion, and the percentage who are aware of the relationship to heart disease is even lower. Focusing on the health implications of sodium reduction may contribute to raising the salience of personal efforts to reduce sodium and contribute to normative support for changes in the sodium content of the food supply. In addition, it may be important for a communication campaign to increase awareness of one’s own sodium intake. About 40 percent of the U.S. population feels that action to reduce sodium is not necessary, although results from USDA’s Diet, Health and Knowledge Survey reviewed in Chapter 2 indicate that the levels of sodium intake appears to be comparable regardless of personal perceptions of need for change. A health communication campaign in the context of reductions of sodium in the food supply may additionally have positive impacts on self-efficacy; consumers may feel more confident in their ability to reduce sodium intake with increased availability of good-tasting, lower-sodium food options.
Use of Special Labeling/Disclosure Statements
As a step in the behavior change process, it is important that consumers have information available to make informed choices in food selections. Special labeling/disclosure statements placed on food packages provide one such source of information. These statements can be grouped as disclosures, reminders, and education.57
Although it has long been established that warning messages are an important method for potentially informing and reminding consumers about harms associated with products (HHS, 1987; Mayer et al., 1991; Morris et al., 1977), it is not clear what makes a warning effective and there are many unknowns that are unique to specific messages (Lehto and Miller, 1986). This suggests that the decision to proceed with special labeling/disclosure statements for a particular situation or product requires targeted study to determine how to not only frame the message but also measure its intended as well as unintended effects.
Stewart and Martin (1994), as part of a review of the intended and unintended consequences of warning messages, conclude that warnings inform rather than convince consumers; as a result, consumers heed only some of the messages. They caution that research suggests that warning messages can be rendered ineffective by frequent use and so-called reactive behavior caused by misinterpretation of the purpose of the message. Overall, the authors conclude that there is a need for caution in the design of warning messages because of the multiple effects of such messages and variation in responses among different groups of consumers. They also suggest that the design of warning messages should be informed by empirical research,
rather than expert opinion or judgment. The available literature suggests that risk in the context of consumer products is difficult to communicate and comprehend, for both consumers and experts. There are many ways to conceptualize risk, and while many are considered appropriate and defensible, it is established that they can lead to very different behavioral outcomes (Stewart and Martin, 1994).
Available research in this area has tended to focus on surveys designed to measure attention to a warning, perceived credibility of the messages, or awareness of warning information (Kimmerling, 1985; Lehto and Miller, 1986). Such measures, although useful, are incomplete because exposure and attention do not ensure that the warnings are perceived as credible, nor do they provide insight about whether and under what circumstances consumers will alter their attitudes, decision making, or behavior in response to warnings (Stewart and Martin, 1994).
Putting It All Together: Embedding Health Behavior for Sodium Intake Reduction Within the Broader Food Environment
In the case of sodium, removal of the environmental constraints to health behavior change is a critical first step. As stated above, with their growing reliance on processed and prepared foods, consumers have diminishing control over the amount of salt they consume.
The need for a population-wide reduction strategy rests on the massive scope of the high blood pressure epidemic, documented in prior chapters, and the limited success of individual-based sodium reduction interventions. Such interventions have been notoriously difficult to implement, especially in the setting of the current food supply, which is replete with “hidden” salt. In clinical trials, intensive interventions that focused only on salt reduction were able to shift mean intake to approximately 100 mmol/d (2,300 mg/d) (see left panel of Figure 6-5). When efforts to reduce sodium intake were combined with weight loss or part of a comprehensive lifestyle intervention program, sodium reduction was more modest (see right panel of Figure 6-5), likely because of the complexity of making multiple lifestyle changes and potential trade-offs when there are multiple goals (Appel, 2008).
Thus, it is unlikely that the average consumer will be able to successfully reduce sodium intake without changes to other components of the food environment. Changes at the policy level diminish the need for individual action to reduce sodium in the diet, which is of particular importance because, as documented in Chapter 2, the benefits of sodium reduction can accrue regardless of age or risk level. This approach to reducing risk at the source of exposure has been a long-standing cornerstone of public health practice (Winslow, 1984). In the case of sodium reduction, changes in the food supply could be aimed at reducing risk at the source of possible expo-
![FIGURE 6-5 Mean pre- and post-levels of urinary sodium excretion in three trials (Trials of Hypertension Prevention Phase 1 and 2 [TOHP1 and TOHP2] and Trials of Nonpharmacologic Interventions in the Elderly [TONE]) that tested interventions focused only on salt reduction (left panel) and two trials (TOHP2 and PREMIER) that combined sodium reduction with other lifestyle interventions (right panel).](/openbook/12818/xhtml/images/p2001bcf5g203001.jpg)
FIGURE 6-5 Mean pre- and post-levels of urinary sodium excretion in three trials (Trials of Hypertension Prevention Phase 1 and 2 [TOHP1 and TOHP2] and Trials of Nonpharmacologic Interventions in the Elderly [TONE]) that tested interventions focused only on salt reduction (left panel) and two trials (TOHP2 and PREMIER) that combined sodium reduction with other lifestyle interventions (right panel).
NOTE: d = day; mmol = millimole.
SOURCE: Appel, 2008. Copyright © 2008 Journal of Clinical Hypertension. Reproduced with permission from John Wiley & Sons, Inc.
sure. Policy changes to increase the content of nutrients such as folic acid and niacin have been highly effective in improving the nutritional status of the U.S. population with respect to these nutrients (Park et al., 2000; Pfeiffer et al., 2007). Monitoring and surveillance activities were critical to documenting folate’s effectiveness and potential safety concerns (Lucock and Yates, 2009). However, sodium presents some unique challenges that were not encountered in these earlier policy issues, making effective monitoring and surveillance systems even more critical for implementing sodium reduction strategies. For example, sodium has taste and functional effects in foods, whereas earlier fortification policies were flavorless and had poten-
tially less serious functional effects. Nevertheless, there is limited evidence that sodium intake reductions achieved by changes in the food supply can create meaningful changes in health status. Two decades ago, a small but significant study illustrated the potential impact on blood pressure of passive reductions of sodium in available foods. The Exeter-Andover study, conducted by Ellison and colleagues (1989), was designed to examine the extent to which reductions in the sodium content of dining hall foods would result in blood pressure reductions among students in the intervention versus control schools. Students were not instructed to change their dietary patterns or to avoid salty foods, and salt shakers were left on the tables. Sodium intake was reduced by 15–20 percent through modifications in food purchasing and preparation, and resulted in significant reductions in systolic and diastolic blood pressure over the academic year. These findings further illustrate the potential value of passive changes in the food supply, in line with changes in the macro-level environment.
Policy changes have been highly effective in influencing the intake of other nutrients. For example, food fortification was likely an important tool in eliminating pellagra in the United States (Park et al., 2000). These findings further illustrate the potential value of passive changes in the food supply, in line with changes in the macro-level environment.
By emphasizing changes in the food supply, individual consumer efforts to reduce salt intake are embedded in these broader changes. Consumers’ roles in reducing salt intake will change in response to the new environment. With a broader range of food choices, consumers’ control over the level of sodium in their diets is likely to increase. Additional changes of other factors in the behavior change process are supplemental.
REFERENCES
Ajzen, I., and M. Fishbein. 1980. Understanding attitudes and predicting social behavior. Englewood Cliffs, NJ: Prentice Hall.
Appel, L. J. 2008. At the tipping point: Accomplishing population-wide sodium reduction in the United States. Journal of Clinical Hypertension 10(1):7-11.
Balentine, D. 2009. Salt reduction: Making the healthy choice the tasty choice. Presented at the Institute of Medicine Committee on Strategies to Reduce Sodium Intake’s Public Information-Gathering Workshop, March 30, Washington, DC.
Ball, P., D. Woodward, T. Beard, A. Shoobridge, and M. Ferrier. 2002. Calcium diglutamate improves taste characteristics of lower-salt soup. European Journal of Clinical Nutrition 56(6):519-523.
Bandura, A. 1994. Social cognitive theory and exercise of control over HIV infection. In Preventing AIDS: Theories and methods of behavioral interventions, edited by R. J. DiClemente and J. L. Peterson. New York: Plenum Press.
Bassett, M. T., T. Dumanovsky, C. Huang, L. D. Silver, C. Young, C. Nonas, T. D. Matte, S. Chideya, and T. R. Frieden. 2008. Purchasing behavior and calorie information at fast-food chains in New York City, 2007. American Journal of Public Health 98(8): 1457-1459.
Beck, C. 2002. Organizing human resources: By project? By discipline? As a matrix? In Food product development: Based on experience, edited by C. Side. Ames: Iowa State Press. Pp. 31-49.
Becker, G. S. 1965. A theory of the allocation of time. The Economic Journal 75(299): 493-517.
Beckley, J. H., M. M. Foley, E. J. Topp, J. C. Huang, and W. Prinyawiwatkul (eds). 2007. Accelerating new food product design and development. Ames, IA: Blackwell Publishing and the Institute of Food Technologists.
Berry, D. 2009. Our inevitable sodium swap out. Culinology, May 26.
Berta, D. 2006. Retreat examines realistic ways to provide healthful menu items. Nation’s Restaurant News 40(8):12.
Bisogni, C. A., M. Connors, C. M. Devine, and J. Sobal. 2002. Who we are and how we eat: A qualitative study of identities in food choice. Journal of Nutrition Education and Behavior 34(3):128-139.
Booth, S. L., J. F. Sallis, C. Ritenbaugh, J. O. Hill, L. L. Birch, L. D. Frank, K. Glanz, D. A. Himmelgreen, M. Mudd, B. M. Popkin, K. A. Rickard, S. St. Jeor, and N. P. Hays. 2001. Environmental and societal factors affect food choice and physical activity: Rationale, influences, and leverage points. Nutrition Reviews 59(3):S21-S39.
Briefel, R. R., and C. L. Johnson. 2004. Secular trends in dietary intake in the United States. Annual Review of Nutrition 24:401-431.
Brooks, N., A. Regmi, and A. Jerardo. 2009. U.S. food import patterns, 1998–2007. FAU-125. Washington, DC: Economic Research Service.
Burger, J., W. L. Stephens Jr., C. S. Boring, M. Kuklinski, J. W. Gibbons, and M. Gochfeld. 1999. Factors in exposure assessment: Ethnic and socioeconomic differences in fishing and consumption of fish caught along the Savannah River. Risk Analysis 19(3):427-438.
Capps, O., J. R. Tedford, and J. Havlice. 1985. Household demand for convenience and non-convenience foods. American Journal of Agricultural Economics 67(4):862-869.
Cauvain, S. P. 2003. Bread making: Improving quality. Boca Raton, FL: CRC Press.
Christian, T., and I. Rashad. 2009. Trends in U.S. food prices, 1950–2007. Economics and Human Biology 7(1):113-120.
Cobe, P. 2008. Getting a new product in the door. Foodservice Buyer, December 2008.
Connor, J. M., and W. A. Schiek. 1997. Food processing: An industrial powerhouse in transition. 2nd ed. New York: John Wiley & Sons.
Cox, S. A., and R. Delaney. 2009. Evolution of sensory evaluation: How product research is being integrated into the product design process. In An integrated approach to new food product development, edited by H. Moskowitz, I. S. Saguy and T. Straus. Boca Raton, FL: Taylor and Francis Group. Pp. 277-289.
CSPI (Center for Science in the Public Interest). 2005. Salt: The forgotten killer. Washington, DC: Center for Science in the Public Interest.
CSPI. 2007. School foods report card: A state-by-state evaluation of policies for foods and beverages sold through vending machines, school stores, a la carte, and other venues outside of school meals. Washington, DC: Center for Science in the Public Interest.
CSPI. 2008. Salt assault: Brand-name comparisons of processed foods. 2nd ed. Washington, DC: Center for Science in the Public Interest.
de la Huerga, V., and E. Topp. 2007. A supplier perspective: Superior services and product help change happen. In Accelerating new food product design and development, edited by J. H. Beckley, M. M. Foley, E. J. Topp, J. C. Huang, and W. Prinyawiwatkul. Ames, IA: Blackwell Publishing and the Institute of Food Technologists. Pp. 55-72.
Defense Logistics Agency. 2009. Defense Supply Center Philadelphia. http//www.dscp.dla.mil/ (accessed November 18, 2009).
Departments of the Army, Navy, and Air Force Headquarters. 2001. Nutrition standards and education. Army Regulation 40-25, BUMEDINST 10110.6, AFI 44-141. Washington, DC: Departments of the Army, Navy, and Air Force.
Desiraju, R. 2001. New product introductions, slotting allowances, and retailer discretion. Journal of Retailing 77:335-358.
Devine, C. M. 2005. A life course perspective: Understanding food choices in time, social location, and history. Journal of Nutrition Education and Behavior 37(3):121-128.
Dornenburg, A., and K. Page. 2008. The flavor bible: The essential guide to culinary creativity, based on the wisdom of America’s most imaginative chefs. 1st ed. New York: Little, Brown and Company. P. 2.
Drewnowski, A. 1997. Taste preferences and food intake. Annual Review of Nutrition 17: 237-253.
Ellison, R. C., A. L. Capper, W. P. Stephenson, R. J. Goldberg, D. W. Hosmer Jr., K. F. Humphrey, J. K. Ockene, W. J. Gamble, J. C. Witschi, and F. J. Stare. 1989. Effects on blood pressure of a decrease in sodium use in institutional food preparation: The Exeter-Andover project. Journal of Clinical Epidemiology 42(3):201-208.
ERS (Economic Research Service). 1998. Food procurement by USDA’s farm service agency. Agricultural Economic Report No. 766. Washington, DC: Economic Research Service.
ERS. 2010. The food assistance landscape: FY 2009 annual report. Economic Information Bulletin No. 6-7. Washington, DC: Economic Research Service.
Fern, E. 2009. Identifying strategies to reduce sodium intake in the U.S. population. Presented at the Institute of Medicine Committee on Strategies to Reduce Sodium Intake’s Public Information-Gathering Workshop, March 30, Washington, DC.
Fishbein, M. 2000. The role of theory in HIV prevention. AIDS Care 12:273-278.
Fishbein, M., S. E. Middlestadt, and P. J. Hitchcock. 1991. Using information to change sexually transmitted disease-related behaviors: An analysis based on the theory of reasoned action. In Research issues in human behavior and sexually transmitted diseases in the AIDS era, edited by J. N. Wasserheit, S. O. Aral, and K. K. Holmes. Washington, DC: American Society for Microbiology. Pp. 243-257.
FNS (Food and Nutrition Service). 2009. Nutrition Assistance Programs. http://www.fns.usda.gov/fns (accessed November 18, 2009).
Food Marketing Institute. 2005. Shopping for health 2004: Making sense of nutrition news and health claims. Washington, DC and Emmaus, PA: Food Marketing Institute and Prevention magazine.
Food Processing. 2009. Top 100 report for 2009. Food Processing August:28-29.
Fox, M. K., W. Hamilton, and B. H. Lin. 2004. Effects of food assistance and nutrition programs on nutrition and health: Volume 4, executive summary of the literature review.
Food Assistance and Nutrition Research Report No. 19-4. Washington, DC: Economic Research Service.
Frazao, E., and J. E. Allshouse. 1996. Size and growth of the nutritionally-improved food market. Agricultural Information Bulletin No. 723. Washington, DC: Economic Research Service.
FTC (Federal Trade Commission). 2003. Slotting allowances in the retail grocery industry: Selected case studies in five product categories. FTC Staff Study.
Fuller, G. W. 2005. New food product development: From concept to marketplace. 2nd ed. Boca Raton, FL: CRC Press.
Galef, B. G., Jr. 1996. Food selection: Problems in understanding how we choose foods to eat. Neuroscience and Biobehavioral Reviews 20(1):67-73.
GAO (Government Accountability Office). 2000. Food and commodities: Federal purchases and major regulations that potentially affect prices paid. GAO/RCED-00-173R. Washington, DC: Government Accountability Office, Resources, Community, and Economic Development Division.
GAO. 2008. Food Stamp Program options for delivering financial incentives to participants for purchasing targeted foods: Report to the Chairman, Committee on Agriculture, Nutrition, and Forestry, U.S. Senate. GAO-08-415. Washington, DC: Government Accountability Office.
Glanz, K., K. Resnicow, J. Seymour, K. Hoy, H. Stewart, M. Lyons, and J. Goldberg. 2007. How major restaurant chains plan their menus: The role of profit, demand, and health. American Journal of Preventive Medicine 32(5):383-388.
Glanz, K., B. K. Rimer, and K. Viswanath, (eds). 2008. Health behavior and health education: Theory, research, and practice. 4th ed. San Francisco, CA: Jossey-Bass.
Glanz, K., J. F. Sallis, B. E. Saelens, and L. D. Frank. 2005. Healthy nutrition environments: Concepts and measures. American Journal of Health Promotion 19(5):330-333.
Gordon, A., and M. K. Fox. 2007. School Nutrition Dietary Assessment Survey-III: Summary of findings. Washington, DC: USDA Food and Nutrition Service.
Grasso, V. B. 2008. Department of Defense food procurement: Background and status. CRS Report No. RS22190. Washington, DC: Congressional Research Service, Library of Congress.
Hanson, G. D., G. P. Rauniyar, and R. O. Herrmann. 1994. Using consumer profiles to increase the U.S. market for seafood: Implications for aquaculture. Aquaculture 127(4): 303-316.
Harris, J. M., P. R. Kaufman, S. W. Martinez, and C. Price. 2002. The U.S. food marketing system, 2002: Competition, coordination, and technological innovations into the 21st century. Agricultural Economic Report No. 811. Washington, DC: Economic Research Service.
Hattersley, V. 2009. A U.K. retailer perspective. Presented at the Institute of Medicine Committee on Strategies to Reduce Sodium Intake’s Public Information-Gathering Workshop, March 30, Washington, DC.
Hayden, K. 2004. Science and flavor at the crossroads. Flavor & the Menu, Fall 2004.
Heidolph, B. B. 2008. Is sodium reduction the next target in the “better-for-you” formulation trend? Cereal Foods World 53(1):21-27.
Heyhoe, T. 2002. Effective communication. In Food product development: Based on experience, edited by C. Side. Ames: Iowa State Press. Pp. 3-12.
HHS (U.S. Department of Health and Human Services). 1987. Review of research on the effects of health warning labels: A report to the United States Congress. Rockville, MD: U.S. Department of Health and Human Services.
Honkanen, P., S. O. Olsen, and B. Verplanken. 2005. Intention to consume seafood—The importance of habit. Appetite 45(2):161-168.
Hornik, R., and K. D. Woolf. 1999. Using cross-sectional surveys to plan message strategies. Social Marketing Quarterly 5(2):34-41.
Huang, K. S., and B. H. Lin. 2000. Estimation of food demand and nutrient elasticities from household survey data. Technical Research Bulletin 1887. Washington, DC: Economic Research Service.
IFIC (International Food and Information Council). 2008. 2008 Food and Health Survey: Consumer attitudes toward food, nutrition & health. Washington, DC: International Food Information Council.
IFIC. 2009. 2009 Food and Health Survey: Consumer attitudes toward food, nutrition & health. Washington, DC: International Food Information Council.
IOM (Institute of Medicine). 2002. Speaking of health: Assessing health communication strategies for diverse populations. Washington, DC: The National Academies Press.
IOM. 2007. Seafood choices: Balancing benefits and risks, edited by M. C. Nesheim and A. L. Yaktine. Washington, DC: The National Academies Press.
IOM. 2009. School meals: Building blocks for healthy children, edited by V. A. Stallings, C. W. Suitor, and C. L. Taylor. Washington, DC: The National Academies Press.
Kahkonen, P., and H. Tuorila. 1998. Effect of reduced-fat information on expected and actual hedonic and sensory ratings of sausage. Appetite 30(1):13-23.
Kahkonen, P., P. Hakanpaa, and H. Tuorila. 1999. The effect of information related to fat content and taste on consumer responses to a reduced-fat frankfurter and a reduced-fat chocolate bar. Journal of Sensory Studies 14(1):35-46.
Khoo, C. 2009. Campbell’s salt reduction journey. Presented at the Institute of Medicine Committee on Strategies to Reduce Sodium Intake’s Public Information-Gathering Workshop, March 30, 2009, Washington, DC.
Kimmerling, G. F. 1985. Warning: Workers at risk, train effectively. Training and Development Journal 39(4):50-55.
Kinsey, J. 1983. Working wives and the marginal propensity to consume food away from home. American Journal of Agricultural Economics 65(1):10-19.
Kramer, F. 2002. Initial and progressive cost estimates. In Food product development: Based on experience, edited by C. Side. Ames: Iowa State Press. Pp. 179-188.
Lancaster, K. J. 1966. A new approach to consumer theory. Journal of Political Economy 74(2):132-157.
Lattin, G. W. 2009. The lodging and food service industry. 7th ed. Lansing, MI: American Hotel & Lodging Educational Institute.
Leader, N. G., and I. D. H. Cuthill. 2008. Impact of new product development of store brands on branded manufacturers in the U.S. grocery industry. Oswego, NY: State University of New York at Oswego, School of Business Marketing Department.
Lehto, M. R., and J. M. Miller. 1986. Warnings: Vol. I: Fundamentals, design, and evaluation methodologies. 1st ed. Ann Arbor, MI: Fuller Technical Publications.
Liese, A. D., K. E. Weis, D. Pluto, E. Smith, and A. Lawson. 2007. Food store types, availability, and cost of foods in a rural environment. Journal of the American Dietetic Association 107(11):1916-1923.
Lin, B. H., and J. F. Guthrie. 2007. How do low-income households respond to food prices? Economic Information Bulletin No. 29-5. Washington, DC: USDA Economic Research Service.
Lin, B.-H., J. Guthrie, and E. Frazão. 1999. Nutrient contribution of food away from home. In America’s eating habits: Changes and consequences, edited by E. Frazão. Agriculture Information Bulletin No. 750. Washington, DC: U.S. Department of Agriculture, Economic Research Service, Food and Rural Economics Division. Pp. 213-242.
Lucock, M., and Z. Yates. 2009. Folic acid fortification: A double-edged sword. Current Opinion in Clinical Nutrition and Metabolic Care 12(6):555-564.
Lutz, S. M., D. M. Smallwood, and J. R. Blaylock. 1995. Limited financial resources constrain food choices. FoodReview 18:13-17.
Maes, N. 2008. Child’s palate. Plate 67-72.
Martinez, S. 2007. The U.S. food marketing system: Recent developments, 1997–2006. Economic Research Report No. 42. Washington, DC: Economic Research Service.
Mayer, R. N., K. R. Smith, and D. L. Scammon. 1991. Evaluating the impact of alcohol warning labels. Advances in Consumer Research 18:706-714.
McCracken, V., and J. A. Brandt. 1987. Household consumption of food away from home: Total expenditure and by type of food facility. American Journal of Agricultural Economics 69(2):274-284.
McLeroy, K. R., D. Bibeau, A. Steckler, and K. Glanz. 1988. An ecological perspective on health promotion programs. Health Education Quarterly 15(4):351-377.
Monahan, J. L. 1995. Thinking positively: Using positive affect when designing health messages. In Designing health messages: Approaches from communication theory and public health practice, edited by E. Maibach and R. L. Parrott. Thousand Oaks, CA: Sage. Pp. 81-98.
Morris, L. A., M. B. Mazis, and E. Gordon. 1977. A survey of the effects of oral contraceptive patient information. Journal of the American Medical Association 238:2504-2508.
Moskowitz, H., M. Reisner, and A. Maier. 2009. Creating food concepts to guide product development and marketing. In An integrated approach to new food product development, edited by H. Moskowitz, I. S. Saguy and T. Straus. Boca Raton: Taylor and Francis Group, LLC. Pp. 175-216.
Nachay, K. 2008. Staying smart about salt. Food Technology 62(3):26-35.
National Restaurant Association. 2008. 2009 Restaurant industry forecast. Washington, DC: National Restaurant Association.
Nestlé Ltd. 2007. Innovating the future: Research and development for nutrition, health and wellness. Vevey, Switzerland: Nestec Ltd.
Nestle, M., R. Wing, L. Birch, L. DiSogra, A. Drewnowski, S. Middleton, M. Sigman-Grant, J. Sobal, M. Winston, and C. Economos. 1998. Behavioral and social influences on food choice. Nutrition Reviews 56(5 (Part II)):S50-S74.
New York City Department of Health and Mental Hygiene. 2008. Mayor Bloomberg and Shaquille O’Neal announce new food standards for City agencies. (Press release.)
Nielsen, S. J., and B. M. Popkin. 2003. Patterns and trends in food portion sizes, 1977–1998. Journal of the American Medical Association 289(4):450-453.
Paeratakul, S., D. P. Ferdinand, C. M. Champagne, D. H. Ryan, and G. A. Bray. 2003. Fast-food consumption among US adults and children: Dietary and nutrient intake profile. Journal of the American Dietetic Association 103(10):1332-1338.
Park, Y. K., C. T. Sempos, C. N. Barton, J. E. Vanderveen, and E. A. Yetley. 2000. Effectiveness of food fortification in the United States: The case of Pellagra. American Journal of Public Health 90(5):727-738.
Petraitis, J., B. R. Flay, and T. Q. Miller. 1995. Reviewing theories of adolescent substance use: Organizing pieces in the puzzle. Psychological Bulletin 117:67-86.
Pfeiffer, C. M., C. L. Johnson, R. B. Jain, E. A. Yetley, M. F. Picciano, J. I. Rader, K. D. Fisher, J. Mulinare, and J. D. Osterloh. 2007. Trends in blood folate and vitamin B-12 concentrations in the United States, 1988–2004. American Journal of Clinical Nutrition 86(3):718-727.
Pollak, R. A., and M. L. Wachter. 1975. The relevance of the household production function and its implications for the allocation of time. Journal of Political Economy 83(2): 255-278.
Private eyes. 2007. Progressive Grocer, December 2007.
Raine, K. D. 2005. Determinants of healthy eating in Canada: An overview and synthesis. Canadian Journal of Public Health 96(Supplement 3).
Ram, C. 2008. Shaking things up: Low-sodium dishes offer flavor without sacrifice. Plate 59-64.
Ram, C. 2009. Whole grains, whole flavors. Plate 49-54.
Redman, B. J. 1980. The impact of women’s time allocation on expenditure for meals away from home and prepared foods. American Journal of Agricultural Economics 234-237.
Reichler, G., and S. Dalton. 1998. Chefs’ attitudes toward healthful food preparation are more positive than their food science knowledge and practices. Journal of the American Dietetic Association 98(2):165-169.
Rolls, B. J. 2003. The supersizing of America: Portion size and the obesity epidemic. Nutrition Today 38(2):42-53.
Rosenstock, I. M., V. J. Stretcher, and M. H. Becker. 1994. The health belief model and HIV risk behavior change. In Preventing AIDS: Theories and methods of behavioral interventions, edited by R. J. DiClemente and J. L. Peterson. New York: Plenum Press. Pp. 5-24.
Saguy, I. S., and M. Peleg. 2009. Accelerated and parallel storage in shelf life studies. In An integrated approach to new food product development, edited by H. Moskowitz, I. S. Saguy, and T. Straus. Boca Raton, FL: Taylor and Francis Group, LLC. Pp. 429-455.
Scarpa, J. 2009. Healthy R&D perspectives. Culinology, September 3.
Shepherd, R. 2005. Influences on food choice and dietary behavior. Forum of Nutrition 57:36-43.
Shi, H., and D. W. Price. 1998. Impacts of sociodemographic variables on the implicit values of breakfast cereal characteristics. Journal of Agricultural and Resource Economics 23(1):126-139.
Stewart, D. W., and I. M. Martin. 1994. Intended and unintended consequences of warning messages: A review and synthesis of empirical research. Journal of Public Policy & Marketing 13(1):1-19.
Story, M., K. M. Kaphingst, R. Robinson-O’Brien, and K. Glanz. 2008. Creating healthy food and eating environments: Policy and environmental approaches. Annual Review of Public Health 29:253-272.
Straus, T. 2009. The new product success equation: Building success into the new product development process (a.k.a. an objective-based product development process). In An integrated approach to new food product development, edited by H. Moskowitz, I. S. Saguy, and T. Straus. Boca Raton, FL: Taylor and Francis Group, LLC. Pp. 3-24.
Supermarket News. 2009. SN’s top 75 retailers for 2009. http://supermarketnews.com/profiles/top75/2009/top-75/ (accessed July 31, 2009).
Thomas, M. 2007. Improving the success rate of new food product introductions: The role of the research chef. In Developing new food products for a changing marketplace. 2nd ed., edited by A. L. Brody and J. B. Lord. Boca Raton, FL: CRC Press. Pp. 345-364.
Tippett, K. S., C. W. Enns, and A. Moshfegh. 1999. Food consumption surveys in the U.S. Department of Agriculture. Nutrition Today 34:33-46.
Topp, E. 2007. Building superior R&D organizations. In Accelerating new food product design and development, edited by J. H. Beckley, M. M. Foley, E. J. Topp, J. C. Huang, and W. Prinyawiwatkul. Ames, IA: Blackwell Publishing and the Institute of Food Technologists. Pp. 41-53.
Tuorila, H., A. V. Cardello, and L. L. Lesher. 1994. Antecedents and consequences of expectations related to fat-free and regular-fat foods. Appetite 23(3):247-263.
U.S. Department of Commerce. 2008. Processed food outlook. http://www.trade.gov/td/ocg/report08_processedfoods.pdf (accessed July 20, 2009).
USDA (U.S. Department of Agriculture). 1995. Improving USDA commodities: Tri-agency commodity specification review report. Washington, DC: U.S. Department of Agriculture.
USDA/Food and Consumer Service. 1995. National School Lunch Program and School Breakfast Program: School Meals Initiative for healthy children, final rule. Federal Register 60(113):31188.
USDA/FNS (Food and Nutrition Service). 2007. Special Supplemental Nutrition Program for Women, Infants and Children (WIC): Revisions in the WIC food packages; interim rule. Federal Register 72(234):68966-69032.
Valdovinos, M. 2009. Chef formulation and integration: Ensuring that great food and food science work together. In An integrated approach to new food product development, edited by H. Moskowitz, I. S. Saguy, and T. Straus. Boca Raton, FL: Taylor and Francis Group, LLC. Pp. 303-316.
van Boekel, M. A. J. S. 2009. Innovation as science. In An integrated approach to new food product development, edited by H. Moskowitz, I. S. Saguy, and T. Straus. Boca Raton, FL: Taylor and Francis Group, LLC. Pp. 37-52.
Walker, J. R. 2009. Introduction to hospitality. Upper Saddle River, NJ: Pearson Education, Inc.
Walker, J. R., and D. E. Lundberg. 2005. The restaurant: From concept to operation. 4th ed. Hoboken, NJ: John Wiley & Sons.
Ward, M. B., J. P. Shimshack, J. M. Perloff, and J. M. Harris. 2002. Effects of the private-label invasion in food industries. American Journal of Agricultural Economics 84(4): 961-973.
Watzke, H. J., and J. B. German. 2009. Personalizing foods. In An integrated approach to new food product development, edited by H. Moskowitz, I. S. Saguy, and T. Straus. Boca Raton, FL: Taylor and Francis Group, LLC. Pp. 133-173.
Webster, J. 2009. Reformulating food products for health: Context and key issues for moving forward in Europe. http://ec.europa.eu/health/nutrition_physical_activity/docs/ev20090714_wp_en.pdf (accessed February 3, 2010).
Weinstein, H. 2002. Contract packaging or in-house manufacturing? In Food product development: Based on experience, edited by C. Side. Ames: Iowa State Press. Pp. 171-177.
Weisberg, K. 2006. CIA, Harvard link on flavor. Foodservice Director 19(2):8.
Wetter, A. C., et al. 2001. How and why do individuals make food and physical activity choices? Nutrition Reviews 59(3, Part II):S11-S20.
Wiemer, K. 2009. Comment letter submitted to IOM Sodium Committee by General Mills, Inc.
Willows, N. D. 2005. Determinants of healthy eating in Aboriginal peoples in Canada: The current state of knowledge and research gaps. Canadian Journal of Public Health 96(Supplement 3):S32-S36.
Winslow, C. E. A. 1984 (Reprint of 1923 publication). The evolution and significance of the modern public health campaign. New Haven, CT: Yale University Press.
Wolf, C. W. 2009. Trend monitoring: Sorting fad from long-lasting profit-building trends. In An integrated approach to new food product development, edited by H. Moskowitz, I. S. Saguy, and T. Straus. Boca Raton, FL: Taylor and Francis Group, LLC. Pp. 79-95.
Wollmeringer, M. S. Guidelines for salt and fat reductions in the armed forces recipe service. Natick, MA: Natick, Soldier Center, U.S. Army Soldier and Biological Chemical Command.
Wrick, K. 2009. Tastefully reducing sodium. Prepared Foods 178(9):67-75.
Zoumas-Morse, C., C. L. Rock, E. J. Sobo, and M. L. Neuhouser. 2001. Children’s patterns of macronutrient intake and associations with restaurant and home eating. Journal of the American Dietetic Association 101(8):923-925.


