
8
Committee’s Considerations and Basis for Recommendations
The committee’s general approach to identifying recommended strategies is illustrated in Figure 1-1 in Chapter 1. To identify recommended strategies for reducing sodium intake among the U.S. population, the committee considered the past initiatives and unique challenges described in Chapters 2 and 3. This information served as a stage-setting activity for the committee. Next, the committee considered the array of factors outlined in Chapters 4 through 7 ranging from the functional effects of sodium in foods to the food environment to regulatory options. The goal was to examine the lessons learned from past and current efforts to reduce sodium intake within the context of the available information about important factors in considering strategies to reduce sodium intake. The result provided an informed basis for identifying effective and sustainable strategies. The findings and considerations are discussed below. The recommended strategies are presented in Chapter 9.
LESSONS LEARNED FROM CONSUMER-ORIENTED PUBLIC HEALTH INITIATIVES
As described in Chapter 2, the committee reviewed campaigns and interventions initiated as early as the 1969 White House Conference on Food, Nutrition, and Health and continuing to the present. These activities are noteworthy for the number and range of organizations and initiatives that have worked to educate consumers about the importance of reducing sodium intake and impact their food choices to reduce intake. Over the past 40 years, government agencies, authoritative scientific bodies, and health professional organizations have set target goals for sodium intake and dis-
seminated relevant information to consumers as well as health professionals and other stakeholders. The activities generally focused on informing consumers about the health consequences of high sodium intake and included attempts to motivate consumers to make changes. Efforts to put in place point-of-purchase information about the sodium content of foods and to encourage the food industry to voluntarily reduce the sodium content of foods were included as adjunct activities to assist consumers. Given that sodium intake estimates from national surveys beginning in 1971 have not shown a decline, and suggest that sodium intake has increased, the goal has not been achieved.
|
Despite 40 years of efforts to reduce sodium intake in the United States, intakes remain much higher than recommended levels. |
The committee first considered the possibility that the failure to reduce intake was due to basic flaws or inadequate implementation of the efforts to educate and motivate consumers. Although it is likely there is room for improvement in these consumer-based initiatives, the explanation appears to rest with the nature of the public health problem itself. In the case of sodium intake reduction, at least two factors limit the success of efforts based on consumer education and motivation alone.
-
Many of the foods consumed by Americans—from breads to entire meals—are processed in ways that include the addition of salt and contribute significant amounts of sodium to the diet. Sodium is relatively ubiquitous in the food supply, and it is challenging for the average consumer to avoid consuming sodium.
-
Americans have become accustomed to high-salt taste preference. When coupled with consumer surveys indicating that taste is a primary influence on food selection and consumption, often overriding other reasons such as health motivations and even cost, this acquired taste preference warrants special attention. Further, because a high-salt diet may actually enhance the liking of salty foods, the U.S. food supply—which is high in added salt—may work against consumers’ successfully lowering their taste preferences for salt and therefore handicap the acceptance of lower-sodium foods.
|
On balance, consumer-based initiatives without a concomitant change in the overall food supply and without considerations related to changing salt taste preference are likely to be inadequate to address the public health problem. |
The need for changes in the food supply is not a conclusion unique to this committee, nor are the challenges associated with consuming a low-sodium diet, given the general nature of the food supply as experienced by the average American. Rather, as documented in Chapter 2, the major public health initiatives beginning in 1969 called on the food industry to reduce the sodium content of foods. Table 8-1 lists some examples of related comments from study authors.
Despite long-standing efforts by government, public health groups, and food industry leaders to encourage reformulation of foods to lower-sodium content and thus reduce sodium in the food supply, the U.S. food supply remains high in sodium as described in Chapter 2. Between 1984 and 2004, the sodium content of a number of McDonald’s products was reduced by an average of 9 percent; the content of a number of Quaker products was reduced by an average of 23 percent; and the amount of sodium in 13 Campbell’s soup products declined by an average of 10 percent (CSPI, 2005). A tracking survey of a relatively small sample of foods carried out by a public interest group beginning in 1983, indicates that of the 69 products still marketed in 2004, the average sodium content
TABLE 8-1 Examples of Comments Concerning the Need for Change in the Food Supply
|
Reference |
Comment |
|
Fodor et al., 2009a |
“The DASH [Dietary Approaches to Stop Hypertension] diet was successful as long as food was provided to the study participants … as soon as the respondents had to take care of their diet themselves … the beneficial effects of this diet diminished or disappeared.” |
|
Kumanyika et al., 2005b |
“Sodium reduction sufficient to favorably influence the population blood pressure distribution will be difficult to achieve without food supply changes.” |
|
Loria et al., 2001 |
“[In the context] of the overwhelming lack of adherence to dietary sodium guidelines … [there is a] need for a multifaceted approach….” |
|
Cleveland et al., 1993c |
“The results [of the study] document the advantage of a change in the food supply—toward convenience foods with less sodium.” |
|
aCopyright © 2009 Journal of Clinical Hypertension. Reproduced with permission from John Wiley & Sons. bReprinted by permission from Macmillan Publishers Ltd: Journal of Human Hypertension 19(1):33–45, Copyright © 2005. cReprinted from Journal of the American Dietetic Association, 93(5), Cleveland et al., Method for identifying differences between existing food intake patterns and patterns that meet nutrition recommendations, pp. 556–560, Copyright © 1993, with permission from Elsevier. |
|
decreased by 5 percent (from 592 to 564 mg) during the 20-year period (CSPI, 2008). However, for the more recent 10-year period (1994–2004), this survey reported an actual increase of 6 percent, suggesting that the reductions gained in the 1980s and early 1990s have been reversed. During the public information-gathering workshop convened by the committee (March 30, 2009), discussions among food industry panelists suggested that a 10–20 percent reduction in sodium for some products was a realistic estimate, but there are also reports that a few products may have achieved a 50 percent reduction in sodium while others achieved reductions smaller than 10 percent.1 While such information is generally encouraging, the overall picture for the United States reveals little success for the industry as a whole. Even though there is evidence of efforts to reduce sodium in some food products on the part of larger food processors and a few restaurant chains, meaningful overall reductions in the food supply have not been accomplished. Specifically, Figure 2-4A indicates, on the basis of sodium density, that the amount of sodium in the overall food supply has not declined over time.
|
Past voluntary efforts by the processed food and restaurant/foodservice industries to reduce the sodium content of the food supply have not been successful in meeting the goal of reducing population sodium intake. Specific reasons cannot be documented but are likely due to a myriad of reasons. |
A Unilever press release stated that consumers will be more likely to adapt their taste preference to lower levels of salt if the food industry as a whole reduces salt levels.2 During the committee’s public information-gathering workshop (March 30, 2009), a panel of food industry representatives discussed the issue of reducing the sodium content of the foods they sell. One representative stated:
We also need to have a much more cohesive industry-wide approach. We have seen, to our detriment when we’ve tried to take a leadership role in reducing nutrients of concern unilaterally in different product areas that the consumers just move to different brands that have higher levels of those nutrients of concern at the expense of our products. And so, unless there is a consistent approach across the industry, with a baseline set so that we’re all operating off a similar starting point, it will be difficult for any one company to take the lead.
|
1 |
Personal communication, J. Ruff, Kraft Foods (retired), October 2009. |
|
2 |
Available online: http://www.unilever.com/mediacentre/pressreleases/2009/Unilevermakesacommitmenttoreducesaltacrossitsportfolio.aspx (accessed November 14, 2009). |
This comment is consistent with the Food and Drug Administration (FDA) action to suspend the planned decrease in the levels of sodium per serving that a food product must have to bear the claim “healthy” (HHS/FDA, 2005).
In sum, food industry representatives report challenges associated with marketing products with substantially lower sodium—and hence a less acceptable taste profile—compared to competitors’ products. It is known that food taste is an important determinant of food choice, and to alter salt taste preferences will likely require a level playing field approach in which salt reductions are made across the food supply. Luft et al. (1997) offered the following observation:
The food industry has made a genuine effort to introduce low-salt food products; however, the public has not been willing to purchase the products and many have been withdrawn because they could not be sold (C.S. Khoo, personal communication, 1994). Pietinen et al. (1984) also observed that during their intervention (in Finland), low-salt bread, margarine, sausage, and mineral water were available. However, by the end of the study, only the mineral water and the margarine were selling well and were still available. Thus, the conclusion that compliance to a low-salt diet is difficult solely because of an uncooperative and nefarious food industry is overstated and not supported by the evidence. Public tastes continue to dictate the marketplace.
|
Given the need for food products to be “palatably competitive,” the food industry lacks a level playing field for reduction of sodium in foods. |
In view of these findings, the evidence presented in Chapter 3 regarding salt taste provides a foundation for identifying strategies to reduce sodium intake. An important consideration is that while the preference for salt taste, if not addressed, will be a barrier to success in lowering the sodium content of the food supply, salt taste preference is mutable and can be lowered. The preference for salt beyond physiological need may be due to evolutionary pressures to consume salt that have shaped an innate liking for its taste, or, alternatively and perhaps concomitantly, be due to learning, particularly early learning. Continued exposure to high levels of salt in the food supply likely reinforces the preference for a higher level of intake. Kumanyika (1991) noted that the environment promotes adaptation to a higher salt preference, even for individuals who prefer a low sodium dietary pattern, because it is difficult for them to sustain avoidance of inadvertent consumption of foods with high amounts of added salt.
Existing experience with lowering the taste preference for salt (Engstrom
et al., 1997; NHLBI, 1996; public information-gathering session held by the committee on March 30, 2009), when coupled with a number of published experimental studies (see Chapter 3), suggest that salt taste preference may be most successfully decreased through a stepwise process and is likely dependent on lowering salt sources overall.
|
The general preference for salt taste can be changed. High levels of salt in the food supply can reinforce the preference for salt taste. |
Finally, point-of-purchase information about the sodium content of foods has been the third prong of national public health initiatives. Nutrition labels have appeared on packaged foods since the 1970s and were mandated in 1993, but sodium intake has not declined. However, the availability of nutrition information for foods is a prerequisite for consumers’ ability to make informed choices.
|
Availability to consumers of food label information about the sodium content of foods has not been accompanied by an overall reduction of sodium intake by the U.S. population. |
Regarding point-of-purchase information—health claims or claims about sodium reduction in foods—intended to stimulate the food industry to reformulate foods, the promise associated with the marketability of such claims has not been realized. The ability to make claims about reduced levels of sodium in food products has not stimulated substantial or successful food reformulation or impacted the overall content of sodium in the food supply. Not surprisingly, the label surveys described in Chapter 2 revealed that claims about the sodium content of packaged foods are not widely used. As described in Chapter 6, the food industry likely is concerned that consumers associate reduced- or lower-sodium claims with poor-tasting products.
|
Label claims about the sodium content of food have not been widely used by manufacturers, perhaps because of concern that consumers associate such claims with poor-tasting products. |
In the face of these unsuccessful national initiatives, some state and local authorities have taken on initiatives intended to reduce sodium intake. Much of this activity has centered on making point-of-purchase sodium information for restaurant/foodservice menu items available to consumers
(see Appendix J). At least one current voluntary initiative in the United States addresses the sodium content of the food supply. The National Salt Reduction Initiative (NSRI), described in Appendix G, was developed initially by the New York City Health Department and has expanded into a national collaboration of state public health authorities and organizations. Based on the United Kingdom (UK) Food Standards Agency’s Salt Reduction Campaign (see Appendix C), the NSRI aims to decrease sodium by setting targets that are defined as substantive and achievable and will result in gradual, measurable reductions of sodium content over time. The initiative includes two parallel components, one focusing on processed foods and the second on restaurants and the foodservice industry. The NSRI uses a food category approach to set targets for the sodium content of foods and relies on voluntary compliance on the part of the food industry.
A national collaboration of this type may be useful in encouraging the food industry to voluntarily lower the sodium content of its foods, and the reach of such efforts may extend to communities not actively participating in the initiative given the nationwide distribution of many food products. However, such initiatives are challenged by the inability to ensure that there will be compliance and they do not guarantee a level playing field for food producers. Additionally, it is likely that volunteers will drop out as reductions become more challenging over time. Further, these efforts may not be sustainable in the long term because they rely on “bully pulpit” and strong leadership approaches that can be reduced or lose political popularity with changes in state and local government administration. Additionally, other emerging public health concerns may draw focus away from the sodium initiatives.
Overall, the committee’s considerations of the public health initiatives of the past 40 years directed toward lowering sodium intake by the U.S. population are outlined in Box 8-1.
INFORMATION FROM SODIUM INITIATIVES IN OTHER COUNTRIES
Appendix C contains specific information on efforts to reduce sodium intake in the United Kingdom, Canada, Finland, France, and the European Union. Components of these programs are summarized in Table 8-2, and the programs are described below.
Of the countries for which information is available, Finland has had the longest experience; initiatives were begun in the 1970s when intake was estimated to be more than 5,000 mg/d for adult males. Stroke mortality and blood pressure rates have declined. The efforts in the United Kingdom, which are relatively comprehensive, are of more recent origin with initia-
|
BOX 8-1 Findings from Review of Public Health Initiatives
|
tives beginning in 2003, following a national survey in 2000–2001 that suggested an average daily intake of more than 3,800 mg/d of sodium.
The activities in Finland focused on extensive media campaigns in the 1970s and 1980s, during which consumer awareness was the focus. These were followed by required labeling in the 1990s. The labeling is targeted to eight food categories known to be rich sources of salt in the diet: bread, sausages, cheese, butter, breakfast cereals, crisp bread, fish products, and soups, sauces, or ready-made dishes. Those foods that exceed a certain level of salt based on the percentage of salt “by fresh weight of the product” are required to bear a “high-salt” label, while those below certain percentages of fresh weight of product are allowed to bear a “low-salt” label.
In Finland, manufacturers apparently worked to reduce the sodium content of foods in these eight food categories, achieving for example a 10 percent reduction in the sodium content of sausages. Based on sodium excretion measures, the efforts in Finland coincided with a drop in sodium
TABLE 8-2 Overview of Initiatives in Other Countries
|
Country |
Public Education |
Requests to Industry for Sodium Reformulation |
Food Labeling |
Comments About Program |
|
Canada |
Yes |
Yes |
Voluntary |
|
|
Finland |
Yes |
Yes |
Mandatory |
|
|
France |
Yes |
Yes |
Voluntary |
|
|
Ireland |
Yes |
Yes |
Voluntary pending |
|
|
Country |
Public Education |
Requests to Industry for Sodium Reformulation |
Food Labeling |
Comments About Program |
|
United Kingdom |
Yes |
Yes |
Voluntary |
|
|
SOURCE: Adapted from Mohan et al. Copyright © 2009 Canadian Medical Association. This work is protected by copyright and the making of this copy was with the permission of Access Copyright. Any alteration of its content or further copying in any form whatsoever is strictly prohibited unless otherwise permitted by law. |
||||
intake between 1979 and 2002 from more than 5,000 mg/d to less than 3,900 mg/d among men and from nearly 4,000 mg/d to slightly less than 3,000 mg/d for women (Laatikainen et al., 2006). However, use of salt added at home has been notably higher in Finland than in the United States, and the majority of the reported reduction in sodium intake was primarily due to a reduction of almost 50 percent in salt added by consumers at the table or in the home.
More specifically, in 1980, the average Finnish sodium intake was 5,080 mg/d, of which 30 percent was from table salt used in households. This is compared to 1997–1999 when the average intake was 4,440 mg/d, of which 21 percent was from table salt used in households. Thus, in 1980, approximately 1,520 mg/d of sodium was added by the consumer and 3,560 mg/d came from other sources, compared to 1997–1999 when approximately 930 mg/d of sodium was added by the consumer and 3,510 mg/d came from other sources (Reinivuo et al., 2006).
The UK effort at present is an entirely voluntary activity that relies on the impact of strong messaging from public health authorities, highly targeted and specific messages to the population, and highly visible efforts to enlist industry involvement and cooperation. These activities have been the focus of considerable government activity ranging from dialoguing with stakeholders to set appropriate and workable targets for reducing the
salt content of key food categories to efforts to track progress toward the goal to government-sponsored awareness campaigns. Further, supermarkets and manufacturers are requested to voluntarily display front-of-package labeling of sodium and other nutrients using a traffic light color system. While a review of progress and the salt targets is planned for 2011,3 the UK government reported reductions in sodium intake among the general population from an average of 3,800 mg/d in 2000–2001 to 3,440 mg/d in 2008 based on urine analysis of approximately 700 adults (National Centre for Social Research, 2008). The latter estimate is in line with the current U.S. dietary estimates. The 2011 review is planned to include information about the costs of the program.
In 2007, the Canadian government launched a multistakeholder working group on sodium reduction. The group intends to work in stages and should shortly be issuing a strategic framework that is slated for implementation in 2010. In 2003, Ireland began its work with a program intended to raise the food industry’s awareness about the relationship between salt and health, and to work with the industry to voluntarily reduce sodium levels in foods. The Irish government reports that 72 companies have registered with the program, and reductions of approximately 20 percent in the sodium content of key foods such as breads and sausages have been reported. Similar to the situation in the United Kingdom, Irish intake estimates for sodium have been reported to be higher than U.S. estimates, but no recent national estimates subsequent to the implementation of the program are available. The French government released a report in 2002 that recommended a 20 percent reduction in sodium intake for its population and developed initiatives for consumers, the food/catering industry, and medical professions. To date, no significant changes have been reported in the salt content of processed foods or in the level of food labeling incorporated. Finally, the European Union has developed a so-called common framework approach to reducing salt intake among the populations of its member countries. The framework will focus on 12 categories of food identified as priorities.
No information on the cost effectiveness of these international strategies could be gleaned from the available data, although the United Kingdom plans to release information about the cost of its program in 2011.
Clearly, reducing sodium intake is a public health priority beyond the United States. The ability to directly relate existing reports from other countries to strategies that would be workable in the United States is somewhat difficult, given differences in food patterns, regulatory provisions, government resource capabilities, and consumers’ perspectives on the food supply as well as the perceived importance of reducing sodium intake. In particular,
|
3 |
Available online: http://www.food.gov.uk/healthiereating/salt/saltreduction (accessed November 16, 2009). |
the committee expressed concern that adopting an exclusively voluntary approach in the United States may have limited success and questionable potential for long-term sustainability based on past U.S. experience. It was also noted that the regulatory structure surrounding the U.S. food supply may make regulation more feasible in the United States than in some of the other nations that have initiated sodium reduction strategies.
However, strategies carried out in other countries offer relevant themes. First, labeling initiatives are a component of all programs and are reported to be of assistance to consumers. However, labeling format and consistency has been found to be important; one UK study of the use of front-of-pack labeling found that the coexistence of a number of label formats in the market caused consumer confusion on the levels of key nutrients (British Market Research Bureau, 2009). Second, those who have worked to issue guidelines for the sodium content of foods have approached the task on the basis of food categories. The efforts undertaken by the United Kingdom in regard to food categories are particularly noteworthy and illustrative (see Appendix C). They reportedly reflect extensive dialogues with knowledgeable stakeholders and are fairly comprehensive. They have also served as the basis for the NSRI coordinated by the New York City Health Department (see Appendix G).
THE POSSIBILITY OF ECONOMIC INCENTIVES
In addition to the lessons learned from past experience, several approaches based on economic incentives have been suggested as strategies for reducing sodium intake and have an experience of use in other areas. These include agricultural subsidies for foods with lower sodium, tax incentives for production of lower-sodium foods, a salt tax on foods with higher sodium content, and a cap and trade system for salt or sodium. Although each of these possible approaches has the potential to reduce sodium intake, these may not be fine-tuned enough to reduce sodium intake or may be burdensome and costly relative to the potential reduction of sodium intake.
Agricultural Subsidies for Lower-Sodium Foods
Agricultural price supports have been provided for certain crops under periodic Farm Act legislation since the 1930s. The Farm Act legislation allows different methods of providing price and income support for agricultural commodities including direct payments, countercyclical payments, marketing assistance loans, and loan deficiency payments. Throughout the history of Farm Act legislation, covered commodities have included staple food commodities. Most recently, the Food, Conservation, and Energy Act passed in 2008 (i.e., the 2008 Farm Act) includes target prices for wheat,
corn, grain sorghum, barley, oats, cotton, rice, peanuts, soybeans, dry peas, lentils, and chickpeas. The payment mechanism most similar to an agricultural subsidy is the countercyclical payment in which farmers receive the difference between the crop’s target price and the current commodity price. It has been suggested that the list of commodities could be expanded to include fresh fruits and vegetables to encourage production of these commodities and thus reduce prices paid by consumers. The expected result is that lower prices for subsidized fruits and vegetables would encourage consumers to substitute fruits and vegetables for higher-sodium foods.
Without a great deal of further study, it is uncertain whether any reasonable level of subsidization of fruits and vegetables would cause consumers to alter their diets sufficiently to result in a lower total intake of sodium. Extension of the current Farm Act provisions to fruits and vegetables would involve development of a costly government infrastructure for administering the program, including determining target prices that take into account the differences in production practices across the country as well as enrolling a large number of additional farms. Also, agricultural subsidy programs can cause unfavorable market distortions and raise international trade issues. Thus, although subsidization of fruits and vegetables could potentially provide some benefit in encouraging an overall increase in consumption of fruits and vegetables, the benefits in terms of reducing sodium intake would likely not justify the costs of implementing such a strategy.
Tax Incentives for Production of Lower-Sodium Foods
Income tax incentives are, in some cases, provided by the federal or state governments to encourage production of certain products by manufacturers. For example, the American Recovery and Reinvestment Act of 2009 extended production tax credits and investment tax credits for the production of renewable energy (wind, solar, geothermal, and biofuels). It has been suggested that income tax incentives could be provided to food manufacturers for producing lower-sodium processed foods and to restaurant/foodservice operators for providing lower-sodium menu items. The tax credits would need to be tied to the volume of lower-sodium foods sold to ensure that products are offered for sale and consumers are purchasing the products in sufficient volume to have an appreciable effect on sodium intake. The expected result of the tax incentives is that more food manufacturers and restaurant/foodservice operators would provide lower-sodium foods and also would provide a broader range of lower-sodium foods at potentially lower prices.
Recommending tax incentives for the production of lower-sodium foods would not necessarily result in the desired outcome of lower sodium intake. Food manufacturers and restaurant/foodservice operators would weigh
the benefits of the tax incentive offered for lower-sodium foods against the potentially lower revenue that might occur if many of their customers prefer higher-sodium foods because of their taste. It is unclear whether food manufacturers and restaurant/foodservice operators would consider it to their advantage to offer lower-sodium foods once they evaluate the total potential effect on their profits. Furthermore, food manufacturers and restaurant/foodservice operators that can most easily reduce the sodium content of their foods are likely to do so, with the result that this strategy might achieve reductions only in some foods offered in some locations. In other words, tax incentives may not result in broad sodium intake reduction across the population. Because of the uncertainties regarding the resulting reduction of sodium intake, the costs of implementing a tax incentive system (including the extensive reporting requirements that would be needed) would likely exceed the benefits of such a strategy.
Salt Tax on Foods with High Sodium Content
Public policy advocates have recently been making the case for instituting food taxes on certain foods that are suspected to be leading causes of obesity4 (Brownell and Frieden, 2009; Brownell et al., 2009). These types of taxes, often referred to as “sin taxes,” are typically excise (i.e., per-unit) taxes imposed on particular products that are believed to be harmful to society (Williams and Christ, 2009). By increasing the prices that consumers pay for these potentially harmful products, this theory suggests that consumers will reduce their purchases, substitute more healthful alternatives, and thus improve public health. Although these taxes are typically proposed for foods such as calorically sweetened beverages and high-fat snacks to reduce their consumption due to concerns about obesity, it has also been suggested that foods high in sodium could be taxed to reduce their consumption due to concerns about diseases associated with high sodium intake.
There is insufficient evidence to demonstrate the effectiveness of a sodium tax or to ensure that it will not result in unintended consequences. Past research has shown that consumers are not very responsive to small changes in food prices (i.e., food prices are relatively inelastic). Thus, the tax rate on high-sodium foods would have to be fairly substantial to induce a sufficiently large change in food purchases in order to have a major influence on health (Forshee, 2008; Golan et al., 2009; Waist banned, 2009). This has already been demonstrated by the fact that states that have implemented taxes on soft drinks have not seen a substantial effect
|
4 |
Available online: http://www.sciencenews.org/view/generic/id/42598/title/Coming_Hard_tax_on_soft_drinks%3f (accessed November 16, 2009). |
on sales5 (Brownell et al., 2009). Furthermore, if consumers do alter their purchasing patterns in response to the tax, it is uncertain whether they would substitute more healthful alternatives (Williams and Christ, 2009). The issue of substitution is even more of a concern for a salt tax because sodium is an ingredient in numerous foods, some of which are otherwise nutritious. This is in contrast to a targeted tax on particular products such as sugar-sweetened beverages that have no nutritional benefits. Finally, sales taxes in general are regressive and affect lower-income households disproportionately more than higher-income households (Forshee, 2008; Williams and Christ, 2009), which could have the unintended consequence of crowding out purchases of other more healthful products and activities (Waist banned, 2009). Thus, given these concerns, other recommended strategies have the potential for a more direct reduction of sodium intake without the potential for unintended consequences on other purchase decisions by households.
Cap and Trade System for Sodium
Cap and trade systems are those in which market-based incentives are used with the intent of reducing harmful substances in the environment in an economically efficient manner. These systems have typically been applied for reducing air pollutants. For example, the 1990 Clean Air Act Amendments established a successful cap and trade system for sulfur dioxide emissions that drastically reduced these emissions at substantially lower cost than originally estimated.6 Under an air pollution cap and trade system, a cap is placed on the volume of a harmful air pollutant and fixed allowances are allocated in some manner to each polluting entity. Entities that can reduce emissions at relatively low cost sell their allowances to other entities that have greater difficulty in reducing emissions. The fixed allowances can be reduced gradually so that total air pollutant emissions will diminish over time.
It has been suggested that a similar cap and trade system could be established for salt (or sodium more generally) in processed foods (Forshee, 2008). In this case, an oversight body would place a cap on the amount of sodium that could be used in the production of processed foods. Food manufacturers would have to determine how to produce foods given their allocation of sodium credits, or they would have to purchase sodium credits from those manufacturers that can more easily reduce the sodium content of their foods. Thus, a cap and trade system could lead to reformulation of existing food products; development of new, lower-sodium foods; or
|
5 |
Ibid. |
|
6 |
Available online: http://www.edf.org/page.cfm?tagID=1085 (accessed October 12, 2009). |
elimination of certain products with high sodium content. If food manufacturers elect to purchase sodium credits in order to continue producing higher-sodium foods, they may pass along the associated costs of the salt credits to consumers, thereby raising the price of these foods and potentially reducing consumer purchases. Over time, as the available sodium allocations are reduced, the price of sodium credits in the marketplace would increase, thus further inducing food manufacturers to reformulate foods or reconsider their product offerings in order to produce foods within their given allocations.
The context for processed foods is so substantially different from that for air pollutants that it is unclear whether the application of cap and trade would result in the desired outcomes without negative consequences. Whereas the goal of a cap and trade system for air pollutants is to encourage polluters that can reduce emissions at the lowest marginal cost to do so, the goal of a public health initiative on sodium is to achieve the lowest possible average level of sodium among the foods that are the largest contributors to sodium intake. A cap and trade system for sodium could conceivably result in dramatic reductions in foods that are not significant sources of intake. Also, most food manufacturers produce a range of products and could elect to apply their sodium credits toward retaining higher sodium levels in certain foods while reducing them in others. However, such a compliance strategy might potentially result in disparities in the sodium content of individual diets, and may make changes in taste preferences difficult to achieve. Arguably, cap and trade programs are best suited to pollutants whose aggregate environmental impact does not vary with their distribution. In addition, cap and trade systems were developed for cases in which the behavior of polluters largely determines the extent of an environmental harm; with sodium, individuals have control over their dietary choices and can alter the sodium content of their diets, potentially negating any benefits of a sodium cap. Setting a cap for sodium would also be difficult because the optimal quantity of sodium credits would vary over time depending on the size of the population and demographic shifts that may be difficult to predict. Thus, for all of the reasons stated above, the costs of developing, implementing, and monitoring a successful cap and trade system for sodium undercut the ability to justify uncertain reductions in the sodium content of the food supply.
TECHNOLOGICAL ADVANCES
In light of the considerable role that salt taste plays in food choice, it is likely that it will be necessary to consider approaches that result in a modification of salt taste along with the search for salt substitutes if meaningful reductions on sodium intake are to be achieved. Chapter 3 presents the
possibilities for changes in salt taste preference and identifies other potential avenues for reduction of sodium in the food supply through the use of sensory approaches. In addition, more technological approaches are also relevant. The possibility of modifying the size and structure of salt particles holds some promise.
Use of sea salt to replace regular salt is an emerging interest in the food industry that could be of value to food formulators and chefs to assist in reducing the sodium content of some foods perhaps in part by enhancing overall flavor. However, since little is known about mechanisms potentially underlying this strategy and since sea salt contains large amounts of sodium, it is unclear how effective the use of sea salt might be in reducing overall sodium intake. Further consideration of sea salt as a useful adjunct to other sodium reduction strategies is indicated.
Effective and broadly useful salt substitutes have been elusive. Many sodium substitutes are more expensive than salt. Without significant consumer demand or pressure from governments and consumer and public health groups it is reasonable to expect that the food industry will not take on the expense of reformulation and added ingredient costs. Importantly, negative effects on taste reduce the appeal and general utility of sodium substitutes like potassium chloride. Although potassium chloride provides a salt taste to food, many individuals reportedly find that it imparts a bitterness to food that makes it unacceptable (Beauchamp and Stein, 2008), although the number of persons affected has not been determined. As discussed in Chapter 3, foods sometimes use up to a 50:50 ratio of potassium chloride mixed with salt (sodium chloride) to reduce bitterness, with higher ratios resulting in increased bitterness. While current dietary recommendations focus on increasing potassium in the diet of healthy Americans with normal kidney function, levels of intake above 4,700 mg/d may present risks for persons whose urinary potassium excretion is impaired, as discussed later in this chapter (DGAC, 2005).
Technological advances may lessen the need to use sodium to develop physical properties in foods or to prevent microbial growth. A number of alternatives for physical property development have already been discovered and are described in Chapter 4. For example, lower- or no-sodium alternatives to baking soda and baking powder have been developed, and the use of proteins, gums, and alginates has raised the possibility of reducing sodium in restructured meat products. Work continues to find additional ingredients that can impart these properties in foods and to explore alternative processing mechanisms. Similar advances may be possible to maintain food safety while reducing sodium. A number of researchers are searching for naturally occurring antimicrobial compounds (herbs, spices, etc.) (Doyle et al., 2001). In addition, new processing and packaging technologies such as non-thermal processing may find use as methods to improve the safety
and quality of foods. It is likely that additional technologies and new ingredients or ingredient applications will be found as sodium reduction becomes a higher priority for food researchers. Further, the differences in sodium content of similar foods, as outlined in Chapter 4, suggest that there is some flexibility for the food industry in meeting safety and functional needs for sodium, although this is likely to vary depending upon product type and conditions of food manufacture. As with salt substitutes, technological advances to reducing sodium while maintaining food safety and physical properties may have an associated cost and therefore may be more responsive to policy/regulatory changes or increased consumer demand.
THE OPPORTUNITY TO LEVERAGE SODIUM REDUCTION BY USE OF FOOD PURCHASE SPECIFICATIONS AND FOOD ASSISTANCE REQUIREMENTS
There is no doubt that large-scale government food procurement and food assistance programs reach a sizable proportion of the U.S. population. The large number of citizens served by such programs makes them potentially influential. As described in Chapter 6, efforts already undertaken to reduce the sodium content of school and military foods are seen as positive attempts to reduce sodium intake as a public health measure.
However, such activities cannot realistically be expanded or sustained if the context in which they operate—the broader food supply—is not addressed. Experiences with the U.S. Department of Agriculture Commodity Distribution Program for school meal foods, as described in Chapter 6, outlines some of the challenges. The same may hold true for a supplemental feeding program such as the Special Supplemental Nutrition Program for Women, Infants, and Children (WIC) in which the foods purchased are consumed with other foods obtained from the general food supply. There are also arguments against holding Supplemental Nutrition Assistance Program recipients to the challenge of obtaining a low-cost diet with limited lower-sodium choices available for the types of food typically consumed. A recent Institute of Medicine (IOM) report recommended a reduction in the sodium content of school foods but did so in the context of a gradual stepwise approach in anticipation of lowering the sodium content in a way that was not discernible to participants (IOM, 2009) and to give school foodservice personnel and suppliers of the school meal programs time to respond and adjust their activities. This is consistent with discussions below.
While reductions of sodium levels in foods in the entire food environment appear to hold the most promise, the procurement and assistance programs can seek opportunities to obtain or require the purchase of lower-sodium foods that still maintain acceptable flavor profiles but serve to reduce sodium intake. Some reduction in intake is preferable to none
at all. Furthermore, reformulations that would be required to secure large government contracts may result in increased availability of these lower-sodium products in other non-contract environments because companies may prefer not to reformulate to higher sodium levels for other contracts that lack sodium specifications. Finally, it was noted that in some cases, the existence of such programs offers the opportunity to teach participants ways to seek and use flavorful alternatives to foods with high levels of salt and sodium.
POTENTIAL FOR CHANGES IN THE REGULATORY STATUS OF SALT
Modification of the GRAS Provisions for the Addition of Salt to Food
The committee reviewed the issues surrounding the regulatory status of salt and concluded that the ability to adjust the generally recognized as safe (GRAS) status of salt is a potentially powerful and relatively adaptable regulatory tool. The potential of GRAS modification seems particularly promising given the failure of non-regulatory options to accomplish meaningful reductions in the sodium content of the food supply. In short, setting mandatory standards for the levels of salt in foods addresses many barriers to reducing overall sodium intake that have been identified as reasons for past strategy failures. GRAS modification can provide:
-
Changes in the sodium content across all food categories and brands—important changes that have not been seen using voluntary approaches.
-
A mechanism to reduce sodium in a gradual, consistent manner across the food supply to allow for changes in consumer taste preferences.
-
A sustainable approach that will maintain sodium reductions over time.
The goal is clearly not to ban salt use or to make foods unpleasant for consumers, but rather to begin the process of reducing the excessive addition of salt to processed foods and restaurant/foodservice menu items in a way that is measured, informed, and deliberative. As such, the approach would need to be carried out gradually in a stepwise manner with extensive real-time monitoring to inform the ongoing process. A stepwise approach is consistent both with the interest in changing the overall salt taste preference by slowly reducing the levels of salt to which consumers are exposed and with information suggesting that reducing the level of sodium in foods gradually means that changes in flavor profiles are likely to go unnoticed or
undetected. Rapid, major, and non-universal changes in the food supply will likely have negative impacts on the success of the program, ranging from consumers’ decreased enjoyment of food to the food industry’s inability to comply. While there is an inevitable tension between wanting to move quickly to protect public health and moving more gradually with informed decision making, it is evident that the only viable approach is a gradual, universal reduction if a sustained reduction consistent with achieving the goals of the Dietary Guidelines for Americans is to be accomplished. If initiated judiciously as part of an informed process, monitored extensively once implemented, and adjusted as needed, standards set for the levels of salt across the food supply should reduce sodium intake.
Rationale for GRAS Modification
The starting point for use of the available regulatory tools is the conclusion first voiced in 1979 that salt—given the levels at which it is currently added to the food supply—is no longer a substance for which there is a reasonable certainty of no harm. However, rather than conclude that salt’s GRAS status should be revoked, the committee found that it would be possible to modify the conditions under which salt is considered to be GRAS, that is, to set standards for the addition of salt to foods. This allows salt to remain a GRAS substance, but a GRAS substance for which standards are set and conditions of use are specified so as to reduce the total levels of sodium in the food supply. In short, by taking into account current dietary recommendations for its consumption, salt is a substance for which a safe use level in foods can be set. This approach would be preferable to revoking the GRAS status of all uses of salt. Revoking GRAS status is not consistent with the notion that there is a safe level of salt use. In addition, revoking GRAS status could cause disturbances and changes in the food supply that would undermine consumer support for regulatory actions to protect their health while increasing the regulatory burden on both FDA and the food industry to potentially unacceptable levels. Further, revoking GRAS status is not consistent with the fact that sodium is an essential nutrient.
Modification of the GRAS status of salt underpins a new set of strategies that could effectively reduce sodium intake. It would address the concern that much of the sodium in the diet comes from sources largely outside consumers’ direct control. Instructing consumers and providing labeling of foods, although critical, are not enough because they rely on individual behavior (Loria et al., 2001). Rather, an environmental change would not rely solely on human behaviors, which are difficult to change, and would have a faster and potentially greater effect than educational efforts aimed at increasing the consumption of lower-sodium products (Loria et al., 2001). There are some examples of the effectiveness of environmental change
from the nutrition field, such as the fortification programs associated with folate and niacin. However, sodium presents some unique challenges that were not encountered in these previous fortification programs; for example, sodium has taste and functional effects in foods, whereas the folate and niacin changes to the food supply were flavorless to consumers and had potentially less serious functional effects on foods. This would indicate that monitoring and surveillance during implementation of such a change is essential. The concern may be mitigated somewhat by the likelihood that if the entire food supply were to be lower in salt, the overall taste preference for salt would be decreased, facilitating the acceptance of a reduction in the sodium content of food.
Given the ability of existing regulatory provisions to be used to set standards for the conditions of use of a substance added to foods as part of an overall long-term process that can be adjusted and modified over time based on monitoring and stakeholder input, FDA could develop mandatory standards appropriate to the conditions within the food market and the reality of current (and future) technologies. Such standard setting could also help to stimulate the development of new technologies and flavor alternatives.
Modifying the GRAS status of salt will be a complicated and challenging process for FDA. To initiate it will require considerable information gathering, detailed input from stakeholders, in-depth analysis of the food supply, use of simulation modeling of the effect of different levels of sodium content on total intake, examination of consumer eating behaviors, adjustments for food safety concerns, and studies of economic impact and potential unintended consequences. To ensure its success and responsiveness to emerging realities, extensive ongoing monitoring will be needed. All of these activities will require resources and time. However, on balance, its impact on reducing consumers’ intake of sodium, its ability to provide the level playing field that has eluded the food industry when only voluntary activities are available, and its long-term sustainability are compelling arguments for recommending this effort. Further, by incorporating sodium reduction in the food supply as a regulatory activity, it ensures that relevant time lines for reductions will be established, adhered to in a systematic way, and monitored.
Stepwise Approach
Based on the available evidence related to the successful approaches for introducing lower-sodium foods to consumers as described in Chapter 3, a stepwise approach is essential.
First, the alternative to a stepwise approach—that is, a rapid, sizable, and non-universal decrease in the salt content of specific foods—would provide substantial, perhaps insurmountable, impediments to success. Al-
though there is experimental evidence that individuals would after a time come to accept and even prefer lower-sodium foods following an abrupt decrease (see Chapter 3), consumers would likely initially reject such products as unpalatable and refuse to purchase and eat them. Unlike clinical or experimental situations in which persons are either highly motivated or compensated for continuing to adhere to such a diet, it cannot be expected that the average American consumer would find this acceptable. Testimony from the FDA hearings on the GRAS status of salt in 2007 acknowledged this problem.7 In addition, the food industry discussion panel convened as part of a public information-gathering workshop for this committee’s work (March 30, 2009) relayed this experience as common.
Second, there is support for a stepwise approach as a workable alternative to an abrupt decrease. Experimental evidence suggests that lowering sodium in the diet can be accomplished if the reductions are implemented gradually (see Chapter 3). Accordingly, if small reductions in all foods are instituted regularly and as part of a carefully monitored process that allows appropriate adjustments based on real-time data and outcomes, it would allow for meaningful reductions in the salt content of foods over the course of several years and, importantly, in a fashion that would be consistent with continued consumer enjoyment and acceptance of foods. The acquired taste preferences for high-sodium diets would be gradually reduced in conjunction with decreases in the salt content of foods across the food supply. Additional support for a stepwise approach has been provided by several food manufacturers that reported successfully using this strategy in their products at the committee’s public information-gathering workshop (March 30, 2009).
Given the apparent advantages of introducing such changes in the food supply in a stepwise manner, FDA could consider its options for establishing a gradual implementation of the standards, whether through rulemaking or through other administrative procedures available under the law. Ensuring the successful implementation of standards using a stepwise approach requires that the agency and its stakeholders clearly explore a range of implementing issues including the rates and percentages of decrease in the sodium content of food that would constitute a gradual and workable step-down in sodium content. The standards could be established at the outset with the understanding that the approach is to be evaluated periodically, monitored in real-time, and adjusted as necessary to ensure both success in reaching the ultimate goal and continued support for the effort among consumers and the food industry. One such issue to monitor closely would be the acceptance of foods by consumers. A number of other unknowns would
|
7 |
Available online: http://www.regulations.gov/search/Regs/home.html#documentDetail?R=09000064803f8862 (accessed November 14, 2009). |
need to be explored as well, including the extent to which certain types of high-salt foods could be retained in the diet and not adversely affect the modification of taste preferences toward lower sodium content.
It is important to address the suggestion that efforts to effect sodium reduction in the general food supply could be offset by the consumer’s own actions to add salt back to foods. Indeed, this is part of the argument put forth in a recent paper by McCarron et al. (2009). However, there is no direct evidence to support such compensation for reduced sodium in foods. On the contrary, one study that experimentally evaluated this hypothesis failed to find substantial compensation. In this study, sodium levels in clinically prepared foods were decreased to reduce intake from an average of 3,100 mg/d to an average of 1,600 mg/d over a 13-week period, and subjects were permitted unlimited use of a salt shaker to salt their food to taste. Less than 20 percent of the overall sodium removed during food preparation was replaced by increased use of table salt—the use of which was measured without subjects’ knowledge—resulting in steady maintenance of a sodium intake of about 1,800 mg/d for about 10 weeks (Beauchamp et al., 1987). These data suggest that even with consumers’ additions of salt to foods at the table, significant reductions in sodium intake can be achieved.
Establishing Ongoing Evaluation to Further Inform the Stepwise Approach
An identified plan for and rigorous use of ongoing monitoring and evaluation system are central to the success of using standards for the sodium content of foods to reduce the overall intake of sodium. They will be critical to the success of the initiative. A number of unknowns cannot be elucidated fully at this time, and the activity will depend on an integration of factors and consequences that will change over time and are likely to interact in ways that cannot be anticipated. The role of evaluation in the activity of setting standards for the addition of salt to foods and adjusting their implementation as needed is illustrated in Figure 8-1. This illustration is hypothetical and is meant to only outline the process generally and is not intended to suggest any specific number of iterations or a specific timeframe.
The process for establishing standards for the addition of salt to foods would begin with the needed information gathering that precedes notice-and-comment rulemaking, and could be extensive. The rulemaking would establish both the ultimate standards for foods in the food supply (the goal or maximum final level) and the initial starting point for specific standards as well as tentative targets for the timing of stepwise reductions.
During notice-and-comment rulemaking, the comments, information, and data submitted will inform the GRAS modification process as it is initi-
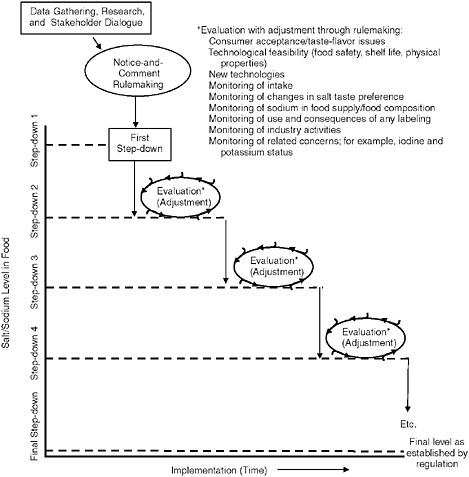
FIGURE 8-1 The path to achieving final standards for the addition of salt to foods: the need for monitoring and evaluation to inform the stepwise approach with a hypothetical number of steps.
ated. However, it is unrealistic to assume that further data will not emerge after the first implementation steps are put in place. In recognizing that experience and new research as well as monitoring could continue to inform the process as the stepwise approach continues, the committee’s recommendation that the GRAS modification process be carried out in a stepwise fashion enhances the ability to ensure appropriate and effective implementation and allows for adjustments as needed throughout the process.
Moreover, the step-down process will allow time for adaptation of consumer taste preference for salt added to foods and for industry to deal with technical challenges. The number of step-downs actually needed may be food category specific (see Chapter 10) and may vary on a number of
factors elucidated during notice-and-comment rulemaking. As implementation of the step-down process takes place, evaluation is conducted and adjustments are made before each step occurs. The nature of the evaluation is multifaceted. It is essential that methods be in place to monitor consumer acceptance of the changes to taste, flavor, and texture, as well as to detect any limitations that may be reached related to food category quality and product safety. Likewise, the ability to use and implement new technologies and their feasibility would benefit from monitoring. Information gathering related to changes in sodium intake, changes in salt taste preference, the consequences of any labeling used, and industry activities would also be useful. This system will also serve as an early warning of any unintended consequences such as measures related to ensuring adequate levels of iodine in the food supply and the avoidance of excessive potassium intake that may be a risk to persons using certain medications. Further, it has recently been argued (see Chapter 3) that sodium intake is physiologically regulated at levels that are well above the recommendations of the Dietary Guidelines for Americans. Although evidence for this is weak, a gradual stepwise reduction strategy would permit regulators to monitor for evidence of this and to modify their regulations accordingly.
Restaurants/Foodservice Operations
The evidence that restaurant/foodservice operations contribute significant amounts of sodium to the American diet (see Chapter 5) means that efforts to reduce the overall sodium content of such foods should be consistent with activities pertaining to the rest of the food supply. The provisions related to setting GRAS standards for the addition of salt to processed foods can, at a minimum, be applied to standardized/chain restaurant and foodservice operations. Such operations range from table service establishments to fast food outlets. The menu items that are offered by these standardized/chain operations are uniform and specified in ways similar to processed foods; the logistics of developing and applying standards for the addition of salt could be similar; and as discussed in Chapter 7, FDA authority does extend to such activities. The data-gathering step that precedes rulemaking would benefit from gathering relevant information on the nature of the standardization that would be appropriate for the purpose of implementing standards for the addition of salt to foods in the case of restaurant/foodservice operations.
The feasibility of extending standards to restaurant/foodservice operations that are termed independents or that do not have standardized menus (see Chapter 6) is questionable at this time. Small restaurant/foodservice operations often do not have standardized recipes and menus can change on a daily basis. This may also be the case for larger operations that service a variety of clients with highly variable menus. In addition, small opera-
tions may lack the training and resources that would be needed to ensure that their foods met sodium standards—a factor that is less likely to be an issue for chains that have corporate research staffs. These realities create challenges for implementing standards to small operations. However, the contribution of smaller-scale and more diverse operations to reduction of sodium intake by the U.S. population should not be overlooked. It is the committee’s opinion that while it is most likely that highly standardized operations and larger chains—which structurally are more like a processed food industry than an independent, local restaurant—will be more capable of working with federal regulations, it is also likely that through this process ways will become clear over time for working with smaller operations that are initially exempt. Given the unfamiliar and disruptive nature of reaching into independent restaurant settings, this can only be accomplished slowly and as part of an informed experience that the committee intended in recommending a stepwise approach that will expand and grow over time.
However, strategies can be adopted to promote sodium reductions in the menus and menu items of small and non-standardized restaurant/foodservice operations. Since many of these types of operations use pre-processed foods to reduce preparation time, standards for salt addition to these foods would have an impact on the final sodium content of menu items as served. In addition, training efforts could be used to educate food preparers and operation owners on ways to reduce sodium in their menu items and develop menus with a greater number of lower-sodium options (e.g., more foods that are naturally low in sodium, reduced portion sizes). This topic is discussed further in Chapter 10 on next steps. Ensuring that restaurant/foodservice operations are given focused attention to “get on board” with sodium reduction activities is important to increasing the ability to create a level playing field for the food industry, even if the methods used for such operations are not initially based on regulated standards of sodium use.
Related Considerations
Sodium enhancement solutions The public interest surrounding the use of the existing regulatory framework has centered primarily on packaged foods under FDA jurisdiction. However, it is worthwhile to note that the statutory provisions employed by FDA extend to uses of salt when added to foods under the jurisdiction of other federal agencies. For example, the safety of sodium enhancement solutions intended to tenderize raw meat and poultry products8 is subject to FDA oversight, even though meat and poul-
|
8 |
Sodium enhancement solutions (see Chapter 7) are also used for raw seafood products, which are under FDA jurisdiction. |
try are under the jurisdiction of the U.S. Department of Agriculture (USDA). Thus, these uses of salt-containing compounds would be encompassed by FDA considerations relative to modifying the GRAS status of salt.
Application to restaurant/foodservice operations The regulatory framework that underpins the GRAS status of salt can be applied to many foods currently offered by restaurant/foodservice operations. As discussed in Chapter 7, because the components of the finished food product served to customers will have moved in interstate commerce, the finished product itself can be subject to the Federal Food, Drug, and Cosmetic Act and, thus, standards can be set by FDA.
On this basis and with recognition that many implementing issues would need to be addressed, there is considerable benefit to be gained by considering restaurant/foodservice menu items, particularly for heavily standardized operations, in the establishment of GRAS standards. While it must be recognized that such activities would be challenging and will undoubtedly require considerable analysis as part of a public process carried out by FDA, the facts regarding the contribution made by foods eaten away from home to total dietary intake are concerning and point to the clear need to extend efforts to reduce the sodium content of the food supply to restaurant/foodservice operations. This expansion of requirements and standards for salt content to the domain of restaurant/foodservice operations would be assisted to some degree by the likelihood that these operations use many processed foods, and those processed foods will have had to comply with new GRAS standards for sodium content. Large foodservice operations, such as chain restaurants and fast food outlets, function with respect to product development more like processed food manufacturers than do independent, special-occasion restaurants.
Prior-sanctioned uses of salt In its 1982 Policy Notice (HHS/FDA, 1982) discussed in Chapter 7, FDA noted salt use in processed food that may have received specific approval for some manufacturers prior to 1958, primarily in FDA standards of identity. These specific uses are deemed “prior-sanctioned” (as described in Chapter 7) and are excluded from food additive regulation on that basis. In undertaking the use of its food additive authority to reduce levels of sodium in food, FDA would have to resolve which uses are prior-sanctioned and which are not. These uses are likely small in number and responsible for relatively minor contributions to the food supply. For completeness, the agency may choose to address such use through a variety of venues stipulated in the act.9
Regulatory status of other sodium-containing compounds Sodium can be added to foods in ways other than by the addition of salt. As discussed in Chapter 4, an array of sodium-containing compounds is approved for use in foods; these have a wide range of functions from processing effects to reducing pathogens. While it is clear that much of the sodium added to foods comes from the addition of salt, it is not clear how much sodium is attributable to these other compounds and whether their contribution to total sodium intake has increased. Therefore, it would be important for FDA to closely examine these other sources of sodium, take into account their conditions of use and function in food, and in turn integrate their presence in the food supply into considerations for reducing the overall sodium content of the food supply and achieving sodium intake consistent with the Dietary Guidelines for Americans.
Resource and Cost Issues
Undoubtedly, regulatory activities require resources and there are costs associated with development, implementation, and enforcement of such provisions. In the case of setting standards for salt and sodium in foods, there is also a considerable need for initial costs for information-gathering, research, and related resources for rulemaking. However, such costs cannot now be enumerated or characterized, and are dependent upon decisions made by policy makers.
Approaches to Modifying the GRAS Status of Salt
Determination of the quantitative levels of salt that should be considered to be GRAS and of the specifics of the appropriate implementation of GRAS changes is beyond the scope of this committee’s work. Rather, it is imperative that setting such levels benefits from additional data that will be submitted in response to the anticipated FDA announcement of proposed rulemaking and collated by the agency. Based on its review and as described in Chapter 10, the committee considered implementation possibilities for modifying the GRAS status of salt. It anticipated that the overarching goal could be to specify as GRAS the uses and use levels of salt that allow persons to consume such foods as part of a normal diet with a reasonable likelihood of keeping their total daily intake of sodium consistent with the Dietary Guidelines for Americans.
In this context, the committee’s discussions focused on (1) a food category framework for determining the allowable levels of salt in foods; (2) consideration of special labeling or disclosure statements as part of the stepwise implementation activities; (3) consideration of exemptions for a limited number of high-sodium foods; and (4) the nature of relevant notice-and-comment rulemaking (see Chapter 7).
SUPPORTING CONSUMERS TO MAKE DIETARY BEHAVIOR CHANGES
The committee considered a food supply approach to reducing sodium intake to be central to achieving meaningful reductions of sodium in the diet. Such an approach is needed because in the current food environment, it is difficult for even the most motivated consumers to assemble a diet with healthful levels of sodium. However, it was recognized that consumer-based initiatives can play an important supporting role as part of a larger public health intervention. As stated by Loria et al. (2001), “both environmental changes and increased educational efforts are required for a truly effective approach toward reducing sodium in American diets.” A lack of implementation and evaluation information on past initiatives limits the ability to draw firm conclusions on how future efforts might avoid repeating past failures. However, some potentially useful approaches for creating consumer awareness and stimulating behavior change can be highlighted.
National Focus
As is often the case with consumer outreach, efforts targeted at sodium reduction will likely benefit from a coordinated effort that uses the latest science on social marketing and other health communication approaches for educating and motivating consumers. Such a coordinated effort will ensure a broad reach and consistent messages that will help to avoid consumer confusion that might arise from uncoordinated education initiatives. Given the public health mission that rests with the federal government, as well as the clear national priority to reduce sodium intake, the most logical focal point for renewed and coordinated efforts to reach consumers is the federal government. In addition to offering a national and prominent locale for efforts to spearhead reduction of sodium intake, the activities could also be linked to relevant programs related to the Dietary Guidelines for Americans initiative.
In turn, collaboration with a diverse set of stakeholders, coupled with the development of public-private partnerships, is also thought to be essential. State and local governments, health professionals, educators, the media, private foundations, corporations, and the food industry all have a role to play. Important goals include building on existing knowledge, obtaining new information through research, and seeking input from other fields of study in order to build a basis upon which to design effective programs to assist consumers in better navigating and supporting changes in the food environment to reduce sodium intake. Consumer initiatives should also maintain consistent overall messages that can also be tailored to most effectively reach and motivate different subpopulations (see Recommendation 4). Further, the need to evaluate ongoing and future efforts in order
to measure overall success and make adjustments as activities are informed by experience is critical.
In order to realize the potential, a national campaign focused on consumers and the reduction of sodium intake is needed. Key components to ensure the success of the campaign are:
-
a broad range of collaborative partners;
-
incorporation of behavior change models;
-
planning activities undertaken as part of a public process;
-
a strong evidence base to guide campaign planning and design to ensure the best use of campaign resources;
-
renewed efforts to develop effective and appropriate messages related to reducing sodium intake that include integration with broader messages about diet and health;
-
clear coordination with policy initiatives targeting changes in the food supply; and
-
periodic evaluation of campaign costs and effectiveness.
Several key factors are highlighted below.
Behavior Change
Consumer-based initiatives to reduce sodium intake could benefit from the incorporation of behavior change models. The socioecological model provides a useful framework exploring the interacting multiple levels of influence and underscores the need to coordinate changes in the food environment, including changes in the food supply, with health communications aimed at individuals. Theories predicting the diverse factors influencing health behaviors, such as sodium intake, need to guide the development of health communications as well as research aimed at improving the effectiveness of these strategies. While it is accepted that knowledge and attitudes as well as access to resources are important starting points for behavior change, additional factors come into play to achieve such change. The nature of these factors for sodium, especially in the face of the compelling nature of salt taste, has not been clearly elucidated. Moreover, the operationalization of a model of behavior change for sodium intake reduction that would apply population-wide in coordination with and support of changes in the food supply is desirable.
Education
In terms of education, three very basic needs are readily apparent. First, it is critical to dispel the prevalent misunderstanding that sodium intake is
a concern relevant only to persons who (1) are “salt sensitive,” (2) have hypertension, or (3) are middle-aged or elderly. The adverse effects of sodium occur at all stages of the lifespan, and a lower sodium intake is a public health goal for every segment of the population (see Chapter 1). Second, consumers must be more cognizant that sodium is present in a broad range of foods, not only those that taste salty or contain visible salt. In the absence of this understanding, consumers misinterpret the effectiveness of their food choices in avoiding sodium. Evidence presented in Chapter 2 reveals that in one survey approximately three-quarters of persons exceeding the recommended intake believed that their intake was “about right.” This is, of course, in marked contrast to current estimates showing that virtually all persons exceed the recommended intake level. In the absence of a simple clinical measure for sodium similar to the serum measures used for cholesterol determinations, a know-your-number campaign is not possible. However, it does provide a segue into the third concern, which is developing better label-reading skills among consumers so that the sodium values of foods are understood and used to choose foods comprising a healthful diet. For example, many consumers may believe that if they avoid foods that are considered to be “salty” (i.e., potato chips, popcorn, and pretzels), they will reduce their sodium intake. In actuality, these foods only contribute about three percent of sodium to the diet, where as meats and grains contribute approximately 16 and 11 percent, respectively (NHANES 2003–2006; also see Chapter 5). This is especially important because the goal is not a diet free of sodium—as may be the case for a substance such as trans fat produced through partial hydration of vegetable oil—but rather that consumers avoid excessive intake while achieving a nutritionally adequate diet.
Coordinated Messages
The development of appropriate messages will require an extensive breadth of expertise and related research. Attention will be needed to ensure that messages are consistent in describing the risks of excess sodium intake and actions consumers can take to modify their sodium consumption (see Recommendation 4). The consistency of these messages will hopefully help to prevent consumer misunderstanding about whom should be concerned about sodium and the best methods for reducing intake. While messages should be consistent, tailoring messages to the behaviors and interests of specific cultural groups and dispersing these messages through communication channels that are known to reach specific groups may also be beneficial.
It is likely that the focus of coordinated messaging should extend beyond developing specific messages for sodium by integrating the issues important for sodium intake reduction into existing, broad messages about diet and
health. For example, guidance related to weight control—primarily guidance on lowering calorie consumption and reducing portion sizes—could result in lower sodium intake, because sodium intake tracks with calorie intake; however, at current average dietary sodium density, calorie control alone would not generally achieve recommended sodium intake limits. Also, messages about increasing the consumption of fruits and vegetables could have beneficial impacts on sodium intake. Overall, consumers may have difficulty focusing on a multitude of different messages about diet and health, and as a result sodium messages may compete for consumer attention with other key issues such as reducing obesity and increasing fruit and vegetable consumption. However, coordinating the sodium message with existing general messages about diet and health consistent with the Dietary Guidelines for Americans coupled with some specific messages targeted to sodium may promote a better outcome. Research and consumer testing of health messages related to sodium have been neglected and could support the role of consumers in reducing their sodium intake.
Outreach Opportunities and Tools for Consumers
Despite the importance of reducing sodium intake as a public health priority, relatively few tools and support initiatives have been put in place. For example, MyPyramid,10 one of USDA’s major consumer initiatives for dietary change consistent with the Dietary Guidelines for Americans, does not currently include sodium as an area of focus. That is, sodium levels are not factored into the MyPyramid Plan or the MyPyramid Menu Planner tools. There is a footnote in the MyPyramid Menu Planner explaining that sodium cannot be calculated accurately using the tool because sodium levels vary so much within similar foods.
The National Heart, Lung, and Blood Institute (NHLBI) is probably the agency most readily recognized as a federal leader in the area of dietary sodium reduction. The primary mission of NHLBI, however, is not to produce consumer-oriented toolkits or related enabling tools, but to facilitate research on topics relevant to its mission through a system of grant awards. Nonetheless, through what might be termed “ancillary” activities, NHLBI has provided a number of enabling tools for dietary change related to sodium intake, and it would be useful to enhance research related to such materials. The National High Blood Pressure Education Program is a cooperative effort involving professional and voluntary health agencies, state health departments, and community groups. Outputs that could be developed or enhanced include fact sheets, pamphlets, and brochures dealing with lifestyle changes; planning kits, posters, and print ads; radio messages;
|
10 |
Available online: http://www.mypyramid.gov (accessed October 27, 2009). |
messages on social media networks; and working group reports. NHLBI also produces materials for physicians to help them guide patients to more healthful lifestyles, another critical area of focus (NHLBI, 2004).
Further, although there is evidence that health professionals and their associations support initiatives to reduce sodium intake, there is less evidence that physicians actively incorporate sodium intake awareness as part of primary care. Health-care professionals, including physicians, need to counsel patients about the health risks associated with high sodium intake and how to reduce sodium intake (Mohan et al., 2009). Therefore, it is necessary to incorporate sodium reduction strategies and their importance to reducing the risk of chronic disease into health professional training curricula and standards of care (WHO, 2007).
The U.S. Centers for Disease Control and Prevention (CDC) supports state efforts to enable public health changes, including efforts to address high blood pressure as a cardiovascular risk. Under the State Heart Disease and Stroke Prevention Program, CDC funds health departments in 41 states and Washington, DC, to plan, monitor, and sustain population-based interventions that address cardiovascular disease (CVD) and related risk factors.11 The strategies focus on a specific population or geographic area. Of the broad activities that states are funded to carry out, several could incorporate sodium strategies. These programs include developing and updating state plans for CVD prevention, assessing existing population strategies for CVD prevention, emphasizing policies to create heart-healthy environments, increasing adherence to guidelines related to hypertension, increasing awareness and education about risk factors and lifestyle changes, and implementing and evaluating community interventions to promote cardiovascular health. In fact, a recent IOM committee (IOM, 2010) recommended that CDC’s Division of Heart Disease and Stroke Prevention take active leadership in convening other partners in the federal, state, and local government, and industry, to advocate for and implement strategies to reduce sodium in the American diet. That committee also recommended that all state and local public health jurisdictions immediately begin to consider developing a portfolio of dietary sodium reduction strategies that make the most sense for early action in their jurisdictions. The committee report also concluded that because some evidence indicates that taste preferences develop early and excess sodium intake is a problem across the lifespan, early education may be key to reducing intake in future generations. It points out that such programs may also be critical for reaching groups, such as adolescent males, that have some of the highest sodium intakes.
Finally, the question of the role of food product advertising in a set
|
11 |
Available online: http://www.cdc.gov/DHDSP/state_program/index.htm (accessed October 27, 2009). |
of strategies to reduce sodium intake is not readily addressed. Activities intended to sell products that have been reformulated with reduced sodium are likely to play an outreach role that could be significant, given the dollars available for food advertising compared to those likely to be available for purely educational outreach (by government and others) with respect to sodium. The nature and extent of such activities cannot easily be predicted, particularly in light of comments from industry participants during the committee’s public information-gathering workshop (March 30, 2009) that past attempts to promote low-sodium food lines have been less than successful, leading some companies to refocus their efforts on “silent” (unadvertised) sodium reduction. When public attention is focused on the need for sodium reduction and industry decides to promote sodium-reduced products, the Federal Trade Commission, which is charged with protecting the public from false or misleading advertising and promotion, will need to engage to assure that explicit and implicit promotional claims are supported by science. Conversely, there is the question of bans on advertising for high-sodium products and/or mandatory disclosures. With respect to foods and beverages, Congress has been reluctant to constrain advertising, even to children (IOM, 2006), and First Amendment rights would be a consideration. However, an alternate approach might be the development of voluntary standards by the industry. The issue of advertising as it relates to high-sodium foods targeted to the general population is a topic not yet ready for exploration as a strategy.
Nutrition Labeling: Point-of-Purchase Sodium Information for Consumers
Label Reading and Interpretation
It is clear that efforts to improve the frequency of use and understanding of the Nutrition Facts panel on food labels are needed. As with all tools, some basic guidance is required to ensure that this tool is used and used properly. While there is a gap in consumer education in this regard, it is also true that the nutrition labeling provisions are now more than 15 years old. Newer information about how consumers use and interpret such information for all nutrients including sodium has been emerging since the implementation of the Nutrition Facts panel. As suggested by FDA itself (HHS/FDA, 2007), it is time for reevaluation and revision of some aspects of nutrition labeling. Further, CDC, FDA, and USDA, along with Congress, have signaled interest in exploring the utility and appropriateness of “front-of-package” nutrition labeling to assist consumers.12 At this time the main
|
12 |
Available online: http://www.fda.gov/Food/LabelingNutrition/LabelClaims/ucm187369.htm (accessed October 27, 2009). |
focus for front-of-package labeling is often calories, but other substances including sodium are also considered candidates for such labeling. To the extent that the discussion is expanded to other nutrients, it would be appropriate to include sodium. Should research show that information about sodium can be incorporated into front-of-package labeling to the benefit of consumers, it would be worthwhile to provide this added tool to help consumers reduce their sodium intake.
Daily Value for Sodium
Another aspect of the Nutrition Facts panel worthy of attention is the Daily Value (DV) for sodium as described in Chapter 7. FDA has asked whether the DV for sodium should be updated based on a reference value of adequacy as opposed to a reference value of safety (HHS/FDA, 2007). The committee considered the following:
-
The purpose of the DV declaration is to help consumers set the contribution of the nutrient in a serving of that particular food within the context of a total daily diet.
-
The DV generally is:
-
based on a reference value of adequacy when the nutrient is an essential nutrient; and
-
based on a reference value of safety when the nutrient is nonessential (e.g., saturated fat and cholesterol).
-
-
Despite the fact that sodium meets all scientific criteria as an essential nutrient, a reference value of safety instead of a reference value of adequacy was used for sodium in 1993 because there was no available reference value for adequacy at the time.
-
In 2005, a reference value of adequacy was established for sodium, known as the Adequate Intake (AI).
-
Use of the AI could better inform consumers of the actual contribution of sodium content to total sodium needs as an essential nutrient and avoid misleading consumers into thinking that the sodium content of foods is more favorable than is actually the case.
-
As discussed in Chapter 2, consumers think that their sodium intake is better than it actually is, and intake has not decreased in association with current nutrition labeling. This indirect evidence supports the use of the AI; however, studies that provide direct evidence are needed.
-
The basis for the DV for sodium should be the AI. Given a 2005 report from the Institute of Medicine that has now identified a reference value of adequacy for sodium intake (i.e., the AI) (IOM, 2005), this reference value
should now be incorporated as the basis for the DV for sodium (see Recommendation 3). Its use makes the derivation of a DV for sodium consistent with the approach used for all other essential nutrients. From the perspective of technical feasibility, there are no limitations or challenges to using the Adequate Intake as the basis for the DV as the declaration within the Nutrition Facts panel is a factual statement of sodium content.
The committee considered whether lowering the DV for sodium would act as a disincentive to industry to make sodium claims, and it concluded this would be unlikely as a general matter. A change in the DV for sodium would not change the basis for “free,” “reduced,” “less,” or “light” claims because they are based on either the absence of sodium or a comparison to sodium levels in a reference product. While the claims “low sodium” and “very low sodium” would be affected because the DV forms the quantitative basis for the claim, there are opportunities to review the basis for these claims to ensure they remain meaningful and serve their purpose.
There is also the possibility that lowering the DV for sodium will act as an incentive for most companies to reduce the sodium content of their foods. Reducing the DV would mean that labels would indicate that products contain a higher percentage of daily recommended intake than they had previously shown. Producers, wanting to appeal to concerned consumers, would have incentive to lower sodium in their products so that the Nutrition Facts panel would show the product to have a lower contribution to daily intake. Overall, such changes could have a dramatic impact on the food supply even if it would raise challenges for making “low” sodium claims on a certain number of products.
Restaurant/Foodservice Operations
Finally, the utility of point-of-purchase information for foods offered by restaurant/foodservice operations is worthy of consideration. Given that a large percentage of food consumed by the U.S. population is obtained from restaurant/foodservice operations, the absence of information similar to the Nutrition Facts panel is a concern. Eating out is no longer reserved for “special occasions,” and consumers undoubtedly need such information when making selections in a restaurant just as they do when making selections in the grocery store. As a step toward providing consumers with more nutrition information when eating out, the Patient Protection and Affordable Care Act13 contains provisions to address nutrition labeling of menu items. Restaurants with 20 or more outlets are required to post calories on menus, menu boards (including drive-thrus) and food display tags, with additional information (including sodium, fat, saturated fat,
carbohydrates, protein, and fiber) available in writing upon request. Given the challenges of labeling foods consistently across the entire universe of restaurant/foodservice operations, the Patient Protection and Affordable Care Act did not require smaller operations to use such labeling. However, voluntary labeling for smaller restaurant/foodservice operations would also be useful to consumers.
One potential obstacle to making nutrition labeling, and specifically sodium labeling, possible for all restaurant/foodservice establishments is a nutrition labeling exemption for products distributed only to restaurant/foodservice operations. Requiring nutrition information on foodservice products would both help all restaurants in providing sodium information to consumers and help establishments monitor and lower the sodium content of their menu offerings.
Nutrient-related claims are another potential aspect of restaurant/foodservice labeling that is worthy of consideration. The Nutrition Labeling and Education Act stipulates that the rules for nutrient content and health claims are germane to “labeling,” and menus are characteristically considered to be labeling. As described later in this chapter in the context of providing incentives to the food industry, there are options by which provisions for sodium claims could be extended to restaurant/foodservice operations and thus provide some additional information to all consumers at the point of purchase.
Labeling of Raw Meat, Poultry, and Seafood
Under current regulations, raw meat and poultry products are exempt from nutrition labeling even when packaged for retail sale (see Chapter 7). However, such products do contain sodium enhancement solutions and therefore can be a source of sodium in the diet. This is also the case for seafood, which is subject to the use of sodium enhancement solutions as well and for which nutrition labeling is voluntary on the part of the producer. While the labeling of such non-uniform products is challenging in the same way that labeling fresh produce is challenging, it would be worthwhile to explore approaches to the use of labeling that would make the presence of sodium known to the consumer.
Nutrition Claims: Point-of-Purchase Sodium Information to Assist Consumers and Offer Incentives to the Food Industry
While the Nutrition Labeling and Education Act of 1990 was intended to help consumers compare and select foods that lead to healthful diets, its focus also included the food industry. The aspects of the act that relate to standards for allowing claims on the labels of packaged foods about the nutritional content of the product were viewed as offering incentives to
food manufacturers as well as quickly signaling to consumers the desirable attributes of food products. During the development of Nutrition Labeling and Education Act (NLEA) regulations, it was assumed that food product marketability would be enhanced if products bore label statements or claims about the nutrient content of a food product or touted the ability of the nutrients present in (or absent from) the food to reduce the risk of disease. In turn, it was anticipated that manufacturers would be incentivized to reformulate foods to meet the standards for the claims.
Failure to Use Claims
It would appear that neither the call for the food industry to voluntarily reduce sodium intake nor the ability to make claims about the reduced levels of sodium in food products has seriously impacted the overall content of sodium in the food supply or the consumer’s intake of sodium. The label surveys described in Chapter 2 revealed that claims about the sodium content of packaged foods are not widely used by food manufacturers. There is the parallel concern, not clearly documented but discussed during the committee’s public information-gathering workshop and also highlighted in Chapter 6, that use of claims about lower-sodium content may signal to the consumer that the food will be less tasty than its non-sodium-reduced competitors. The reasons for the failure of sodium content and health claims to be used are undoubtedly complicated and not well understood, but the evidence would warrant revisiting the requirements currently established for such claims, especially those related to the extent of sodium reductions required to make a claim.
Future of Sodium-Related Claims
There is the possibility that the specifications underlying the provisions for sodium claims may be overly ambitious. They are applied equally across all food categories and may not take into account the need to decrease the salt content of foods gradually in order to assist the consumer in making taste adaptations, as well as giving manufacturers time to seek newer techniques for lowering sodium levels in foods. Of particular note are the regulations for the claim “healthy.” The provisions did include a step-down approach to be implemented over time, but the step-down was deferred on the basis of arguments from the food industry that such reductions could not be achieved while providing products that could successfully compete against those containing higher levels of salt. It may be that the regulatory starting points for such claims are not appropriately set or that the nature of the anticipated step-down in the levels for such claims should be explored (see Recommendation 3). This may parallel anecdotal reports
suggesting that the food industry tried to move too far too fast, giving rise to the current consumer perception that a label claim about reduced or low sodium equates with an unpalatable product. Alternatively, the industry may have been aiming for a niche market and been unsuccessful in achieving palatability at a level that could compete.
Nonetheless, claims about the sodium content of food products implemented under the NLEA provisions in principle remain a helpful signal to consumers and should be a useful adjunct to stimulate food manufacturers to reformulate their products. The Grocery Manufacturers Association (GMA, 2008) and food industry participants in the public information-gathering workshop held by the committee (March 30, 2009) have suggested that the current requirement for a minimum reduction of 25 percent for reduced-sodium claims is counterproductive to the stepwise approach. It may be useful to consider the potential benefits of permitting reduced-sodium claims for cumulative changes that would be consistent with the approach of stepwise reductions. In undertaking any revisions to these requirements, FDA and USDA will need to strike a difficult balance between providing for claims that reflect truly healthful reductions in the sodium content of food and protecting the consumer from a plethora of meaningless claims based on relatively inconsequential reductions.
Further, in the context of reaching standardized restaurant/foodservice operations in the same manner as processed foods, there is value in giving the same opportunities and incentives to restaurant/foodservice operations. In implementing the 1990 NLEA, FDA limited its regulations for claims to packaged foods; as appropriate, however, the regulations could be expanded to menu items as discussed in Chapter 7. FDA could now undertake activities to provide for sodium content claims and related health claims on menu items offered by restaurant/foodservice operations that are sufficiently standardized for implementation to be practically accomplished. It was concluded that such measures might provide greater opportunities for consumers to make informed choices while eating away from home. However, it was also recognized that there will be a need for preliminary activities to gather data and background information about restaurant/foodservice operations and to carry out stakeholder dialogues in order to develop and then implement workable regulations for sodium claims to be used by such operations.
POTENTIAL UNINTENDED CONSEQUENCES OF REDUCING SODIUM ACROSS THE U.S. POPULATION
All public health initiatives have the potential to cause unintended consequences. Efforts to anticipate how such consequences could manifest themselves and to incorporate activities to avoid them are prudent. Like-
wise, systems to monitor and evaluate the impact of such programs closely over time help to track the possibility of such consequences and identify those that emerge in unexpected ways. The section identifies four unintended consequences that are potentially associated with the implementation of strategies to reduce sodium intake. Awareness of such consequences among the medical and public health communities will be essential for ensuring that any such adverse events are quickly identified and mitigated.
Adverse Effects of Low Sodium Intake
Concerns have been raised that low sodium intake adversely affects plasma renin activity, sympathetic nervous system activity, blood lipids, and insulin resistance. The suggestion is that attempts to achieve the levels recommended in the Dietary Guidelines for Americans on a population basis would place some persons at risk.
When sodium intake is reduced, there is a physiological stimulation of counter regulatory hormone systems, specifically the renin-angiotensin system and the sympathetic nervous system (IOM, 2005). These compensatory responses are much greater with abrupt large changes in sodium intake than with gradual reductions (Sagnella et al., 1990) as currently recommended. Furthermore, in contrast to the well-accepted benefits of blood pressure reduction, the clinical relevance of modest rises in plasma renin activity as a result of sodium reduction is uncertain.
Other studies have examined the effects of changing sodium intake on lipids, glucose tolerance, and insulin sensitivity. Adverse changes have been noted in some studies, but these studies often involved a very large change in sodium intake for only a few days. In the largest and longest controlled trial that addressed the effects of sodium reduction on blood lipids, there was no significant effect of sodium levels within the recommended range of intake (Harsha et al., 2004). Accordingly, the IOM, as part of its Dietary Reference Intake development process for nutrients including sodium, concluded that at the level of intake consistent with the reference value, the preponderance of evidence does not support the contention that the recommended intake would adversely affect any of these measures (IOM, 2005).
Food Safety
Because salt and other sodium-containing compounds function as food preservatives, efforts to reduce their presence have the potential to impact the safety of the food supply.
Past efforts to reformulate foods to improve their nutrient composition have occasionally resulted in foodborne illness. A well-known example is an effort to make sugar-free hazelnut conserve for use in reduced-calorie
yogurt products in the United Kingdom (Entis, 2007). The conserve maker substituted aspartame for sugar without altering the rest of the formulation and without altering processing. The sugar present in the original formulation prevented the growth of Clostridium botulinum, but with its removal, this organism was able to grow and eventually led to the death of 1 person and serious illness in 25 others. This event is an example of the unfortunate outcomes that are possible if the safety-related functions of ingredients are not considered during reformulation. However, such events are preventable with adequate food safety expertise and product testing.
Consistent with FDA authorities and mission, the proposed changes to the status of GRAS substances must be demonstrated to be safe before they can be incorporated into regulation and implemented. To avoid problems from occurring during sodium reduction, food companies generally evaluate the potential for reduced sodium levels to increase food safety risks and engineer additional hurdles to microbial threats (as described in Chapter 4) into the product. In addition, it is generally standard practice to validate the safety of new and reformulated products using shelf life testing. The results of these tests will determine the limits of sodium reduction for specific food products and provide information that can be used to educate the standard setting process for acceptable conditions of use. Such testing, for example, may help to determine the potential for the growth of Listeria monocytogenes—an organism that has raised food safety concerns during UK efforts to reduce salt—in reduced-sodium deli meats or cheeses (Advisory Committee on the Microbiological Safety of Food ad hoc Group on Vulnerable Groups, 2008). Such testing is time consuming, requiring that adequate phase-in periods be provided to ensure that the push for a lower-sodium food supply does not result in unintended food safety problems. Smaller companies may not have as great a capacity to quickly undertake the studies needed to ensure the safety of reformulated foods and may need more time to meet sodium reduction goals than larger companies with significant resources for research and development. Specialized guidance from FDA, trade associations, and the Cooperative Extension service may also help to fill knowledge gaps in companies with limited research and development staffs. With sufficient guidance, standards for conditions of use that recognize food safety limitations, and the regular practice of validating product safety with shelf life testing, most food safety concerns should be avoidable.
Iodine Insufficiency
Until the 1920s, endemic iodine deficiency was a major public health problem in the Great Lakes, Appalachian, and Northwestern regions of the United States (Pearce, 2007). The introduction of iodized salt on a volun-
tary basis by manufacturers and extensive public education programs by health officials to encourage consumer use of this product resulted in the virtual elimination of goiter in high-risk regions. The question then arises as to whether strategies to reduce salt intake by the U.S. population will result in the unintended consequence of increasing the risk of iodine insufficiency and deficiency among high-risk groups.
To answer this question, it is important to determine the current iodine status of the U.S. population and to anticipate the potential effect of reduced salt intake on iodine status. However, assessing the iodine status of the U.S. population is challenging. Intake data are generally unreliable because they cannot accurately estimate the amount of table salt used by consumers, and information about whether iodized or non-iodized salt is used in food preparation at home or away from home is rarely captured in food composition databases or in dietary interviews. There are wide variations in the iodine content of some common foods. For example, the iodine content per slice of bread was > 300 μg for three varieties of bread and averaged 10 μg for 17 other brands in 2002 (Pearce, 2007), thus making it difficult to assign meaningful composition values to specific food items. The labeling of the iodine content of foods is not mandatory unless claims are made or iodine is added as a nutrient fortificant—practices that to date have been rare. On the other hand, dietary supplements, particularly multivitamin and multimineral supplements, often contain 150 μg of iodine per daily dose and the iodine content of these products is declared on the label.
Because of the difficulty of obtaining accurate estimates of dietary intake, iodine status is generally assessed by urinary excretion of iodine. Iodine is renally excreted, therefore urinary iodine concentrations are an indication of dietary iodine sufficiency (Pearce, 2007). The National Health and Nutrition Examination Surveys (NHANES) have periodically collected casual urine samples from which iodine values have been determined since NHANES I was conducted from 1971–1974. These data have been used to examine trends in urinary iodine excretion over time (Caldwell et al., 2005).
NHANES I levels were considered to be “adequate to excessive” for iodine (Pearce, 2007). Then, a downward trend was noted in urinary iodine concentration between NHANES I (320 ± 6 μg/L in 1971–1974) and NHANES III (145 ± 3 μg/L in 1988–1994). However, NHANES 2001–2002 data indicate that the urinary excretion of iodine stabi2lized (167.8 μg/L; 95 percent confidence interval: 159.3–177.6 μg/L). NHANES III and NHANES 2001–2002 urinary iodine excretion concentrations are within the range generally considered to be “optimal” for iodine nutriture (Caldwell et al., 2005; Pearce, 2007).
The reasons for the reductions in urinary iodine concentration between
1971–1974 and 1988–1994 cannot be determined precisely, but they appear to be a function of a food industry response to concerns expressed by FDA that manufacturing practices were causing excessive levels of iodine in the food supply. That is, the reduction may have been due to efforts to reduce iodine in the food supply from a potentially toxic level to a more acceptable level of nutriture for the general population. In the 1970s, chemical analysis of an FDA market basket sample of foods representative of U.S. dietary patterns showed extremely high and increasing levels of iodine in dairy products, grain and cereal products, and meat, fish, and poultry (Park et al., 1981). Sugars and adjunct groups (e.g., pudding mixes, jam, jelly, candies) also contained substantial amounts of iodine. Although the sources of iodine in these foods were not definitely determined, they are likely to have been iodophors used at that time as cleaning agents in dairy production, high levels of iodine added to animal feed, use of red color dyes containing iodine, and iodates used as baking conditioners in the making of breads (Pearce, 2007). FDA shared its concerns about these findings with the food industry (Park et al., 1981). The iodine content of the food supply subsequently dropped.
The current iodine status of the U.S. population is within an adequate range according to generally accepted guidelines for assessing iodine nutriture—although some groups (e.g., pregnant women) may be at higher risk than the general population (Caldwell et al., 2005; Pearce, 2007). Given current levels of iodine intake, what is likely to happen if salt reduction strategies were to be implemented? This is addressed by considering the contribution of iodized salt to total intake of iodine.
Currently, the main use of iodized salt is for home table salt—of which about 70 percent of sales are for iodized salt (Pearce, 2007). Non-iodized salt is used in most food processing and restaurant/foodservice applications (Dasgupta, 2008). Current intake data show that only about 5 percent of sodium comes from the use of table salt (see Chapter 5). Much of the iodine in today’s diets continues to come from non-salt sources (e.g., iodine-containing food additives, processing aids, foods grown in many regions and countries) (IOM, 2005)—sources that would not be affected by salt reduction. Therefore, if 5 percent of sodium in today’s diet is assumed to be associated with iodized salt and the major sodium reduction strategies in this report are addressed to the sodium content of processed and restaurant/foodservice foods, it would appear that the recommended sodium reduction strategies would have minimal impact on iodine intake of the U.S. population. Nonetheless, as a matter of public health prudence, continued and improved monitoring of urinary iodine excretion of the U.S. population and chemical analysis of the iodine content of market basket foods representative of U.S. dietary patterns are warranted.
Potassium in the Food Supply Due to Use of Potassium Chloride as a Salt Substitute
Potassium chloride is used as a salt substitute, and efforts to reduce sodium intake likely will incorporate more uses of potassium chloride as a salt substitute in food. In fact, an IOM committee recently recommended that CDC consider, as a strategy for preventing and controlling hypertension in the U.S. population, advocating for the greater use of potassium/sodium chloride combinations as a means of simultaneously reducing sodium intake and increasing potassium intake (IOM, 2010).
While dietary guidance generally encourages increased intake of potassium (DGAC, 2005), this recommendation is in the context of healthy populations, most of whom would benefit from additional potassium in the diet.
However, there may be unintended consequences for a sizable subpopulation in the United States if potassium chloride is used widely and at high levels, especially since the potassium content of foods is not generally provided in label information. Adverse cardiac effects (arrhythmias) can result from hyperkalemia, which is a markedly elevated serum level of potassium. In individuals whose urinary potassium excretion is impaired by a medical condition, drug therapy, or both, instances of life-threatening hyperkalemia have been reported (IOM, 2005). There have been several case reports of hyperkalemia in individuals who reported use of a potassium-containing salt substitute while under treatment for chronic diseases (Haddad, 1978; Ray et al., 1999; Snyder et al., 1975).
Many Americans are taking medications that result in an increase in serum potassium. Angiotensin-converting enzyme (ACE) inhibitors, angiotensin receptor blockers (ARBs), and potassium-sparing diuretics are common drugs that can significantly reduce potassium excretion (DGAC, 2005). Medical conditions associated with impaired potassium excretion include diabetes, chronic kidney disease, end-stage renal disease, severe heart failure, and adrenal insufficiency. Individuals with these conditions are numerous in the U.S. population.
For the approximately 26 million Americans with chronic kidney disease (Lloyd-Jones et al., 2009), these increased serum levels may be exacerbated by widespread potassium chloride use. There may also be concern relative to people with hypertension using ACE inhibitors and ARBs, which are commonly prescribed and have been shown to cause hyperkalemia (defined in the study as serum potassium concentration > 5.5 mEq/L or mmol/L) in approximately 3.3 percent of those taking them (Yusuf et al., 2008). These drugs are also used in patients with diabetes who have microalbuminuria or frank proteinuria to decrease urinary protein excretion and protect their renal function.
There are approximately 5 million Americans with congestive heart failure,14 and a mainstay of their treatment is spironolactone, which blocks the hormone aldosterone and is associated with hyperkalemia. Indeed, a study from Canada showed that shortly after a publication reported a positive effect of spironolactone use in patients with congestive heart failure, its use increased markedly and resulted in a more than 400 percent increase in hospitalizations due to hyperkalemia, and mortality rose from 0.3 per 1,000 to 2.0 per 1,000 patients (Juurlink et al., 2004).
The number of Americans potentially at risk for adverse effects from potassium intake warrants vigilance in the increased use of potassium chloride as a salt substitute. Systematic monitoring of the food supply is essential for tracking the use of potassium chloride in foods and to monitor, and in turn mitigate, its ability to cause adverse health effects in those at risk.
MONITORING
The need for monitoring and surveillance is critical to establishing baseline data for and tracking the progress of strategies to reduce sodium intake. Both data on population intake and data on sodium levels in the food supply are needed to provide an information base for implementation of the recommended strategies. More accurate assessment and tracking of (1) specific foods that are contributors to Americans’ sodium intake and (2) population-level dietary sodium intake, including the monitoring of 24-hour urinary sodium, were recently recommended by an IOM committee charged with reviewing public health strategies for reducing and controlling hypertension in the U.S. population (IOM, 2010). To date, monitoring efforts have been basic and focused on estimating intake from dietary self-reports collected as part of national surveys. Systematic and relevant approaches to tracking the sodium content of the food supply are lacking. Furthermore, useful and informative surveys conducted at the national level—such as the Total Diet Study and the Food Label and Package Survey—have not been conducted systematically, have failed to release data in timely and useful formats, and do not include sufficient coverage of sodium-related measurements. Although available food composition databases, which are essential to formulating sodium intake estimates based on dietary recall methods, have improved over the years, there is still room for more comprehensive data collection and reporting, especially in the area of restaurant foods.
Importantly, a more accurate measure of total sodium intake such as 24-hour urine collection should be employed in national population surveys, specifically NHANES. Dietary estimation must continue because it
|
14 |
Available online: http://www.nlm.nih.gov/medlineplus/heartfailure.html (accessed November 16, 2009). |
is important for identifying dietary patterns and use of foods relevant to increased or decreased sodium intake, but urinary analysis is required for the increased precision needed now for sodium monitoring and surveillance (see Recommendation 5).
It is desirable to explore new approaches for monitoring the sodium content of the food supply. One possibility that could provide detailed sodium content information and trends by individual product and by processed food category, including by sales weight, would be to link Universal Product Code (UPC) sales data to information on the nutrient content of the food as stated on the Nutrition Fact panel. Such a method is currently being used by the NSRI spearheaded by the New York City Health Department. Although such data are limited because they cannot provide information on the amounts of foods consumed or how foods were ultimately prepared and are subject to errors due to the inability to match some UPC codes with nutrient data, they could be a useful snapshot of trends. An approach to developing such a system is described in Appendix K. Further, efforts to appropriately expand or find an alternative to the FDA’s Total Diet Study are worthwhile. On a related note, monitoring the use of claims about sodium is important. Efforts to ensure the continuation of FDA’s Food Label and Package Survey and the expansion of this survey to encompass tasks important to monitoring strategies for reducing sodium intake should be made (see Recommendation 5).
New and enhanced methods to help consumers self-monitor their sodium intake would be useful in supporting consumer behaviors. Options that would advance the development of such methods include: enhancing currently available tools, such as dietary estimations through the MyPyramid online program; creating new mechanisms for monitoring dietary intake, such as mobile software for tracking individual sodium intake; and exploring kits that could be used for home urine testing to estimate individual intake.
Moreover, monitoring of consumers’ knowledge, attitudes, and food selection practices along with the use of food labeling is needed to enhance the picture of factors important to realizing meaningful reductions in sodium intake. Several national surveys have such components, and these could be enhanced and expanded as they relate to sodium intake. Additionally, methods to monitor salt taste preference need attention and, when developed, should become part of the national monitoring system (see Recommendation 5).
Finally, it is always in the best interests of public health when major initiatives such as a population-wide effort to reduce sodium intake are undertaken to ensure that there is monitoring relative to unintended consequences. These range from the careful monitoring that would be needed for the successful stepwise reduction of sodium in the food supply and its
impact on consumers and the food industry to the kinds of health consequences discussed above that include iodine insufficiency and potassium excess.
CLOSING REMARKS
The committee’s review and integration of the available data resulted in five general recommendations and a set of strategies for each recommendation. The recommendations are identified as either primary, interim, or supporting and are presented in Chapter 9. The topic of next steps is discussed in Chapter 10 and focuses on implementation of the strategies and related research needs.
REFERENCES
Advisory Committee on the Microbiological Safety of Food (ad hoc Group on Vulnerable Groups). 2008. Increased incidence of listeriosis in the UK (draft report).
Beauchamp, G. K., and L. J. Stein. 2008. Salt taste. In The senses: A comprehensive reference. 6 vols. Vol. 4, edited by A. I. Basbaum. New York: Elsevier. Pp. 401-408.
Beauchamp, G. K., M. Bertino, and K. Engelman. 1987. Failure to compensate decreased dietary sodium with increased table salt usage. Journal of the American Medical Association 258(22):3275-3278.
British Market Research Bureau. 2009. Comprehension and use of UK nutrition signpost labelling schemes. Prepared for the Food Standards Agency.
Brownell, K. D., and T. R. Frieden. 2009. Ounces of prevention: The public policy case for taxes on sugared beverages. New England Journal of Medicine 360(18):1805.
Brownell, K. D., T. Farley, W. C. Willett, B. M. Popkin, F. J. Chaloupka, J. W. Thompson, and D. S. Ludwig. 2009. The public health and economic benefits of taxing sugar-sweetened beverages. New England Journal of Medicine 361(16):1599-1605.
Caldwell, K. L., R. Jones, and J. G. Hollowell. 2005. Urinary iodine concentration: United States National Health and Nutrition Examination Survey 2001-2002. Thyroid 15(7): 692-699.
Cleveland, L. E., A. J. Escobar, S. M. Lutz, and S. O. Welsh. 1993. Method for identifying differences between existing food intake patterns and patterns that meet nutrition recommendations. Journal of the American Dietetic Association 93(5):556-560.
CSPI (Center for Science in the Public Interest). 2005. Salt: The forgotten killer. Washington, DC: Center for Science in the Public Interest.
CSPI. 2008. Salt assault: Brand-name comparisons of processed foods, 2nd ed. Washington, DC: Center for Science in the Public Interest.
Dasgupta, P. K., Y. Liu, and J. V. Dyke. 2008. Iodine nutrition: Iodine content of iodized salt in the United States. Environmental Science and Technology 42(4):1315-1323.
DGAC (Dietary Guidelines Advisory Committee). 2005. Report of the Dietary Guidelines Advisory Committee on the Dietary Guidelines for Americans, 2005. A Report to the Secretary of Health and Human Services and the Secretary of Agriculture. Washington, DC: U.S. Department of Agriculture and U.S. Department of Health and Human Services.
Doyle, M. P., L. R. Beuchat, and T. J. Montville (eds.). 2001. Food microbiology: Fundamentals and frontiers. 2nd ed. Washington, DC: ASM Press.
Engstrom, A., R. C. Tobelmann, and A. M. Albertson. 1997. Sodium intake trends and food choices. American Journal of Clinical Nutrition 65(Supplement 2):704S-707S.
Entis, P. 2007. Recipes for disaster. In Food safety: Old habits, new perspectives. Washington, DC: ASM Press. Pp. 42-43.
Fodor, G. J., N. H. McInnis, E. Helis, P. Turton, and F. H. H. Leenen. 2009. Lifestyle changes and blood pressure control: A community-based cross-sectional survey (2006 Ontario survey on the prevalence and control of hypertension). The Journal of Clinical Hypertension 11(1):31-35.
Forshee, R. A. 2008. Innovative regulatory approaches to reduce sodium consumption: Could a cap-and-trade system work? Nutrition Reviews 66(5):280-285.
GMA (Grocery Manufacturers Association). 2008. Sodium and salt: A guide for consumers, policymakers, and the media. Washington, DC: Grocery Manufacturers Association.
Golan, E., L. Mancino, and L. Unnevehr. 2009. Food policy: Check the list of ingredients. Amber Waves 7(2):16-21.
Haddad, A. 1978. Potassium and salt substitutes. American Heart Journal 95(1):134-135.
Harsha, D. W., F. M. Sacks, E. Obarzanek, L. P. Svetkey, P. H. Lin, G. A. Bray, M. Aickin, P. R. Conlin, E. R. Miller III, and L. J. Appel. 2004. Effect of dietary sodium intake on blood lipids: Results from the DASH-sodium trial. Hypertension 43(Part II):393-398.
HHS/FDA (U.S. Department of Health and Human Services/Food and Drug Administration). 1982. GRAS safety review of sodium chloride; policy notice; solicitation of views. Federal Register 47:26590.
HHS/FDA. 2005. Food labeling; nutrient content claims, definition of sodium levels for the term “healthy”; final rule. Federal Register 70(188):56828-56849.
HHS/FDA. 2007. Food labeling: Revision of reference values and mandatory nutrients; advanced notice of proposed rule-making. Federal Register 72(212):62149-62175.
IOM (Institute of Medicine). 2005. Dietary Reference Intakes for water, potassium, sodium, chloride, and sulfate. Washington, DC: The National Academies Press.
IOM. 2006. Food marketing to children and youth: Threat or opportunity?, edited by J. M. McGinnis, J. Gootman, and V. I. Kraak. Washington, DC: The National Academies Press.
IOM. 2009. School meals: Building blocks for healthy children, edited by V. A. Stallings, C. W. Suitor, and C. L. Taylor. Washington, DC: The National Academies Press.
IOM. 2010. A population-based policy and systems change approach to prevent and control hypertension. Washington, DC: The National Academies Press.
Juurlink, D. N., M. M. Mamdani, D. S. Lee, A. Kopp, P. C. Austin, A. Laupacis, and D. A. Redelmeier. 2004. Rates of hyperkalemia after publication of the Randomized Aldactone Evaluation Study. New England Journal of Medicine 351(6):543-551.
Kumanyika, S. 1991. Behavioral aspects of intervention strategies to reduce dietary sodium. Hypertension 17(Supplement 1):190-195.
Kumanyika, S. K., N. R. Cook, J. A. Cutler, L. Belden, A. Brewer, J. D. Cohen, P. R. Hebert, V. I. Lasser, J. Raines, J. Raczynski, L. Shepek, L. Diller, P. K. Whelton, and M. Yamamoto. 2005. Sodium reduction for hypertension prevention in overweight adults: Further results from the Trials of Hypertension Prevention Phase II. Journal of Human Hypertension 19(1):33-45.
Laatikainen, T., P. Pietinen, L. Valsta, J. Sundvall, H. Reinivuo, and J. Tuomilehto. 2006. Sodium in the Finnish diet: 20-year trends in urinary sodium excretion among the adult population. European Journal of Clinical Nutrition 60(8):965-970.
Lloyd-Jones, D., R. Adams, M. Carnethon, G. De Simone, T. B. Ferguson, K. Flegal, E. Ford, K. Furie, A. Go, K. Greenlund, N. Haase, S. Hailpern, M. Ho, V. Howard, B. Kissela, S. Kittner, D. Lackland, L. Lisabeth, A. Marelli, M. McDermott, J. Meigs, D. Mozaffarian, G. Nichol, C. O’Donnell, V. Roger, W. Rosamond, R. Sacco, P. Sorlie, R. Stafford, J. Steinberger, T. Thom, S. Wasserthiel-Smoller, N. Wong, J. Wylie-Rosett, and Y. Hong. 2009. Heart disease and stroke statistics-2009 update: A report from the American Heart Association Statistics Committee and Stroke Statistics Subcommittee. Circulation 119(3):e22-e181.
Loria, C. M., E. Obarzanek, and N. D. Ernst. 2001. Choose and prepare foods with less salt: Dietary advice for all Americans. Journal of Nutrition 131(2, Supplement 1): 536S-551S.
Luft, F. C., C. D. Morris, and M. H. Weinberger. 1997. Compliance to a low-salt diet. Ameri-can Journal of Clinical Nutrition 65(Supplement):S698-S703.
McCarron, D. A., J. C. Geerling, A. Kazaks, and J. S. Stern. 2009. Can dietary sodium intake be modified by public policy? Clinical Journal of the American Society of Nephrology 4(1):1878-1882.
Mohan, S., N. R. C. Campbell, and K. Willis. 2009. Effective population-wide public health interventions to promote sodium reduction. Canadian Medical Association Journal 181(9): 605-609.
National Centre for Social Research. 2008. An assessment of dietary sodium levels among adults (aged 19–64) in the UK general population in 2008, based on analysis of dietary sodium in 24 hour urine samples. http://www.food.gov.uk/multimedia/pdfs/08sodiumreport/pdf (accessed February 2, 2010).
NHLBI (National Heart, Lung, and Blood Institute). 1996. Implementing recommendations for dietary salt reduction: Where are we? Where are we going? How do we get there?: Summary of an NHLBI workshop. NIH Publication No. 55-728N. Bethesda, MD: National Institutes of Health.
NHLBI. 2004. The seventh report of the Joint National Committee on Prevention, Detection, Evaluation, and Treatment of High Blood Pressure. NIH Publication No. 04-5230. Bethesda, MD: National Heart, Lung, and Blood Institute.
Park, Y. K., B. F. Harland, J. E. Vanderveen, F. R. Shank, and L. Prosky. 1981. Estimation of dietary iodine intake of Americans in recent years. Journal of the American Dietetic Association 79(1):17-24.
Pearce, E. N. 2007. National trends in iodine nutrition: Is everyone getting enough? Thyroid 17(9):823-827.
Pietinen, P., A. Tanskanen, A. Nissinen, J. Tuomilehto, and P. Puska. 1984. Changes in dietary habits and knowledge concerning salt during a community-based prevention programme for hypertension. Annals of Clinical Research 16(Supplement 43):150-155.
Ray, K. K., S. Dorman, and R. D. S. Watson. 1999. Severe hyperkalaemia due to the concomitant use of salt substitutes and ACE inhibitors in hypertension: A potentially life threatening interaction. Journal of Human Hypertension 13(10):717-720.
Reinivuo, H., L. M. Valsta, T. Laatikainen, J. Tuomilehto, and P. Pietinen. 2006. Sodium in the Finnish diet: II Trends in dietary sodium intake and comparison between intake and 24-h excretion of sodium. European Journal of Clinical Nutrition 60(10):1160-1167.
Sagnella, G. A., N. D. Markandu, M. G. Buckley, M. A. Miller, D. R. J. Singer, and G. A. MacGregor. 1990. Plasma atrial natriuretic peptide, aldosterone, and plasma renin activity responses to gradual changes in dietary sodium intake. American Journal of Hypertension 3(11):863-865.
Snyder, E. L., T. Dixon, and E. Bresnitz. 1975. Letter: Abuse of salt “substitute.” New England Journal of Medicine 292(6):320.
Waist banned: Does a tax on junk food make sense? 2009. The Economist, July 30, 2009.
WHO (World Health Organization). 2007. Reducing salt intake in populations: Report of a WHO forum and technical meeting. Paris, France: World Health Organization.
Williams, R., and K. Christ. 2009. Taxing sin. Mercatus on Policy 55:1-4.
Yusuf, S., K. K. Teo, J. Pogue, L. Dyal, I. Copland, H. Schumacher, G. Dagenais, P. Sleight, and C. Anderson. 2008. Telmisartan, ramipril, or both in patients at high risk for vascular events. New England Journal of Medicine 358(15):1547-1559.


