
10
Next Steps
This report recommends the use of regulatory tools in an innovative and unprecedented fashion to gradually reduce widespread ingredients in foods through a well-researched, coordinated, deliberative, and monitored process. The recommended changes will be challenging and will require coordination and cooperation. The strategies outlined by the committee are specifically stepwise and are intended to expand and grow over time. There is evidence that moving in this area without a staged and thoughtful process, over time, and as part of a learning experience relative to workable strategies would be problematic. This final chapter discusses the next steps for strategies to reduce sodium intake, first in terms of options and approaches for implementation of the strategies and then in terms of research needs. The approaches highlighted below were developed following the committee’s recommendations and with the understanding that implementers will—as a first step and as an ongoing activity—need to carry out data gathering and targeted research to ensure appropriate implementation of the strategies. Research needs have been identified based on the major information gaps identified by the committee in conducting its study. Addressing these research needs will be central to the ability to make progress in sodium reduction efforts.
IMPLEMENTATION OF STRATEGIES
By their nature, a number of the strategies recommended by the committee will require analysis and additional data gathering before they can be implemented. There are still many unanswered questions. During its
deliberations, the committee outlined a number of implementation approaches. However, it recognized that the level of detail needed to translate a number of the overall strategies into functioning activities was beyond its scope and undoubtedly required information that is not currently available or that needs to be collected and analyzed by specific responsible agencies mentioned in this report, by the food industry, or by other researchers. Implementers therefore will have to further explore these approaches and related options as they become apparent.
Modification to the GRAS Status of Salt
Modifying the generally recognized as safe (GRAS) status of salt will be a complicated and challenging process for the Food and Drug Administration (FDA). It will require considerable information gathering, detailed input from stakeholders, in-depth analysis of the food supply, simulation modeling of the effect of different levels of sodium on total intake, examination of consumers’ eating behaviors, adjustments for food safety concerns, and studies of economic impact and potential unintended consequences. This, in turn, will require resources and time. The following approaches at a minimum should be considered by FDA in carrying out these important activities.
Food Category Framework
As a general matter, it anticipated that the overarching goal should be to specify as GRAS the uses and use levels for salt that allow persons to consume such foods as part of a normal diet with a reasonable likelihood of keeping their total daily intake of sodium consistent with the Dietary Guidelines for Americans. However, the committee could find no rationale for establishing allowable standards of salt content as a single, across-the-board, quantitative amount of sodium applied to each food equally. Rather, the nature of the food supply suggests that the better approach is to develop standards for the levels of salt added to foods on the basis of food categories. In the United Kingdom, salt targets were set for all product categories, based on the contributions of different foods to salt intake and the feasibility of making reductions given food safety and technical considerations.1 If foods are grouped by category, the technological feasibility of reducing salt levels can be taken into account along with consumers’ taste expectations. Examination of potential sodium reductions on the basis of food categories can also help to set meaningful yet feasible targets for sodium reduction.
|
1 |
Available online: http://www.food.gov.uk/multimedia/pdfs/howsalttargetsmet.pdf (accessed November 17, 2009). |
The regulatory process can adjust the GRAS “conditions of use” based on the available data and would allow foods to contain different levels of sodium based on their nature and the way in which they are typically consumed. The United Kingdom, in developing its voluntary program for the food industry, has based its approach on food categories. The voluntary National Salt Reduction Initiative (NSRI) coordinated by New York City, has based its guidelines on food categories as well.
The committee felt that the development of food categories and establishment of appropriate maximum levels would benefit from the rulemaking process, which includes public deliberation, that FDA would be required to undertake, and therefore did not attempt to make recommendations or undertake simulation efforts on these topics. It is expected that FDA would model the dynamics of how different levels of sodium reduction in various product categories would influence population intakes. This information, combined with input from public deliberations on the feasibility of such reductions would factor into the FDA’s development of appropriate food categories and maximum usage levels.
Panel A of Figure 10-1 shows a hypothetical example of a product category with a salt content range of 0–100 mg. This maximum level of salt—shown in the figure as 50 mg and labeled “Maximum Level for GRAS Status”—would allow persons to consume such a food from this category in typical fashion as part of a normal diet and yet keep their total daily intake of sodium at recommended levels given all other foods commonly consumed (each with its own category standards for salt content). Foods within this category with amounts at or below 50 mg per serving would be marketable and those above would not.
However, as discussed in Chapter 8, the implementation of the standards is most likely to be successful if a gradual, stepwise approach is used. Panel B in the figure illustrates the stepwise implementation approach relative to this particular example. Given the range of levels in the hypothetical food product category, it is determined that a hypothetical starting point of 80 mg per serving is consistent with an acceptable and non-disruptive reduction from existing current levels because in this example, across the possible range of salt content per serving, most marketed products do not contain 100 mg per serving (the high amount), thus acceptable reductions could begin at 80 mg per serving. The process would hypothetically begin in the year 2015. Foods within this category with more than 80 mg per serving could not be legally marketed after 2015.2 After an appropriate additional
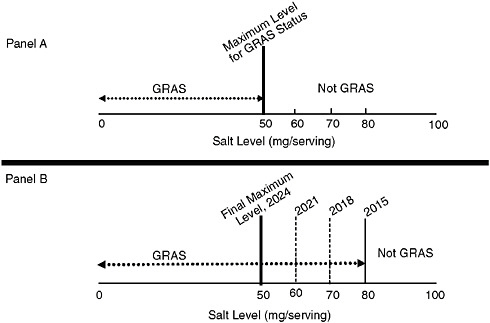
FIGURE 10-1 Modification of the GRAS status of salt for a hypothetical food category. Panel A: Final Maximum Level: Regulatory specification of salt content per serving for a hypothetical food category with a range of 0–100 mg of salt per serving. Final maximum level for the GRAS status is set at 50 mg of salt per serving. Panel B: Interim Maximum Levels: Use of stepwise reduction plan for achieving a final hypothetical maximum level of 50 mg of salt per serving by the year 2024. A decreasing maximum GRAS level of salt per serving (80 mg, 70 mg, 60 mg) is implemented over time (in 2015, 2018, 2021) with the final maximum level being reached by year 2024.
NOTE: GRAS = generally recognized as safe; mg = milligrams.
period of time, as determined by available data, the next “step” would take place—in this example, in the year 2018—and foods with more than 70 mg per serving could no longer be marketed. This would continue in a gradual stepwise process until the final goal of 50 mg per serving was reached for foods in this category. In this hypothetical example, the amounts of salt per serving are brought down by an additional 10 mg in each of the years 2015, 2021, and finally 2024, when the ultimate goal is reached. In reality, the levels of reduction may need to be larger or smaller, and the times for change may need to be altered. These levels and timeframes would need to be determined based on information gathering and computer simulation modeling carried out by the implementers. Adjustments in timeframes for reductions and the levels of reductions would also be needed should changes in the recommended levels of sodium intake be made. As also
discussed in Chapter 8, ongoing research and monitoring would be associated with this activity to identify any potential unexpected impediments to achieving the overall goal.
Use of Labeling as Part of the Stepwise Process
The use of special labeling/disclosure statements or other informational labeling as described in Chapter 6 requires careful attention to the context in which such statements will operate, as well as research to determine that the statements as presented not only have the desired effect but also fail to produce an undesired effect. Little evidence exists regarding the use of such statements as they relate to the sodium content of a food. With this understanding as a starting point, the committee found that it would be worthwhile to consider the use of special labeling or disclosure statements as a component of the stepwise process. Although cautious in its approach, the committee concluded that it may be possible to stimulate food manufacturers to work more quickly toward the appropriate maximum GRAS level if special labeling/disclosure statements were incorporated as part of the specified gradual implementation process. Additionally, the location of the special label/disclosure statement is an important factor. It may be relevant to so-called front-of-package labeling and could appropriately be incorporated as a component of those activities now foreshadowed by FDA.3
As an example of the use of labeling as part of the stepwise approach and shown in Figure 10-2, in the initial year 2015 in the hypothetical example discussed above, a food could not be marketed if it contained more salt per serving than the standard of 80 mg. In addition, however, regulators could stipulate that, during this initial step, products containing salt levels between 70 mg per serving (i.e., the next stepwise goal set to occur in 2018) and 80 mg per serving (the legal maximum) would be marketable only with a special label/disclosure statement in an effort to “stimulate” food manufacturers to reformulate to the next step. It is presumed that the labeling would be viewed as undesirable by the food industry, which would work more quickly to reformulate its products. The process would then be repeated at the time of the next stepwise reduction, decreasing the level at which the statement would be required until the year 2021 target (60 mg salt). That is, in the hypothetical example, while a manufacturer could legally market products with up to 70 mg of salt per serving, those containing between 60 and 70 mg would be required to bear the labeling. While this example is illustrated in Figure 10-2, it is possible that the level at which the “stimulating” special labeling/disclosure statement would be
|
3 |
Available online: http://www.fda.gov/Food/LabelingNutrition/LabelClaims/ucm180146.htm (accessed November 17, 2009). |
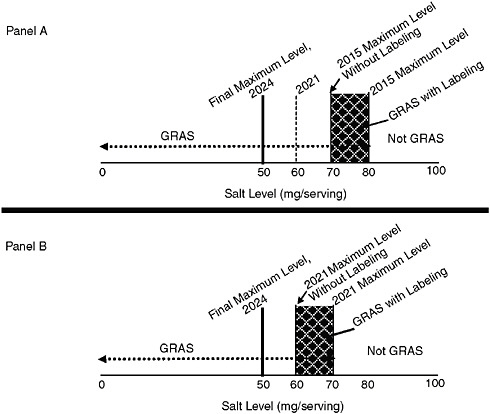
FIGURE 10-2 Example of hypothetical use of special labeling/disclosure statements as part of the stepwise implementation process. Panel A: At the time of the first stepwise reduction in the year 2015, foods with amounts per serving between the 2015 target and the target for 2018 (i.e., between 70 and 80 mg) would be required to bear the label. Panel B: At the time of the hypothetical second stepwise reduction in 2018, foods with amounts per serving between the 2018 target and target for 2021 (i.e., between 60 and 70 mg) would be required to bear a label. This process would be repeated each time a stepwise reduction is put in place.
NOTES: Other options are possible, including other ways of determining the levels of salt per serving that would bear a label during the stepwise implementation or the possibility that all products between the hypothetical final maximum level and the current stepwise target would bear a label. GRAS = generally recognized as safe; mg = milligrams.
set may not be the next stepwise target and could vary based on other relevant information. Another possibility is that the level could be set based on the final goal—that is, 50 mg per serving in this hypothetical example—in which case all products not consistent with the final goal would be required to bear the labeling during the full time period of the step-down.
Many factors would have to be explored, ranging from the feasibility of requiring the food industry to make relatively rapid labeling changes to consumers’ responses to the presence of special labeling/disclosure statements regarding sodium on many familiar foods. If such issues are resolved satisfactorily, it is possible that upon initiation of the stepwise approach, consumers could be informed about the relatively high sodium content of foods that are close to the allowable levels, and manufacturers might be motivated to make changes in their products during the in-between stages of the process rather than waiting until the next stepwise reduction is implemented.
Potential for Exemptions in Order to Remain GRAS
After reviewing the provisions related to Section 409 of the Federal Food, Drug, and Cosmetic Act as discussed in Chapter 8, the committee considered that in principle it may be possible to exempt certain foods from the generally provided GRAS conditions for salt because of the special nature of particular foods. Stated another way, the committee considered the possibility of special labeling or other disclosure statements being used to retain permanently the GRAS status of some foods that exceed the final maximum GRAS level once it is set in place. It has not been possible to define the nature of such exemptions as part of the committee’s work, but it was anticipated that FDA’s in-depth analysis of the food supply, information-gathering efforts, and related consumer behavior may reveal the desirability of such exemptions.
While the use of such labeling on products may not appeal to food manufacturers and thus may motivate them to seek further alternatives to lower the sodium content of their products, it was recognized that, consistent with Section 409 of the Federal Food, Drug, and Cosmetic Act, this would have to be based on appropriate research to demonstrate the ability of the labeling to protect public health. If appropriate, the use of such labeling would allow certain food products exceeding the GRAS levels for salt to retain their GRAS status and thus be available to consumers.
The committee agreed that this exemption approach should be explored by FDA and, if appropriate, used in a manner consistent with public health goals; it was agreed that such exemptions should be limited in scope in a fashion consistent with the anticipated FDA in-depth analysis of the food supply and consumers’ eating behaviors. The ability to provide for exemptions was regarded by some committee members as consistent with allowing for consumer choice as well as the unknowns that may be encountered in making changes in the food supply. A few committee members expressed doubt about the ability of such labeling to be effective in protecting public health. Others pointed out that the very limited research available dem-
onstrates a change in preference for salty foods following a low-salt diet during which all salt sources were restricted, and therefore it is not known whether an opportunity to consume some very salty foods (albeit in small amounts) might not block the taste change that is a desired companion goal to reducing the sodium content of the food supply. A fuller exploration of these options and possibilities was hampered by the limited nature of the data available.
Restaurant/Foodservice Operations
In general, most of the provisions described for processed foods could be applied to sufficiently standardized restaurant/foodservice operations. As appropriate, special labeling/disclosure statements as discussed above could be used in a similar fashion on menu boards and printed menus, although the labeling may have to be adapted for the purposes of restaurant/foodservice use. It may also be important to consider options for providing patrons of restaurant/foodservice operations with quantitative sodium content information for the menu item, as occurs with packaged foods.
However, the relative novelty of such regulatory approaches for restaurant/foodservice operations may require additional considerations during the implementation process. Among the issues to be examined are the impacts of variations in serving sizes, menu item options (e.g., the addition of sides, choice of proteins), limited-time and seasonal menu items, and service formats (e.g., buffets). There are unique challenges to reducing sodium in restaurant/foodservice operations, and as described previously, past initiatives to reduce sodium intake have focused relatively little attention on these operations compared to processed foods. The lack of past focus on sodium in the restaurant/foodservice sector creates a need for additional support and/or initiatives to encourage this sector to rapidly make sodium reduction an issue of importance.
While the entire restaurant/foodservice industry will be impacted positively by the recommended standards for adding salt to processed foods, it was recognized that it may not be feasible to extend these new standards to menu items of all restaurant/foodservice operations, notably those without sufficiently standardized operations. Such operations do contribute sodium to the overall diet. For these reasons, there is a need for activities to reach these operations that would not be required to comply with the GRAS standards and also to accelerate restaurant/foodservice industry efforts to reduce sodium across the entire sector. The challenge, as described in Chapter 6, is that there is a wide range of decision makers for the addition of salt to foods, and no single initiative may work to encourage all restaurant/foodservice operators to reduce sodium. For example, different approaches may be needed to encourage a highly trained menu developer
for a large contract restaurant/foodservice company to reduce sodium compared to a line cook finishing a dish by seasoning it with salt.
There may be lessons to be learned from other public health efforts related to restaurant/foodservice employee training. One example is the ServSafe® program, which provides restaurant/foodservice personnel with comprehensive food safety training and certification4 and has become integral to the ability of restaurants to comply with government-mandated food safety and sanitation practices. Conversely, there are possible limitations to this approach that must be examined, as exemplified by the unsuccessful New York City Department of Health effort to achieve voluntary reductions in restaurant/foodservice artificial trans fat use through a campaign that included the education of employees delivered during required food safety classes as one of its components (Angell et al., 2009).
Therefore, a number of approaches ranging from the introduction of voluntary standards to a variety of training methods for restaurant/foodservice personnel (on- or offsite learning, e-learning, trade media articles, etc.) may need to be piloted to identify the most effective approach. These initiatives could be developed by a number of stakeholders including the restaurant/foodservice industry and federal, state, and local health authorities.
Summary
The committee believes that the modification of the GRAS status of salt in processed food could be accomplished best if FDA:
-
specifies as GRAS the uses and use levels for salt that allow persons to consume such foods as part of a normal diet with a reasonable likelihood of keeping their total daily intake of sodium consistent with the Dietary Guidelines for Americans—these foods could be sold freely;
-
implements special labeling/disclosure statements, or informational labeling on foods as part of a stepwise implementation process for modification of the GRAS status of salt, provided research demonstrates that the labeling is effective—such labeling may (1) stimulate efforts on the part of the food industry to implement changes in sodium content more quickly, and/or (2) help inform consumers about foods with relatively high sodium content;
-
studies and implements as appropriate specified exemptions from non-GRAS status for certain individual foods and, if research indicates that the availability of such exempted foods with appropriate product special labeling/disclosure statements or other informa-
|
4 |
Available online: http://www.servsafe.com/index.aspx (accessed November 17, 2009). |
-
tional labeling would not preclude the protection of public health, provides for such exemptions or special accommodations (presumably on an infrequent basis); and finally,
-
determines those uses and use levels not covered above not to be GRAS, subject to the food additive petition process; such determinations would disallow certain food products from sale because of their salt content, but the petition process could be used as appropriate to allow continued marketing.
Further, the process associated with modifying the GRAS status of salt is also an important factor in implementing the strategy. Consistent with notice-and-comment rulemaking, it is anticipated that activities related to setting salt standards will be carried out in an open, public fashion in consultation and cooperation with interested stakeholders and will incorporate the best available information about the nature of the food supply and consumer eating behaviors. The desirable goal is to use the GRAS provisions for the conditions under which salt can be added to foods to assist in achieving population intakes consistent with the Dietary Guidelines for Americans. Further, as described in Chapter 7, the changes associated with implementing the standards are best put in place in a stepwise manner.
Activities important to FDA’s successful management of this process include:
-
implementation of changes in GRAS uses and use levels in a stepwise fashion so as to allow the food industry as well as the consumer to adjust to reduced sodium content in foods, and as to take into account research on conditions conducive to lowering salt taste preferences;
-
establishment of standards by food category, taking into account the relative dietary contribution of the food category, functional and safety issues, and as appropriate, the lessons learned from others who have developed standards for sodium in foods on the basis of food categories;
-
incorporation of a decision-making process fully informed by in-depth analysis of the food supply and the uses or functions of salt coupled with simulation modeling of the effects of different levels of sodium content on total intake, examination of consumer eating behaviors, consideration of food safety, and studies of economic impact and potential unintended consequences;
-
sensitivity to burdens on small business;
-
in the case of non-GRAS uses and use levels, timely and responsive management of the available petition process; and
-
regular, systematic, and comprehensive monitoring of the outcomes of the sodium reduction process for foods prior to each stepwise reduction so as to evaluate the impact and success of the prior step and determine any needed adjustments or changes.
Implementation Activities to Reduce the Sodium Content of Foods and Menu Items
Efforts to reduce sodium in the food supply have traditionally focused on food reformulation and the identification of salt substitutes. As suggested during the committee’s information-gathering workshop, some of the “easy” food reformulations to reduce the sodium content of processed foods have been achieved by the major food manufacturing companies, and in these cases, efforts to continue lowering the sodium content now require more creative and intense efforts. This topic is specifically highlighted below as a research need, but the committee recognized the importance of exploring these issues through public-private partnerships. Much of the exploration needed to elucidate the biology of taste and flavor, and to better understand the technological abilities to reduce sodium levels in food, may be undertaken by academic and private institutions. On the other hand, certain activities such as changes in manufacturing processes may be more appropriately carried out by the food industry. In any case, collaborative and cooperative partnerships among all stakeholders are desirable.
The identification of universal or widely applicable salt substitutes has been elusive and no safe, non-sodium, primarily salty-tasting molecule has been identified, with perhaps the single exception of potassium chloride. However, potassium chloride causes foods to taste bitter to a number of people so it cannot be used in some products; in many others, the bitterness limits its use and its effectiveness as a replacement of sodium chloride. As described in Chapter 3, there is reason to systematically pursue salt enhancers or alternative methods for delivery of salt taste. Again, this is a situation for which public-private partnerships are appropriate. There is a current focus on sea salts, which are often touted as a salt substitute. However, because sea salt contains large amounts of sodium, it is unclear how effective it might be in reducing overall sodium intake. Further study of sea salt as one of the many approaches to achieving lower intake of sodium is warranted.
What is clear is that waiting for, or expecting to rely heavily upon, a salt substitute or salt enhancer would not be appropriate or in the interests of public health. Such avenues should be explored, and substitute compounds can serve as useful adjuncts; overall, however, the emphasis should be on (1) reducing the sodium content of the food supply, (2) lowering preferences for salty foods, and (3) promoting existing general dietary recommendations
that are consistent with a lower sodium intake—specifically, taking in fewer calories and increasing fruits and vegetables in the diet.
Further, there is considerable progress to be made if broader alternative salt reduction approaches are incorporated into restaurant/foodservice operations. These include flavor strategies and culinary techniques that do not rely as much on salt, but rather on increased use of food ingredients naturally low in sodium. For example, use of fruits and vegetables and other minimally processed fresh foods as well as herbs, spices, and aromatics may hold potential for reducing sodium in restaurant/foodservice items. Additionally, alternative cooking techniques and strategies, such as searing to intensify non-sodium flavors, may also be useful strategies to reduce sodium. Additional guidance may come from taking into account experiences drawn from studying food and flavor patterns around the globe. Also, exploration of innovative strategies to reduce portion size could reduce the overall sodium content of restaurant/foodservice meals. Similarly, many menu items, for example in fast food restaurants, are made up of “layers” of high-salt items (e.g., the pickles, catsup, mustard, and cheese on a cheese-burger); strategies to replace some of these items with low-salt alternatives could result in a substantial reduction in sodium particularly in light of the discussions in Chapter 5 regarding food sources of sodium.
As part of the implementation steps, it should be recognized that the restaurants/foodservice sector of the food supply present special challenges in terms of educating and changing the behavior of those involved in various sector operations. In the case of large restaurants and chains, formulation decisions about the salt content of menu items may be centralized and standardized, although implementation may be widely dispersed among a diversity of staff. In the case of small independent restaurants, decisions regarding sodium content are often not standardized or centralized and may vary even daily based upon staffing and ingredients available. In light of limited evidence about how best to accomplish sustainable, widespread, employee-implemented reductions in prepared food sodium levels in menu items across the diversity of foodservice establishments, foodservice leaders will need to explore a range of flexible initiatives and pilot activities targeted to all personnel and the systems within which they operate. Moreover, compared to large chain operations, independents may require considerably more innovative approaches and extensive piloting. In any case, relevant activities include training and other professional development course work (e.g., on- or offsite learning, e-learning); information sharing among members of the industry (e.g., websites, publications, newsletters); so-called thought leadership, such as conferences, webcasting, leadership task forces, forums, and social responsibility statements incorporated into corporate policy; innovative incentive programs; creative mechanisms for involvement with local or regional health and food safety authorities and
infrastructure; and the exploration of voluntary and mandatory standards. The goal is to stimulate creative, innovative solutions and build industry consensus around education strategies. Again, public-private partnerships in this area would be especially advantageous.
Outreach to Consumers
The committee concluded that Americans cannot be expected to achieve meaningful reductions in sodium intake without changes in the food supply. However, changes in the food supply must also be accompanied by informed food choices on the part of individual consumers. Consumers have an important role to play and education and skill building efforts can help to motivate consumers and provide them with skills and tools to reduce sodium intake. Even with reductions of sodium in the food supply, consumers will still need to take actions to reduce their intake of sodium and to lower their preference for the taste and flavor of salty foods. For example, many consumers will need to alter dietary patterns to consume more foods that are naturally lower in sodium, consume smaller portions and fewer total calories, and avoid combining or layering higher sodium foods into single eating occasions. Implementation of the strategies related to consumers and behavior change must rest on a foundation of acceptance regarding the importance of reducing sodium intake. This can take the form of efforts to enhance consumer awareness of the importance of sodium reduction, as well as engaging consumers to be supportive of efforts to reduce sodium in the food supply. From this starting point, efforts can focus on improving consumer understanding of the specific behaviors that prevent their success in reducing personal sodium intake ranging from, for example, moderation in the use of bacon on salads to tasting foods before salting at the table. Further, a major label-reading campaign to enhance consumer knowledge about the sodium content of their foods would be appropriate. As highlighted below, the development of methodologies through new research to allow consumers to monitor their own sodium intake would be helpful.
The effectiveness of health communication efforts will be enhanced through guidance from social and behavioral theories and research and through the application of lessons learned from past domestic and international initiatives. Effective communication campaigns can underscore the benefits to be derived from changes in the food supply, which can reduce environmental barriers to sodium reduction. Likewise, these campaigns can be targeted in response to current knowledge of the relationship of sodium intake to health outcomes and attitudes toward reductions in sodium intake. Messages need to additionally be targeted toward increasing skills, including label-reading and food preparation, enhancing self-efficacy to make these changes, and supporting social norms for reduced sodium intake.
Time Line for Reducing Sodium Intake
Because of the number of unknowns regarding the specific process for reducing sodium in the food supply and implementing supporting strategies, it is challenging to identify a time line for the reduction of sodium intake across the U.S. population. The goal is to reduce the current estimated population intake of 3,400 mg/d to the level established by the 2005 Dietary Guidelines for Americans, which is 2,300 mg/d. While the new 2010 Dietary Guidelines for Americans will soon be released, it is unlikely that the sodium intake goal will have been raised to levels above 2,300 mg/d; instead, it is likely that it will either remain the same or decrease. Therefore, the goal of about a 30 percent or greater reduction is likely to remain the same for many years.
It must be assumed that a carefully conducted regulatory process to establish salt standards for foods will take time, given that stakeholder input and concomitant research and data gathering must occur. Certainly, while data from perceptual studies may point the way to the quantitative levels at which changes in the presence of a substance may not be perceived, much is yet to be learned about the application of such work to the wide range of food products and to other practical considerations in the real world. Further, the pace at which technologies can be developed and used to assist with the process is unknown.
Nonetheless, FDA, as part of its regulatory implementation, will establish a time line for the reduction of sodium in the food supply. However, as a general matter and as described earlier in the context of needed coordination, it would be important to ensure that an informed process is put in place to establish initial time lines and goals for overall reductions in sodium intake among Americans and for carrying out the implementing tasks that are separate from those for reducing sodium in the food supply. In turn, there must be an active process and responsible authorities to both coordinate and monitor these goals and adjust them as needed to ensure that they remain viable and serve to stimulate the process, making implementers accountable. For this reason, the existing strategies include the recommendation that the Secretary of Health and Human Services be responsible for this important activity.
Funding
The task of this committee did not include recommendations regarding the funding required to implement and evaluate strategies to reduce sodium intake. Substantial data-gathering from stakeholders, research, and decision making is needed as part of the development of the proposed strategies making it difficult to anticipate the total costs of such initiatives, and in turn, the level of funding needed. As several studies suggest, the reduction
of sodium intake will likely reduce health-care costs, which will be of benefit to the public (Bibbins-Domingo et al., 2010; Palar and Sturm, 2009; Smith-Spangler et al., 2010). However, it is also important to acknowledge that the proposed strategies will also require investment by industry and government. Funding is pivotal to the success of these strategies, and the importance of reducing sodium intake as a public health measure warrants funding at the federal, state, and local levels as appropriate. The report makes no recommendations concerning funding for FDA, U.S. Department of Agriculture (USDA), or other government agencies; however, the committee recognizes that additional or reallocated resources will be required to fully implement the recommended changes. It should also be acknowledged that reducing the sodium content of the food supply may incur significant reformulation costs for the industry that will likely be passed on at least in part to consumers. These overall costs, however, will be necessary to fully realize the public health benefits of reducing sodium intake.
RESEARCH NEEDS
Overall, the major research needs identified by the committee can be grouped into four general areas: (1) understanding salt taste reception and taste development; (2) developing innovative methods to reduce sodium levels in foods while maintaining palatability, physical properties, and safety; (3) enhancing current understanding of factors impacting consumer awareness and behavior relative to sodium reduction; and (4) monitoring sodium intake, sodium in the food supply, and salt taste preference. Research needs related to sodium intake reduction are considerable. The committee has focused on the most critical and germane so as to encourage the prudent use of limited resources to better support efforts to reduce sodium intake. The committee noted that with few exceptions the research needs identified may benefit from strong cooperation among public agencies, non-profit organizations, and private entities. In addition, it was felt that a renewed focus on many of the identified research needs should commence immediately, in hopes that such research might be able to inform the recommended strategies identified in Chapter 9. Given current estimates of the financial benefits of reducing the incidence of deaths resulting from hypertension and other diseases related to excessive salt intake (Bibbins-Domingo et al., 2010; Palar and Sturm, 2009; Smith-Spangler et al., 2010), funds to support these initiatives will be well spent.
Salt Taste
There are many scientific gaps pertaining to salt taste perception. Research on salt taste and its modification would help policy makers and the food industry identify additional effective approaches to achieving sodium
reductions in foods that are acceptable to consumers. This is an area of research in which the National Institutes of Health (NIH) could play a productive role and an area that could benefit from the development of public-private partnerships. Research needs in this area include the following:
-
Although the hypothesis that epithelial sodium channels are one set of salt taste receptors is currently accepted by most sensory scientists, questions remain as to why discrepancies exist between human and experimental animal studies regarding these receptors. It is also believed that at least one additional salt taste receptor exists, but the structure, location within the oral cavity, and mechanism of reception are unknown. Research to elucidate the mechanism(s) by which salty tastes are perceived could facilitate the development of salt taste enhancers, allowing for reduction of sodium levels in food while maintaining desirable tastes and flavors.
-
More research is also needed to understand the development of salt taste preferences and their modification. Information gaps in this area include understanding how taste preferences develop in early childhood. For example, several studies have indicated that experience with salt taste in infancy and early childhood influences taste preferences, which some researchers believe may set lifelong preferences for the level of saltiness in food that is appealing. Further investigation of such topics may be highly valuable in determining whether reduced sodium exposure in early life can reduce preferences for high-sodium diets in adulthood and whether strategies to focus on early interventions should be pursued.
-
There is evidence to show that salt taste preferences can be changed in adulthood when sodium is reduced across all foods. However, several important issues remain unknown that may impact the success of this strategy to successfully reduce salt intake of the population. First, the time course of changes in preference for salty foods in response to changes in salt intake is not well understood. Second, there are questions on the extent of the salt reduction that can be accomplished in a single reformulation without greatly altering the palatability of the food. The size of such reductions may be food category specific, but further research may reveal general principles that will permit predictions in different food systems. Third, it is unknown whether individuals are able to acclimate to lower-sodium foods when some high-sodium foods remain part of their diet. For example, it is not known whether sensory accommodation would occur if salt were reduced in a single product category such as soup or bread or if the majority of the diet were low in sodium but consumers occasionally consumed foods that might
-
be exempted from sodium reduction (anchovies, olives, etc.). This gap in current knowledge has been a concern for some committee members in determining whether exemptions should be considered for salty foods consumed in small quantities.
Sodium Reduction in Food
Current and ongoing industry reformulation has demonstrated that substantial reductions in sodium can be achieved based on existing technology and science. However, given the need to significantly reduce the sodium content of the food supply to achieve recommended population intake levels, additional innovations and research will be necessary to secure reductions while maintaining product taste, texture, safety, and shelf life. Undoubtedly, heightened attention to such innovation could be sparked by regulatory efforts to reduce sodium throughout the food supply. Research needs in this area include the following:
-
For some products, there is a need to develop new methods to achieve palatability given reduced sodium content. Although development of salt enhancers and replacers may be a useful step toward achieving palatability in such products, other innovations are also promising. For example, salt is often added to foods to decrease the perception of bitterness. Research to develop methods for non-sodium ingredients to reduce unappealing bitterness may in turn lead to decreases in the sodium content of certain foods. Bitterness reducers may also permit higher substitution levels for potassium chloride. Other innovations such as change of salt crystal structure or location of salt crystals within a food product show potential as well. Product and menu development research focusing on enhancing other tastes and flavors within food products while reducing sodium content may also be useful. Such research could examine how the addition of herbs, spices, and other ingredients and innovative culinary techniques may create foods that are well accepted by consumers despite their lower salt content.
-
Research is also needed to continue the development of processing methods or alternative ingredients to replace sodium to create physical properties within some foods. While a number of alternatives exist for replacing sodium functionality in reduced-sodium foods, many of these alternatives are limited to particular applications, and more alternatives may be found if increased attention is given to this area.
-
Research is needed to better understand the minimal levels of sodium necessary for those products in which salt provides a safety
-
function, including allowing adequate shelf life. As products are reformulated to reduce sodium content it will be essential that manufacturers test the new formulations to ensure that the product remains safe over its intended shelf life, factoring in common mishandling of the product. It may also be important for manufacturers to account for changes in the shelf life of their products in establishing expiration dates.
-
To aid manufacturers in maintaining safety, government agencies, trade associations, and research institutions may need to work with food processors—particularly smaller processors with limited research capacity—to help them avoid reformulations that might heighten the risk for foodborne disease. These research efforts might include work to expand and promote the use of computer models for predicting microbial growth in foods, such as the USDA’s Predictive Microbiology website,5 and efforts to research the potential of incorporating alternative hurdles to microbial growth as sodium is reduced.
Supporting Consumers
A third area involves the need for more refined understanding of approaches to effectively change consumers’ knowledge, attitudes, and behavior regarding sodium. Research needs relevant to this interest are often cited in consensus reports on diet and health, and generally focus on experimental research examining the fundamental factors involved in changing dietary behaviors and experimental and observational research examining the most important established and novel factors that drive changes in population health. All such efforts would assist in improving the support given to consumers for behavior change relative to sodium intake, but three specific research areas are highlighted below.
-
The strategies recommended in this report represent an innovative approach to dietary change that embeds a health communication campaign in the context of large-scale changes in the levels of sodium in the food supply. This has clear implications for dietary and other health behaviors that are potentially associated with reducing sodium intake, such as reducing calorie intake. Evaluation of the relative contributions of these associated interventions to sodium intake reduction is warranted, using a range of available evaluation methodologies.
|
5 |
Available online: http://fsrio.nal.usda.gov/document_reslist.php?product_id=66 (accessed November 17, 2009). |
-
In today’s environment, messages about sodium reduction compete with dietary recommendations about other nutrients and with recommendations about diseases other than hypertension. It is possible that consumers often have difficulty translating diet and health information into food choices compatible with all diet recommendations and may focus on one nutrient and fail to act on other nutrients. Research is therefore needed to elucidate the effectiveness of a single nutrient message as would be the case for sodium reduction, and consumers’ ability to integrate messages for sodium into existing well-established dietary guidance consistent with sodium reduction, such as increasing consumption of fruits and vegetables and lowering calorie intake.
-
The appeal of salt taste has been documented. An important research area is the question of how behavior change models for sodium reduction can effectively be structured when the behavior in question is strongly motivated by the pleasure of taste.
Monitoring Sodium Intake, Sodium in the Food Supply, and Salt Taste Preference
There are a range of monitoring and surveillance research needs.
-
The importance of better monitoring the intake of sodium among the U.S. population has resulted in the recommendation that 24-hour urine collection be carried out as part of U.S. national surveys. Because 24-hour urine collection is complicated under the best of circumstances, as a first step to implementing this activity, it is possible to use existing surplus urine samples from the National Health and Nutrition Examination Surveys (NHANES) to pilot-test methodologies for comparing casual collection outcomes with measurements obtained from 24-hour collections and for improving the approaches to collecting 24-hour urine samples. Further, other methodologies should be explored, including improved and simpler approaches for use in large surveys. Research is needed to develop a more easily obtainable marker of sodium intake than 24-hour urine collection that is reliable, economical, and easy to administer for population surveys.
-
Research is needed to develop technologies to assist individuals in assessing their sodium intake. It is important to help consumers monitor their individual sodium intake through readily available and accurate measures of sodium intake. Even within the context of reducing overall sodium levels in the food supply, individuals must still take individual actions to reduce sodium intake. To do so,
-
the ability to measure one’s own intake over time would be advantageous. This is particularly important for high-risk individuals.
-
Research is needed to better track the sodium content of the food supply. The development of new and refined methodologies would be useful. Such methodologies might range from opportunities to link Universal Product Code-level sales data to information on the nutrient content of the food as stated on the Nutrition Facts panel, to the development of databases relative to the sodium content of foodservice menu items.
-
Research is needed to expand the development of and continue to validate brief salt taste tests to monitor changes in perception following reduction of salt in the food supply. A recommendation has been made to complete development of an appropriate methodology and, in turn, initiate monitoring of salt taste preference on a national level. It is expected that consumers will adapt their sensory preferences toward lower salt levels as they are exposed to them during the stepwise reduction of salt and sodium in the food supply, and monitoring of this is critical to measuring the effectiveness of and adjusting the approaches to reducing sodium intake. To accomplish taste monitoring, there is a need for the development, testing, and validation of brief taste tests that can be incorporated into population-based monitoring efforts, such as NHANES. Efforts for other aspects of taste are currently under development as part of the NIH Toolbox for Assessment Initiative,6 and these could serve as a model.
REFERENCES
Angell, S. Y., L. D. Silver, G. P. Goldstein, C. M. Johnson, D. R. Deitcher, T. R. Frieden, and M. T. Bassett. 2009. Cholesterol control beyond the clinic: New York City’s trans fat restriction. Annals of Internal Medicine 151(2):129-134.
Bibbins-Domingo, K., G. M. Chertow, P. G. Coxson, A. Moran, J. M. Lightwood, M. J. Pletcher, and L. Goldman. 2010. Projected effect of dietary salt reductions on future cardiovascular disease. New England Journal of Medicine 362(7):590-599.
Palar, K., and R. Sturm. 2009. Potential societal savings from reduced sodium consumption in the U.S. adult population. American Journal of Health Promotion 24(1):49-57.
Smith-Spangler, C. M., J. L. Juusola, E. A. Enns, D. K. Owens, and A. M. Garber. 2010, Population strategies to decrease sodium intake and the burden of cardiovascular disease. Annals of Internal Medicine 152(8):481-487.
|
6 |
Available online: http://www.nihtoolbox.org/WebPart%20Pages/AboutUs.aspx (accessed November 17, 2009). |


