
2
Sodium Intake Reduction: An Important But Elusive Public Health Goal
For 40 years, the numerous public health initiatives to reduce sodium intake of the U.S. population focused on consumer education and behavior change. These activities were accompanied by requests to the food industry (defined as both the processing and restaurant/foodservice sectors) to assist consumers by marketing lower-sodium alternatives and voluntarily reducing the amount of sodium in its foods, as well as requests to provide information on the sodium content of foods at the point of purchase. Efforts to provide such point-of-purchase information relate to both the consumer-oriented strategies and the supporting strategies associated with voluntary changes in the food supply. That is, nutrition labeling—which includes information about sodium—is intended to assist consumers at the point of purchase; the ability to make claims on food labels about the sodium content of the product was historically viewed as providing an incentive to the processed food industry to voluntarily reformulate its food products, while at the same time informing consumers at the point of purchase.
This chapter highlights these past and current U.S. initiatives and considers whether the intended outcome of reducing the sodium intake of Americans has been achieved. More information about the data presented in this chapter as well as other factors important to strategies for reducing sodium intake can be found in the background chapters that appear later in this report. In addition, Appendix C provides a summary of past and current efforts to reduce sodium intake internationally.
PAST RECOMMENDATIONS AND MAJOR INITIATIVES
Initiatives
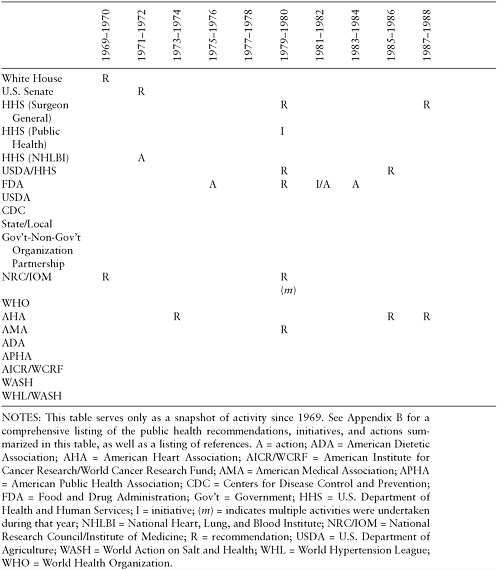
The 1969 White House Conference on Food, Nutrition, and Health is often regarded as the starting point for national initiatives to reduce sodium intake. Beginning in 1969 and continuing through the present time, numerous initiatives have been developed by a myriad of government public health agencies (FDA, 1975–2007; HHS, 1979–2000; NHLBI, 1972–2006; Senate, 1977; state and local agencies, 2008–2009; USDA, 1993–2008; USDA/HHS, 1980–2005; White House, 1969); independent national and international authoritative scientific bodies (NRC/IOM, 1970–2010; WHO, 1990–2003); and health professional organizations (ADA, 2007; AHA, 1973–2008; AMA, 1979–2006; APHA, 2002). These initiatives have ranged in scope from sweeping national dietary recommendations and goal-setting activities to fact sheets for consumers and health professionals, to calls for food industry and government actions to create or alter policies that might help to reduce sodium intake. When combined, these various initiatives have played a role in attempting to reduce the sodium intake of Americans.
Too numerous to describe in detail, these efforts are listed in Table 2-1 and summarized in Appendix B. Many of these initiatives were developed as part of a public process that involved scientists, consumers, and members of the food industry. Their existence demonstrates the level of resources and effort that have been mustered to reach the goal of lowering sodium intake. Many of these activities disseminated relevant information to consumers directly as well as to the food industry and to “multipliers” such as health professionals and the media. Some of the messages about sodium were linked to other public health messages and campaigns focusing on dietary factors (e.g., increased consumption of fruits and vegetables, decreased saturated fat intake) and chronic diseases and other health conditions with diet-related risk factors (e.g., heart and other cardiovascular diseases, obesity and overweight, cancer, diabetes, osteoporosis, bone health). The food industry and consumer advocacy groups also provided consumer information on the topic.
At the federal level, the National Heart, Lung, and Blood Institute (NHLBI) within the National Institutes of Health has served as a federal leader in the area of dietary sodium reduction by providing a number of enabling tools for dietary change related to sodium intake. Early efforts included sponsorship of the National High Blood Pressure Education Program (NHBPEP). This was a cooperative effort involving professional and voluntary health agencies, state health departments, and community groups with the goal of reducing death and disability related to high blood
pressure through programs of professional, patient, and public education. The NHBPEP published scientific reviews and recommendations in 1972, 1993, and 1995 and cosponsored a large national public information-gathering workshop in 1994 with other federal agencies (NHLBI, 1996). Auxiliary activities of the NHBPEP included the production of fact sheets, pamphlets, and brochures dealing with lifestyle changes, planning kits, posters and print ads, radio messages, and working group reports. More recently, scientific reviews, recommendations about sodium reduction, and auxiliary outreach activities have been part of the 1997 and 2003 activities of the Joint National Committee on Prevention, Detection, Evaluation, and Treatment of High Blood Pressure. Partnerships with state, local, and community-based organizations formed the basis for the recent development and dissemination of educational materials and the production of broadcast-ready public service announcements about fighting high blood pressure through dietary changes.
Initiated in 1980 by congressional mandate, the Dietary Guidelines for Americans provide science-based guidance to promote health and reduce risk for major chronic diseases through diet and physical activity. The U.S. Department of Agriculture (USDA) and U.S. Department of Health and Human Services (HHS) jointly sponsor the development of Dietary Guidelines for Americans, including the convening of an expert advisory committee. The recommendations are regularly revised and updated on a 5-year cycle; to date, six editions of the Dietary Guidelines for Americans have been published. Currently, an expert advisory committee is reviewing the science in preparation for the seventh edition. Since the document was first published in 1980, every edition has contained recommendations for Americans related to reduction in and moderation of sodium intake, but quantitative recommendations were not included until the 2005 edition. To assist consumers in implementing the Dietary Guidelines for Americans through informed food choices, USDA developed the MyPyramid program,1 which is one of its major consumer initiatives for dietary change. Implementation of the sodium recommendations as an area of focus was particularly challenging. To help consumers meet recommendations from the Dietary Guidelines for Americans, USDA provides a menu planning program on its website2 that allows individuals to enter information about the foods they consume and to compare their daily food intake with Dietary Guidelines for Americans recommendations. However, sodium as an area of focus is not included. That is, sodium levels are not factored into the MyPyramid
|
1 |
Available online: http://www.mypyramid.gov (accessed November 16, 2009). |
|
2 |
Available online: http://www.mypyramidtracker.gov/planner/ (accessed November 16, 2009). |
Plan or the MyPyramid Menu Planner tools. There is a footnote3 in the MyPyramid Menu Planner explaining that sodium cannot be accurately calculated using the tool because sodium levels can vary so much within a single food and it is difficult to estimate consumers’ discretionary salt use.
Further, in 1995 USDA initiated sodium standards for 10 commodity food categories in its Commodity Distribution Program targeted to school meals (USDA, 1995). Starting in 2004, it implemented sodium reduction efforts into the HealthierUS School Challenge4 and the Special Supplemental Nutrition Program for Women, Infants, and Children programs (USDA/FNS, 2007).
In parallel with federal efforts aimed at sodium reduction strategies, efforts by professional and health associations to develop and disseminate information about organization goals and recommendations have also been used to create awareness. Sodium reduction initiatives were started by the American Heart Association in 1973 and the American Medical Association in 1979 and have continued to the present. Their recommendations urge the public to aim for lower sodium intake (Havas et al., 2007; Lichtenstein et al., 2006). Other groups such as the American Public Health Association and the American Dietetic Association have also been active in promoting sodium reduction messages.
Many government-based initiatives have called on the industry and other stakeholders to assist consumers in reducing their sodium intake. Consumer advocacy groups, such as the Center for Science in the Public Interest (CSPI), have spread the message of the importance of reducing salt in the diet. Further, online health information sites are accessible sources of health information for many Americans. The food industry has included information on sodium and health on its websites. For example, Campbell’s5 and Kellogg’s6 have information on healthy sodium intake on their websites, and General Mills is a partner in sponsoring the Eat Better America website, which contains sodium and health information.7
|
3 |
Available online: http://www.mypyramidtracker.gov/planner/planner_salt.html (accessed November 16, 2009). |
|
4 |
Available online: http://www.fns.usda.gov/TN/HealthierUS/all_chart.pdf (accessed November 16, 2009). |
|
5 |
Available online: http://www.campbellwellness.com/subcategory.aspx?subcatid=3 (accessed November 16, 2009). |
|
6 |
Available online: http://www.kelloggsnutrition.com/know-nutrition/sodium.html (accessed November 16, 2009). |
|
7 |
Available online: http://www.eatbetteramerica.com/diet-nutrition/heart-health/try-a-sodium-shake-down.aspx (accessed November 16, 2009). |
Core Message to Consumers
The basic message to consumers about the role of sodium in the development of elevated blood pressure has not changed during the past 40 years, but changes in the target audience as well as the approach to reducing sodium intake have evolved as the science has matured. Many of the early messages and nutrition labeling initiatives focused on persons with diagnosed high blood pressure and those at high risk for high blood pressure or both (Loria et al., 2001), as well as elderly people.
As new science emerged, the focus expanded to include all adults as well as children. The extended focus for adults was based on evidence suggesting that generally reducing sodium intake could prevent or minimize age-related increases in blood pressure. The inclusion of children (2 or more years of age) was based on concerns about the development of preferences for salt taste at young ages and the increasingly earlier development of high blood pressure in adolescents and young adults (DGAC, 2005).
Further, messages for at-risk subgroups within the general population (e.g., persons with hypertension, African Americans, and middle-aged and older persons) continue to be provided because of the higher incidence rates and more serious consequences of excessive sodium intake for these subgroups (DGAC, 2005). These separate messages are based on the understanding that these at-risk subgroups benefit from a more stringent sodium reduction than that recommended for the general population.
Although, as discussed in Chapter 1, the expansion of recommendations to the general population has engendered considerable controversy from some stakeholders (Alderman, 2010; Cohen et al., 2006; Loria et al., 2001; McCarron, 2000, 2008; McCarron et al., 2009), the many expert advisory panels used in the development of sodium reduction recommendations and guidelines, including both those convened by government agencies and those convened independently, have consistently and repeatedly concluded, after careful evaluation of the available scientific evidence and stakeholder concerns, that the scientific evidence warrants extending recommendations for reduction of sodium intake to the general population and across the lifespan.
Over the years, the message content also changed from advice for consumers to reduce the addition of salt added to foods at the table or in home food preparation to choosing high-sodium foods in moderation and using the nutrition label when purchasing foods to enable selection of foods with lower sodium content (Loria et al., 2001). This change was based on evidence showing that the major sources of sodium in the U.S. diet were processed foods and foods obtained from restaurant/foodservice operations rather than from salt added by consumers during home food preparation or at the table.
Past Recommendations for Food Industry Actions and Point-of-Purchase Information
Many of the initiatives identified in Table 2-1 include recommendations that food processors voluntarily reduce the sodium content of their foods, market lower-sodium alternatives, and make information on the sodium content of their foods readily available at the point of purchase. More recently, calls have also been made for restaurants and other foodservice operations to do the same.
These earlier efforts focusing on the food industry were supported and heightened by the results from a small but frequently cited study published in 1991 (Mattes and Donnelly, 1991). It found that processing-added sodium provided more than 75 percent of the total sodium intake of individuals. Another 5 percent was attributable to salt added during cooking and 6 percent was due to salt added by consumers at the table. Subjects had control over the amount of salt added during cooking; during the 7-day study period they ate fewer than three meals away from home and prepared their own meals at home. Thus, the amount of sodium directly under the control of the individual was shown to be relatively small, and most dietary sodium was shown to come from sources beyond consumers’ direct control. Consistent with this, Engstrom et al. (1997) reported that even with a 65 percent reduction in discretionary salt use (i.e., from 1,376 mg/d sodium in 1980–1982 to 476 mg/d in 1990–1992), average daily sodium intake remained > 3,000 mg/d—a level in excess of the Dietary Guidelines for Americans goal of < 2,300 mg/d.
As mentioned previously, these data put in motion a change in the emphasis of recommendations from encouraging consumers to reduce or avoid salt use at the table and in home food preparation to an emphasis on encouraging food processors to reduce the sodium content of their products. Calls for point-of-purchase information about the sodium content of foods increased. When the 1990 Nutrition Labeling and Education Act (NLEA) was enacted, the Food and Drug Administration (FDA) ensured that sodium was one of the nutrients that must be declared on the labels of processed foods.
At the same time that requests were being made to members of the food industry to voluntarily reduce sodium in their products to assist consumers in lowering their sodium intake, concerns were being raised about the safe use of salt in foods, specifically the levels of salt added by manufacturers. An independent expert panel evaluating this topic in 1979 (SCOGS, 1979) recommended, among other things, that FDA develop guidelines for the safe use of salt in processed foods. As described in more detail in Chapter 7, FDA deferred action on these recommendations, suggesting that the largely voluntary 1975 sodium-based nutrition labeling regulations coupled with
newer 1982 regulations specifically targeting sodium information on food products would likely be effective in helping consumers reduce their sodium intake and stimulating voluntary reductions by manufacturers of sodium in labeled foods (HHS/FDA, 1982).
Later, in implementing the 1993 nutrition labeling regulations, FDA and others anticipated that the regulations relating to mandatory declaration of the sodium content of foods and sodium-related criteria for voluntary food label claims (described in Chapter 7) would further aid consumers in selecting lower-sodium foods and stimulate manufacturers to reduce the sodium content of marketed foods. However, despite these significant increases in labeling requirements and opportunities, sodium intake remained high. Concerns that FDA may still need to address the levels of salt added to foods resurfaced with a 2005 citizens’ petition (CSPI, 2005a) and language in a congressional appropriations bill requesting that FDA take action in reviewing the regulatory options for salt added to foods. FDA held public hearings in 2007 to gather information relevant to a possible reexamination of the regulatory status of salt (HHS/FDA, 2007).
OUTCOMES
To assess whether public health initiatives over the past 40 years were associated with relevant changes, four major areas were examined: (1) consumer awareness and behaviors, (2) sodium levels in the food supply, (3) sodium intake, and (4) prevalence of hypertension. The data sources for the collation of this information were primarily published survey results from the national nutrition monitoring system. Some of these areas are described in more detail in other sections of this report.
Consumer Awareness and Behaviors
A common theme running through the myriad initiatives and programs described in Table 2-1 and Appendix B is that providing advice to consumers on the health risks associated with high sodium intake would result in increased consumer awareness and would motivate consumers to take action to reduce their sodium intake. It was also anticipated that providing consumers with information about the sodium content of processed and restaurant foods at the point of purchase would help them select lower-sodium foods and, thus, reduce total intake. The question then arises: How successful have the many initiatives carried out over the past four decades been in achieving these goals? Although the available evidence is limited, it does provide insights into the success, or lack thereof, of consumer education and information initiatives.
This section reviews available information on consumer understanding
and behavior related to sodium and health over time. The topics covered include information on consumers with respect to the following:
-
awareness of the relationship between salt/sodium intake and health;
-
belief about the importance of the relationship to self and behavior intentions;
-
accuracy of perceptions of sodium intake;
-
use of nutrition label information; and
-
use of table salt.
Awareness of the Relationship Between Salt/Sodium Intake and Health
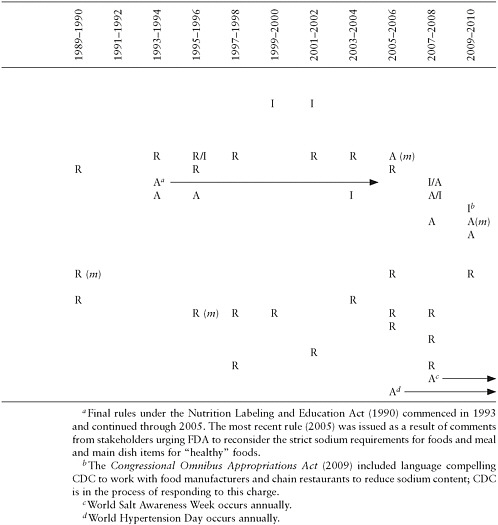
An awareness of a diet/health relationship is generally considered a first step in motivating consumers to make dietary changes (Derby and Fein, 1995). As shown in Figure 2-1, a 1979 survey conducted by FDA showed that only 12 percent of Americans mentioned salt or sodium as a
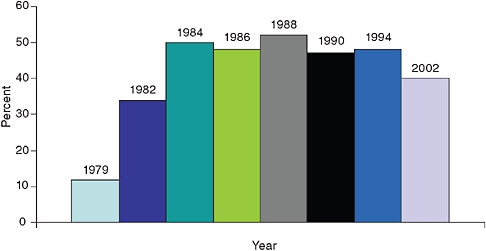
FIGURE 2-1 Consumer awareness of the relationship between salt/sodium intake and high blood pressure, 1979–2002.
NOTES: Teisl et al. (1999) expressed results as the mean of reported responses among men and women. The response for the total population in 2002 was calculated by multiplying the percentage of respondents reporting they had heard of dietary factors being related to high blood pressure (75 percent) by 0.526, the proportion of those who had heard of dietary factors related to high blood pressure and who identified salt/salty foods/sodium as the dietary factor (FDA, 2007).
SOURCES: 1979 and 1982: Heimbach, 1985; 1984–1994: Teisl et al., 1999; 2002: FDA, 2007.
likely cause of high blood pressure (Heimbach, 1985). In a 1982 follow-up survey, this level rose to 34 percent (Heimbach, 1985). The levels vacillated between 43 and 48 percent between 1984 and 1994 (Teisl et al., 1999) and subsequently dropped to 39 percent in 2002 (FDA, 2007).
Teisl et al. (1999) conceptualized the question of awareness as the relative position of a response in a hierarchy of responses, not a simple knowledge of a particular diet/health relationship (Teisl et al., 1999). The authors stated that declines in the awareness value “are evidence of competing messages, concerns about credibility, and/or habituation, not of decreased knowledge or understanding.” Overall, this suggests that consumer awareness of the relationship between sodium/salt intake and health increased as the large-scale educational programs from Table 2-1 were implemented, but creating awareness in the U.S. population to levels greater than 50 percent may be difficult to achieve. Additionally, the results suggest that it may be difficult to sustain a relatively high level of awareness for a topic such as sodium and high blood pressure over long periods of time.
While almost half of U.S. consumers were aware of the link between salt/sodium intake and high blood pressure during the decade from 1984 to 1994, fewer made the link between salt/sodium intake and heart disease and heart attacks. In USDA’s 1989–1991 Diet and Health Knowledge Survey, 57 percent of meal planners and preparers recognized the risk for hypertension8 whereas only 26 percent recognized the risk for heart disease9 (Cypel et al., 1996). Comparable questions in the 1994–1996 survey found that the higher recognition of the salt/sodium relationship to blood pressure compared to heart disease persisted (51 percent for hypertension and 24 percent for heart disease) (Tippett and Cleveland, 2001). FDA’s 2002 Health and Diet Survey also reported a greater awareness of high blood pressure or hypertension than heart disease (39 percent for hypertension and 7 percent for heart disease or heart attack)10 (FDA, 2007). However, this more recent survey also suggested lower percentages of awareness of salt/sodium and disease relationships (i.e., 39 and 7 percent, respectively) than had been observed in the earlier surveys (i.e., 51 and 24 percent,
respectively, in 1994–1996). It is not possible to determine whether the differences in the percentage of persons recognizing the relationship between sodium/salt and hypertension or heart disease between USDA- and FDA-sponsored surveys are due to declines in awareness over time or to sampling and methodological differences between these surveys. The results do indicate, however, that consumers are more aware of the relationship of sodium intake to high blood pressure/hypertension risk than to the associated risk of heart disease.
Consumers’ Belief About Importance of the Sodium-Disease Relationship to Self and Behavior Intentions
Knowing that excess sodium intake can cause adverse health effects does not necessarily mean that an individual will recognize a personal need for concern or that an individual will take action to reduce intake. As shown in Table 2-2, results from USDA’s Diet and Health Knowledge Surveys indicate that the percentage of main food preparers/planners who felt it was very important for them personally to avoid salt or to use salt and sodium only in moderation was relatively high (62 percent) in 1989–1991, but decreased to 52 percent by 1994–1996 (Cypel et al., 1996; Tippett and Cleveland, 2001). The percentage indicating that it was of low or no importance increased from 13 to 19 percent between these two survey periods. Thus, the personal importance that consumers gave to the avoidance of salt or to using salt/sodium only in moderation declined over the 5 years between surveys. The more recent 2002 FDA Health and Diet Survey found that 46 percent of respondents felt that they personally did not need to worry about their sodium consumption (FDA, 2007).
In terms of behavior, the FDA’s 2002 Health and Diet Survey (FDA, 2007) found that only 28 percent of respondents had attempted to reduce
TABLE 2-2 Personal Importance of Avoiding Salt or Using Salt/Sodium Only in Moderation
|
1989–1991 |
1994–1996 |
||
|
Level of Importance |
Percent of Respondents |
Level of Importance |
Percent of Respondents |
|
High |
62.2 |
Very important |
51.8 |
|
Moderate |
24.2 |
Somewhat important |
29.1 |
|
Low |
13.1 |
Not too important/not at all important |
18.8 |
|
SOURCE: USDA Diet and Health Knowledge Surveys, 1989–1991 and 1994–1996 (as reported by Cypel et al., 1996, and Tippett and Cleveland, 2001). |
|||
their sodium intake (22 percent indicated that they had already reduced their sodium intake by quite a bit and 6 percent indicated that they had been trying to reduce their sodium consumption but had not been very successful). Another 23 percent felt that they should probably reduce sodium intake, but they hadn’t really tried. More recently, consumer surveys by the International Food Information Council (IFIC) between 2006 and 2008 found that only 7–9 percent11 indicated that they had avoided eating or had eaten less salt/sodium in foods or ingredients over the few months prior to the survey (IFIC, 2006, 2007, 2008).
As consumers became aware of the importance of dietary factors in disease risk reduction, they reported that they had initiated efforts to alter their intake of relevant nutrients and food components (Derby and Fein, 1995). For example, about 25 percent of Americans reported trying to reduce their sodium intake in 1982; this level rose to 33 percent in 1986 and remained there through 1988. However, by 1990, the prevalence had dropped back down to 25 percent. This pattern of increasing, maintaining, and decreasing prevalence of self-initiated dietary changes was observed with cholesterol during the same time period.
Accuracy of Consumers’ Perceptions of Their Sodium Intake
As Derby and Fein (1995) point out, for consumers to translate a concern about intake into appropriate action, they need an accurate understanding of their own sodium intake. However, consumers’ conclusions about the appropriateness of their personal sodium/salt intake appear to be inaccurate. Results from USDA’s Diet and Health Knowledge Survey in 1989–1991 and 1994–1996 indicated similar mean sodium intake for individuals who thought their sodium intake was “too high” as for individuals who thought their sodium intake was “about right” (Cypel et al., 1996; Tippett and Cleveland, 2001). Moreover, in the 1994–1996 survey, the percentages of persons exceeding the recommended intake was 71 and 76 percent for individuals who thought their intake was “about right” and “too high,” respectively. Thus, both the groups who thought their sodium intake was about right and the groups who thought their sodium intake was too high appeared to have similar sodium intake, as well as intake well in excess of the recommendations of the Dietary Guidelines for Americans. In an experimental study in which participants consumed fast food meals from several national chains, participants estimated that, on average, the
meals contained 820 mg sodium whereas the actual average sodium content was 1,831 mg (Burton et al., 2009). In short, consumers seem unable to accurately estimate their own sodium intake.
Use of Nutrition Label Information and Intake
Many of the major initiatives over the past years recommended that sodium information at the point of purchase would be useful to consumers in reducing their sodium intake and selecting more healthful diets. FDA responded to the early calls for nutrient content information on processed foods at the point of purchase with regulations permitting voluntary labeling of sodium and several other nutrients in 1973 (HHS/FDA, 1973) (see Chapter 7). The need served as a rationale to underpin Congress’s enactment of the 1990 NLEA, which made nutrition information on food labels mandatory.
As shown in Figure 2-2, the advent of voluntary labeling in the 1970s resulted in about 40 percent of products carrying some form of permitted nutrition labeling as reported in 1978—increasing to about 63 percent in 1991, but these data do not distinguish between simple content declarations and the use of claims. With the initiation of mandatory nutrition labeling in 1993, virtually all processed food labels now contain nutrient content information, including sodium content (LeGault et al., 2004).
Given the ubiquitous presence of information about sodium content on
FIGURE 2-2 Percentage of products with nutrition labeling.
SOURCE: Reprinted from Journal of the American Dietetic Association 104(6), LeGault et al., 2000–2001 Food Label and Package Survey: An update on prevalence of nutrition labeling and claims on processed, packaged foods, pp. 952–958, Copyright © 2004, with permission from Elsevier.
packaged foods, the question then focuses on consumer use of such information. USDA’s Diet and Health Knowledge Survey examined the question of frequency of use of nutrition labels in its 1995–1996 and 2005–2006 surveys (Todd and Variyam, 2008). The reported frequency of use of the information is shown in Table 2-3.
Consumer indications that they “always/often” used the Nutrition Facts panel increased by 4 percentage points between 1995–1996 and 2005–2006 but decreased by 2 percentage points for this category of use for salt/sodium information. In terms of responses to “never” using label information, there was a 5 percentage point increase for the Nutrition Facts panel and a 10 percentage point increase for the salt/sodium information. Therefore, during the 10 years between surveys, there was greater decline in the use of salt/sodium information than in the overall use of the Nutrition Facts panel. The decreased use of sodium information paralleled decreases in the use of information on calories, total and saturated fat, and cholesterol; conversely, increased use of information on fiber and sugar was reported during this same time period.
In today’s environment, consumers are exposed to many diet and health messages that may seem contradictory or confusing (Derby and Fein, 1995). How do shoppers who are concerned about the nutritional content of the foods they eat rank concerns about sodium compared to other nutrients? As shown in Figure 2-3, compared to other nutrients, sodium does not appear to be the top concern in the minds of consumers (Food Marketing Institute, 2004). From 1997 to 2004, the major concern has been fat, with sodium and other nutrients of lesser concern.
These data also show that shoppers’ concerns with salt and sodium intake declined from 24 percent in 1998 to 14 percent in 2004. Conversely,
TABLE 2-3 Reported Frequency of Use of the Nutrition Facts Panel and Salt/Sodium Labeling
|
|
Frequency of Use (%) |
Change (percentage points) |
|
|
1995–1996 |
2005–2006 |
||
|
Nutrition Facts Panel |
|
|
|
|
Never |
22 |
27 |
+5 |
|
Rarely |
13 |
10 |
−3 |
|
Sometimes |
30 |
23 |
−7 |
|
Always/often |
35 |
39 |
+4 |
|
Salt/Sodium Information |
|
|
|
|
Never |
12 |
22 |
+10 |
|
Rarely |
22 |
19 |
−3 |
|
Sometimes |
30 |
25 |
−5 |
|
Always/often |
36 |
34 |
−2 |
|
SOURCE: Todd and Variyam, 2008. |
|||
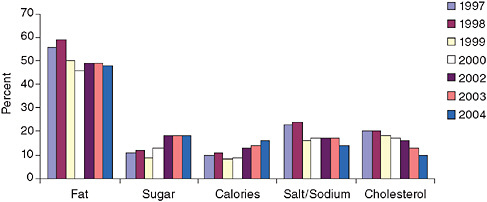
FIGURE 2-3 Shoppers who are concerned about the nutritional content of foods they eat.
SOURCE: Food Marketing Institute, 2004. Reprinted with permission.
respondents reported a 6 percentage point increase in concern with sugar and a 5 percentage point increase in concern with calories during this period (Food Marketing Institute, 2004). FDA’s 2005 Health and Diet Survey (FDA/ODPHP, 2008) also found that sodium did not rank high in comparison to other dietary concerns. Results showed that more Americans were trying to limit their intake of sugar, saturated fat, cholesterol, and trans fat than were trying to reduce their sodium intake. Thus, the level of concern about sodium was not sustained over time and never achieved the level observed for fat.
To evaluate whether consumers who indicated using or not using label information differed in their sodium intake, Variyam (2008) assumed that sodium content information from Nutrition Facts panels would be available for foods consumed at home but not for foods consumed away from home. Individuals were classified from USDA’s 1994–1996 Diet and Health Knowledge Survey as label users or non-users based on their response to the question of whether they use the panel’s information on nutrient content when buying foods. The results suggested that users and non-users of the Nutrition Facts panel did not differ in sodium intake for food consumed at home; their sodium intake was also similar for food consumed away from home. However, Variyam (2008) did find that label use was associated with a modest but beneficial impact on intake of several other nutrients (i.e., higher fiber and iron intake) but not on intake of total and saturated fat or cholesterol.
Consumers’ Use of Salt at the Table and in Food Preparation
Data published in 1991 suggested that salt added at the table and during cooking contributed only about 6 percent and 5 percent, respectively,
to total sodium intake (Mattes and Donnelly, 1991). Because these data showed such practices to be a relatively small contributor to overall sodium intake, behavior change messages generally have not targeted home salt use. Use of table salt continues to be a relatively minor contributor to overall sodium intake. Current data suggest that table salt contributes 4.9 percent to total sodium intake (see Chapter 5). Data from the National Health and Nutrition Examination Survey (NHANES) III (1988–1994) suggested that 50 to 72 percent of adults “never” or “rarely” added salt to table foods (Loria et al., 2001). Similar results were seen in the 2005–2006 NHANES in which 68 percent of all persons reported never or rarely adding salt at the table (Moshfegh, 2009). Survey respondents were also asked how often ordinary or seasoned salt is used in cooking or preparing foods in the home; response options and the percentage of respondents choosing these responses in 2005–2006 included “never/rarely” (24 percent), “occasionally” (37 percent), and “very often” (40 percent). This information is applied to algorithms for recipes and sodium absorbed in cooking (Moshfegh, 2009).
Sodium Levels in the Food Supply
Many of the major initiatives of the past 40 years have called for a reduction in the sodium content of marketed foods through direct appeals to food processors and through the availability of labeling provisions to provide additional incentives for the development of lower-sodium foods. This section reviews available information on the following:
-
sodium content of foods;
-
relative contributions of different sources to total sodium intake;
-
use of sodium-related label claims and advertising; and
-
availability of lower-sodium food products.
Sodium Content of Food
Marketed foods influence the sodium intake of consumers in two primary ways: through their sodium content and through the amounts consumed. This section focuses on the sodium content of foods from various food channels—that is, the various sources of foods available to consumers. The following section focuses on how changes in portion sizes and energy intake have affected the relative contribution of different food channels to total sodium intake.
One way to directly compare the sodium content of foods from different sources without the confounding effect of variations in consumer use is to compare their sodium intake densities, defined as the number of milligrams of sodium per 1,000 calories. As shown in Panel A of Figure 2-4,
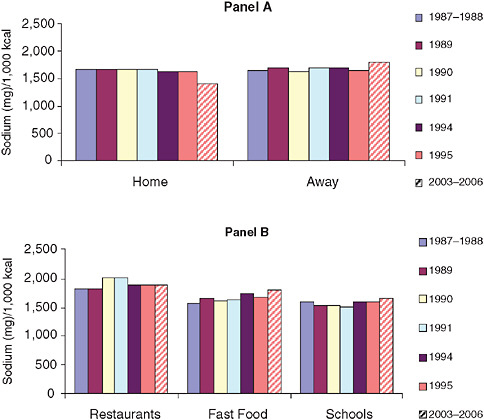
FIGURE 2-4 Mean sodium densities of home and away-from-home foods over time for persons 2 or more years of age.
NOTES: Restaurants, fast food, and schools reflect subsets of away-from-home foods. Restaurants are defined as those with waiter and waitress service, fast food includes self-service restaurants and carryout places, and schools include day-care centers and summer camps. Analyzed using 1-day mean intake data from NHANES 2003–2006 (also see Chapter 5 and Appendix F). kcal = calorie; mg = milligram.
SOURCES: Lin et al., 1999; NHANES 2003–2006.
nationally representative data collected between 1987 and 1995 reveal that the measures of sodium intake density of foods consumed either at home or away from home were similar (Lin et al., 1999). Likewise, foods obtained from fast food restaurants and schools have sodium densities that were not too different from those of the at-home food category, as shown in Panel B. Slightly higher sodium densities were reported for restaurant foods and slightly lower densities are seen for schools. These results suggest similar salt additions to foods from most locations during this time period.
As shown in Figure 2-4, more recent data prepared from the NHANES 2003–2006 suggest greater differences in the sodium densities of foods consumed away from home compared to foods consumed at home than seen in the earlier surveys. These data indicate that the sodium density of foods away from home was 1,825 mg/1,000 calories compared to 1,422 mg/1,000 calories for foods consumed at home. To interpret the sodium intake density data in Figure 2-4 with a reference intake of 2,000 calories per day, a density of < 1,150 mg sodium per 1,000 calories is consistent with the Dietary Guidelines for Americans recommendation of < 2,300 mg sodium per day. Within the away-from-home food sources, the rank order of restaurants as the highest and school meals as the lowest continues.
Crepinsek et al. (2009) used menu and recipe data from the Third School Nutrition Dietary Assessment Study to calculate the nutrient contents of nationally representative school breakfasts and lunches. According to their data for calories and sodium as the basis for calculating sodium intake density, school lunches served to students provided an average of 1,901 mg/1,000 calories. In addition, none of the schools offered lunches that met the benchmark for sodium content, which is set at one-third of the maximum daily intake recommended by the 2005 Dietary Guidelines for Americans. However, almost half of the breakfasts offered met the benchmark for sodium content, which is set at one-fourth of the maximum daily intake recommended by the 2005 Dietary Guidelines for Americans.
All of the sources identified above as well as all of the time periods for which data are available suggest that mean intakes are in considerable excess of the Dietary Guidelines for Americans goal. Taken as a whole, these data underscore the difficulty that consumers and meal planners have in meeting sodium guidelines using readily available foods. This is consistent with the concept that consumer taste preference for the saltiness of foods is fairly consistent regardless of where the food is obtained. Finally, these data suggest that all food channels will need significant sodium reductions to meet dietary sodium recommendations, and that sodium reduction strategies may be most effective if they include all food channels.
Relative Contributions of Different Sources to Total Sodium Intake
While sodium densities allow direct compositional comparisons across foods from different food channels, the full impact of these foods on total sodium intake is determined by the total amount of food consumed. The amount of food consumed is affected by several factors including portion size.
Recently, increasing portion sizes of food have received considerable attention as a likely contributor to the emerging obesity epidemic. Larger portion sizes also have the potential to deliver larger quantities of nutrients
such as sodium. Portion size can be affected by packaging sizes in processed food, portion sizes served in restaurant/foodservice operations, and the behavior of individual consumers.
As shown in Figure 2-5, the portion sizes of sample foods generally increased between 1977 and 1996 (Nielsen and Popkin, 2003). In general, this same pattern of increasing portion size over time was seen for the same foods when consumed at home or at a restaurant or when obtained from fast food vendors—suggesting that increasing portion size is a phenomenon common to all food channels.
Moreover, increasing portion sizes are not limited to the sample foods in Figure 2-5. Smiciklas-Wright et al. (2003) found that increasing portion sizes are widespread across a number of food categories. Using the Continuing Survey of Food Intakes by Individuals (CSFII) from 1989–1991 and 1994–1996, they found that nearly one-third of the servings from 107 food categories exhibited this pattern. Clearly, larger portion sizes will deliver greater amounts of sodium if sodium densities are not reduced.
With limited data on portion sizes across food channels, another way of estimating relative changes in sources of nutrients is to look at changing patterns in sources of energy intake. As shown in Figure 2-6, overall energy intake increased between 1977 and 1996 (Nielsen and Popkin, 2003). This overall increase was associated with a decreasing intake from at-home foods and an increasing intake from foods consumed away from home. These data suggest that even though sodium densities were similar for foods defined as eaten “at home” and “away from home” (see Figure 2-4,
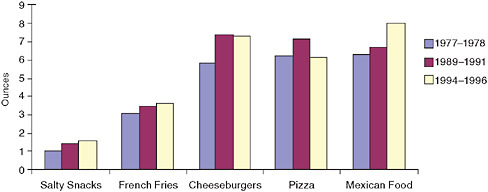
FIGURE 2-5 Differences in portion sizes 1977–1978 to 1994–1996 for key food items consumed by persons 2 or more years of age.
SOURCE: Nielsen and Popkin, 2003. Journal of the American Medical Association 289(4), pp. 450–453. Copyright © 2003 American Medical Association. All rights reserved.
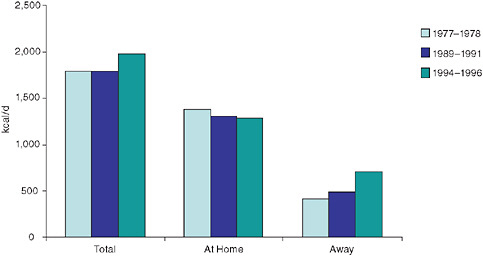
FIGURE 2-6 Mean energy intake 1977–1978 to 1994–1996 for foods eaten at home and away from home compared to total mean energy intake for persons 2 or more years of age, based on data from the 1977 National Food Consumption Survey and the 1989 and 1996 Continuing Survey of Food Intake by Individuals.
NOTE: d = day; kcal = calorie.
SOURCE: Nielsen and Popkin, 2003.
Panel A) during this time, their relative contributions to total intake were changing.
Current data on calorie and sodium intake from foods defined as eaten at home and away from home as collected in national surveys were assessed for this study (see Chapter 5 and Appendix F). The data from the 2003–2006 NHANES suggest that 63 percent of sodium intake comes from foods eaten at home and 37 percent from foods eaten away from home. Thus, both channels make a significant contribution to total intake. However, it is important to note that the at-home category is a mixture of processed foods (e.g., soups), prepared frozen meals and dishes, and carryout foods obtained from commercial restaurant/foodservice operations. Thus, the relative contribution of away-from-home foods is likely underestimated and the relative contribution of foods “prepared” at home is likely overestimated.
Overall, the above results underscore the potential benefit of a comprehensive approach to sodium reduction across all food channels. They also suggest that the effectiveness of sodium reduction programs will likely be enhanced if they are linked to other public health programs that focus on portion size and calorie control, as increased energy intake and portion
sizes contribute to sodium intake in addition to the sodium density of the food supply.
Use of Sodium-Related Label Claims and Advertising
As part of the common message over the past 40 years about the need for food manufacturers and, increasingly, restaurant/foodservice operators to reformulate and reduce the sodium content of their foods and to introduce new foods with lower-sodium content, it was assumed that the ability to use nutrition claims on food products would motivate food producers to offer products bearing sodium nutrient content or health claims. While declarations of the sodium content per serving of all processed foods became mandatory with the implementation of nutrition labeling in 1993, a manufacturer’s use of descriptive claims about the sodium content (i.e., nutrient content claims) and claims about the usefulness of low-sodium intake in reducing the risk of hypertension (i.e., health claims) is voluntary.
Figure 2-7 shows that nutrient content claims for sodium12 were most popular during the time the NLEA was being implemented in the early 1990s. Subsequently, their use dropped sharply, although there was a transient increase in 2000–2001. The use of sodium content claims in 2006–2007 was only slightly more than half their use in 1991–1993. Fat label claims have been the most popular, with 22.5 percent of products bearing these claims in 1997 and 17.2 percent in 2000–2001. The least used claims are fiber (2.5 and 2.0 percent in 1997 and 2000–2001, respectively) and saturated fat (3.8 and 2.0 percent, respectively).13
Information on the product categories showing the most extensive use of sodium content claims in the U.S. marketplace is periodically collected in FDA’s Food Labeling and Package Survey. Comparisons of the sales-based percentages within the top food categories that carry sodium content claims for two different time periods are displayed in Table 2-4.
In 1997, the food category with the highest number of brands carrying a sodium content claim was carbonated soft drinks and water—specifically 47.3 percent of brands in this category (Brecher et al., 2000). The percentage of two beverage categories carrying sodium content claims was considerably higher in 2000–2001, with 83.7 percent of the category titled “beverages, water” and 62 percent of the category titled “beverages, carbonated soft drinks” (LeGault et al., 2004). The data in Table 2-4 also suggest that although sodium nutrient content claims were used for diet and health benefit foods in 1997 (24.6 percent of brands in this category), this
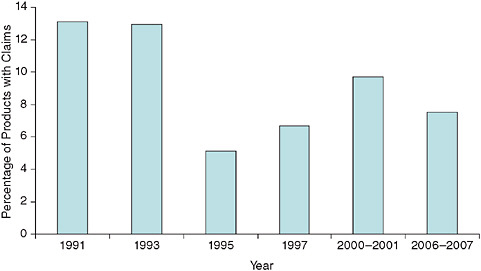
FIGURE 2-7 Processed, packaged foods with sodium content claims.
SOURCE: Personal communication, M. Brandt, FDA, December 17, 2008.
category appears to have dropped out of the top categories using sodium content claims in the 2000–2001 survey. Thus, most of the sodium content claims in 2000–2001 appear to have been used primarily for foods that are likely to be naturally low in sodium (e.g., beverages, sugar substitutes) rather than for products reformulated to reduce their sodium content (e.g., diet and health benefit foods). One possible exception is the apparent availability of unsalted nuts and seeds carrying sodium content claims in 2000–2001.
TABLE 2-4 Sales-Based Percentages of Brands with Sodium Content Claims
|
Percentage, 1997 |
|
Percentage, 2000–2001 |
|
|
Carbonated soft drinks and water |
47.3 |
Beverages, water |
83.7 |
|
Fluid milk |
26.7 |
Beverages, carbonated soft drinks |
62.0 |
|
Diet and health benefit foods |
24.6 |
Sugars and sugar substitutes |
44.9 |
|
Baby foods |
15.0 |
Nuts and seeds |
34.8 |
|
Soft drink and beverage mixes |
11.1 |
Beverages, juices/drinks, refrigerated |
32.8 |
|
SOURCES: Reprinted from Journal of the American Dietetic Association 100(9), Brecher et al., Status of nutrition labeling, health claims, and nutrient content claims for processed foods: 1997 Food Label and Package Survey, pp. 1057–1062, Copyright © 2000, with permission from Elsevier; Reprinted from Journal of the American Dietetic Association 104(6), LeGault et al., 2000–2001 Food Label and Package Survey: An update on prevalence of nutrition labeling and claims on processed, packaged foods, pp. 952–958, Copyright © 2004, with permission from Elsevier. |
|||
It is worthwhile to briefly consider the topic of food advertising, which is regulated by the Federal Trade Commission. Advertising of nutrient and health claims, unlike food product labeling, can be used freely by manufacturers and retailers provided the message is truthful and not misleading. Advertising of the healthfulness of food products was in use before implementation of the NLEA in 1990 and continued afterward. There is a common perception that manufacturers prefer to use claims for “positive nutrients” (e.g., vitamins and minerals that one should eat more, or products that are useful in weight control and loss) rather than “negative nutrients” (e.g., sodium and saturated fat that one should eat less). The data in Figures 2-8 and 2-9 are from a study on the types of claims made in food advertisements found in magazines from 1977–1997. These data show that the use of “negative” nutrient content claims was generally greater than the use of “positive” nutrient claims (Ippolito and Pappalardo, 2002) in magazine advertisements.
In general, the use of specific nutrient content claims seems to trend upward and then decline. There also appears to be some trade-off among nutrients in the timing of claims—as the peaks of use for different nutrients occur during different years. Specifically, these data (Ippolito and Pappalardo, 2002) show that the use of sodium claims on processed and packaged foods peaked at 13.3 percent in 1991 and subsequently fell to 6 percent in 1997. Sodium content claims were never as commonly used as fat and cholesterol claims, but they were used more often than saturated fat claims in magazine advertising.
This same study also tracked the use of health claims (referred to as
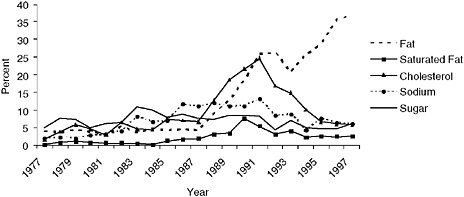
FIGURE 2-8 Percentage of magazine advertisements with “negative” nutrient content claims, 1977–1997.
SOURCE: Ippolito and Pappalardo, 2002.
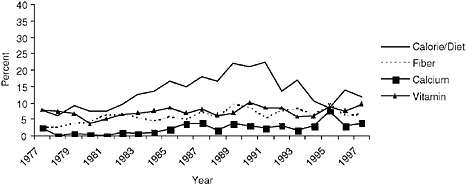
FIGURE 2-9 Percentage of magazine advertisements with “positive” nutrient content claims, 1977–1997.
SOURCE: Ippolito and Pappalardo, 2002.
“disease claims”) in advertising. The use of heart disease claims peaked in 1989 at 2.9 percent of ads, cancer peaked in 1997 at 2.2 percent, blood pressure peaked in 1995 at 1.2 percent, and osteoporosis peaked in 1997 at 0.5 percent. Thus, nutrient content claims are far more commonly used in magazine ads than are claims linking food products to reduction of disease risk, and sodium-related and/or hypertension claims are less commonly used in advertising than are claims for other nutrients and/or other diseases.
Availability of Lower-Sodium Food Products
The question arises as to whether the marketing of foods specifically labeled to indicate their usefulness in lower-sodium diets has increased over the past 40 years. In this regard, the number of lower-sodium foods (foods labeled as no-, low-, or reduced-sodium) introduced between 1989 and 2004 is shown in Figure 2-10.
The number of such foods introduced into the marketplace has declined significantly since 1990, with approximately half as many new products introduced in 2004 as in 1990 (CSPI, 2005b). In 2007, a survey of packaged food products reported that 209 low-sodium or low-salt products were introduced, although this was an increase from 102 such products in 2002 (Packaged Facts, 2008).
As a percentage of all new food introductions into the marketplace, foods labeled as “no salt,” “low salt,” “no sodium,” or “low sodium” fluctuated between 2.5 and 3.5 percent of all new food products (excluding beverages) from 2000–2006, peaked in 2007 at 4.3 percent, and declined
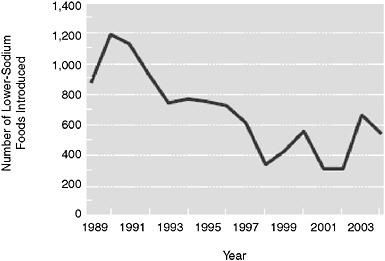
FIGURE 2-10 Number of lower-sodium (no-, low-, or reduced-sodium) foods introduced each year (as indicated by the y-axis), 1989–2004.
SOURCE: CSPI, 2005b. “Salt: The forgotten killer.” Reprinted with permission.
to 4.1 percent in 2008 and further to 3.8 percent in 2009.14 Although the percentage of new food introductions making sodium claims has changed little over the past decade, manufacturers report that they have decreased the sodium in their products without advertising the changes. This may be because some consumers tend to associate low- and reduced-sodium foods with poor taste (Heidolph, 2008; IFIC, 2009), as stated by participants at the committee’s public information-gathering workshop (March 30, 2009). The interest in using sodium content claims compared to other types when introducing new food products that bear nutrient content claims is shown in Figure 2-11. The data in Figure 2-11 (Weimer, 1999) show that new product introductions use sodium-related claims less frequently than fat and calorie claims. Also, consistent with the discussion above on the general use of nutrient content claims, salt and other nutrient claims on newly introduced products generally follow a pattern of increasing, peaking, and decreasing trends in use.
Overall, the introduction of new products specifically labeled as low or reduced in sodium has been limited and has decreased over time. Given the interwoven nature of manufacturer motivations and consumer demand, there appears to be consistency in the relative rank order that consumers place on sodium concerns and their declining interest in sodium, as dis-
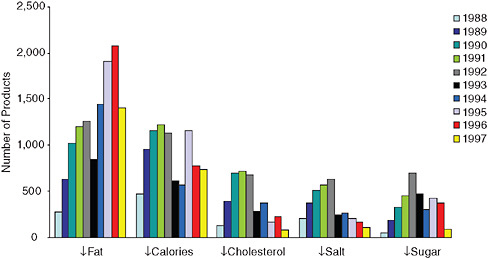
FIGURE 2-11 Number of new food products bearing nutrient content claims, 1988–1997.
NOTE: The ↓ indicates “reduced” or “low” for fat, calories, salt, and sugar, and “low” or “no” for cholesterol.
SOURCE: Weimer, 1999.
cussed previously in this chapter, and the low and declining introduction of new products labeled by manufacturers as reduced or low in sodium.
Sodium Intake
There are three approaches for assessing intake of a nutrient such as sodium: (1) population means based on the disappearance of the nutrient of interest into the U.S. food supply, (2) intake by individuals calculated from intake records or interviews, and (3) the measurement of a biomarker of exposure. Each approach has strengths and weaknesses. While any single approach alone is associated with considerable uncertainty, consistencies across methodologies in time trend patterns and assessments relative to public health goals provide greater confidence in the conclusions reached. This section provides an overview of sodium intake in a time trend context for the purpose of describing the outcomes of the public health initiatives. Current estimates of sodium intake developed for this study are described in more detail in Chapter 5.
Salt Disappearance Data
The advantage of monitoring intake from disappearance data is that it allows for a reasonably accurate estimate of time trend patterns because
of common methods of collecting data and accounting for use over time. The disadvantage of using disappearance data to estimate nutrient intake is that it overestimates intake because it fails to capture food losses and wastage after the nutrient enters the food system (e.g., cooking and processing losses).
Salt disappearance data can be used to estimate time trend patterns in the availability of sodium for human consumption. The Salt Institute posts information on its website about food-grade salt sales in the United States.15 These data are most useful if the tonnage of salt is converted to milligrams of sodium. With changing population numbers over time, it is also useful to convert annual results to per capita values. The annual per capita sodium disappearance numbers from 1978 through 2008 derived from data on salt disappearance are illustrated in Figure 2-12.
The salt disappearance data show a steady increase in per capita availability between 1983 and 1998. More recently, values appear to be leveling off or decreasing slightly. The peak levels in 1998 indicate that approximately 5,700 mg of sodium were available per person per day. The extent to which the disappearance values are an overestimation of actual intake is unknown but the fact that they are more than double the Dietary Guidelines for Americans level of < 2,300 mg/d sodium suggests that salt availability is in excess of public health goals for sodium. Moreover, given that the major advantage of disappearance data is the trend pattern that they reveal, the disappearance data in Figure 2-12 do not show a sustained reduction in response to the sodium-related public health initiatives identified in Tables 2-1 to 2-3. Although the pattern of use over time suggests that early educational and program initiatives carried out in the 1980s were associated with a reduction in salt use, subsequent programs—including the implementation in 1993 of mandatory declaration of sodium content on all food labels and multiple calls since 1969 for food processors to reduce the sodium content of foods—appear to have had little or no impact on salt availability for human use.
Intake by Individuals
Since 1971, NHANES has provided estimates of individuals’ nutrient intakes from a nationally representative sample of the U.S. population. These estimates are based on 24-hour recalls. As shown in Figure 2-13, the trends in sodium intake between the 1971–1974 and 2005–2006 surveys are shown for three life stage groups. Similar patterns were seen across other life stage groups (Briefel and Johnson, 2004; see Chapter 5).
|
15 |
Available online: http://www.saltinstitute.org/Production-industry/Facts-figures/U.S.-production-sales (accessed November 16, 2009). |
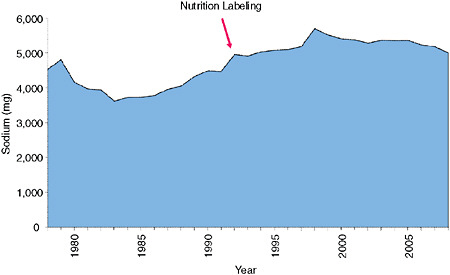
FIGURE 2-12 Annual per capita sodium disappearance based on salt disappearance, 1978–2008.
NOTES: Sodium (milligrams) shown on y-axis was determined by the following calculation: Salt disappearance data (tons of food-grade salt per year) was converted to grams of salt per day. That number was then divided by census-based per capita population estimates used by USDA’s Economic Research Service in developing nutrient availability databases, 1978–2008, and grams of salt consumed per day was converted to milligrams sodium by multiplying by 39.3 percent.
SOURCE: Based on Salt Institute salt disappearance data (tons of food-grade salt per year) and USDA census data.
The results in Figure 2-13 suggest that intake increased between 1971–1974 and 1988–1994 and then plateaued between 1988–1994 and 2005–2006. Whether the early increases are real or due to methodological artifacts is uncertain. There were improvements in interview methodologies during that time that were associated with more complete reporting of intake (Loria et al., 2001). However, even with the caveat that intake by individuals tends to be underestimated and caution as to possible methodological sources of underestimation in the early surveys, the mean intakes, except for adult women in the first two survey periods, are all in excess of Dietary Guidelines for Americans recommendations.
One way of crudely evaluating whether or not underreporting biases have influenced time trends in estimates of sodium intake is to evaluate whether the differences in sodium intake over time and among subgroups are negated or minimized when the results are expressed as sodium densities. Using the same database as in Figure 2-13, Figure 2-14 provides data on the sodium densities for the same surveys.
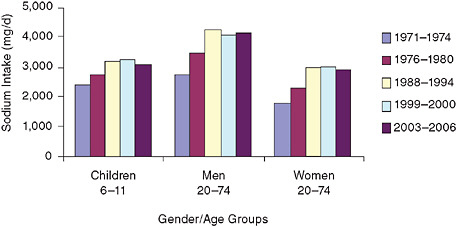
FIGURE 2-13 Trends in mean sodium intake from food for three gender/age groups, 1971–1974 to 2003–2006.
NOTES: Analyzed using 1-day mean intake data for NHANES 2003–2006 to be consistent with earlier analyses and age-adjusted to the 2000 Census; includes salt used in cooking and food preparation, but not salt added at the table. d = day; mg = milligram.
SOURCES: Briefel and Johnson (2004) for 1971–2000 data; NHANES for 2003–2006 data (see Chapter 5).
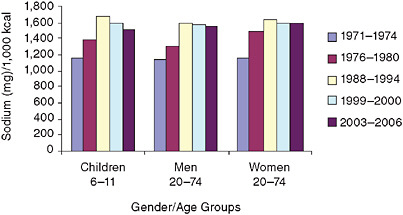
FIGURE 2-14 Trends in mean sodium intake densities from food for three gender/age groups, 1971–1974 to 2003–2006.
NOTES: Analyzed using 1-day mean intake data for NHANES 2003–2006 to be consistent with earlier analyses and age-adjusted to the 2000 Census; includes salt used in cooking and food preparation, but not salt added at the table; 1-day mean intake calculated using the population proportion method. kcal = calorie; mg = milligram.
SOURCES: Briefel and Johnson (2004), for 1971–2000 data; NHANES for 2003–2006 (see Chapter 5).
As shown in Figure 2-14, the differences in sodium intake that were observed among children and adult men and women disappear to a large degree when the intakes are expressed as sodium densities. This suggests that the intake differences among life stage groups at any time were related primarily to differences in their energy intake rather than to differences in the sodium densities of the foods they consumed. The increasing sodium densities between the 1970s and late 1980s also show that foods as consumed contained higher amounts of sodium between those time periods. However, since the early 1990s sodium densities appear to be stable. Although data are not available to allow the separation of the relative contribution of increasing energy intake over time (or improved measures of energy intake over time) from the relative contribution of increasing amounts of sodium in foods over time, these data suggest that at least some of the increases in sodium intake over time may be due to increases in the amount of sodium in foods. Changes in intake over time must be cautiously interpreted because of limitations in these data, particularly older data based on different methodologies. However, compared to a sodium intake density of < 1,150 mg/1,000 calories per day to be consistent with a Dietary Guidelines for Americans daily intake of < 2,300 mg sodium and assuming a 2,000-calorie reference diet, most groups had intakes that exceeded guideline levels, even during the earlier periods when sodium densities appeared lower than in more recent years.
Urinary Excretion of Sodium
As described in Chapter 5, mean urinary sodium excretion collected over a 24-hour period is generally considered to be the gold standard for accurately estimating the sodium intake of individuals. However, in the absence of such data from nationally representative surveys in the United States, the best source of data on urinary sodium excretion of Americans is carefully designed and monitored research studies. Results for U.S. adults participating in two observational studies and four clinical trials between 1980 and the late 1990s indicate that the median urinary sodium excretion per 24 hours across all studies was approximately 3,700 mg/d for men and 3,000 mg/d for women (Loria et al., 2001). Based on the average sodium excretion across all studies, all but one group had sodium excretions of more than 2,300 mg. Eleven of 12 groups of men had average sodium excretion levels greater than 3,000 mg/d, with 4 of these groups having a mean excretion greater than 4,000 mg/d. For women, 6 of 12 groups had sodium excretions between 2,500 and 3,000 mg/d; 6 of the 12 groups had sodium excretions between 3,000 and 3,612 mg/d. Thus, the sodium excretion of U.S. adults participating in research studies showed that almost all of the groups had mean sodium excretion levels well in excess of the
Dietary Guidelines for Americans recommendation of < 2,300 mg/d of sodium.
Prevalence of Hypertension
A solid body of diverse evidence has documented that, on average, as sodium intake rises, so does blood pressure. Furthermore, trials in children, non-hypertensive adults, and hypertensive adults have documented that sodium reduction lowers blood pressure. Although elevated blood pressure and hypertension are also related to other risk factors, reducing daily sodium intake is associated with significant reductions in population-based blood pressure values and prevalence of stroke mortality (DGAC, 2005).
What have been the time trends in prevalence of hypertension among U.S. adults over the past several decades? National trends in the prevalence of hypertension of men and women 20 years of age and older from three different time periods are shown in Figure 2-15.
Hypertension was defined as an elevated blood pressure (systolic pressure ≥ 140 mm Hg or diastolic pressure ≥ 90 mm Hg) and/or use of antihypertensive medications at the time of the individual’s examination in
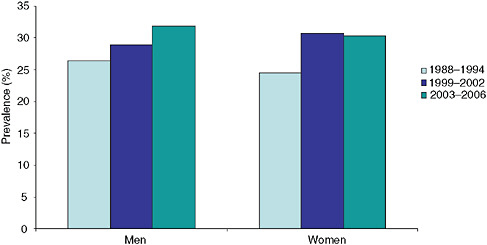
FIGURE 2-15 Trends in elevated blood pressure/hypertension from NHANES for persons ≥ 20 years of age.
NOTES: Hypertension, as defined by the data source, is an elevated blood pressure (systolic pressure ≥ 140 mm Hg or diastolic pressure ≥ 90 mm Hg) and/or use of anti-hypertensive medications; data age-adjusted to 2000 population.
SOURCE: NCHS, 2009.
the NHANES Medical Examination Center (NCHS, 2009). Results were age-adjusted to the 2000 population.
The results show an increase from 1988–1994 to 2003–2006 for both men and women (NCHS, 2009). Similar trends were seen across race/ethnicity groups and different income levels. Using age-standardized data from NHANES 1988–1994 and 1999–2004, Cutler et al. (2008) reported a relative increase of 18 percent in hypertension prevalence rates (from 24.4 to 28.9 percent). None of the age/gender or race/ethnicity groups in their analyses had declining prevalence rates. After adjusting for changes in body mass index (BMI) over the two surveys, there continued to be large relative increases in the prevalence of hypertension for women. These results indicate that some of the increases of hypertension in women were attributable to factors other than increases in BMI. These factors may have included increases in sodium intake, changes in alcohol and potassium intake, decreases in physical activity, suboptimal health literacy levels, and lack of access to health-care services. For men, increases in BMI accounted for most of the increased prevalence of hypertension between surveys. Thus, after controlling for BMI, prevalences of hypertension between 1988–1994 and 1999–2004 remained relatively stable for men and increased for women.
In summary, the prevalence of hypertension in the U.S. population appears to be increasing. Controlling for the possible confounding effects of increasing body weight over the same time suggests that the prevalence is stable for men but increasing for women, even after controlling for obesity. However, neither the stable prevalence pattern seen for men nor the increasing pattern seen for women is consistent with a declining pattern of hypertension prevalence that would be expected to be associated with significant reductions in sodium intake on a population-wide basis.
FINDINGS
From the descriptions in this chapter, it is clear that a myriad of sodium reduction strategies, programs, and initiatives have been implemented by numerous government agencies, health professional organizations, and the food industry—starting in 1969 and continuing to the present. These programs had common themes and a consistent message on the relationship between sodium intake and hypertension, with special emphasis on consumer education, sodium labeling of food products at point of purchase, and encouragement of reformulation by food processors and more recently by restaurant/foodservice operators. Audiences for these programs and initiatives included consumers, health professionals, the media, and the food industry.
To assess whether relevant population- and industry-based changes occurred during the 40 years since the first strategies, programs, and ini-
tiatives were begun, trends have been evaluated in several relevant areas: consumer awareness, knowledge, and behavior; the food industry; sodium intake; and the prevalence of hypertension. To assess changes over time, available data from the National Nutrition Monitoring System and, in a few cases, the scientific or trade literature were used. Despite the fact that the publicly available data were somewhat spotty and incomplete in all of the areas examined, the totality of available evidence reveals a consistency of findings across those areas.
From the available data, it is clear that past initiatives and recommendations have not been successful in achieving the ultimate goal of reducing sodium intake and sodium-related health concerns. Initially, consumer messages most strongly encouraged higher-risk groups (e.g., African Americans and older adults) to reduce sodium intake, and use of salt at the table and during cooking was emphasized. As evidence became stronger that sodium should be a concern throughout the lifespan and as new data emerged on major sources of intake, messages were adjusted to include the entire population, and to encourage consumers to consume processed and restaurant/foodservice foods that were lower in sodium. The results from the three different types of exposure estimates (salt disappearance, dietary recall, and urinary excretion) all consistently show that, despite the broad-based and long-term efforts, neither the salt disappearance nor the sodium intake data show a sustainable trend in declining sodium intake over the 40 years of carrying out the past and existing initiatives. Today, sodium intake by Americans is well in excess of the Dietary Guidelines for Americans recommendation of < 2,300 mg/d sodium. Similarly, significant declines in the prevalence of high blood pressure and stroke mortality have not been seen in the United States.
While the ultimate goal of sodium reduction initiatives has not been met, intermediate goals have seen some success. Public education campaigns in the early 1980s created a dramatic rise (from 12 percent to 48 percent) in consumer awareness of the relationship between sodium and hypertension. Many consumers also believed that sodium reduction was an issue of personal importance, with 62 percent of main meal preparers saying they were personally concerned about sodium. Over a third of the population has been found to always or often use sodium information on the Nutrition Facts panel. Past initiatives also saw some success in motivating the food industry to reduce sodium in some of its products, and make sodium content claims to indicate lower sodium options to consumers. Given these changes, the question becomes, what has kept the population from achieving actual reductions in intake.
As will be discussed elsewhere in this report, notably in Chapter 6, consumers live in a broad food environment in which social, organizational, and macro-level factors influence the types of foods consumed and, thus,
sodium intake. The broad food environment can be linked to the reasons for the lack of effectiveness of 40 years of sodium reduction initiatives. The food supply itself is a key obstacle for consumers. The sodium densities of available foods—both in the marketplace and from restaurant/foodservice operations—make it difficult for consumers to meet dietary recommendations. Further, sustainability of consumer interest and concern is an obvious problem. This becomes intertwined with food producer interest in developing lower-sodium products and in using sodium-related claims and advertising. As a result of these developments, there is a manifest role for increased use of foods naturally low in sodium (e.g., fruits, vegetables) as well as linkages to other public health initiatives because of increasing portion size. Importantly, the number of food channels outside the home and the pervasiveness of salt use throughout the food supply—with average sodium intake density well in excess of that recommended by the Dietary Guidelines for Americans—make it very difficult for consumers and meal planners to achieve recommended sodium intake.
Overall, the outreach and educational efforts to date have failed to reduce the sodium intake of the American public; unfortunately, a lack of available data regarding the implementation and evaluation of these efforts prevents the drawing of firm conclusions about why they did not succeed. Currently, sodium intake remains well in excess of the goals in the Dietary Guidelines for Americans. It is now apparent that outreach and educational programs to consumers and food producers, although a necessary component of any strategy, are insufficient by themselves to achieve the public health goal of reducing sodium intake by Americans to < 2,300 mg/d. A new focus on changing the food supply to better enable consumers to reduce sodium intake may result in better outcomes in the future. While not completely analogous to sodium reduction, experiences with folic acid suggest a role for food supply changes in achieving public health goals. Years of educational efforts failed to make a significant impact on the intake of folic acid by the at-risk population (women of childbearing age). However, once folic acid fortification was instituted, folic acid intake increased without behavior changes (Johnston and Staples, 1995; Pfeiffer et al., 2007). At the same time, consumers have a role to play: the impact of any food supply approach can be enhanced by informed consumer choices. Therefore, efforts to ensure this role is supported may benefit from activities that are now more fully researched, better designed, and effectively implemented than past efforts.
REFERENCES
Alderman, M. H. 2010. Reducing dietary sodium: The case for caution. Journal of the American Medical Association 303(5):448-449.
Brecher, S. J., M. M. Bender, V. L. Wilkening, N. M. McCabe, and E. M. Anderson. 2000. Status of nutrition labeling, health claims, and nutrient content claims for processed foods: 1997 Food Label and Package Survey. Journal of the American Dietetic Association 100(9):1057-1062.
Briefel, R. R., and C. L. Johnson. 2004. Secular trends in dietary intake in the United States. Annual Review of Nutrition 24:401-431.
Burton, S., E. Howlett, and A. H. Tangari. 2009. Food for thought: How will the nutrition labeling of quick service restaurant menu items influence consumers’ product evaluations, purchase intentions, and choices? Journal of Retailing 85(3):258-273.
Cohen, H. W., S. M. Hailpern, J. Fang, and M. H. Alderman. 2006. Sodium intake and mortality in the NHANES II follow-up study. The American Journal of Medicine 119(3): 275.e7-275.e14.
Crepinsek, M. K., A. R. Gordon, P. M. McKinney, E. M. Condon, and A. Wilson. 2009. Meals offered and served in U.S. public schools: Do they meet nutrient standards? Journal of the American Dietetic Association 109(2):S31-S43.
CSPI (Center for Science in the Public Interest). 2005a. Petition to revoke the GRAS status of salt, to set ceilings on the amount of sodium in processed foods, to require a health warning on packaged salt, and to reduce the Daily Value for sodium. http://www.cspinet.org/salt/fda_salt_petition.pdf (accessed September 19, 2009).
CSPI. 2005b. Salt: The forgotten killer. Washington, DC: Center for Science in the Public Interest.
Cutler, J. A., P. D. Sorlie, M. Wolz, T. Thom, L. E. Fields, and E. J. Roccella. 2008. Trends in hypertension prevalence, awareness, treatment, and control rates in United States adults between 1988–1994 and 1999–2004. Hypertension 52(5):818-827.
Cypel, Y. S., J. A. Tamaki, C. W. Enns, A. B. Nowverl, L. E. Cleveland, and K. S. Tippett. 1996. Nutrition attitudes and dietary status of main meal planners/preparers, 1989–1991. Results from the 1989–1998 Diet and Health Knowledge Survey and the 1989–1991 Continuing Survey of Food Intakes by Individuals. Nationwide Food Survey Report No. 91-1. USDA Agricultural Research Service.
Derby, B. M., and S. B. Fein. 1995. Meeting the NLEA education challenge: A consumer research perspective. In Nutrition Labeling Handbook, edited by R. Shapiro. New York: M. Dekker. Pp. 315-353.
DGAC (Dietary Guidelines Advisory Committee). 2005. Report of the Dietary Guidelines Advisory Committee on the Dietary Guidelines for Americans, 2005. A Report to the Secretary of Health and Human Services and the Secretary of Agriculture. Washington, DC: U.S. Department of Agriculture and U.S. Department of Health and Human Services.
Engstrom, A., R. C. Tobelmann, and A. M. Albertson. 1997. Sodium intake trends and food choices. American Journal of Clinical Nutrition 65(2, Supplement):704S-707S.
FDA (Food and Drug Administration). 2007. FDA 2002 Health and Diet Survey topline frequency report. College Park, MD: Food and Drug Administration Center for Food Safety and Applied Nutrition.
FDA/ODPHP (Office of Disease Prevention and Health Promotion). 2008. Health and Diet Survey: Dietary Guidelines supplement—Report of findings (2004 & 2005). Washington, DC: U.S. Department of Health and Human Services.
Food Marketing Institute. 2004. Trends in the United States: Consumer attitudes & the Supermarket, 2004. Washington, DC: Food Marketing Institute.
Havas, S., B. D. Dickinson, and M. Wilson. 2007. The urgent need to reduce sodium consumption. Journal of the American Medical Association 298(12):1439-1441.
Heidolph, B. B. 2008. Is sodium reduction the next target in the “better-for-you” formulation trend? Cereal Foods World 53(1):21-27.
Heimbach, J. T. 1985. Cardiovascular disease and diet: The public view. Public Health Reports 100(1):5-12.
HHS (U.S. Department of Health and Human Services)/FDA. 1973. Food label information panel. Federal Register 38(13):2126.
HHS/FDA. 1982. GRAS safety review of sodium chloride; policy notice; solicitation of views. Federal Register 47(118):26590-26595.
HHS/FDA. 2007. Salt and sodium; petition to revise the regulatory status of salt and etablish food labeling requirements regarding salt and sodium; public hearing; request for comments. Federal Register 72(204):59973-59979.
IFIC (International Food Information Council). 2006. Food biotechnology: A summary of U.S. consumer attitudinal trends. Washington, DC: International Food Information Council.
IFIC. 2007. Food biotechnology: A summary of U.S. consumer attitudinal trends. Washington, DC: International Food Information Council.
IFIC. 2008. Food biotechnology: A summary of U.S. consumer trends. Washington, DC: International Food Information Council.
IFIC. 2009. 2009 Food and Health Survey: Consumer attitudes toward food, nutrition & health. Washington, DC: International Food Information Council.
Ippolito, P. M., and J. K. Pappalardo. 2002. Advertising nutrition & health: Evidence from food advertising 1977–1997. Washington, DC: Federal Trade Commission Bureau of Economics Staff Report.
Johnston Jr., R. B., and D. A. Staples. 1995. Knowledge and use of folic acid by women of childbearing age—United States, 1995. Journal of the American Medical Association 274(15):1190.
LeGault, L., M. B. Brandt, N. McCabe, C. Adler, A. M. Brown, and S. Brecher. 2004. 2000–2001 Food Label and Package Survey: An update on prevalence of nutrition labeling and claims on processed, packaged foods. Journal of the American Dietetic Association 104(6):952-958.
Lichtenstein, A. H., L. J. Appel, M. Brands, M. Carnethon, S. Daniels, H. A. Franch, B. Franklin, P. Kris-Etherton, W. S. Harris, B. Howard, N. Karanja, M. Lefevre, L. Rudel, F. Sacks, L. Van Horn, M. Winston, and J. Wylie-Rosett. 2006. Diet and lifestyle recommendations revision 2006: A scientific statement from the American Heart Association nutrition committee. Circulation 114(1):82-96.
Lin, B.-H., J. Guthrie, and E. Frazão. 1999. Nutrient contribution of food away from home. In America’s eating habits: Changes and consequences, edited by E. Frazão. Agriculture Information Bulletin No. 750. Washington, DC: U.S. Department of Agriculture, Economic Research Service, Food and Rural Economics Division. Pp. 213-242.
Loria, C. M., E. Obarzanek, and N. D. Ernst. 2001. Choose and prepare foods with less salt: Dietary advice for all Americans. Journal of Nutrition 131(2, Supplement 1):536S-551S.
Mattes, R. D., and D. Donnelly. 1991. Relative contributions of dietary sodium sources. Journal of the American College of Nutrition 10(4):383-393.
McCarron, D. A. 2000. The dietary guideline for sodium: Should we shake it up? Yes! American Journal of Clinical Nutrition 71(5):1013-1019.
McCarron, D. A. 2008. Dietary sodium and cardiovascular and renal disease risk factors: Dark horse or phantom entry? Nephrology Dialysis Transplantation 23(7):2133-2137.
McCarron, D. A., J. C. Geerling, A. Kazaks, and J. S. Stern. 2009. Can dietary sodium intake be modified by public policy? Clinical Journal of the American Society of Nephrology 4(1):1878-1882.
Moshfegh, A. 2009. Surveillance and monitoring sodium intakes. Presented at the Institute of Medicine Committee on Strategies to Reduce Sodium Intake’s Public Information-Gathering Workshop, March 30, Washington, DC.
NCHS (National Center for Health Statistics). 2009. Health, United States, 2008 with special feature on the health of young adults. HHS Publication No. 2009-1232. Hyattsville, MD: National Center for Health Statistics.
NHLBI (National Heart, Lung, and Blood Institute). 1996. Implementing recommendations for dietary salt reduction: Where are we? Where are we going? How do we get there?: Summary of an NHLBI workshop. NIH Publication No. 55-728N. Bethesda, MD: National Institutes of Health.
Nielsen, S. J., and B. M. Popkin. 2003. Patterns and trends in food portion sizes, 1977–1998. Journal of the American Medical Association 289(4):450-453.
Packaged Facts. 2008. Market trend: Low, reduced and no sodium or salt foods and beverages in the U.S. Rockville, MD: Packaged Facts.
Pfeiffer, C. M., C. L. Johnson, R. B. Jain, E. A. Yetley, M. F. Picciano, J. I. Rader, K. D. Fisher, J. Mulinare, and J. D. Osterloh. 2007. Trends in blood folate and vitamin B-12 concentrations in the United States, 1988–2004. American Journal of Clinical Nutrition 86(3):718-727.
SCOGS (Select Committee on GRAS Substances). 1979. Evaluation of the health aspects of sodium chloride and potassium chloride as food ingredients. Bethesda, MD: Federation of American Societies for Experimental Biology, Life Sciences Research Office.
Smiciklas-Wright, H., D. C. Mitchell, S. J. Mickle, J. D. Goldman, and A. Cook. 2003. Foods commonly eaten in the United States, 1989–1991 and 1994–1996: Are portion sizes changing? Journal of the American Dietetic Association 103(1):41-47.
Teisl, M. F., A. S. Levy, and B. M. Derby. 1999. The effects of education and information source on consumer awareness of diet-disease relationships. Journal of Public Policy and Marketing 18(2):197-207.
Tippett, K. S., and L. E. Cleveland. 2001. Results from USDA’s 1994–1996 Diet Health and Knowledge Survey. Nationwide Food Survey Report No. 96-4. Beltsville, MD: USDA Agricultural Research Service.
Todd, J. E., and J. N. Variyam. 2008. Decline in consumer use of food nutrition labels, 1995–2006. Economic Research Report No. 63. Washington, DC: Economic Research Service.
USDA (U.S. Department of Agriculture). 1995. Improving USDA commodities: Tri-agency commodity specification review report. Washington, DC: U.S. Department of Agriculture
USDA/FNS (Food and Nutrition Service). 2007. Special Supplemental Nutrition Program for Women, Infants and Children (WIC): Revisions in the WIC food packages; interim rule. Federal Register 72(234):68966-69032.
Variyam, J. N. 2008. Do nutrition labels improve dietary outcomes? Health Economics 17(6):695-708.
Weimer, J. 1999. Accelerating the trend toward healthy eating. Public and private efforts. In America’s eating habits: Changes and consequences, edited by E. Frazão. Agricultural Information Bulletin No. 750. Washington, DC: U.S. Department of Agriculture, Food and Rural Economics Division, Economic Research Service. Pp. 385-401.


