
Summary
Activities to reduce sodium intake of the U.S. population have been ongoing for more than 40 years, but they have not succeeded. In retrospect, these activities were insufficient in the face of the nature of the public health problem they were meant to address. Without an overall reduction of the level of sodium in the food supply—that is, the level of sodium to which consumers are exposed on a daily basis from processed and restaurant foods—the current focus on instructing consumers to select lower-sodium foods and making available reduced-sodium “niche” products cannot result in intakes consistent with the Dietary Guidelines for Americans. Further, food industry (defined as both the processing and restaurant/foodservice sectors) efforts to voluntarily reduce the sodium content of the food supply face obstacles, are not consistently undertaken by all, are not readily sustained, and have proven unsuccessful in lowering overall sodium intake. These are significant failures given that excess sodium intake is strongly associated with elevated blood pressure, a serious public health concern related to increased risk of heart disease, stroke, congestive heart failure, and renal disease.
THE CHALLENGES
Americans average a daily intake of more than 3,400 mg of sodium (equivalent to 8.5 g, or about 1.5 teaspoons, salt). This substantially exceeds the existing maximum intake level (2,300 mg/d sodium or 5.8 g/d salt [about 1 teaspoon salt]) established by the 2005 Dietary Guidelines for Americans. Data show that dietary sources of sodium are plentiful, are
derived largely from processed and restaurant foods, and include many foods not commonly perceived as sources of sodium. Data also dispel the misconception that excess salt intake is due to salt added by the consumer at the table. Such use appears to account for only about 5 percent of sodium consumed. Evidence suggests that reductions in sodium intake may be achieved by reducing salt in food and allowing people to use a salt shaker. A study has shown that on average, participants added back less than 20 percent of the sodium removed from the food when allowed unlimited use of salt shakers.
A key factor in the limited success of efforts to reduce sodium intake is that salt—sodium chloride, the primary source of sodium in the diet—has desirable characteristics from a culinary perspective. Added salt improves the sensory properties of foods that humans consume and is inexpensive. Americans rely heavily on processed foods and menu items prepared outside the home, making such foods the predominant source of sodium intake in the United States. Clearly, efforts to reduce the sodium content of the food supply are needed to improve public health. However, food industry representatives indicate that they cannot sell or serve products that are less palatable than those of their higher-sodium competitors; food flavor is the major determinant of food choice and usually overrides other factors that influence food selection. What is lacking is a way to coordinate reduction of salt in foods across the board by all manufacturers and restaurant/foodservice operations—a level playing field. The key question is: How can a level playing field be achieved while avoiding consumer dissatisfaction?
Importantly, the preference for added salt in food is mutable. Sensory preferences for salt can be decreased. This preference, which is beyond known physiological need, may be due in part to evolutionary pressures to consume salt that have shaped an innate liking for its taste and due in part to learning, particularly early learning. Indeed, a high-salt diet may actually increase the liking of salty foods, and the U.S. food supply, with its high salt content, may work against consumers successfully changing their flavor preferences and impede their acceptance of lower-sodium foods. Existing experiences with decreasing the sensory preference for salt suggest it could be successfully accomplished through a stepwise process that systematically and gradually lowers salt levels across the food supply.
Thus, if strategies to reduce sodium intake in the United States are to be successful, they must embrace an approach that emphasizes the entire food system and emphasizes sodium intake as a national concern. This report recommends the use of regulatory tools in an innovative and unprecedented fashion to gradually reduce a widespread ingredient in foods through a well-researched, coordinated, deliberative, and monitored process. The current level of sodium added to the food supply—by food manufacturers, foodservice operators, and restaurants—is simply too high to be “safe” for
consumers given the chronic disease risks associated with sodium intake for all population segments. To succeed, however, the approach must be supported by a strong federal government commitment to sodium reduction and leadership from the Department of Health and Human Services (HHS) in cooperation with other agencies and groups to ensure coordination with all stakeholders including the food industry and consumers. The goal is to carefully achieve over time, and without loss of consumers’ acceptance of foods, the “safe” levels of sodium in the diet that are consistent with public health recommendations. Implementation will be challenging and will require both resources and a sustained, high-level commitment to making these important changes a reality. The effort must include more effective ways of reaching consumers about the importance of sodium intake reduction and approaches for selecting healthful diets.
APPROACHING THE TASK
This report focuses on strategies to reduce the sodium intake of the U.S. population. In Fall 2008, a 14-member committee was convened at the request of Congress and supported by several agencies within the HHS. The committee’s work was predicated on the importance of reducing sodium intake and the agreement that achieving lower intakes is a critical public health focus for all Americans. No segment of the population is immune from the adverse health effects, despite the common misunderstanding that sodium intake is a concern only for the “salt sensitive” and the elderly. Consistent with its charge, the committee relied upon consensus conclusions from numerous authoritative bodies as support for the health benefits related to population-based sodium reductions.
The committee was asked to make recommendations about various means that could be employed to reduce dietary sodium intake to levels recommended by the Dietary Guidelines for Americans—currently, less than 2,300 mg/d (see Box 1-1, Statement of Task). The recommended strategies were to include actions by food manufacturers, government approaches such as regulations and legislation, and public and professional outreach and education. Figure S-1 illustrates the committee’s approach to its task.
The committee began its study by evaluating the outcomes of past and current efforts to reduce sodium intake. It explored knowledge about sensory preferences for salt and its role in modulating overall food flavor, key factors in strategies to reduce sodium intake. Preservation and physical property roles of sodium in food were reviewed. Background information was obtained on food manufacturing and restaurant/foodservice operations and on factors important to understanding consumer food choices and behaviors. Given that regulatory options were to be considered, the
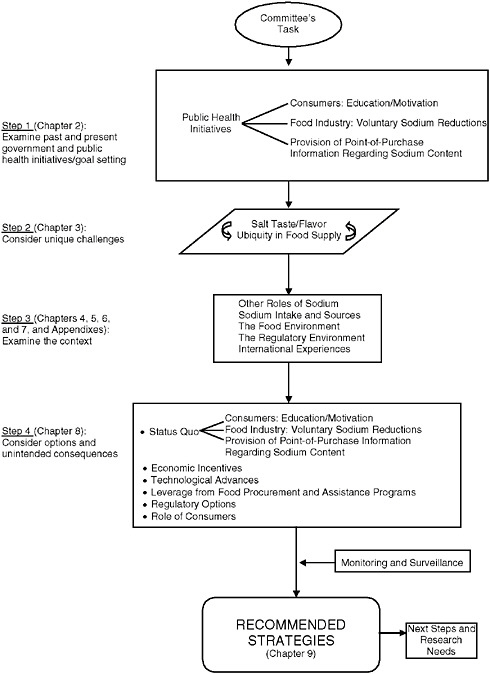
committee also characterized the current regulatory framework. Further, the committee reviewed the possibility of leveraging activities through food specifications set by large government food purchasers, explored economic incentives such as a salt tax, and noted sodium reduction activities in other countries. It also considered the potential of innovative technologies for salt substitutes and enhancers as well as culinary advances.
Finally, the committee integrated the information into a series of discussions that led to conclusions about the strategies to be recommended, implementation tasks, and information gaps.
CONTEXT FOR THE RECOMMENDATIONS
This study was conducted against the backdrop of the unavoidable conclusion that existing strategies have not succeeded in achieving meaningful reduction of sodium intake. Efforts targeted at reducing sodium intake were initiated during the 1969 White House Conference on Food, Nutrition, and Health and have involved a range of organizations and a variety of activities. Overall, estimates of sodium intake have not decreased. In fact, as shown in Figure S-2, estimates reveal an upward trend from the early 1970s. Although some of the differences in intake estimates over time may
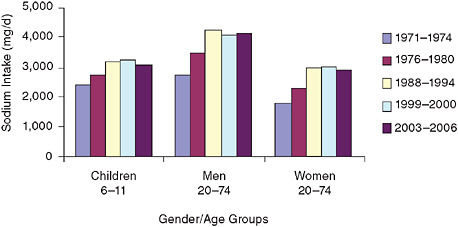
FIGURE S-2 Trends in mean sodium intake from food for three gender/age groups, 1971–1974 to 2003–2006.
NOTES: Analyzed using one-day mean intake data for the National Health and Nutrition Examination Survey (NHANES) 2003–2006 to be consistent with earlier analyses and age-adjusted to the 2000 Census; includes salt used in cooking and food preparation, but not salt added to food at the table. d = day; mg = milligram.
SOURCE: Briefel and Johnson (2004) for 1971–2000 data; NHANES for 2003– 2006 data.
be due to differences in survey methodologies, increase in estimated intake has occurred. In any case, mean intakes over this 40-year period, except for women in the first two survey periods, are in excess of the upper intake limit specified by the 2005 Dietary Guidelines for Americans.
As expected, dietary sodium intake density measures—meaning the number of milligrams sodium per 1,000 calories consumed—show that the intake differences expressed as milligrams disappear among children and adults on a sodium density basis, indicating the relationship between calorie intake and sodium intake (Figure S-3). As compared to a sodium intake density of < 1,150 mg/d per 1,000 calories needed to match the recommended intake of < 2,300 mg/d sodium (and assuming a 2,000-calorie reference diet), most groups had mean intakes that exceeded guideline levels, even during the earlier time periods when sodium densities appeared lower than in more recent years.
Moreover, trends in hypertension demonstrate an upward climb since the 1980s (Figure S-4). Although increased obesity rates may be associated with the increase among men, they do not explain all of the increase among women.
Past initiatives placed considerable, if not the primary, burden on the consumer to act to reduce sodium intake. These included educational and
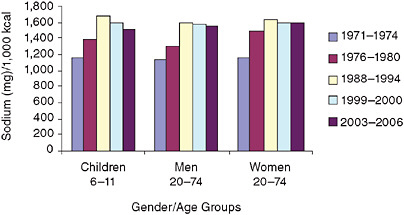
FIGURE S-3 Trends in mean sodium intake densities from food for three gender/age groups, 1971–1974 to 2003–2006.
NOTES: Analyzed using one-day mean intake data for the National Health and Nutrition Examination Survey (NHANES) 2003–2006 to be consistent with earlier analyses and age-adjusted to the 2000 Census; includes salt used in cooking and food preparation, but not salt added to food at the table; one-day mean intakes calculated using the population proportion method. kcal = calorie; mg = milligram.
SOURCE: Briefel and Johnson (2004) for 1971–2000 data; NHANES for 2003–2006.
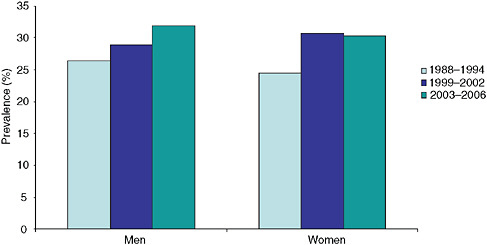
FIGURE S-4 Trends in elevated blood pressure/hypertension from the National Health and Nutrition Examination Survey (NHANES) for persons ≥ 20 years of age.
NOTES: Hypertension, as defined by the data source, is an elevated blood pressure (systolic pressure ≥ 140 mm Hg or diastolic pressure ≥ 90 mm Hg) and/or use of anti-hypertensive medications; data age-adjusted to 2000 population.
SOURCE: NCHS, 2009.
awareness campaigns, efforts to motivate consumers, and requests to the food industry to support these activities by marketing lower-sodium alternative products and voluntarily lowering the sodium content of its products. Overall, these approaches have not resulted in reduced sodium intake. As Figure S-2 shows, sodium consumption remains high. One reason is that the nature of the sensory preference for salt has likely resulted in lower-sodium products tasting less acceptable than “regular” products to many consumers. Also, the message about sodium appears to have been lost in an array of competing messages about fat, sugar, and cholesterol. A national survey conducted by the Food and Drug Administration (FDA) suggests that between 1982 and 1990—a time of intense educational programs on reduction of sodium intake and the only period with available data—the maximum percentage of Americans who reported attempting to reduce their sodium intake never reached more than about 30 percent. Voluntary reductions in the sodium content of the food supply have had limited success. Reports suggest that during the past 20 years some food companies have accomplished a 10–20 percent reduction in sodium for some products, with a few reportedly achieving reductions closer to 40–50 percent. While this is encouraging, the committee found the general picture to reveal little
success for the industry as a whole. During the committee’s public workshop held in open session, industry panel members described their efforts and reported varying levels of success, and identified the need for a level playing field within the industry. The panel highlighted the difficulty in marketing lower-salt foods when competitors’ products that are not lower in salt are preferred by consumers. This situation is mirrored by available data indicating that relatively few foods bear sodium-related label claims and, over time, fewer newly introduced products bear sodium-related claims, compared to fat and calorie claims. Anecdotal reports suggest that to some consumers, such sodium claims signal that the food will not have a pleasing taste, and therefore they do not buy the product. Further, salt substitutes have limited applications.
Restaurant/foodservice operations—which contribute a significant amount of sodium to the American diet—have undertaken few organized efforts to reduce the sodium content of menu items. The reasons are believed to include the diverse nature of the operations coupled with little motivation to modify menu items to retain their appeal while reducing the salt content.
RECOMMENDATIONS
The committee organized strategies for reducing sodium intake by first identifying broad recommendations. The recommendations resulted in one set of primary strategies and several sets of interim or supporting strategies. These are listed in Box S-1.
Primary Strategies
Recommendation 1 encompasses the primary strategies and is linked to the fact that salt, as a substance added to foods marketed by the food industry, is regulated by FDA. Under the Federal Food, Drug, and Cosmetic Act, substances added to foods by manufacturers are subject to FDA pre-market approval unless they are generally recognized as safe (GRAS). The conditions under which a substance is GRAS can be specified by FDA to ensure safe use. Currently, the manufacturers’ addition of salt to foods is considered a GRAS use, but no standards have been set concerning the levels that would constitute a “safe use” of salt.
The committee concluded that the ability to adjust the GRAS status of salt by setting standards for its addition to foods is a potentially powerful yet relatively adaptable regulatory tool. The potential of GRAS modification seemed particularly promising given the failure of the non-regulatory options to accomplish meaningful reductions in the sodium content of the
food supply. In short, the primary strategies are linked to the following conclusions:
-
Excess salt intake is a major public health problem.
-
More than 40 years of voluntary initiatives have failed to reduce salt intake.
-
Most salt consumed is in foods sold to consumers.
-
Standards for the addition of salt to processed and restaurant/food-service foods are the best strategy to protect the public health.
The goal is clearly not to ban salt use or to make foods unpleasant for consumers, but to begin the process of reducing the excessive addition of salt to processed foods and restaurant/foodservice menu items. If used judiciously and with careful preliminary analysis, setting standards for the levels of salt in food should reduce sodium intake. If the process of implementing such regulatory provisions is carried out over time in a stepwise manner, negative impacts on the consumer’s enjoyment of food and response to food flavors should be minimized.
The starting point for use of the available regulatory tools is the conclusion first voiced in 1979 that salt—given the levels at which it is currently added to the food supply—is no longer a substance for which there is a reasonable certainty of no harm. However, rather than revoke the status of salt as a GRAS food substance, the committee recommends activities to modify the conditions under which salt added to foods can remain GRAS and by which total levels of sodium in the food supply can be reduced. That is, taking into account current dietary recommendations for its consumption, salt is a substance for which a safe use level in foods could be established. This approach is preferable to revoking the GRAS status of all uses of salt. First, salt is GRAS at some levels of consumption. Second, revoking GRAS status would cause disturbances in the food supply that could undermine consumers’ support for regulatory actions to protect their health while increasing the regulatory burden on both FDA and the food industry to likely unacceptable levels. Further, revoking GRAS status is not consistent with the fact that sodium is an essential nutrient.
The committee regards modification of the GRAS status of salt as underpinning a new set of strategies that could effectively reduce sodium intake. It would address the concern that much of the sodium in the diet comes from sources largely outside consumers’ direct control. There is evidence that “passive” changes in the environment can impact consumers’ health and well-being more effectively than placing the entire burden on consumers to act to modify their environment and behavior in the face of many competing priorities and challenges.
Given the ability of the existing regulatory provisions to set standards
|
BOX S-1 Recommended Strategies Primary Strategies RECOMMENDATION 1 The Food and Drug Administration (FDA) should expeditiously initiate a process to set mandatory national standards for the sodium content of foods. (1.1) FDA should modify the generally recognized as safe (GRAS) status of salt added to processed foods in order to reduce the salt content of the food supply in a stepwise manner. (1.2) FDA should likewise extend its stepwise application of the GRAS modification, adjusted as necessary, to encompass salt added to menu items offered by restaurant/foodservice operations that are sufficiently standardized so as to allow practical implementation. (1.3) FDA should revisit the GRAS status of other sodium-containing compounds as well as any food additive provisions for such compounds and make adjustments as appropriate, consistent with changes for salt in processed foods and restaurant/foodservice menu items. Interim Strategies RECOMMENDATION 2 The food industry should voluntarily act to reduce the sodium content of foods in advance of the implementation of mandatory standards. (2.1) Food manufacturers and restaurant/foodservice operators should voluntarily accelerate and broaden efforts to reduce sodium in processed foods and menu items, respectively. (2.2) The food industry, government, professional organizations, and public health partners should work together to promote voluntary collaborations to reduce sodium in foods. Supporting Strategies RECOMMENDATION 3 Government agencies, public health and consumer organizations, and the food industry should carry out activities to support the reduction of sodium levels in the food supply. (3.1) FDA and the U.S. Department of Agriculture (USDA) should revise and update—specifically for sodium—the provisions for nutrition labeling, related sodium claims, and disclosure or disqualifying criteria for sodium in foods, including a revision to base the Daily Value for sodium on the Adequate Intake. (3.2) FDA should extend provisions for sodium content and health claims to restaurant/foodservice menu items and adjust the provisions as needed for use within each sector. |
|
(3.3) Congress should act to remove the exemption of nutrition labeling for food products intended solely for use in restaurant/foodservice operations. (3.4) Food retailers, governments, businesses, institutions, and other large-scale organizations that purchase or distribute food should establish sodium specifications for the foods they purchase and the food operations they oversee. (3.5) Restaurant/foodservice leaders in collaboration with other key stakeholders, including federal, state, and local health authorities, should develop, pilot, and implement innovative initiatives targeted to restaurant/foodservice operations to facilitate and sustain sodium reduction in menu items. RECOMMENDATION 4 In tandem with recommendations to reduce the sodium content of the food supply, government agencies, public health and consumer organizations, health professionals, the health insurance industry, the food industry, and public-private partnerships should conduct augmenting activities to support consumers in reducing sodium intake. (4.1) The Secretary of Health and Human Services (HHS) should act in cooperation with other government and non-government groups to design and implement a comprehensive, nationwide campaign to reduce sodium intake and act to set a time line for achieving the sodium intake goals established by the Dietary Guidelines for Americans. (4.2) Government agencies, public health and consumer organizations, health professionals, the food industry, and public-private partnerships should continue or expand efforts to support consumers in making behavior changes to reduce sodium intake in a manner consistent with the Dietary Guidelines for Americans. RECOMMENDATION 5 Federal agencies should ensure and enhance monitoring and surveillance relative to sodium intake measurement, salt taste preference, and sodium content of foods, and should ensure sustained and timely release of data in user-friendly formats. Ensuring Monitoring (5.1) Congress, HHS/CDC (Centers for Disease Control and Prevention), and USDA authorities should ensure adequate funding for the National Health and Nutrition Examination Survey (NHANES), including related and supporting databases or surveys. Expanding and Enhancing Monitoring (5.2) CDC should collect 24-hour urine samples during NHANES or as a separate nationally representative “sentinel site”-type activity. (5.3) CDC should, as a component of NHANES or another appropriate nationally representative survey, begin work immediately with the National |
|
Institutes of Health (NIH) to develop an appropriate assessment tool for salt taste preference, obtain baseline measurements, and track salt taste preference over time. (5.4) CDC in cooperation with other relevant HHS agencies, USDA, and the Federal Trade Commission should strengthen and expand its activities to measure population knowledge, attitudes, and behavior about sodium among consumers. (5.5) FDA should modify and expand its existing Total Diet Study and its Food Label and Package Survey to ensure better coverage of information about sodium content in the diet and sodium-related information on packaged and prepared foods. (5.6) USDA should enhance the quality and comprehensiveness of sodium content information in its tables of food composition. (5.7) USDA in cooperation with HHS should develop approaches utilizing current and new methodologies and databases to monitor the sodium content of the total food supply. |
for the conditions of use of a substance added to foods in a manner that is responsive to a number of considerations, FDA could be charged with developing mandatory standards appropriate to the conditions within the food market and the reality of current (and future) technologies. Such standard setting could also stimulate the development of new technologies and flavor alternatives.
It is important that a decrease in the sodium content of foods be carried out gradually, with small reductions instituted regularly as part of a carefully monitored process that allows appropriate adjustments based on real-time data and outcomes. As salt levels in the overall food supply decrease there is likely to be a concomitant decrease in the population’s sensory preference for salt, facilitating a further reduction in sodium intake.
Modifying the GRAS status of salt will be a complicated and challenging process for FDA. It will require considerable information gathering, detailed input from stakeholders, in-depth analysis of the food supply, use of simulation modeling of the effect of different levels of sodium content on total intake, examination of consumer eating behaviors, adjustments for food safety concerns, and studies of economic impact and potential unintended consequences. This will require resources and time, and it
should be based on a step-down process with built-in feedback loops and routine monitoring to ensure that the efforts are working as planned and that the next step in the process is appropriate. It will also require FDA to liaison with USDA, which would have to undertake activities to implement the standards for the food products it oversees. On balance, the impact on reducing consumers’ intake of sodium, its ability to provide a level playing field that has eluded the food industry when only voluntary activities are available, and its long-term sustainability are compelling arguments for recommending the modification of GRAS status of salt.
The significant contribution to sodium intake made by restaurant/foodservice menu items warrants Strategy 1.2, which extends GRAS standards to this sector of the food supply. The strategy is based on application of the Federal Food, Drug, and Cosmetic Act to foods whose components have moved in interstate commerce, thus making the food item subject to the standards relevant to processed foods. Such standards are only practicable with large, multiunit chain restaurant/foodservice operations. However, it is also likely that through the process of working with the large operations, ways will become clear for working with smaller operations over time. Given the extremely unfamiliar and inherently disruptive nature of reaching into independent restaurant settings, sodium reduction efforts can only be accomplished slowly as part of an informed experience.
Interim and Supporting Strategies
Interim strategies are reflected by Recommendation 2. While the primary strategies should be initiated immediately, as a practical matter enacting regulations requires time. In the interim, voluntary strategies could achieve meaningful reductions of sodium intake prior to implementation of mandatory standards for levels of salt added to foods by manufacturers and restaurant/foodservice operators. While identifying these strategies as important interim steps, the committee underscores that experience indicates that voluntary standards will not be sufficient to provide adequate breadth and sustainability of reductions and do not guarantee the level playing field that is important to realizing meaningful sodium reduction in the food supply.
Supporting strategies are not merely suggestions for rounding out sodium reduction activities, but play an essential role in accomplishing the goals. They require the integration of multiple government and stakeholder activities with HHS playing a leadership role. Supporting strategies are directed to a range of stakeholders. Major interests include national coordination of a comprehensive approach, involvement of the food industry, and innovative approaches to reaching consumers.
While a major interest of the recommended strategies is ensuring that
the consumer does not bear an unreasonable burden in reducing sodium intake, the consumer nonetheless is a key player. Activities targeted to reducing the overall sodium content of the food supply are paramount, but they are not expected to be sufficient. Consumers must take personal actions to reduce sodium intake within the context of the recommended changes to the food supply. Past initiatives to assist consumers in reducing sodium intake may have included activities that were not well researched, designed, or effective in reaching consumers. These limitations must now be explored and overcome. Relevant activities requiring exploration include sustainable diet-related behavioral changes through selection of lower-sodium foods, portion control, and other healthful food choices by (1) increasing consumer understanding of the importance of elevated blood pressure as a public health problem and the value to health of reducing sodium beginning at the earliest ages and continuing throughout the lifespan; (2) increasing consumer understanding of the ubiquitous nature of sodium in the food supply and the importance of supporting government and industry activities to reduce sodium in foods; (3) changing consumer attitudes toward and perception of lower-sodium foods; and (4) facilitating consumer understanding of the role of sodium reduction as part of an overall healthful diet. The development of appropriate messages needs new and focused attention and will require innovative consumer research, including possibilities for integrating reduction of sodium intake into existing, broad messages about diet and health.
Additionally, there is a critical need to ensure the continuation of monitoring and surveillance relevant to sodium intake as well as to initiate efforts to immediately establish baseline data. Existing activities should be expanded to include the use of better methods, such as urinary sodium measures, and the inclusion of new measures, such as salt sensory preferences of consumers. The committee also considered the potential for unintended consequences associated with population-wide reduction of sodium intake. Negative impacts on iodine status or food safety, the two most common concerns for sodium reduction efforts, were not regarded as likely, although monitoring would be warranted. Funding will be needed for preliminary data-gathering and research, implementation, and monitoring. Specific funding levels cannot be quantified at this time, but the availability of resources is essential to the success of the strategies.
IMPLEMENTATION OF RECOMMENDATIONS AND INFORMATION GAPS
The committee outlined a number of implementation approaches, but recognized that the level of detail needed to convert the overall strategies into effective action is beyond its scope and requires information not cur-
rently available or as yet not researched. Implementers therefore will have to explore these approaches and related options as they become apparent, but should begin with information gathering and modeling of effects and outcomes.
-
The committee concluded that modification to the GRAS status of salt in food could be accomplished best if FDA (1) specifies as GRAS the uses and use levels of salt that allow persons to consume such foods as part of a normal diet with a reasonable likelihood of keeping their total daily intake of sodium consistent with the Dietary Guidelines for Americans; (2) implements disclosure or labeling statements as part of a stepwise process for GRAS modification, provided research demonstrates that the labeling is effective; (3) provides for exemptions as appropriate; and (4) considers petition options. Estimation of costs and specific funding recommendations were outside the committee’s charge, but these tasks and associated coordination and preliminary research will require considerable resources and a renewed national focus on sodium.
Other implementation factors address practices to reduce sodium content of processed foods and menu items and the factors important to a national campaign targeted to consumers. Both areas are seen as appropriate for targeted public-private partnerships.
Finally, this study revealed urgent and diverse research needs. These are grouped into four areas: (1) understanding salt taste reception and taste development throughout the lifespan; (2) developing innovative methods to reduce sodium in foods while maintaining palatability, physical properties, and safety; (3) enhancing current understanding of factors that impact consumer awareness and behavior relative to sodium reduction; and (4) monitoring sodium intake and salt taste preference.
CLOSING REMARKS
The recommended strategies deliberately set a new course for efforts to reduce sodium intake. This will require not only careful implementation and resolution of many technical and non-technical issues, but also a renewed commitment to reducing sodium intake. These large but important tasks will be most readily accomplished if they are undertaken in the spirit of collaboration and cooperation. The ultimate goal is improvement of America’s health.


