
2
Public Health Importance of Hypertension
Hypertension is an important public health challenge in the United States and other countries due to its high prevalence and strong association with cardiovascular disease and premature death (Cutler et al., 2008; Fields et al., 2004; Gu et al., 2002; Kearney et al., 2005; Lawes et al., 2008). Approximately 73 million U.S. adults (35 million men and 38 million women) had hypertension in 2006 (Lloyd-Jones et al., 2009). The estimated total number of adults with hypertension in the world in 2000 was 972 million: 333 million in economically developed countries and 639 million in economically developing countries (Kearney et al., 2005).
Hypertension is not only the most common, but also one of the most important, modifiable risk factors for coronary heart disease, stroke, congestive heart failure, chronic kidney disease, and peripheral vascular disease (Collins et al., 1990; Gu et al., 2008; Hebert et al., 1993; Kannel, 1996; Klag et al., 1996; Lewington et al., 2002; MacMahon et al., 1990; Staessen et al., 2001; Stamler et al., 1993; Whelton, 1994). The positive relationship between blood pressure and the risk of vascular disease is strong, continuous, graded, consistent, independent, predictive, and etiologically significant for those with and without a previous history of cardiovascular disease (He et al., 2003). Systolic blood pressure is a more important risk factor for cardiovascular disease than diastolic blood pressure (Gu et al., 2008; Klag et al., 1996; Stamler et al., 1993). Hypertension has also been identified as one of the leading preventable risk factors for all-cause mortality and is ranked third as a cause of disability-adjusted life-years (Ezzati et al., 2002; Lawes et al., 2008). Furthermore, randomized controlled trials have demonstrated that antihypertensive drug treatment reduces vascular disease
incidence and mortality among patients with hypertension (Collins et al., 1990; Ezzati et al., 2002; Hebert et al., 1993; Staessen et al., 2001).
PREVALENCE OF HYPERTENSION IN THE U.S. POPULATION
This section provides a discussion of the burden of hypertension by age, gender, and race or ethnicity and reviews data on levels of awareness, treatment, and control of hypertension. The relationship between behavioral risk factors and hypertension is addressed in Chapter 4, but trends in select risk factors are provided here.
The prevalence of hypertension in the U.S. general population is high and increasing in recent years (Cutler et al., 2008; Fields et al., 2004). The National Health and Nutrition Examination Survey (NHANES) conducted by the National Center for Health Statistics has been the principal means of tracking the burden of hypertension in the U.S. general population. Hypertension prevalence estimates derived from the NHANES are defined as systolic blood pressure ≥140 mm Hg and/or diastolic blood pressure ≥90 mm Hg and/or receiving antihypertensive medication.
The estimated prevalence of hypertension derived from the NHANES 1999-2004 was 28.9 percent of the U.S. adult population (Cutler et al., 2008). The prevalence of hypertension varies by age, gender, and race or ethnicity. The prevalence of hypertension is also affected by behavior such as the intake of dietary sodium and potassium, weight management, alcohol consumption, and physical activity. Overall, the prevalence of hypertension is similar in men and women in the United States. In the NHANES 1999-2004, the age-adjusted prevalence of hypertension for all races was 28.5 percent in men and 28.8 percent in women (Cutler et al., 2008). The relationship between gender and hypertension is modified by age. In young adults, the prevalence of hypertension is higher in men than in women. However, by their fifties, women tend to have blood pressure levels that equal or exceed those of men. The prevalence of hypertension is higher in women than in men later in life. The increase in the prevalence of hypertension by race and sex between the age groups of 18-29 years of age and >70 years of age was from 9.8 to 83.4 percent in black men, from 3.7 to 83.1 percent in black women, from 3.5 to 69.1 percent in Mexican-American men, from 1.5 to 78.8 percent in Mexican-American women, from 5.5 to 63.3 percent in non-Hispanic white men, and from 0.8 to 78.8 in non-Hispanic white women (Table 2-1). Isolated systolic hypertension (defined as systolic blood pressure ≥140 mm Hg and diastolic blood pressure <90 mm Hg) is common in older persons because systolic blood pressure tends to rise until the eighth or ninth decade, whereas diastolic blood pressure tends to remain constant or decline after the fifth decade (Whelton, 1994).
TABLE 2-1 Age-Specific Prevalence (Standard Error) of Hypertension in the U.S. Adult Population: NHANES1999-2004
|
|
Non-Hispanic White |
Non-Hispanic Black |
Mexican American |
|||
|
Age (years) |
Men |
Women |
Men |
Women |
Men |
Women |
|
18-29 |
5.5 (1.1) |
0.8 (0.3) |
9.8 (1.9) |
3.7 (1.0) |
3.5 (1.1) |
1.5 (0.6) |
|
30-39 |
12.5 (1.9) |
5.4 (1.0) |
18.5 (2.5) |
14.5 (2.9) |
10.6 (2.7) |
5.7 (1.8) |
|
40-49 |
23.9 (2.1) |
19.9 (2.1) |
33.6 (2.8) |
45.0 (3.0) |
23.7 (2.4) |
20.5 (3.0) |
|
50-59 |
36.5 (3.0) |
39.8 (2.7) |
57.3 (4.1) |
61.2 (4.3) |
30.4 (4.2) |
38.9 (4.8) |
|
60-69 |
56.0 (2.3) |
58.4 (2.2) |
74.2 (2.8) |
84.1 (2.6) |
53.2 (3.4) |
62.7 (2.6) |
|
≥70 |
63.3 (1.7) |
78.8 (1.5) |
83.4 (3.3) |
83.1 (3.5) |
69.1 (3.5) |
78.8 (3.3) |
|
Total |
27.5 (1.1) |
26.9 (0.7) |
39.1 (1.1) |
40.8 (1.2) |
26.2 (1.2) |
27.5 (1.3) |
|
SOURCE: Adapted from Cutler et al., 2008. |
||||||
The age-adjusted prevalence of hypertension among those surveyed in the NHANES 1999-2004 was highest among non-Hispanic blacks at 40.1 percent, compared to 27.4 percent in non-Hispanic whites and 27.1 percent in Mexican Americans. Non-Hispanic blacks also had the highest prevalence of hypertension among all races or ethnicities for every age group and for both gender groups (Cutler et al., 2008).
Hypertension in Children and Adolescents
The prevalence of high blood pressure among children and adolescents has been examined in the NHANES and other studies (Berenson et al., 2006; Din-Dzietham et al., 2007; Ostchega et al., 2009). Based on guidelines detailed in the Fourth Report on the Diagnosis, Evaluation, and Treatment of High Blood Pressure in Children and Adolescents, high blood pressure is defined as having systolic and/or diastolic blood pressure that ranks as ≥95th percentile for gender, age, and height (National High Blood Pressure Education Program Working Group on High Blood Pressure in Children and Adolescents, 2004). The guidelines recommend multiple blood pressure measurements at different times to define persistent high blood pressure. However, blood pressure was measured at only one clinic visit for the NHANES and thus might overestimate prevalence. Overall, the prevalence of elevated blood pressure during the period 2003 to 2006 was 2.6 percent in boys and 3.4 percent in girls ages 8-17 years in the United States (Ostchega et al., 2009). The gender- and race- or ethnicity-specific prevalence was 2.5 percent and 3.8 percent in non-Hispanic white boys and girls; among non-Hispanic black boys and girls it was 2.8 percent and 3.7 percent respectively, and among Mexican-American boys and girls it was 2.4 percent and 1.7 percent, respectively (Table 2-2).
Secular Trends in the Prevalence of Hypertension
Effective monitoring and surveillance systems need to be in place to monitor progress in reducing the prevalence of hypertension and increasing the awareness, treatment, and control of hypertension. Repeated independent cross-sectional surveys in the same populations over time can provide important information about secular trends in blood pressure. However, attention must be paid to the comparability of survey methods with respect to sampling and blood pressure measurement as well as the definition of hypertension. In the general U.S. population, government surveys (NHES I [National Health Examination Survey]; NHANES I, II, and III; HHANES [Hispanic Health and Nutrition Examination Survey]) may provide the best data to examine secular trends in hypertension; however, there have been significant modifications in the protocol for blood pressure measurement,
TABLE 2-2 Prevalence (Standard Error) of Elevated Blood Pressurea Among Children and Adolescents Ages 8 Through 17 Years: NHANES 2003-2006
sample sizes, and other factors that make these data not completely comparable (Burt et al., 1995).
Between 1960 and the early 1990s, blood pressure data collection changed in significant ways. Changes include the number of measurements taken per occasion (one, two, or three measures before 1988; two sets of three measures after 1988); the number of occasions that blood pressure was measured (one or two occasions); and the posture in which blood pressure was taken (sitting or supine). Current national guidelines recommend three blood pressure measurements on multiple days for a clinical diagnosis of hypertension. One blood pressure measurement taken on a single occasion cannot represent the usual blood pressure level of individuals because of random variation in the measurement over time. The first blood pressure measurement, for example, is typically higher than subsequent measurements. Further, blood pressure can also be subject to the white coat effect1 (Chobanian et al., 2003; Pickering et al., 2005).
Another important change is the size of blood pressure cuffs available to measure blood pressure. In early years (1960-1962), adult blood pressure cuffs were primarily used; over time, blood pressure cuffs suitable for children and different adult size cuffs were added (adult large and thigh cuff). Blood pressure measurements could be biased if the cuff size is too small or too large relative to the patient’s arm circumference (Pickering et al., 2005). There were also differences in maintenance of the blood pressure equipment used (unknown, daily, weekly, monthly calibration protocols). The personnel responsible for taking blood pressures varied (physician, nurse, or interviewer) as did the levels of training received (unknown, 1.5 days or 3 days).
The quality of blood pressure measurements is partially reflected by the digit preference. A high proportion of zero-end digits in blood pressure measures indicated the poor quality of blood pressure measurement. Approximately one-half of blood pressure measures had a zero-end digit in the NHANES 1971-1974 and 1976-1980 compared to approximately one-quarter in the NHANES 1988-1991 (Burt et al., 1995). In addition, the definition of diastolic blood pressure changed from measurement at the fourth Korotkoff sound (muffling of sound and point of disappearance) to the fifth Korotkoff sound (complete cessation of sound, NHANES III). Finally, the definitions used to define hypertension changed from 160/95 mm Hg in earlier studies to 140/90 mm Hg in the NHANES III (Chobanian et al., 2003). This change, in particular, has made it more difficult to determine secular trends. Having noted these methodological issues, the next
section describes the secular trends in hypertension based upon available data.
Based on the NHANES surveys, the prevalence of hypertension in the U.S. adult population generally declined between 1971 and 1991 (Burt et al., 1995). The decline in the prevalence of hypertension was consistent across age, gender, and racial groups. For example, the age-adjusted prevalence of hypertension defined as blood pressure ≥140/90 mm Hg and/or current use of antihypertensive medication decreased from 48.2 percent in blacks (49.0 percent in men and 47.5 percent in women) in 1971-1974 to 30.2 percent in blacks (32.6 percent in men and 28.1 percent in women) in 1988-1991. A similar decrease was seen among whites; hypertension prevalence decreased from 35.0 percent in 1971-1974 (40.1 percent in men and 30.2 percent in women) to 19.2 percent (21.6 percent in men and 16.7 percent in women) in 1988-1991 (Burt et al., 1995). However, the prevalence of hypertension began to increase in the later NHANES surveys. For example, the age-standardized prevalence among U.S. adults ages 18 years and older increased from 24.4 to 28.9 percent (p < 0.001) between the NHANES 1988-1994 and the NHANES 1999-2004, with the largest increases among non-Hispanic women from 21.7 to 26.9 (Cutler et al., 2008). The change in hypertension prevalence seems independent from the obesity epidemic in the U.S. population because the secular trends of hypertension were consistent across body mass index categories (<25.0, 25.0-29.9, and ≥30.0 kg/m2) (Gregg et al., 2005).
Secular Trends Among the Elderly
Ostchega and colleagues reported a significant increase in hypertension prevalence in the U.S. population among those ages 60 years and older from 1988 to 2004. The prevalence of hypertension in the total population increased from 58 percent in the NHANES 1988-1994 to 67 percent in the NHANES 1999-2004 (Ostchega et al., 2007). A significant increase was seen in each age group studied (60-69: from 48 to 60 percent; 70-79: from 62 to 72 percent; and ≥80: from 69 to 77 percent), in both sexes (men: from 54 to 61 percent; women: from 60 to 72 percent). Figure 2-1 shows the increase in hypertension prevalence by age group and gender (Ostchega et al., 2007). Hypertension prevalence also increased in three racial or ethnicity categories (non-Hispanic whites: from 56 to 66 percent; non-Hispanic blacks: from 71 to 82 percent; and Mexican American: 62 to 68 percent).
Secular Trends in Children
Secular trends in mean blood pressure level and hypertension prevalence among children and adolescents ages 8 to 17 years were examined
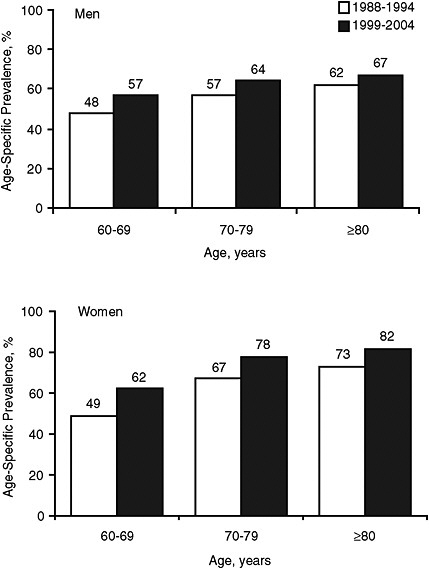
FIGURE 2-1 Age-specific prevalence of hypertension in U.S. adults ages 60 and older for men and women, NHANES 1988-1994 and NHANES 1999-2004.
SOURCE: Adapted from Ostchega et al., 2007.
by various investigators using data from the NHANES (Din-Dzietham et al., 2007; Ostchega et al., 2007, 2009). Muntner and colleagues found that mean systolic blood pressure increased between 1988-1994 and 1999-2000. After controlling for differences in age, race, and sex, they found a 1.4 mm Hg increase in systolic blood pressure and a 3.3 mm Hg increase in
diastolic blood pressure between the two surveys. The greatest differences were increases in mean systolic blood pressure (2.3 mm Hg increase) and mean diastolic blood pressure (4.4 mm Hg increase) of Mexican-American children. The increase in mean systolic and diastolic blood pressure was also higher in children ages 8 to 12 years compared to children ages 13-17 years (Muntner et al., 2004).
A more recent analysis of NHANES data surveys conducted in 1988-1994, 1999-2002, and 2003-2006 also shows an overall increase in elevated blood pressure in children and adolescents ages 8 though 17 years (Ostchega et al., 2009). The percent prevalence of elevated blood pressure
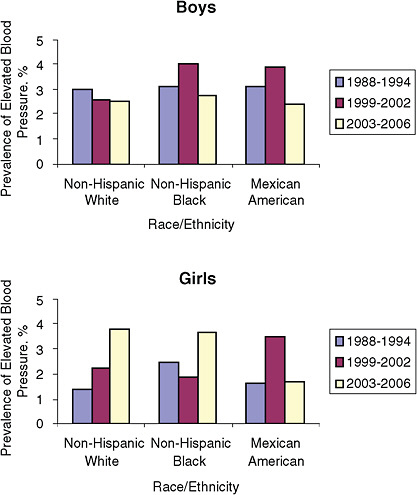
FIGURE 2-2 Prevalence of elevated blood pressure among children and adolescents ages 8 through 17 years: United States, NHANES 1988-1994, 1999-2002, and 2003-2006.
SOURCE: Adapted from Ostchega et al., 2009.
increased from 2.1 percent in 1988-1994 to 3.0 percent in 2003-2006. In the 2003-2006 survey, 2.6 percent of boys and 3.4 percent of girls had elevated blood pressure. Figure 2-2 shows the prevalence of elevated blood pressure by gender and race or ethnicity. After conducting multivariate analyses controlling for weight status, age, and race and ethnicity, the authors concluded that the prevalence of elevated blood pressure increased among girls ages 8-17 but had decreased among boys ages 13-17.
Incidence and Lifetime Risk of Hypertension
Although the prevalence of hypertension is a useful indicator of the burden of disease in the community, it does not provide information regarding the risk for individuals of developing hypertension. The individual risk for developing hypertension is best described by incidence or lifetime cumulative incidence statistics. Limited information is available about the incidence of hypertension because it requires follow-up of a large population for a prolonged period of time (Apostolides et al., 1982; Cornoni-Huntley et al., 1989; Fuchs et al., 2001; Manolio et al., 1994).
Several longitudinal cohort studies have shown that African Americans have a higher incidence of hypertension than whites (Apostolides et al., 1982; Cornoni-Huntley et al., 1989; Fuchs et al., 2001; Manolio et al., 1994). In the Atherosclerosis Risk in Communities Study, the 6-year incidence of hypertension was 13.9 percent and 12.6 percent in white men and women, and 24.9 percent and 30.3 percent in African-American men and women, ages 45-49 years, respectively (Fuchs et al., 2001). The corresponding incidence of hypertension among participants ages 50-64 years was 18.0 percent and 17.0 percent in white men and women, and 28.3 percent and 29.9 percent in African-American men and women, respectively. Other longitudinal cohort studies indicated that the incidence of hypertension in African Americans was an average of two times higher than in whites (Apostolides et al., 1982; Cornoni-Huntley et al., 1989; Manolio et al., 1994).
The lifetime risk for developing hypertension was estimated among 1,298 study participants who were 55 to 65 years of age and free of hypertension at baseline during 1976-1998 (Vasan et al., 2002). For 55-year-old participants, the cumulative risk of developing hypertension was calculated through age 80, while for 65-year-old participants, the risk for developing hypertension was calculated through age 85. These follow-up time intervals (25 years for 55-year-olds and 20 years for 65-year-olds) correspond to the current average number of remaining years of life for white individuals at these two ages in the United States. The lifetime risk for developing hypertension was 90 percent for both 55- and 65-year-old participants
(Figure 2-3). The lifetime probability of receiving antihypertensive medication was 60 percent (Vasan et al., 2002).
INTERNATIONAL COMPARISON
Kearney and colleagues estimated the global burden of hypertension in 2000 by pooling prevalence data from different regions of the world (Kearney et al., 2005). In their estimation, overall, 26.4 percent of the worldwide adult population ages 20 years and older in 2000 had hypertension (26.6 percent of men and 26.1 percent of women). The prevalence of hypertension varied greatly by world regions. For men, the highest estimated prevalence was in Latin America and the Caribbean (40.7 percent), and for women, the highest estimated prevalence was in the former socialist economies (39.1 percent). The lowest estimated prevalence of hypertension for both men (17.0 percent) and women (14.5 percent) was in the region encompassing Asia and the Pacific Islands. In comparison, the prevalence of hypertension in the U.S. adult population was 28.9 percent (NHANES 1999-2004), slightly higher than the estimated world prevalence of 26.4 percent (Cutler et al., 2008).
Hypertension is costly to the global health care system. A recent analysis by Gaziano et al. (2009), estimated that the global direct medical cost of nonoptimal blood pressure (defined as systolic blood pressure above 115 mm Hg and includes prehypertension and hypertension) was US $370 billion for the year 2001. This cost represents about 10 percent of global healthcare expenditures (Gaziano et al., 2009).
AWARENESS, TREATMENT, AND CONTROL OF HYPERTENSION IN THE COMMUNITY
Treatment and control of hypertension in the community requires that elevated blood pressure be recognized and that individuals with hypertension receive adequate treatment. In the United States, there has been remarkable improvement in the awareness, treatment, and control of hypertension since the late 1970s (Burt et al., 1995; Cutler et al., 2008; Hajjar and Kotchen, 2003; Ostchega et al., 2007). The proportion of hypertensive patients who are aware of their condition increased from 51 percent (42 percent in men and 63 percent in women) in the NHANES 1976-1980 to 69 percent (62 percent in men and 75 percent in women) in the NHANES 1988-1994 to 72 percent (69 percent in men and 74 percent in women) in the NHANES 1999-2004 (Burt et al., 1995; Cutler et al., 2008). The increase in awareness of hypertension between 1976-1980 and 1999-2004 was accompanied by an increase in the proportion of individuals with hypertension who receive treatment with antihypertensive medications. Over-
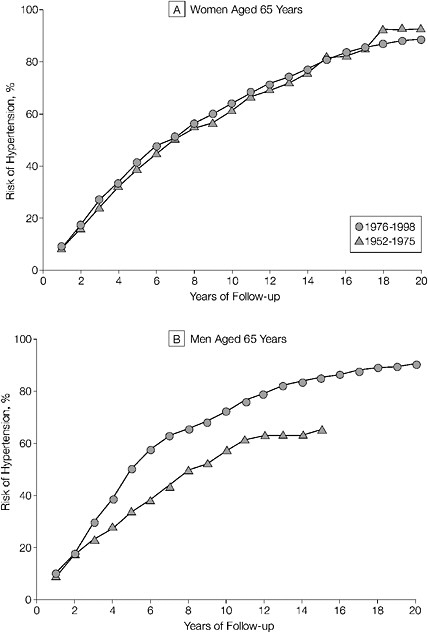
FIGURE 2-3 Residual lifetime risk of hypertension in women and men aged 65 years. Cumulative incidence of hypertension in 65-year-old women and men. Data for 65-year-old men in the 1952-1975 period are truncated at 15 years since there were few participants in this age category who were followed up beyond this time.
SOURCE: Vasan et al., Journal of the American Medical Association, February 27, 2002, 287:1008. Copyright © (2002) American Medical Association. All rights reserved.
all, the percentage of individuals with hypertension who receive treatment increased from 31 percent (21 percent in men and 43 percent in women) in the NHANES 1976-1980 to 53 percent (45 percent in men and 61 percent in women) in the NHANES 1988-1994 to 61 percent (58 percent in men and 65 percent in women) in the NHANES 1999-2004. The proportion of controlled hypertension increased more than threefold at the 140/90 mm Hg cut-point from 10 percent (5 percent in men and 15 percent in women) in the NHANES 1976-1980 to 26 percent (21 percent in men and 31 percent in women) in the NHANES 1988-1994 to 35 percent (36 percent in men and 34 percent in women) in the NHANES 1999-2004 (Burt et al., 1995; Cutler et al., 2008).
The degree of awareness, treatment, and control (blood pressure <140/90 mm Hg) of hypertension varies considerably by gender, race or ethnicity, socioeconomic status, education, and quality of health care (He et al., 2002; Hyman and Pavlik, 2001; Muntner et al., 2004). Differences in gender and race or ethnicity are considered here. Based on the NHANES 1999-2004 data, black women have the highest awareness (81.8 percent) and treatment (71.7 percent) rates, while white men have the highest control (39.3 percent) rate (Table 2-3). On the other hand, Mexican-American men have the lowest awareness (55.9 percent), treatment (40.4 percent), and control (21.4 percent) rates. Awareness and treatment rates were higher for women than men across all racial or ethnic groups. The control rate was higher for women among blacks and Mexican Americans but higher for men among whites (Cutler et al., 2008).
Among individuals with untreated or uncontrolled hypertension, elevated systolic blood pressure with a diastolic pressure of less than 90 mm Hg often remains a problem. Hyman and Pavlik, using the same NHANES data set, conducted an analysis of blood pressure levels in individuals with uncontrolled hypertension (Hyman and Pavlik, 2001). They found that close to 80 percent of individuals with hypertension present but who were unaware had a systolic blood pressure ≥140 mm Hg and a diastolic blood pressure <90 mm Hg.
The actual awareness, treatment, and control rates are likely higher than the NHANES estimates due to the definition of hypertension in the study. In the NHANES, the diagnosis of hypertension was based on blood pressure measurement at a single clinical visit, whereas national guidelines recommend that the classification of hypertension be based on the mean of two or more blood pressure readings taken during two or more office visits (Chobanian et al., 2003). Thus, some of the individuals classified as unaware and untreated hypertensive might not meet the criteria for hypertension in the clinical setting.
Although the proportion of individuals with controlled hypertension has increased substantially, the majority (65 percent) of individuals with
TABLE 2-3 Hypertension Awareness, Treatment, and Control in the U.S. Adult Hypertensive Population: NHANES 1988-1994 and NHANES 1999-2004
|
|
Awareness (%) |
|
Treatment (%) |
|
Control (%) |
|
|
|
1988-1994 |
1999-2004 |
1988-1994 |
1999-2004 |
1988-1994 |
1999-2004 |
|
Total |
68.5 |
71.8 |
53.1 |
61.4 |
26.1 |
35.1 |
|
Men |
61.6 |
69.3 |
44.6 |
57.9 |
20.7 |
36.2 |
|
Women |
74.8 |
73.9 |
61.0 |
64.5 |
31.2 |
34.2 |
|
Non-Hispanic white |
69.1 |
72.0 |
54.2 |
62.1 |
27.3 |
36.8 |
|
Men |
63.0 |
70.4 |
46.2 |
60.0 |
22.0 |
39.3 |
|
Women |
74.7 |
73.4 |
61.6 |
64.0 |
32.2 |
34.5 |
|
Non-Hispanic black |
71.0 |
75.8 |
54.8 |
65.1 |
24.0 |
33.4 |
|
Men |
62.5 |
67.8 |
42.3 |
56.4 |
16.6 |
29.9 |
|
Women |
77.8 |
81.8 |
64.6 |
71.7 |
30.0 |
36.0 |
|
Mexican American |
57.5 |
61.3 |
38.6 |
47.4 |
16.2 |
24.3 |
|
Men |
47.8 |
55.9 |
30.9 |
40.4 |
13.5 |
21.4 |
|
Women |
69.3 |
66.9 |
47.8 |
54.9 |
19.4 |
27.4 |
|
SOURCE: Adapted from Cutler et al., 2008. |
||||||
hypertension are not under control. Wang and Vasan (2005) highlighted factors associated with uncontrolled hypertension in the United States, categorized by patient and physician factors. Patient factors related to uncontrolled hypertension include lack of insurance and provider, increased susceptibility due to advanced age and obesity, therapy nonadherence because of medication cost, complicated regimens, lack of social support, and poor physician-patient communication. Physician factors related to uncontrolled hypertension include lack of knowledge about guidelines, overestimating guideline adherence, concerns about medication side effects, and limited office visit time.
Many barriers to hypertension control in the general population affect African Americans, especially African-American men, disproportionally (Cooper, 2009). Barriers to hypertension include higher pre-treatment blood pressure levels, health care access and medication costs, social barriers related to urban life, personal barriers (i.e., tobacco, drug, and alcohol addiction), physician inertia in initiation and intensification of blood pressure medication, and time constraints during outpatient visits that impair physician-patient communication and patient adherence.
In general, compared to the United States, the rates of awareness, treatment, and control of hypertension were lower in other developed countries (Falaschetti et al., 2009; Joffres et al., 1997). The most recent Canadian Heart Health Surveys 1986-1992 for which data are available reported that 58 percent (53 percent in men and 65 percent in women) of individuals with hypertension were aware of their condition, 39 percent (32 percent in men and 49 percent in women) were treated, and 16 percent (13 percent in men and 20 percent in women) had their blood pressure controlled (Joffres et al., 1997). The Health Survey for England 2006 reported that the awareness, treatment, and control rates of hypertension were 66 percent (62 percent in men and 71 percent in women), 54 percent (47 percent in men and 62 percent in women), and 28 percent (24 percent in men and 32 percent in women), respectively (Falaschetti et al., 2009). The rates of awareness, treatment, and control of hypertension were even lower in developing countries. The China National Nutrition and Health Survey 2002 reported that among individuals with hypertension, only 24 percent were aware of their condition, 19 percent were receiving antihypertensive medications, and less than 5 percent had adequate control of blood pressure (Wu et al., 2008).
HYPERTENSION DATA QUALITY AND MONITORING CONCERNS
Throughout its review, the committee struggled to clearly understand the trends in hypertension over time. As noted earlier, government surveys (NHES I; NHANES I, II, and III; HHANES) that collect blood pressure data and related information (hypertension awareness) have varied signifi-
cantly in their methods over the years. While methodological adjustments to reduce bias in survey data collected over 1971-1991 have allowed survey data to be compared, the degree to which these adjustments allow an accurate assessment of secular hypertension trends remains unclear especially since it is difficult to explain the pronounced reduction in hypertension prevalence over that period.
Therefore, at the request of the committee, the Centers for Disease Control and Prevention (CDC) provided unpublished data of secular trends in mean and median systolic and diastolic blood pressure and hypertension prevalence among children (8-17 years) and adults (20 years and above) based on the first blood pressure measurement taken from the National Health and Nutrition Examination Surveys from 1971 onward (NHANES I, 1971-1975; NHANES II, 1976-1980; NHANES III, 1988-1994; NHANES 1999-2002; NHANES 2003-2006). The data were provided in this way to minimize the problem of inconsistent number of blood pressure measurements taken over the survey periods and to facilitate comparison of the data over time (Table 2-4). The reader should note that even with this adjustment, data are insufficient to assess whether blood pressure levels and hypertension prevalence truly fell between 1971 and 1988, because other significant quality control problems with the 1971 survey are not accounted for in this analysis.
A comparison was made of the first blood pressure reading in the NHANES participants over time. The age-, sex-, and race-adjusted prevalence of hypertension in the U.S. adult population ages 20 years and older decreased from 41.1 percent in 1971-1975 to 28.6 in 2003-2006. The mean blood pressure also decreased from the early 1970s (systolic 131.5 and 138.6 mm Hg, and diastolic 82.5 and 87.4 mm Hg in whites and blacks, respectively) to the late of 1980s (systolic 121.7 and 127.5 mm Hg, and diastolic 73.0 and 75.5 mm Hg in whites and blacks, respectively) (Figure 2-4). This is partially due to differences in the definition of diastolic blood pressure (Korotkoff phase 4 or 5 in the NHANES 1971-1975 and Korotkoff phase 5 only in the NHANES 1988-1994) (Din-Dzietham et al., 2007). Subsequently, mean systolic blood pressure increased slightly and diastolic blood pressure decreased slightly during the 1990s and 2000s. These changes in mean blood pressure could reflect both changes in risk factors of blood pressure and treatment of hypertension.
A comparison of the first blood pressure measurement among children and adolescents ages 8-17 years from the NHANES over the same survey periods also found a significant decrease in hypertension. Hypertension prevalence dropped from 17.3 in 1971-1975 to 5.1 in 2003-2006.
Comparisons of the age- and sex-adjusted mean blood pressures during 1971-2006 (Figure 2-5) in children are also informative. The age- and sex-adjusted systolic blood pressure decreased from 110.1 mm Hg in
TABLE 2-4 Median and Mean Systolic and Diastolic Blood Pressure and Prevalence of Hypertension for Adults and Children Based on First Blood Pressure Measurement—NHANES Data
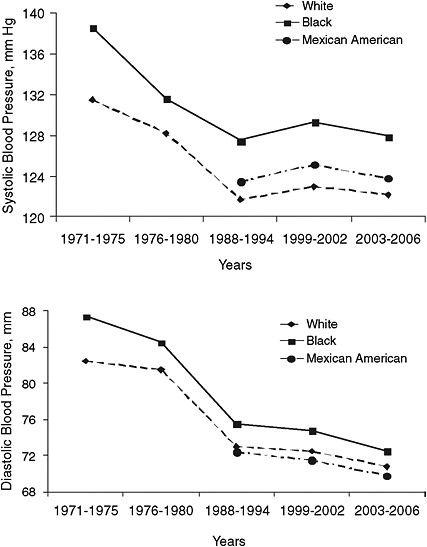
FIGURE 2-4 Age- and sex-adjusted mean systolic blood pressure (upper panel) and diastolic blood pressure (lower panel) by race or ethnicity in adults ages 20 years or older: United States, NHANES 1971-1975, 1976-1980, 1988-1994, 1999-2002, and 2003-2006.
SOURCE: CDC unpublished data.
whites and 108.9 in blacks in the NHANES 1971-1975 to 105.1 mm Hg in whites and 106.2 in blacks in the NHANES 1988-1994. Mean diastolic blood pressure decreased even more dramatically, from 68.1 mm Hg in whites and 68.1 in blacks to 57.8 mm Hg in whites and 57.3 in blacks.
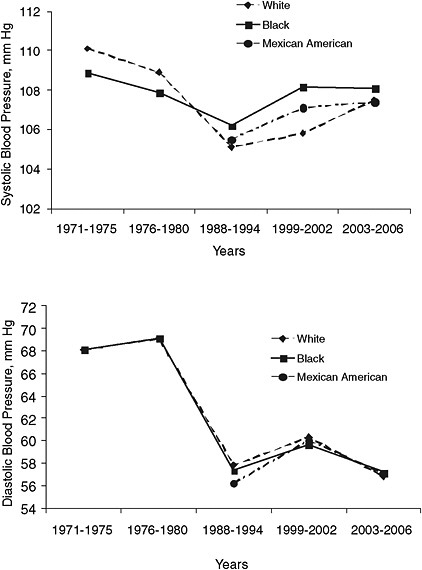
FIGURE 2-5 Age- and sex-adjusted mean systolic blood pressure and diastolic blood pressure by race or ethnicity in children ages 8-17 years: United States, NHANES 1971-1975, 1976-1980, 1988-1994, 1999-2002, and 2003-2006.
SOURCE: CDC unpublished data.
During the late 1980s and the early 2000s, mean systolic blood pressure increased slightly: from 105.1, 106.2, and 105.5 mm Hg in the NHANES 1988-1994 to 107.5, 108.1, and 107.4 mm Hg in the NHANES 2003-2006 for whites, blacks, and Mexican Americans, respectively.
TRENDS IN ASSOCIATED RISK FACTORS
Overweight and obesity, high sodium intake, physical inactivity, heavy alcohol intake, low potassium intake, and a Western-style diet make up the major modifiable risk factors for hypertension (Chobanian et al., 2003; Forman et al., 2009). The literature supporting the associations between these risk factors and hypertension is well established (Chobanian et al., 2003; He et al., 2002). Thus, it is not the intent of this section to synthesize that literature but rather to comment on the direction of risk factor trends.
Risk factor data for overweight, obesity, sodium intake, and hypertension prevalence available from the National Center for Health Statistics (NCHS) Health, United States, 2008 report show substantial increases since 1960. For example, the prevalence of obesity has increased from 13.3 to 33.4 percent between 1960-1962 and 2003-2006. Mean sodium intake increased from 2,200 to 3,500 mg per day between 1971-1974 and 1999-2000. These data are presented in Table 2-5 and Figure 2-6.
Additional data from 1998 to 2006 show that 30 to 60 percent of adults across the lifespan in the United States are physically inactive, and rates have not changed considerably over time (NCHS, 2009). Heavy drinking rates among adults ages 18 years and older have been estimated at 5 to 6 percent between 1998 and 2006 (NCHS, 2009). There has been some increase in heavy drinking among subgroups of the population ages 45-54 years and 65-74 years (NCHS, 2009).
A good source of dietary potassium can be found in fruits and vegetables. Although consumption of the recommended five servings of fruits and vegetables will not meet the recommended daily intake for potassium, it can certainly contribute (along with consumption of dairy products) to reaching that goal. Trends in fruit and vegetable consumption in the U.S. population, however, do not appear to be helping to reach that goal. In fact, trends show that the 1990 Dietary Guideline recommendations of two servings of fruit and three servings of vegetables every day are not being met. Data from the Behavioral Risk Factor Surveillance System (BRFSS) found a slight decrease in the mean frequency of fruit and vegetable consumption among men and women from 1994 to 2005 (standardized change: total, –0.22 times per day; men, –0.26 times per day; women, –0.17 times per day). From 1994 to 2005, the proportion of men and women eating fruits and vegetables or both five or more times per day remained nearly unchanged (men, 20.6 percent vs. 20.3 percent; women, 28.4 percent vs. 29.6 percent).
Kant et al. (2007) analyzed differences in diets between blacks and whites in the United States using the National Health Examination Survey data. From 1971 to 2002, black men and women reported lower intakes
TABLE 2-5 Prevalence of Hypertension (averaged measures), Overweight, Obesity, and Average Intake of Dietary Sodium per 1,000 Adults 1960-2006
|
|
1960-1962 |
1971-1974 |
1976-1980 |
1988-1994 |
1999-2000 |
1999-2002 |
2001-2004 |
2003-2006 |
|
Hypertension |
38.1* |
39.8* |
40.4* |
25.5 |
32.8 |
30.0 |
30.9 |
31.3 |
|
Overweighta |
44.8* |
44.7* |
47.4* |
56.0 |
64.5 |
65.1 |
66.0 |
66.7 |
|
Obesity |
13.3* |
14.3* |
15.1* |
22.9 |
30.5 |
30.4 |
31.4 |
33.4 |
|
Sodium (mg/day)b |
|
2,200* |
2,900* |
3,600* |
3,500* |
|
|
|
|
aIncludes obesity. bSodium intake estimates are based on the average of salt intake from 24-hour recalls for men and women from NHANES data. Data from NHANES 1971-1974 include naturally occurring sodium in foods and that added by processors. Data for NHANES 1999-2000 includes naturally occurring sodium in foods and that added by processors and discretionary salt usage. *For ages 20-74, other data for ages 20 and over SOURCES: Briefel and Johnson, 2004; NCHS, 2003, 2009, 2010. |
||||||||
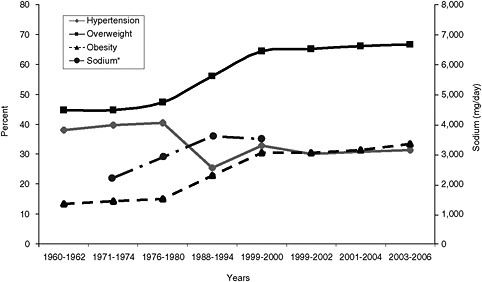
FIGURE 2-6 Secular trends in hypertension, overweight, obesity, and sodium intake in the United States.
*Sodium data from Briefel and Johnson, 2004 (note, the right y axis is in mg per day of sodium intake (e.g., 2,200 mg per day).
SOURCE: NCHS, 2003, 2009, 2010.
of vegetables, potassium, and calcium (p < 0.001) than whites (Kant et al., 2007).
In 2007, the CDC’s BRFSS and the Youth Risk Behavior Surveillance System found that only 14 percent of adults and 9 percent of teens meet Healthy People 2010 goals for fruit and vegetable consumption (CDC, 2009).
RECOMMENDATIONS
Data collection is fundamental to addressing any public health problem. Data are critical for determining the burden of hypertension, characterizing the patterns among subgroups of the population, assessing changes in the problem over time, and evaluating the success of interventions. Given the challenges posed by the changing methodologies used to collect blood pressure measurements, the committee believes that efforts to strengthen hypertension surveillance and monitoring are critical.
2.1 The committee recommends that the Division for Heart Disease and Stroke Prevention (DHDSP)
-
-
Identify methods to better use (analyze and report) existing data on the monitoring and surveillance of hypertension over time.
-
Develop norms for data collection, analysis, and reporting of future surveillance of blood pressure levels and hypertension.
-
In developing better data collection methods and analyses, the DHDSP should increase and improve analysis and reporting of understudied populations including: children, racial and ethnic minorities, the elderly, and socioeconomic groups.
In responding to these recommendations, the DHDSP may want to consider conducting a thorough analytical assessment of available data, including data from the NHANES, to determine if these data are sufficiently comparable for evaluating secular trends of hypertension prevalence in the U.S. population. The analysis would determine at which year the data are robust enough to start analyzing secular trends, make recommendations regarding the use of less robust data, and standardize the use of appropriate age groups for reporting data so that secular trends are reported more consistently in the literature. The DHDSP may also consider conducting analysis of data on the prevalence of hypertension that account for differences in data collection methods used in NHANES (measurement on a single day, variable number of blood pressure measures taken) and the diagnosis of hypertension in clinical practice (blood pressure measurements based on at least two different days). Because of practical issues in conducting the NHANES survey, this might be done by statistical adjustment using multiple measures of blood pressure in a random sub-sample.
REFERENCES
Apostolides, A. Y., G. Cutter, S. A. Daugherty, R. Detels, J. Kraus, S. Wassertheil-Smoller, and J. Ware. 1982. Three-year incidence of hypertension in thirteen U.S. Communities. On behalf of the hypertension detection and follow-up program cooperative group. Preventive Medicine 11(5):487-499.
Berenson, G., S. Srinivasan, W. Chen, S. Li, D. Patel, and G. Bogalusa Heart Study. 2006. Racial (black-white) contrasts of risk for hypertensive disease in youth have implications for preventive care: The Bogalusa Heart Study. Ethnicity & Disease 16(3 Suppl 4):S4-2-9.
Briefel, R. R., and C. L. Johnson. 2004. Secular trends in dietary intake in the United States. Annual Review of Nutrition 24:401-431.
Burt, V. L., J. A. Cutler, M. Higgins, M. J. Horan, D. Labarthe, P. Whelton, C. Brown, and E. J. Roccella. 1995. Trends in the prevalence, awareness, treatment, and control of hypertension in the adult US population. Data from the health examination surveys, 1960 to 1991. Hypertension 26(1):60-69.
CDC (Centers for Disease Control and Prevention). 2009. State indicator report on fruits and vegetables, 2009. http://www.fruitsandveggiesmatter.gov/health_professionals/state report.html (accessed November 9, 2009).
Chobanian, A. V., G. L. Bakris, H. R. Black, W. C. Cushman, L. A. Green, J. L. Izzo, Jr., D. W. Jones, B. J. Materson, S. Oparil, J. T. Wright, Jr., and E. J. Roccella. 2003. The Seventh Report of the Joint National Committee on Prevention, Detection, Evaluation, and Treatment of High Blood Pressure: The JNC 7 report. Journal of the American Medical Association 289(19):2560-2572.
Collins, R., R. Peto, S. MacMahon, P. Hebert, N. H. Fiebach, K. A. Eberlein, J. Godwin, N. Qizilbash, J. O. Taylor, and C. H. Hennekens. 1990. Blood pressure, stroke, and coronary heart disease. Part 2, short-term reductions in blood pressure: Overview of randomised drug trials in their epidemiological context. Lancet 335(8693):827-838.
Cooper, R. 2009. Hypertension and race: Origins, explanations and things we might do about it. Washington, DC: PowerPoint presentation at Committee on Public Health Priorities to Reduce and Control Hypertension open session on June 1, 2009.
Cornoni-Huntley, J., A. Z. LaCroix, and R. J. Havlik. 1989. Race and sex differentials in the impact of hypertension in the United States. The National Health and Nutrition Examination Survey I Epidemiologic Follow-up Study. Archives of Internal Medicine 149(4):780-788.
Cutler, J. A., P. D. Sorlie, M. Wolz, T. Thom, L. E. Fields, and E. J. Roccella. 2008. Trends in hypertension prevalence, awareness, treatment, and control rates in United States adults between 1988-1994 and 1999-2004. Hypertension 52(5):818-827.
Din-Dzietham, R., Y. Liu, M.-V. Bielo, and F. Shamsa. 2007. High blood pressure trends in children and adolescents in national surveys, 1963 to 2002. [see comment]. Circulation 116(13):1488-1496.
Ezzati, M., A. D. Lopez, A. Rodgers, S. Vander Hoorn, and C. J. Murray. 2002. Selected major risk factors and global and regional burden of disease. Lancet 360(9343):1347-1360.
Falaschetti, E., M. Chaudhury, J. Mindell, and N. Poulter. 2009. Continued improvement in hypertension management in England: Results from the Health Survey for England 2006. Hypertension 53(3):480-486.
Fields, L. E., V. L. Burt, J. A. Cutler, J. Hughes, E. J. Roccella, and P. Sorlie. 2004. The burden of adult hypertension in the United States 1999 to 2000: A rising tide. Hypertension 44(4):398-404.
Forman, J. P., M. J. Stampfer, and G. C. Curhan. 2009. Diet and lifestyle risk factors associated with incident hypertension in women. Journal of the American Medical Association 302(4):401-411.
Fuchs, F. D., L. E. Chambless, P. K. Whelton, F. J. Nieto, and G. Heiss. 2001. Alcohol consumption and the incidence of hypertension: The Atherosclerosis Risk in Communities Study. Hypertension 37(5):1242-1250.
Gaziano, T. A., A. Bitton, S. Anand, and M. C. Weinstein. 2009. The global cost of nonoptimal blood pressure. Journal of Hypertension 27(7):1472-1477.
Gregg, E. W., Y. J. Cheng, B. L. Cadwell, G. Imperatore, D. E. Williams, K. M. Flegal, K. M. Narayan, and D. F. Williamson. 2005. Secular trends in cardiovascular disease risk factors according to body mass index in US adults. Journal of the American Medical Association 293(15):1868-1874.
Gu, D., K. Reynolds, X. Wu, J. Chen, X. Duan, P. Muntner, G. Huang, R. F. Reynolds, S. Su, P. K. Whelton, and J. He. 2002. Prevalence, awareness, treatment, and control of hypertension in China. Hypertension 40(6):920-927.
Gu, D., T. N. Kelly, X. Wu, J. Chen, X. Duan, J. F. Huang, J. C. Chen, P. K. Whelton, and J. He. 2008. Blood pressure and risk of cardiovascular disease in Chinese men and women. American Journal of Hypertension 21(3):265-272.
Hajjar, I., and T. A. Kotchen. 2003. Trends in prevalence, awareness, treatment, and control of hypertension in the United States, 1988-2000. [see comment]. Journal of the American Medical Association 290(2):199-206.
He, J., P. Muntner, J. Chen, E. J. Roccella, R. H. Streiffer, and P. K. Whelton. 2002. Factors associated with hypertension control in the general population of the United States. Archives of Internal Medicine 162(9):1051-1058.
He, J., P. M. Kearney, and P. Muntner. 2003. Blood pressure and risk of vascular disease. In Lifestyle Modification for the Prevention and Treatment of Hypertension, edited by P. K. Whelton, J. He, and G. T. Louis. New York: Marcel Dekker, Inc. Pp. 23-52.
Hebert, P. R., M. Moser, J. Mayer, R. J. Glynn, and C. H. Hennekens. 1993. Recent evidence on drug therapy of mild to moderate hypertension and decreased risk of coronary heart disease. Archives of Internal Medicine 153(5):578-581.
Hyman, D. J., and V. N. Pavlik. 2001. Characteristics of patients with uncontrolled hypertension in the United States. [see comment] [erratum appears in 2002 New England Journal of Medicine 346(7):544]. New England Journal of Medicine 345(7):479-486.
Joffres, M. R., P. Ghadirian, J. G. Fodor, A. Petrasovits, A. Chockalingam, and P. Hamet. 1997. Awareness, treatment, and control of hypertension in Canada. American Journal of Hypertension 10(10 Pt 1):1097-1102.
Kannel, W. B. 1996. Blood pressure as a cardiovascular risk factor: Prevention and treatment. Journal of the American Medical Association 275(20):1571-1576.
Kant, A. K., B. I. Graubard, and S. K. Kumanyika. 2007. Trends in black-white differentials in dietary intakes of U.S. adults, 1971-2002. American Journal of Preventive Medicine 32(4):264-272.
Kearney, P. M., M. Whelton, K. Reynolds, P. Muntner, P. K. Whelton, and J. He. 2005. Global burden of hypertension: Analysis of worldwide data. Lancet 365(9455):217-223.
Klag, M. J., P. K. Whelton, B. L. Randall, J. D. Neaton, F. L. Brancati, C. E. Ford, N. B. Shulman, and J. Stamler. 1996. Blood pressure and end-stage renal disease in men. New England Journal of Medicine 334(1):13-18.
Lawes, C. M., S. Vander Hoorn, and A. Rodgers. 2008. Global burden of blood-pressure-related disease, 2001. Lancet 371(9623):1513-1518.
Lewington, S., R. Clarke, N. Qizilbash, R. Peto, and R. Collins. 2002. Age-specific relevance of usual blood pressure to vascular mortality: A meta-analysis of individual data for one million adults in 61 prospective studies. Lancet 360(9349):1903-1913.
Lloyd-Jones, D., R. Adams, M. Carnethon, G. De Simone, T. B. Ferguson, K. Flegal, E. Ford, K. Furie, A. Go, K. Greenlund, N. Haase, S. Hailpern, M. Ho, V. Howard, B. Kissela, S. Kittner, D. Lackland, L. Lisabeth, A. Marelli, M. McDermott, J. Meigs, D. Mozaffarian, G. Nichol, C. O’Donnell, V. Roger, W. Rosamond, R. Sacco, P. Sorlie, R. Stafford, J. Steinberger, T. Thom, S. Wasserthiel-Smoller, N. Wong, J. Wylie-Rosett, and Y. Hong. 2009. Heart disease and stroke statistics—2009 update: A report from the American Heart Association Statistics Committee and Stroke Statistics subcommittee. Circulation 119(3):480-486.
MacMahon, S., R. Peto, J. Cutler, R. Collins, P. Sorlie, J. Neaton, R. Abbott, J. Godwin, A. Dyer, and J. Stamler. 1990. Blood pressure, stroke, and coronary heart disease. Part 1, prolonged differences in blood pressure: Prospective observational studies corrected for the regression dilution bias. Lancet 335(8692):765-774.
Manolio, T. A., G. L. Burke, P. J. Savage, S. Sidney, J. M. Gardin, and A. Oberman. 1994. Exercise blood pressure response and 5-year risk of elevated blood pressure in a cohort of young adults: The CARDIA study. American Journal of Hypertension 7(3):234-241.
Muntner, P., J. He, J. A. Cutler, R. P. Wildman, and P. K. Whelton. 2004. Trends in blood pressure among children and adolescents. Journal of the American Medical Association 291(17):2107-2113.
National High Blood Pressure Education Program Working Group on High Blood Pressure in Children and Adolescents. 2004. The fourth report on the diagnosis, evaluation, and treatment of high blood pressure in children and adolescents. [see comment]. Pediatrics 114(2 Suppl 4):555-576.
NCHS (National Center for Health Statistics). 2003. Health, United States, 2003 with chartbook on trends in the health of Americans. Hyattsville, MD: National Center for Health Statistics.
———. 2009. Health, United States, 2008 with special feature on the health of young adults. Hyattsville, MD: National Center for Health Statistics.
———. 2010. Health, United States, 2009 with special feature on medical technology. Hyattsville, MD: National Center for Health Statistics.
Ostchega, Y., C. F. Dillon, J. P. Hughes, M. Carroll, and S. Yoon. 2007. Trends in hypertension prevalence, awareness, treatment, and control in older U.S. adults: Data from the National Health and Nutrition Examination Survey 1988 to 2004. Journal of the American Geriatrics Society 55(7):1056-1065.
Ostchega, Y., M. Carroll, R. J. Prineas, M. A. McDowell, T. Louis, and T. Tilert. 2009. Trends of elevated blood pressure among children and adolescents: Data from the National Health and Nutrition Examination Survey 1988-2006. American Journal of Hypertension 22(1):59-67.
Pickering, T. G., J. E. Hall, L. J. Appel, B. E. Falkner, J. Graves, M. N. Hill, D. W. Jones, T. Kurtz, S. G. Sheps, and E. J. Roccella. 2005. Recommendations for blood pressure measurement in humans and experimental animals: Part 1: Blood pressure measurement in humans: A statement for professionals from the Subcommittee of Professional and Public Education of the American Heart Association Council on High Blood Pressure Research. Circulation 111(5):697-716.
Staessen, J. A., J. G. Wang, and L. Thijs. 2001. Cardiovascular protection and blood pressure reduction: A meta-analysis. Lancet 358(9290):1305-1315.
Stamler, J., R. Stamler, and J. D. Neaton. 1993. Blood pressure, systolic and diastolic, and cardiovascular risks. US population data. Archives of Internal Medicine 153(5):598-615.
Vasan, R. S., A. Beiser, S. Seshadri, M. G. Larson, W. B. Kannel, R. B. D’Agostino, and D. Levy. 2002. Residual lifetime risk for developing hypertension in middle-aged women and men: The Framingham Heart Study. Journal of the American Medical Association 287(8):1003-1010.
Wang, T. J., and R. S. Vasan. 2005. Epidemiology of uncontrolled hypertension in the United States. Circulation 112(11):1651-1662.
Whelton, P. K. 1994. Epidemiology of hypertension. Lancet 344(8915):101-106.
Wu, Y., R. Huxley, L. Li, V. Anna, G. Xie, C. Yao, M. Woodward, X. Li, J. Chalmers, R. Gao, L. Kong, X. Yang, N. S. C. China, and N. W. G. China. 2008. Prevalence, awareness, treatment, and control of hypertension in China: Data from the China National Nutrition and Health Survey 2002. Circulation 118(25):2679-2686.


