
3
Demand for Helium
INTRODUCTION
Helium is perhaps best known to the general public for its use in party balloons and at the Thanksgiving Day parades in New York City and elsewhere. However, the unique physical and chemical properties of helium make it valuable and indeed irreplaceable in a wide variety of scientific, biomedical, industrial, and national strategic and defense applications, all of which are discussed in this chapter. The first section provides an overview of the demand for helium in the United States and other countries since 1990 and the second a forecast of demand for helium through 2020. The chapter then looks at individual applications of helium, first discussing general economic considerations for different applications and then summarizing the trends in the various applications in the United States. The final section discusses the principal categories of helium usage in more detail, including cost-effective conservation measures available now, emphasizing aspects of each use that are particularly pertinent to this study: How much helium does a category consume? What alternatives are available to these users if helium prices continue to rise and helium supplies are interrupted?
OVERVIEW OF U.S., FOREIGN, AND WORLDWIDE DEMAND TO 2008
Figure 3.1 shows the historical development of refined helium demand in U.S. and foreign markets from 1990 to 2008.1 Worldwide helium demand grew from
|
1 |
USGS, 2008, USGS, 2009. See footnote 4 in Chapter 1 for a list of the units used in this report to report helium volumes. |
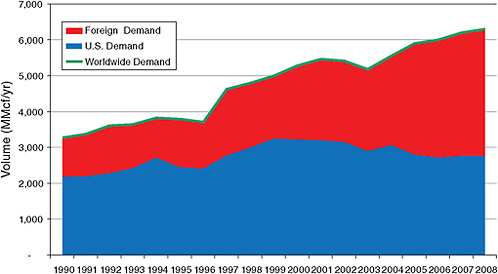
FIGURE 3.1 Consumption of refined helium in the United States (blue), in other countries (red), and worldwide (green line) for the years 1990 through 2008. SOURCE: Cryogas International.
3.28 Bcf in 1990 to 6.3 Bcf in 2008—a growth rate of 3.6 percent per year—and included a growth spurt of 7.8 percent per year between 1996 and 2001. Historically, the United States has been the consumer of most of the helium produced each year, but consumption in the United States has flattened in recent years, while consumption outside the United States has grown significantly (see Figures 3.1 and 3.2). The consumption of helium outside the United States has exceeded domestic consumption since 2007.
ESTIMATE OF DEMAND TO 2020
As noted in Chapter 1 in the section entitled “Review of the 2000 Report’s Conclusions,” the lack of sufficient data, especially on foreign markets, makes it difficult to forecast demands for helium beyond the near term. Accordingly, any attempt to determine where the helium market will be more than a few years into the future should be treated as a rough estimate rather than an accurate prediction. With that proviso, Figure 3.3 estimates demand for refined helium in the U.S. and foreign markets through 2020. A drop of 10 percent in worldwide demand, or 650 MMcf, is forecast for 2009 owing to the worldwide recession. In addition, this short-term scenario assumes some reduction in both U.S. and foreign use of helium from invigorated recycling of spent helium and conservation owing to
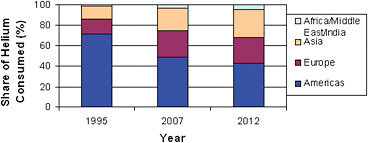
FIGURE 3.2 Helium demand among regions of the world over time. In 1995, the total volume sold was 3.750 Bcf; in 2007, it was 6.335 Bcf, and in 2012, it is expected to be approximately 6.5 Bcf. SOURCE: Cryogas International.
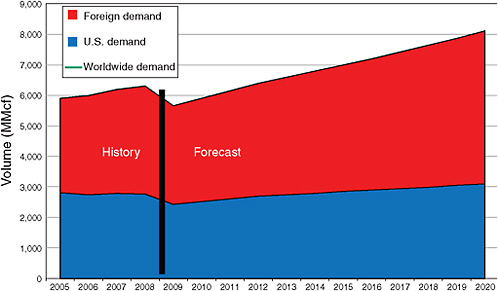
FIGURE 3.3 Actual (2005-2008) and projected (2009-2020) market demand for refined helium in the United States (blue), in other countries (red), and worldwide (green line). See text for a discussion of estimated future demand.
the significant increase in the price of helium in recent years (see Figure 1.5). The United States will experience most of that drop, while Asia is forecast to experience continued growth in demand, if at a slower rate.
Estimates for the years beyond 2012 are based in part on an informal poll of representatives of the principal companies involved in the helium supply market and the knowledge of committee members involved in the industrial gas market and in
part on the assumption that the global economic downturn will not extend beyond 2010. That estimate suggests that worldwide demand will recover to 2008 delivered volume levels by 2012 and that demand will continue to grow worldwide at growth rates of approximately 3 percent per year from the end of 2012 through 2020. That 8-year run of growth is forecast to include a rate of slightly less than 2 percent per year for the United States and an almost 4 percent per year growth rate for the aggregate markets outside the United States.
ECONOMIC CONSIDERATIONS
Continued demand for helium by a particular user or class of users will depend on a variety of factors, but for many users, helium is unique and must be used, regardless of price. Price does, however, play the key role in allocating its limited supply to those who place the highest value on its use. Further, for all helium users, technologies that conserve and/or recover helium can reduce the amount of helium consumed by as much as a factor of ten and it is expected that continued high prices will induce reduced usage, either through conservation or, where appropriate, through substitution of other materials.
For some applications, other gases can replace helium, but other applications rely critically on helium’s unique properties, and there are no alternatives. Applications in the first category, where substitutes for helium might exist, include the following:
-
Lifting. For these uses, where low density is the only requirement, hydrogen is sometimes substituted if safety concerns can be met.
-
Welding. Here, chemical inertness is the key property. For processes such as gas tungsten arc welding—a critical process applicable to reactive metals such as stainless steel, titanium, aluminum, and others in high-value, high-reliability applications—Europe mostly uses argon, while the United States uses helium.
-
Semiconductor and fiber optics manufacturing. In these applications, high thermal conductivity is the important property. Often, hydrogen may be substituted.
In the above applications, economics, market conditions, availability, safety, and legislation can influence the choice among helium and other gases. In contrast, other applications require the unique properties of helium, typically relying on the extremely low boiling point of liquid helium to achieve a desired result. These applications include the following:
-
Purging. Here, entities such as the National Aeronautics and Space Administration (NASA) and the Department of Defense (DOD) must purge liquid
-
hydrogen (LH2) and liquid oxygen (LOx) fuel tanks or systems that may be at liquid air temperatures or colder. Although gaseous hydrogen might have the right physical properties for use in LOx systems, its reactivity with oxygen precludes its use. Nitrogen is not desirable because nitrogen might contaminate the LOx. In LH2 environments, all gases other than helium and hydrogen would freeze, clogging fuel lines and systems and rendering the rocket engines nonfunctional.
-
Superconductivity. One such use is in the superconducting magnets that all medical magnetic resonance imaging (MRI) machines employ. Current materials and technologies dictate that only helium can act as the crucial refrigerant.
-
Basic research. Here, no other substance can be used as a refrigerant to achieve temperatures from 4.2 K above absolute zero down to millikelvins (thousands of a kelvin).
Because price plays such a fundamental role in demand and the 1996 Act has had a profound effect on the price of crude (and therefore refined) helium, this chapter catalogues, where information is available, the existence, usefulness, and cost of substitutes, as well as the potential for recovery, recycling, and other conservation strategies in different markets. Ideally, quantitative estimates of the elasticity of demand with respect to price would be provided for these various applications but since the data are not adequate the discussion remains mainly qualitative.
HELIUM APPLICATIONS IN THE UNITED STATES
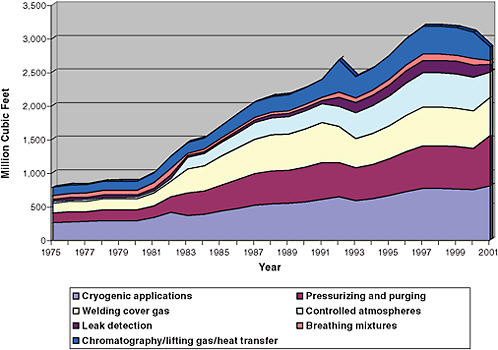
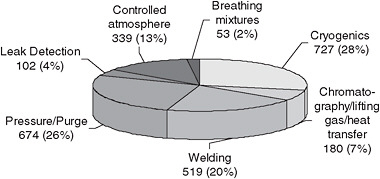
Turning to consumption in the United States, Figure 3.4 illustrates domestic helium usage, by general application categories, for 1975-2008. Figure 3.5 provides the latest public data on the share of total domestic usage of helium accounted for by each application in 2007. The remainder of this chapter discusses the applications for which data have been collected, with alternatives and conservation measures provided where possible.
Cryogenic Uses
The largest share of helium in the United States is accounted for by cryogenic applications, which take advantage of helium’s uniquely low boiling point. Cryogenic uses range from medical uses and high-technology manufacturing to science and technology investigations in academic laboratories.
Magnetic Resonance Imaging
Magnetic resonance imaging (MRI) is a widely used non-x-ray-based technique that provides extremely detailed internal in vivo images of body structure. An MRI apparatus uses a strong magnetic field to align the nuclear magnetic spins of hydrogen atoms in a body, then drives the aligned hydrogen atoms at radio frequencies, and after detecting the properties of the aligned, driven atoms, uses tomography to process the density- and environment-dependent response, producing a noninvasive three-dimensional image. The only commercially viable source of the large (0.5-3.0 tesla) magnetic fields required for this process is a superconducting magnet contained in a cryostat—a container designed to thermally insulate the liquid-helium-cooled superconducting magnet and the liquid helium source.
The availability of helium at low prices and the stability of the market over the years contributed to the rapid growth of MRI as a diagnostic tool in the 1980s, and these tools have made and continue to make a significant contribution to health care in the United States. There are now more than 22,000 machines in the United States and abroad and that number continues to grow. In addition to their use for medical diagnostics, MRI devices frequently are used in research laboratories in chemistry, biology, neuropsychology, and the medical sciences.
At the present time there is no substitute for helium in this application. If large magnet systems with high-temperature (Tc) superconductors (materials that are superconducting at relatively high temperatures) could be built, the demand for helium in this application would be reduced greatly. However, these reductions will occur only if such materials remain superconducting above the boiling point of nitrogen (77 K), allowing the magnets to be cooled with liquid nitrogen instead of liquid helium. In the committee’s judgment, developing such materials and incorporating them into economically competitive devices is not likely to happen for 5 to 10 years, if at all.
In recent years, manufacturers of MRI systems have adapted or developed technologies that significantly decrease the consumption of liquid helium to operate these devices. The advances include cryostats with superior thermal efficiency and cryocoolers that capture vented helium and reliquefy it, as well as changes in the design of the equipment that reduce the size and weight of the materials that need to be cooled. As a consequence, new systems consume dramatically less helium than earlier systems. With proper market signals these users can be expected to recycle even further as the price of helium rises.
Fundamental Research
The second most important cryogenic application of helium is in research laboratories. In discussing how helium is used in research and the users’ needs, it
is convenient to divide research laboratories into large-scale and small-scale facilities. All such facilities located in the United States are supported with substantial U.S. government funding.
Large-Scale Laboratories Large-scale facilities are characterized by signature research tools used by many, often hundreds of, research groups. All such facilities located in the United States are supported with substantial U.S. government funding and typically are located in national laboratories. The principal use of helium in these laboratories is to cool superconducting equipment for accelerators, particle detectors, and research magnets. In the United States, the largest particle accelerator facilities exist at Brookhaven National Laboratory, Fermi National Accelerator Laboratory, Argonne National Laboratory, Thomas Jefferson National Accelerator Facility, and Los Alamos National Laboratory, among others. Europe also has several large particle accelerators, including the Large Hadron Collider (LHC) at Organisation Européenne pour la Recherche Nucléaire (CERN), situated on the Franco-Swiss border, and the Deutsches Elektronen Synchrotron (DESY) in Hamburg, Germany. Large-scale particle and nuclear physics research is conducted throughout Asia, particularly in Japan (at the Laboratory for High-Energy Physics [KEK] and J-PARC facilities), China, Taiwan, and South Korea. Also, major projects utilizing superconducting technology based on helium are underway, including superconductivity research projects by the U.S. Air Force at the Edwards and Kirtland air force bases and superconductivity power systems research at Wright-Patterson Air Force Base. Annual usage at these Air Force facilities and other DOD-supported locations (including various laboratories and universities with federal contracts) is approximately 64,000 liters per year. Additional usage is anticipated at the International Linear Collider (ILC).
These accelerator facilities rely on superconducting magnets, cavities, and other superconducting components to produce and maintain high-energy particle beams. The superconducting components used in these facilities must be kept at very low temperatures, which in practice can be achieved only with liquid helium because of its low boiling point and high thermal conductivity. Large amounts of helium are often required at start-up in particle accelerators because liquid helium must be distributed along the entire length of the machine, which can be many kilometers. As just one example of the amount of helium required for these facilities, the amount of helium required to cool down the LHC facility is approximately 22 MMcf (Bhunia, 2003) and the ongoing inventory will be more than 2 MMcf (Maglioni and Parma, 2008). Superconducting particle accelerators recirculate their helium in a closed loop. As a result, after being filled with helium, the accelerators only need further helium to replace losses due to leaks, accidents, power failures, and so on. It is expected that substantial quantities of helium will be required for the development and operation of future particle accelerators.
Helium is also used in large-scale research laboratories because it exhibits unique superfluid properties below 2.17 K (achieved by pumping to low pressure), including extremely high thermal conductivity. This makes it useful for cooling superconducting radio frequency (SRF) cavities. A significant supply of helium is required for the development of such cavities for current and future accelerator projects because the complexity of the systems and the present cost of helium make it most practical to vent used helium gas to the atmosphere. This practice could change if economic drivers and government incentives were brought to bear.
The third principal use in this category is for research magnets. The only facility of its kind in the United States, the National High Magnetic Field Laboratory, is the largest and highest-powered magnet laboratory in the world. It has components at Florida State University in Tallahassee, Florida; Los Alamos National Laboratory in Los Alamos, New Mexico; and the University of Florida in Gainesville. The laboratory is a national resource for research in physics, biology, bioengineering, chemistry, geochemistry, biochemistry, and materials science and engineering. Liquid helium is used extensively to cool research superconducting magnets and experiments at all three facilities. Some recovery and reliquefaction facilities have been successfully installed and are cost effective. These recovery operations have cut helium losses due to venting from 50,000 liters of liquid per year to fewer than 5000 liters of liquid per year.
Small-Scale Laboratories A typical small-scale facility is operated by an individual group or a small collection of research groups in an academic setting or at a national laboratory. These research activities are led mostly by individual faculty and staff members in the 100 or so research universities and national laboratories across the United States and, occasionally in smaller regional colleges. Such research efforts typically comprise a lead investigator and one or two graduate students and postdoctoral research fellows. Individually and collectively, these small users are at the mercy of prices and markets driven by larger users.
The research conducted in these laboratories can be similar to that in large-scale facilities but it covers a wider range of fields and research interests, including materials, condensed matter, chemistry, biology, biophysics, neuropsychology, nanotechnology, observational astronomy, and astrophysics. In general, cryogenics in these facilities is used to provide low temperatures for measurements, to cool detectors to either reach operational temperatures or reduce noise, or to cool research superconducting magnets. Liquid helium is the most widely used cooling agent (liquid nitrogen is second) and is often the only way to reach the necessary low temperatures.
In addition to the environment in which research is conducted with liquid helium, small laboratories rely on liquid helium to operate diagnostic and measurement tools. Among the more important of those helium-cooled tools are super-
conducting quantum interference devices (SQUIDs). SQUIDs measure extremely small magnetic fields and are used in a wide range of studies, from biological research on brain activity to the assessment of materials characteristics. Devices used in astronomy and astrophysics studies also depend critically on liquid helium. The acquisition of extremely weak signals in several disciplines relies on helium-cooled detectors to reduce thermal and electrical noise. Such detectors, developed as basic research tools, are commonly used for national defense needs as well, such as for detecting submarines by the military.
Most of the research and medical systems discussed here that require liquid helium either are commercially produced or are under development for future commercial production. The demand for the systems has, in itself, nurtured a cryogenic research-equipment manufacturing industry in the United States and abroad that is completely dependent on the availability of liquid helium for its continued operations. The above fundamental research uses, critical to U.S. scientific leadership, have few or no substitutes and are largely funded by federal grants. They are severely impacted by high helium prices and market volatility. Although helium can be economically recovered in a number of these applications, the unavailability of funding, especially for small-scale users, may limit or preclude recovery.
Industrial Cryogenics
Semiconductor Processing Liquid helium is used in the manufacture of semiconductor single-crystal boules via the magnetic-field-applied Czochralski method, where helium-cooled superconducting magnets mechanically stabilize the melt during the pulling process. Helium is critical to this process and, by extension, to the semiconductor industry. In addition, some fabrication facilities require processing in ultraclean environments or under ultrahigh vacuum. Cryopumps cooled to liquid helium temperatures are one of the more widely used means of reaching those high vacuum conditions.
Superconducting magnets using closed-cycle systems can replace total-loss systems economically. The expected reduction in helium consumption for these systems should be similar to that of research magnets, on the order of 90 percent.
Other Industrial Cryogenic Uses Other activities using helium are plasma etching and vacuum pumping. In the latter, liquid-helium-cooled surfaces cryopump gases. Recycling is possible for each of these processes. Indeed, magnet systems employing cryocoolers dedicated to crystal growth are available commercially, and commercial cryopumps are all closed cycle.
With proper market price signals, the bottom line should spur these market users to invest in recycling.
Pressurizing/Purging
The low boiling point and chemical inertness of helium make it a unique purge gas for the second-largest category of helium use, liquid hydrogen/liquid oxygen-fuel (LH2/LOx) rocket propulsion systems. The principal U.S. users are NASA and DOD. Their usage is expected to continue for the foreseeable future. Current examples of main (first-stage) LH2/LOx engines include the space shuttle main engines (SSMEs), the Delta IV rocket’s RS-68 engines, and the European Space Agency’s (ESAs) Ariane 5 Vulcan engine. Other launch vehicles, such as the Centaur, use LH2/LOx engines in the upper stages but their helium usage is much less than that of the main engines mentioned. The main driver of helium use for liquid rocket fuel tank purging is the use of liquid hydrogen (LH2) as a fuel. LH2 is the second coldest cryogen (boiling point of about 20 K) and is flammable. All other gases but helium and H2 would freeze, clogging fuel lines and systems, thereby rendering the rocket engines nonfunctional. Helium is also used to purge liquid oxygen (LOx) tanks, not because of freezing issues but because helium does not contaminate LOx. Because it is chemically inert, helium gas is also used to pressurize the (combustible) propellant tanks for rocket engines, to prevent pump cavitation and the collapsing of tanks under vehicle-imposed structural loads, and to eliminate fire and explosion risks. Other minor space applications of helium are to cool fuel-handling systems and to serve as a pneumatic control system gas in spacecraft and other rocket propelled systems.
NASA uses approximately 90-100 MMcf of helium yearly at the two gaseous helium locations where it consumes the most: Kennedy Space Center (KSC) and Stennis Space Center, although these quantities include helium provided to other programs at those centers through support agreements (for example, the Air Force East Coast Delta IV launch operations supported by KSC and Delta IV RS-68 engine testing at SSC). Other, smaller amounts are spread among the various other NASA centers and NASA contractor locations. DOD uses helium for its launch programs separate from that provided by support agreements with NASA, but the quantities are unknown. Examples of DOD’s use include the U.S. West Coast Delta IV and Atlas launch operations.
If economic drivers were sufficient, NASA and DOD could greatly reduce helium consumption by recovering helium purging gas or, in at least some instances, replacing it with hydrogen once safety concerns are addressed. However, with current helium availability and price, it is unlikely this will occur in the near future. NASA is increasing its awareness of helium usage, particularly in light of the planned development of the Ares V launch vehicle, which will utilize a LH2/LOx main stage (requiring helium purging) with a modified version of the RS-68 engines currently used in the DOD Delta IV rockets. DOD is also reviewing helium usage in its Delta IV launch vehicle.
Welding
Because of its historical availability in the United States at relatively low prices, significant amounts of helium are used domestically in welding applications. In this application, helium predominantly serves as a shielding gas, preventing atmospheric contamination of the molten metal and stabilizing the arc. Because of its high ionization potential, high thermal conductivity, and inertness, helium is the optimal gas for some welding applications. However, outside the United States, where helium supplies have been less abundant and more expensive, other gases, principally argon, are used in welding gas mixtures in place of helium.
The welding industry is highly fragmented, so it is difficult to find detailed data organized by welding process and industrial segment. Figure 3.5 shows that welding represented about 20 percent of U.S. consumption in 2007, but it is only a negligible share of the consumption in other countries. The source of this difference seems to be the twofold and threefold higher costs of helium in other countries in the past, leading to the development of alternative welding techniques. These include the application of pulse power sources with other gases to achieve the same results without a dependence on helium. Although no data on market elasticity are available, the demand for gaseous helium in welding seems to be highly elastic, at least when helium prices increase two- or threefold.
One unique niche for helium in the welding industry is as a component of the lasing gas mixture in CO2 lasers. These mixtures contain nitrogen, helium, and carbon dioxide in roughly a 3:2:1 ratio. It is difficult to recycle this gas as the CO2 breaks down over time and must be replenished. The costs of operating these lasers are dominated by the cost of electrical power, with helium a minor expense. Solid-state (diode) lasers are capturing a growing share of the laser welding market based on their higher efficiency, so it is hard to predict the long-term demand for helium in CO2 lasers.
Plasma-arc melting, used to fabricate products made of specialty materials such as refractory metals, is another process requiring helium. The high melting points, extreme hardness, corrosion resistance, and (often) reactivity at high temperatures of these materials make them especially difficult to handle. Plasma-arc melting involves using an electric arc between a water-cooled torch and the material to be melted that enables the melting and casting of that material within an inert environment under extreme conditions. For many of the materials, such as titanium billets for jet-engine components, heating is sufficiently intense that only helium gas provides enough thermal conductivity to control the process. However, for less demanding applications, argon can replace helium.
Controlled Atmospheres
Optical Fiber Manufacture
Helium is a critical element in the production of optical fibers, an important component of the telecommunications industry. Since optical fibers are bent in their application, it is essential that light traveling through the fiber remain within the fiber, thereby providing an uninterrupted signal. To accomplish this, the fiber actually consists of an inner “core” of glass and an outer “sleeve.” The difference in the coefficient of refraction between the glass core and the material chosen for the sleeve causes light to bounce within the core, but not to bounce out. Helium is critical to the process of depositing the sleeve onto the core—in any atmosphere other than helium, bubbles tend to get trapped between the core and the sleeve, rendering the fiber unusable. There is no alternative atmosphere for this application.
Helium accounts for a small percentage of the total cost of fiber production. This usage, which is approximately 6 percent of total helium consumption, had been growing by about 5 percent per year. However, several types of helium recovery systems for fiber-optic manufacturing are now available, capable of reducing consumption by more than 95 percent. The impact is not known at present but, again, the profit incentive coupled with appropriate pricing should push manufacturers toward recycling.
Semiconductor Processing
In addition to the cryogenic uses identified in the previous section, more recently, the high thermal conductivity of helium gas has been incorporated into the manufacturing process for plasma screens and to produce higher yields when annealing semiconducting wafers cut from a boule. Helium is also used as a nonreactive gas to flush vessels and containers in the processing of semiconductor chips. Helium gas is used as a heat transfer fluid in rapid gas quenching and in Stirling-cycle engines for the nonexpendable working fluid that makes these engines attractive and efficient for renewable energy applications. Finally, some industrial heat treatments are also conducted in helium atmospheres because its inherently high heat transfer capability cools thick sections rapidly. Helium can be replaced with argon in some of these applications.
Chromatography, Lifting Gas, Heat Transfer
Chromatography
Helium is used for chromatographic separation, predominantly as a carrier gas. Helium is ideal for gas, gas-liquid, and gas-solid chromatography because it is chemically inert and diffuses rapidly. Chromatographic and gas-chromatographic systems are used in the pharmaceutical industry for drug analysis and purification, derivatization, and separation; in the food and beverage industries for separation and analysis; in environmental assessments for air, water, and soil toxin analysis; in medical diagnostics for analyzing the presence of gases in the bloodstream, as an example; and in explosives forensics and petroleum testing. There are no obvious substitutes, given the current state of technology.
Weather, Defense, and Other Lighter-Than-Air Applications
One of the more apparent uses of helium is as a lifting gas. While hydrogen is lighter than helium, helium’s chemical inertness makes it safer to use, and so it has replaced hydrogen in most lifting applications. The party-balloon industry uses significant amounts of helium. As a result of the recent tight supplies and increased costs, helium/air mixtures that reduce the concentration of helium in a party balloon by up to 40 percent are becoming more common in the U.S. market. The International Balloon Association provides information on techniques and products to reduce helium usage.
Another lifting use is in the large balloons found at holiday festivities, including the well-known Macy’s Thanksgiving Day parade in New York City. News reports that predicted helium shortages might affect the 2006 parade increased public awareness of the tight helium market and related shortages. In 2007, the helium supplier for the parade made the first attempt to recover some of the 400 Mcf of helium used in the parade’s balloons that year and expanded that effort in the next year’s parade.2
Weather balloons use an enormous amount of helium. Twice each day, weather balloons are released from almost 900 locations worldwide, including over 90 sites in the United States and its territories. These balloons are filled with either hydrogen or helium and carry instruments to measure pressure, temperature, and relative humidity as they ascend.3 This usage alone consumes about 140 MMcf of helium per year, more than the usage by NASA discussed in the “Pressurizing/Purging” subsection.
|
2 |
Available at http://www.linde.com/international/web/linde/like35lindecom.nsf/docbyalias/boc_1157485742146. Last accessed on June 25, 2009. |
|
3 |
Available at http://www.srh.noaa.gov/epz/kids/balloon.shtml. |
Large balloons used for scientific research can lift payloads as much as 8,000 lb. They can fly up to 26 miles high and remain aloft up to several months, depending on the mission. DOD provides helium for various weather-related missions operated by the Air Force, as well as by the National Oceanic and Atmospheric Administration (NOAA) for its weather missions. The Columbia Scientific Balloon Facility (CSBF), in Palestine, Texas, receives its helium through NASA. In addition to missions launched from U.S. locations (Palestine, Texas; Ft. Sumner, New Mexico), CSBF conducts balloon missions from remote locations including Alaska, Canada, Sweden, and Antarctica.
DOD continues to rely on the buoyancy of helium in blimps it develops for surveillance and reconnaissance. Some examples are the Rapid Aerostat Initial Deployment (RAID) program and the Persistent Threat Detection System (PTDS) program. DOD is also developing a significantly larger version of these devices (JLENS) for permanent installation in the United States as part of a system to sense and defend against cruise missiles. The Army is using more than 25 lighter-than-air devices in Iraq and Afghanistan, where they surveil for security and collect weather data.4
Lighter-than-air vehicles are also used for advertising and transportation purposes. Perhaps the best known advertising usage is the Goodyear blimp. Goodyear blimps lose very little helium in normal operations, although the gas does have to be purified about twice a year. As the envelopes age and tend to leak gas via diffusion, the crew might have to supplement the amount of helium in the blimp, sometimes by as much as 10 Mcf of gas per month. The requisite gas is acquired along the tour and added as needed.5
During the 1990s there was interest in developing large helium-filled airships for moving cargo in remote areas. One of the better known companies, Cargolifter AG, never went into full operation and was liquidated in 2002. Other companies are supposedly considering luxury passenger travel and high capacity cargo freighters.
Conservation and recycling seem to be options in these markets if the price signals are right. Hydrogen is a potential substitute for lifting provided that safety considerations are met.
High-Energy Laser
Gaseous helium is used in ongoing DOD research in the development of high-energy lasers at the Wright-Patterson, Kirtland, and Eglin air force bases, as well as at the White Sands Missile Range.
|
4 |
Presentation to the committee by Sharon Murphy, Director, Aerospace Energy, Defense Energy Support Center, August 21, 2008. |
|
5 |
Available at http://www.goodyearblimp.com/faqs/faqs_construction. html#helium. |
Next-Generation Nuclear Reactors
The concept of a gas-filled nuclear reactor, first discussed in the 1950s, is presently being developed for energy production. Two reactor classes, generically known as high-temperature reactors (HTRs) and very-high-temperature reactors (VHTRs) (including pebble-bed reactors), utilize graphite-moderated cores for energy production and helium as a coolant. In the nuclear reactor application, helium has the distinct advantages of (1) high heat transfer capability, (2) chemical inertness, and (3) not forming isotopes and thus not producing deleterious radiogenic by-products. Such designs are under serious consideration and development in the United States as well as in other nations, including South Africa, the Netherlands, and China. In addition to being potentially significant sources of energy, these reactors will have a critically important secondary use: as highly efficient incinerators for the disposal of surplus weapons-grade plutonium.
According to the 2007 report of the International Panel on Climate Change, the production of electricity by nuclear fuel could be a good option for mitigating greenhouse gases. Presently, approximately 16 percent of energy production worldwide derives from nuclear fission (IPCC, 2007), with production in 2005 of 2,626 TWh of energy using 65,500 tons of uranium. Nuclear reactors are being planned or proposed for China, India, Japan, Korea, Russia, and South Africa. The amount of helium needed for each reactor has been estimated at approximately 1 MMcf, with a loss rate of approximately 0.1 MMcf per year.6
While the future helium requirement for VHTR and HTR energy production has not been reliably quantified, helium consumption by this particular U.S. and global sector will increase. No ready substitutes are available, given the high temperatures and heat loads demanded by these facilities. Advanced recycling and recovery efforts might reduce estimated helium loss rates.
Leak Detection
Because of its low viscosity and large diffusion coefficient, helium is an excellent leak detector gas and is widely used as such in science and technology. In one detection method, a vacuum pump is used to pull helium sprayed outside the system through the leak and into an extremely sensitive mass-spectrometer-based helium leak detector. This detection process is the gold standard for any industry that relies on a high vacuum, including the electronics and advanced materials industries, in scientific research, and in the testing and manufacture of large rocket engines.
The use of helium for leak detection has varied widely from year to year, having accounted for approximately 3 to 6 percent of helium consumption in the United States from 1970 to 2006.
There are several approaches to reduce the usage of helium for leak detection. One alternative gas would be hydrogen, whose molecule is only slightly larger than a helium atom but has the disadvantage of flammability. One solution is to mix 4 percent hydrogen with nitrogen to keep it below the hazardous range. However this mixture is much less sensitive than pure hydrogen or helium. Another option with limited applicability is to use closed-loop systems for leak detection. None of these techniques will fully replace helium. For this reason, helium will probably continue to dominate leak detection for the foreseeable future and will have only limited responsiveness to price.
Breathing Mixtures
Several gas combinations containing helium are widely used as breathing mixtures. Although many alternative gas mixtures containing hydrogen or inert gases other than helium have been tried, they are not likely to see wide application or serve as substitutes for mixtures containing helium. The main gases that have been used are Heliox, Trimix, and Heliair, which are mixtures of helium and oxygen, helium with nitrogen and oxygen, and helium and air. Heliox has been used for medical applications since the 1930s to alleviate the symptoms of upper airway obstruction, and its medical use in recent years has expanded. Trimix and Heliair are strictly for nonrecreational use in military, scientific, commercial, and advanced technical diving.
Substitutes also include neon, whose greater density results in less absorption by body tissues than helium or nitrogen. A mixture of 75 percent neon and 25 percent helium has been used, as well. Neon does not seem to have any narcotic effects but is only very slowly released from body tissues, causing long decompression times. Argon is a highly narcotic gas (significantly more so than nitrogen) and because it is dense, it makes breathing difficult on very deep dives. Breathing mixtures containing helium constitute 2 to 3 percent of the use of helium. The growth in this application is not known nor is there any obvious route to helium recovery.


