
2
Units of Assessment
INTRODUCTION
Understanding the units of assessment in sea-turtle populations requires clarity in the definition of nesting populations (Box 2.1). Females show affinity for specific nesting sites and thus can form subpopulations that are vulnerable to extinction. Males breed with females that can have various nesting-site affinities, thus providing male-mediated gene flow among the subpopulations. Because male gene contribution may occur on a potentially larger geographic scale, the scale defines the geographic upper limits of the nesting populations (Bowen and Karl, 2007; Lee, 2008; Wallace et al., 2009a).
The natural history of sea turtles includes several phases that are difficult to observe directly. In particular, the long generation time and oceanic habitat of juveniles are a major obstacle to studies of immature stages. The genetic identification of populations takes on heightened significance because the alternative methods (usually tagging) can be logistically and financially daunting. In this chapter, the committee reviews the current genetic methods for resolving populations as units of assessment and their applications in management units and strategies. A key theme is that population mixing in sea turtles changes with life stage, as juveniles from regional nesting populations may be well mixed, whereas breeding adults may have strong genetic divisions. Population structure also varies among genetic markers, with maternally inherited mitochondrial DNA (mtDNA) demonstrating strong population structure within breeding populations and biparentally inherited nuclear DNA (nDNA) markers
|
Box 2.1 Why Do Populations Matter? Populations matter because they are the fundamental units of species management. A population is an interbreeding group that has a degree of reproductive isolation and demographic cohesiveness. Population members share key demographic features, including fecundity (i.e., individual reproductive output), sex ratio, survivorship, and recruitment. In fishery science, these populations may be called stocks, and in conservation, they are often termed management units. The terms may not be synonymous, but they all entail the key feature of reproductive and demographic independence. Isolation of populations can be spatial, temporal, or behavioral. Nesting populations may aggregate with others during periods of their life history but retain their integrity when breeding. In that case, the nesting populations form a metapopulation—a group of interconnected populations that have some genetic exchange (Kritzer and Sale, 2006). A metapopulation may also qualify as an evolutionarily significant unit in conservation; a distinct population segment (DPS) under the Endangered Species Act; and a regional management unit (RMU), a term developed to fit the natural history of sea turtles (Wallace et al., 2009a, b). Populations and metapopulations are also important because they are potential reservoirs of genetic diversity that retain local or regional adaptations (Jones, 2006) in that they may evolve somewhat separately, providing a source of genetic diversity that can give a species greater resilience in the face of environmental challenges. Population genetic studies in migratory marine animals have emphasized one important lesson in the last decade: primary sampling needs to be at or as close as possible to the breeding and birthing site because these samples are not subject to dispersive life-history stages that may confound population-genetic analyses. For example, genetic surveys of bluefin tuna (Thunnus thynnus) across the North Atlantic yielded contradictory results but no consistent evidence of population structure. However, when young-of-year were sampled near the spawning areas, substantial evidence of population structure emerged, indicating homing by reproductive adults (Carlsson et al., 2007). Such population separation is obscured on feeding grounds by mixing of multiple populations. |
sometimes showing a strong connection between breeding populations. The major challenges associated with this complex population structure are still being resolved.
Fishery scientists typically use the term stock, which is defined as “a discrete entity with its own origin, demographics, and fate” (Cadrin et al., 2005). It is the basic unit of management because each stock has its own unique resilience to harvest insofar as its basic vital rates (birth, death, and growth) result in a specific productivity. A stock will decline if it is
subjected to mortality in excess of its ability to counteract it with new births and faster growth (density-dependent traits). Among ecologists, the term population is variously defined as “a group of individuals that belong to a single species and live in some defined area” (Case, 2000), “a collection of individuals that are sufficiently close geographically that they find each other and reproduce” (Akcakaya et al., 1999), and “individuals [that] form a functional unit” (Rockwood, 2006) wherein “changes are largely determined by birth and death processes” (Turchin, 2003). In essence, those definitions reflect the same concepts and are represented in the use of the term nesting population in the study of metapopulations. The important point is that management policies affect the timing and extent of mortality when stocks have been identified and delineated correctly, the response of the population can be estimated. In contrast, when stocks are not delineated correctly and several stocks with different vital rates are subjected mistakenly to management practices that do not account for individual population rates, the response to management is unpredictable, and smaller or less-productive stocks could become extinct inadvertently. Sea turtles may have a refuge of sorts in that they have been shown to use habitat differently depending on species, sex, and size (Hatase et al., 2002; Hawkes et al., 2006; Blumenthal et al., 2009a). However, such refuges last only until growth and reproduction induce habitat change, which may make them vulnerable.
GENETIC-ANALYSIS TECHNIQUES
The earliest analyses of genetic variation in sea turtles used protein electrophoresis (a method of analyzing the proteins present in the blood; Smith et al., 1978). That demonstrated lower genetic variability in green (Chelonia mydas) and loggerhead (Caretta caretta) turtles than in other vertebrates—a theme that would resurface in the next three decades with respect to many classes of genetic markers (e.g., Avise et al., 1992). Since the advent of direct DNA examinations in wildlife management, a number of techniques have been developed that are no longer widely used or have yet to be widely applied, such as a single-nucleotide polymorphism (a DNA-sequence variation that can occur among members of the same species). Appendix A provides a brief description and history of genetic markers and references to their use in sea-turtle studies. In the current era of genomics, the available classes of genetic markers are now known and largely well characterized. Hence, scientists expect that for at least the coming decade, the workhorse technologies for defining populations will be stable: mtDNA and microsatellites (loci at which short sequences of DNA are repeated in tandem arrays).
Mitochondrial DNA
Structure and Mode of Inheritance
The mitochondrial genome is a circular double-stranded ring of about 16,500 base pairs (bp) in turtles and most other vertebrates. This genome is housed in the mitochondria, the energy-producing organelles in the cytoplasm of eukaryotic cells. Mitochondria are inherited (with rare exceptions) through the egg cytoplasm, and sperm typically do not contribute mitochondria to the fertilized egg. This form of inheritance imparts the following two important consequences:
-
Mitochondria (and mtDNA) are inherited only through the mother, providing a genetic marker for female lineages that is pertinent to sea-turtle population assessment.
-
Only a single version of mtDNA is inherited. This haploid inheritance contrasts with the diploid inheritance of nDNA.1
An additional feature is that mtDNA accumulates mutations faster than most nuclear loci, and this makes mtDNA sequences a method of choice for microevolutionary studies, which look at small-scale changes in allele frequencies in a population.
mtDNA-sequence information was first used to test the age and isolation of the green-turtle nesting population on Ascension Island (Bowen et al., 1989) and provided genetic evidence in support of the hypothesis that females return to their natal regions to nest. The use of mtDNA-sequence data has since become a core technique for examining sea-turtle population structure.
Advantages
The reproducibility of mtDNA sequence data has been a boon to sea-turtle genetic surveys, and registries of known haplotypes2 are maintained in the Archie Carr Center for Sea Turtle Research (University of Florida, 2001) and the National Marine Fisheries Service Southeast Fisheries Science Center (2008).
Current Use
The control region of the mtDNA is a noncoding origin of replication that accumulates mutations more rapidly than mtDNA protein-coding regions (where molecules are translated into proteins). Due to the overall dearth of genetic diversity in sea turtles (relative to other vertebrates), it is the mtDNA region of choice for population assessments. Methods of accessing the control region (via a polymerase chain reaction, a technique used to amplify pieces of DNA that generates millions of copies of a particular DNA sequence) were developed by Allard et al. (1994) and Norman et al. (1994). The resulting DNA products overlap almost completely and produce about a 400-bp fragment in green turtles (e.g., Encalada et al., 1996; Dethmers et al., 2006) and are widely used for population assessment. With improvements in DNA-sequencing technology, there is an initiative to expand the mtDNA-sequence coverage to include most of the mtDNA control region.
Limitations
The primary limitation of mtDNA-sequence data is the maternal inheritance, which precludes inquiries about many aspects of male dispersal and behavior (but see FitzSimmons et al., 1997a). A second limitation is that recently colonized nesting populations may be indistinguishable from the ancestral population even if reproductive isolation is maintained. Loggerhead nesting populations in the northwest Atlantic (northeast Florida, Georgia, South Carolina, and North Carolina) are spatially discrete but have the same mtDNA type at almost 100% frequency. Bowen et al. (1993) suggested that the paucity of genetic diversity is due to the bottleneck effect of colonization by a small number of migrants. Those coastlines were almost certainly too cold to support nesting during the last glacial epoch, which ended about 12,000 years ago so loggerhead nesting has spread northward to Virginia, the northernmost nesting site within the thermal regime for embryonic development. Although the nesting populations in northeast Florida, Georgia, South Carolina, and North Carolina are genetically indistinguishable with current mtDNA data, they are almost certainly isolated management units, based on the overall pattern of population genetic separations in loggerheads (Bowen et al., 1993; Bowen and Karl, 2007).
Microsatellites
Structure and Mode of Inheritance
Microsatellites (also known as simple sequence repeats or variable number of tandem repeats) are short segments of DNA (usually nDNA) with a repeated sequence that is 2–6 bp long. One of the most common repeats is CACACACACACACA…, which in this case would be abbreviated as CA7 because the CA sequence appears seven times. Other versions (alleles) could be CA5, CA6, CA8, CA15, CA18, and so on. As the numbering indicates, there can be many alleles at these highly variable loci. Like other nDNA markers, microsatellites usually have diploid inheritance, receiving one allele each from mother and father. These loci are typically scored by their mobility in a gel or polymer, which can detect fragments of DNA that differ in length by two, four, or more base pairs.
Advantages
This is another workhorse technology for sea-turtle population genetics. Because of the highly variable nature of these loci, they are used for establishing genetic relationships from family pedigrees to fine-scale population structure (Selkoe and Toonen, 2006). Microsatellites have been profitably used on most sea-turtle species to demonstrate multiple paternity. However, their broadest application may be in defining isolated populations with a biparentally inherited nuclear marker. Microsatellites, in conjunction with maternally inherited mtDNA, allow assessment of the male and female contributions to population structure.
Current Use
There are now microsatellite loci designed for each species of sea turtle; about 40 loci are available in loggerheads (Bowen et al., 2005; Shamblin et al., 2007, 2009; Monzón-Argüello et al., 2008), at least 17 in green turtles (FitzSimmons et al., 1995; Dutton and Frey, 2009), at least 24 in hawksbills (Eretmochelys imbricata; Lin et al., 2008; Miro-Herrans et al., 2008), at least 16 in olive ridleys (Lepidochelys olivacea; Aggarwal et al., 2004, 2008), four in Kemp’s ridleys (Lepidochelys kempii; Kichler et al., 1999), four in flatback turtles (Natator depressus; Theissinger et al., 2009), and 15 in leatherbacks (Dermochelys coriacea; Crim et al., 2002; Rivalan et al., 2006a). However, these resources are even richer than the numbers indicate, inasmuch as many loci cross-amplify across sea turtles and other chelonians3 (FitzSimmons
et al., 1995, 1997b; Jensen et al., 2006; Engstrom et al., 2007; Lin et al., 2008; Monzón-Argüello et al., 2008; Shamblin et al., 2009; Theissinger et al., 2009).
Limitations
Microsatellites are expensive to develop, requiring cloning and screening of the nuclear genome (Selkoe and Toonen, 2006). However, as noted above, research in the last decade has produced a rich library of microsatellite loci in sea turtles. A second limitation is that microsatellites are hard to reproduce between laboratories, as opposed to DNA sequences. Microsatellites are distinguished by their length differences, not by their DNA sequence, and differences of two or four base pairs may be hard to compare between laboratories. The standardization issue is a major limitation in assembling range-wide surveys with microsatellites.
METAPOPULATIONS AND MIXED STOCKS
A metapopulation is generally defined as a group of nesting populations that interact at some level but retain sufficient breeding isolation that local adaptations are maintained and vital rates can differ (Hartl and Clark, 2007). The classic metapopulation model maintains that nesting populations can go extinct because of random chance but are recolonized from other nesting populations (Levins, 1969; Hanski, 1999), maintaining the long-term stability of the species. That model probably does not apply widely to marine organisms (Kritzer and Sale, 2006). Hanski and Gilpin (1991) defined a metapopulation as a “set of local populations which interact via individuals moving among populations.” That definition might apply to sea turtles in some regions, if gametes is substituted for individuals. As discussed below, sea-turtle populations, because of mating in shared feeding areas or migratory corridors, may have continuing gene flow without actually exchanging individuals.
Complex Population Structure: Life Stages
In most marine vertebrates, a survey of adults, preferably at breeding sites, is sufficient to sample the nesting population and thus to define management units. In sea turtles, because of their highly migratory nature and complex population structure, it is necessary to survey every life stage to determine the extent of connectivity among populations (Figure 2.1). Allison et al. (2003) provide a conceptual model of potential population structures, and the most common population models are reviewed in Appendix B.
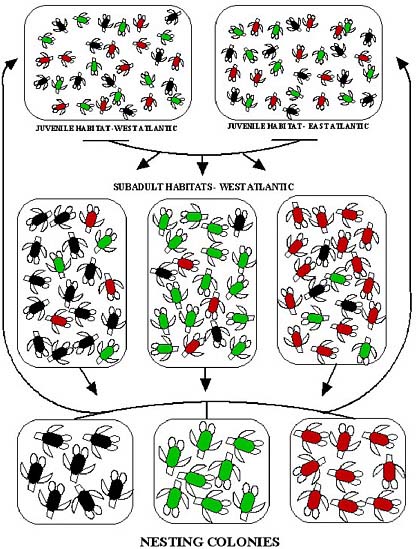
FIGURE 2.1 Population structure at three distinct life stages of the loggerhead turtle. Turtles from the three nesting populations are indicated by red, green, and black icons; the colors do not necessarily represent genetic differences. During the pelagic (open-ocean, juvenile) stage, individuals from the nesting populations intermingle in oceanic habitat, and no population structure is apparent between eastern and western Atlantic. During the subadult stage, some turtles recruit to benthic (seafloor) feeding habitat near their natal rookery (breeding population), producing low but substantial population structure (Bowen et al., 2004). During the breeding stage, females (and possibly males) show natal homing to breeding and nesting habitat, producing strong population structure (reprinted from Bowen et al., 2005; with permission of Wiley-Blackwell).
Mixed-Stock Analyses
Nesting populations separate themselves to breed, but they mingle during other life periods, such as feeding, foraging, and migration. The composition of the mixed stocks can vary (Bjorndal and Bolten, 2008). Some of them are more productive and can withstand greater mortality than others (Hilborn, 1985). Hence, when turtles mingle in shared feeding habitats, some source (nesting) populations are more vulnerable than others to common stressors. Such situations cause problems when the effects of the stressor cannot be assessed separately in each stock but only when an overall effect can be calculated.
In mixed-stock analyses, mathematical models are used to compare the genotypes (genetic profiles) of natal areas (nesting populations in the case of sea turtles) with the genotypes in feeding areas (pelagic [open ocean] or benthic [seafloor] habitats; Bolker et al., 2003). With contemporary methods, the models use maximum-likelihood or Bayesian algorithms, with the ultimate goal of estimating the contribution of each natal area to the shared feeding habitat. The methods were developed initially to estimate the contribution of salmon (riverine) breeding populations to coastal feeding populations (Grant et al., 1980). They have since been applied to sea turtles and other migratory vertebrates, and most recently methods have been developed specifically for mixed stocks of sea turtles (Bolker et al., 2003; Okuyama and Bolker, 2005).
Appropriate Applications and Current Use
One of the earliest successful studies was the assignment of pelagic juvenile loggerheads in the north Atlantic to nesting populations on the coast of North America on the basis of mtDNA-sequence comparisons (Bolten et al., 1998). The mixed-stock program SHADRACQ (Xu et al., 1994) showed that contributions from the west Atlantic nesting populations were roughly proportional to the size of the nesting populations. A similar method showed that juvenile loggerhead turtles from the west Atlantic occupy feeding habitats in the Mediterranean (Laurent et al., 1998) and that loggerhead turtles from Japan are captured in north Pacific longline fisheries (Bowen et al., 1995).
Limitations
The mixed-stock method is valuable but had low precision (wide confidence intervals) in surveys so far. A primary reason for biased (lower-bound) estimates is incomplete sampling. An unknown proportion of sea-turtle nesting is accomplished by solitary females on isolated coastlines, which are extremely difficult to sample. Nesting habitats continue
to be discovered in understudied parts of the world (Yalçın-Özdilek and Sönmez, 2006; Benson et al., 2007). An additional limitation is that nesting populations are not always differentiated in haplotype frequencies. Although the precise composition of feeding populations may elude scientists in most cases, the answers provided by mixed-stock analyses are compelling when applied on an appropriate scale (Bowen and Karl, 2007) and when uncertainty in estimates is understood. Juvenile loggerheads from west Atlantic nesting populations feed in the east Atlantic (Bolten et al., 1998), and Caribbean reefs host hawksbills from multiple nesting populations (Bowen et al., 2007). On such a scale, the mixed-stock analyses can provide resolution sufficient for addressing many management concerns. However, precise estimates of the contributions of small nesting populations to feeding populations may not be possible, and this uncertainty needs to be built into predictive models used for management decisions.
DISTRIBUTION
Complex Population Structure: Female versus Male Components of Population Structure
Genetic surveys of sea turtles consistently show lower population divergence in nDNA assays than in mtDNA assays (Karl et al., 1992; FitzSimmons et al., 1997b; Roberts et al., 2004). Part of that finding can be attributed to the four-fold difference in inheritance between mtDNA and nDNA. When a zygote is formed, it has four possibilities for each nuclear locus: two from the mother and two from the father. There is only one possibility for mtDNA (from the mother). However, inheritance mechanics cannot explain the pattern completely, and part of the solution lies in differences between male and female reproductive behavior.
In the first molecular nDNA study of green turtles, Karl et al. (1992) observed lower global population structure in nDNA (Atlantic FST, 0.130; Indo-Pacific FST, 0.126) than mtDNA (Atlantic GST, 0.63; Indo-Pacific GST, 0.71; Bowen et al., 1992). (For F statistics, see the section “Analytical Techniques” below.) A reassessment with microsatellites produced the same finding (Atlantic FST, 0.038; Indo-Pacific FST, 0.024; Roberts et al., 2004). FitzSimmons et al. (1997b) reported a similar pattern for west Pacific green turtles on the basis of mtDNA and microsatellites. All three nDNA studies interpreted the pattern as evidence of substantial male-mediated gene flow between green turtle nesting populations. In other words, males apparently mate with females from more than one nesting population.
Interrookery (breeding-population) gene flow does not require departures from natal homing (the phenomenon in which animals return to
their birthplace to reproduce). Overlap of feeding grounds and migratory corridors provides sufficient opportunity for mating between turtles from different nesting populations. Hence, both males and females may be homing to breeding areas near their natal beach, but gene flow can be extensive among nesting populations within an RMU (Wallace et al., 2009a). Therefore, surveys of both mtDNA and nDNA (usually microsatellites) are necessary to define populations (Bowen and Karl, 2007; Lee, 2008).
Interpretation of Genetic Data for Management
Difference between mtDNA and nDNA
The maternally inherited mtDNA data provide resolution of isolated nesting populations, but the resolution is imperfect and subject to the vagaries of each population history. For example, nesting probably expanded into higher latitudes after the last glaciation. Those new nesting populations may be isolated for hundreds or thousands of years without showing population-level differences in mtDNA sequence surveys. Therefore, it is important to focus on the overall pattern of isolation. Loggerhead turtles may show isolation on a scale of less than 100 km (Bowen et al., 2005) and green turtles on a scale of 500 km (Dethmers et al., 2006), whereas olive ridleys and leatherbacks may show high connectivity among nesting sites more than 500 km apart (Dutton et al., 1999, 2007; López-Castro and Rocha-Olivares, 2005). The overall pattern of population structure needs to be used to define management units in terms of isolated nesting populations.
The biparentally inherited nDNA (usually microsatellites) reveals the shared history of males and females and (when compared with mtDNA) shows the effect of males on gene flow and population structure. In some cases, where isolated populations do not overlap on feeding and migratory habitat, the mtDNA and nDNA data can indicate concordant population boundaries (Dutton et al., 2008). In contrast, when breeding populations overlap on feeding and migratory habitats, the nDNA can show high connectivity between local nesting populations (Bowen et al., 2005). Therefore, the nDNA should be used to define RMUs, as stated by Wallace et al. (2009a, b). RMUs may be restricted to a single isolated nesting population, as is the case for Hawaiian green turtles (Dutton et al., 2008), or may encompass several nesting populations as is the case for loggerhead turtles in the southeastern United States (Encalada et al., 1998; Bowen et al., 2005). Those RMUs are analogous to evolutionarily significant units as defined by Moritz et al. (1995) or DPSs under the Endangered Species Act (Waples, 1991, 1995).
Genetic Tags
Microsatellites can provide individual-specific genotypes (DNA finger-prints) that may serve as genetic tags to track individuals. For example, an individual genotyped on a nesting beach can be identified with high confidence from a tissue specimen taken on distant feeding habitat. When both parents are genotyped, their progeny can be assigned confidently as well; however, this application would require unrealistically high sampling of males. Genetic tags are also subject to the limitations inherent in saturation tagging (near 100% coverage of individuals), feasible for a few thousand turtles but not the tens of thousands that comprise some populations. For this reason, it may not be practical to genotype hatchlings with the expectation of matching these genotypes to turtles recaptured at later life stages. Nonetheless, genetic tags may resolve some aspects of population structure (Lee et al., 2007).
Analytical Techniques
The cornerstone of population genetic assessments has been F statistics (FST; Wright, 1943), which measure departures from random mating within and among populations on the basis of genotype frequencies. Values of F statistics generally range from zero (no population differentiation) to one (complete population differentiation). An analog that takes DNA sequence divergence into account is ΦST (Excoffier et al., 1992), usually performed in the program ARLEQUIN (Excoffier et al., 2005) or SAMOVA (Spatial Analysis of Molecular Variance; Dupanloup et al., 2002). Additional analogs are available to address the maternal inheritance of mtDNA (GST; Takahata and Palumbi, 1985); potential biases in highly polymorphic datasets (when genes exist in several allele forms), such as microsatellites (F′ST; Jost, 2008); and the mutational model for microsatellites (RST; Slatkin, 1995). Many of those estimators are available from the Web service SMOGD (Software for the Measurement of Genetic Diversity; Crawford, 2009). All the genetic-distance estimators can be used to rank barriers to gene flow, as implemented in BARRIER (Manni et al., 2004).
Population genetics is a fast-moving field because of the recent development of maximum-likelihood and Bayesian approaches based on coalescence theory4 (Kingman, 1982). Those approaches allow estimations of migration and other population parameters (Beerli and Felsenstein, 2001). Whereas F statistics provide an estimation of the number of migrants exchanged between populations, the coalescence-based approaches allow
some inferences about population history. It is also possible to make bidirectional estimates of gene flow with the software programs MIGRATE (Beerli and Felsenstein, 2001), IMA (Hey and Neilsen, 2007; Hey, 2010a, b), and BayesAss+ (Wilson and Rannala, 2003). That allows at least some resolution of historical sources of migrants and founders.
Historical population expansion and declines can be detected with mtDNA and microsatellites; the latter offers a more robust assessment over the timescales pertinent to population management (Beaumont, 1999). BEAST (Bayesian Evolutionary Analysis Sampling Trees; Drummond and Rambaut, 2007) and LAMARC (Likelihood Analysis with Metropolis Algorithm using Random Coalescence; Kuhner, 2009; University of Washington, 2010) are two of the most widely used programs for resolving demographic history.
Finally, assignment tests based on multilocus microsatellite genotypes may be used to assign individuals to a population of origin (Paetkau et al., 1995). That approach has the potential to detect population structure even with a high number of dispersers (5–20%; Berry et al., 2004). A related application of multilocus genotypes is to resolve population separations with patterns of genetic disequilibrium, as implemented in the program STRUCTURE (Pritchard et al., 2000; Hubisz et al., 2009). Lee et al. (2007) used assignment tests to assess population structure at the finest scale in the Ascension Island nesting population.
CONCLUSIONS AND RECOMMENDATIONS
Conclusions:
-
Genetic surveys, in conjunction with tagging studies (see Chapter 4), provide the best approach for resolving the complex population structure of sea turtles.
-
mtDNA surveys of nesting populations are useful for defining management units in terms of isolated reproductive populations.
-
nDNA surveys are useful for resolving the male-mediated connections between nesting populations and for defining RMUs connected by nuclear gene flow. In the case of isolated regional populations, mtDNA and nDNA may indicate that management units defined with mtDNA are equivalent to RMUs defined with nDNA. RMUs may qualify as DPSs under the Endangered Species Act.
-
Mixed-stock analyses can reveal the demographic links between regional nesting populations and feeding populations and can indicate which nesting populations are at risk because of habitat disturbances and fishery bycatch in feeding areas. Confidence intervals on mixed-stock estimates are usually broad, indicating problems with comprehensive sampling of turtle populations.
Recommendations:
-
Researchers should examine the finest scale of female homing in each species (already underway with green, leatherback, hawksbill, ridley, and loggerhead turtles) with mtDNA surveys of nesting beaches, preferably in conjunction with tagging studies. That is necessary to resolve management units defined by female homing behavior. It requires sampling coverage of continental coastline or adjacent islands where nesting is intermittent. Adequate sample size depends on the extent of genetic diversity but may begin at about 30 per nesting population. Note that to avoid resampling the same maternal lineage specimens must come from nesting females or a single progeny per female.
-
Researchers should develop a suite of at least 10–15 variable microsatellite loci for each species. That is necessary to accomplish the next three goals in population resolution and to develop individual-specific DNA fingerprints. It has been largely accomplished for sea turtles in U.S. waters with the possible exception of Kemp’s ridley.
-
Researchers should survey nesting populations with microsatellites to determine the extent of connectivity between local nesting populations. That is necessary to resolve the male-mediated connections between nesting populations and to resolve RMUs. Adequate sample size depends on the extent of genetic diversity (heterozygosity) but may begin at about 50–80 per location.
-
Researchers should survey regional feeding populations (juveniles and adults) with mtDNA sequences to determine the source of these individuals with mixed-stock models, assignment tests, and related methods. That is necessary to determine which populations are present (and possibly at risk) in coastal and oceanic habitats. Microsatellite studies may also be useful. Priorities may be established for the most affected feeding populations.
-
Researchers should survey males in breeding populations off nesting beaches with mtDNA and microsatellites to determine whether they are homing. That is necessary to resolve which populations are present (and possibly at risk) in coastal and oceanic habitats.
-
Researchers should conduct a sea-turtle genome project for the explicit purpose of developing additional nuclear markers, possibly the next generation of genetic markers for sea turtles (see Appendix A). That will also provide benefits in understanding the natural history and genetic resilience of sea turtles. It may be accomplished in the context of the Genome 10K Project already under development (Genome 10K Community of Scientists, 2009).
-
Researchers should develop sex-specific metapopulation models to evaluate genetic differences in dispersal. Males and females use habitat differently for feeding and reproduction, and this argues for sex-specific models for evaluating connectivity and survival. The models will increase understanding of management units and demography as outlined above.


