
Appendix D
Demographic Projections of the Research Workforce in the Biomedical, Clinical, and Behavioral Sciences, 2006-2016
Projecting the research workforce is particularly difficult at this time. Available survey data on the workforce predate the economic crisis and subsequent stimulus, and no previous experience is available to indicate how the size and composition of the workforce have been affected and will change as a result in the future. Projections are reported here that rely on the statistical record, and because of these circumstances they probably carry a larger than usual, although unquantifiable, margin of error.
We consider first what the record says about the research workforce in three large fields: the basic biomedical, clinical, and behavioral and social (or simply behavioral) sciences. The disciplines that these three major fields cover are specified in the preceding appendix. By the workforce we understand all those residing in the United States who are qualified to do research by reason of the appropriate degree, as long as they are not retired. Although some without the degree may make important contributions, their numbers are probably small in comparison and in any case are not documented.
We first describe the workforce itself, then the graduates and immigrants who regularly add themselves to it, then the process of leaving the workforce through retirement and death as well as other changes in status, such as from employment to unemployment. These descriptive sections give fairly clear indications of the directions in which the workforce could be headed—absent the perturbations related to the great recession. We then describe the assumptions made in the projections and present projections of the workforce up to 2016.
THE SCIENTIFIC WORKFORCE
The scientific workforce has three major segments: Ph.D.s with U.S. doctorates, immigrant Ph.D.s with foreign doctorates, and M.D.s who do not also have Ph.D.s but have research interests. Because the NIH did not release data on M.D. researchers, we focus entirely on Ph.D.s, especially on the U.S.-trained, about whom there are the most data.1
U.S.-Trained Ph.D.s
The latest survey, in 2006, put the number of research scientists with U.S. Ph.D.s at 126,000 in the biomedical field, 24,000 in the clinical field, and 120,000 in the behavioral field (Table D-1). Five years earlier, behavioral and biomedical scientists were virtually equal at 113,000-114,000 each, but since then behavioral scientists have increased at a rate of only 1.1 percent annually, in contrast to an increase of 2.1 percent annually for biomedical scientists. Clinical scientists, by far the smallest group, grew much faster, at 4.7 percent annually.
The recent increases in U.S.-trained Ph.D.s are roughly in line with long-term trends, which suggest slowing growth in the behavioral field, slightly accelerating growth in the biomedical field, and greater acceleration in the clinical field (Figure D-1). Over the past two decades, however, growth rates have moderated in each field. Rates were higher from 1995 to 2001, at 2.5 percent annually for U.S.-trained behavioral scientists, 3.7 percent for biomedical scientists, and 5.5 percent for clinical scientists. From 2001 to 2006, the annual increments in the workforce were around 1,300 behavioral scientists, twice that number of biomedical scientists, and about 1,000 clinical scientists. Given estimates of retirements and deaths (to be considered below), this implies that, in 2001-2006, close to 25 percent of biomedical and behavioral Ph.D. graduates annually and about 15 percent of clinical graduates were not being immediately absorbed into the workforce. Exactly where they were or what they were doing instead is not evident.
TABLE D-1 Workforce of U.S.-Trained Ph.D.s in Three Major Fields, by Sex and Employment Status, 2006
|
Status |
Biomedical |
Clinical |
Behavioral |
|||
|
Males |
Females |
Males |
Females |
Males |
Females |
|
|
Total |
80,268 |
45,828 |
9,451 |
14,706 |
57,593 |
62,758 |
|
Employed in Science |
68,236 |
36,340 |
7,817 |
11,924 |
46,399 |
49,261 |
|
Postdoctorate |
7,442 |
6,526 |
340 |
549 |
945 |
1,455 |
|
Other |
60,794 |
29,814 |
7,477 |
11,375 |
45,454 |
47,806 |
|
Employed Out of Science |
10,772 |
6,604 |
1,600 |
2,172 |
10,668 |
10,715 |
|
Unemployed |
464 |
582 |
N/A |
124 |
224 |
449 |
|
Not in the Labor Force (but not retired) |
796 |
2,302 |
34 |
486 |
302 |
2,333 |
|
SOURCE: Data extracted from National Science Foundation Survey of Doctorate Recipients. |
||||||
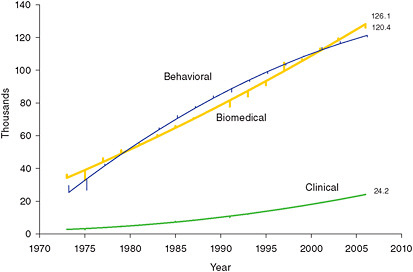
FIGURE D-1 U.S.-trained Ph.D. workforce, in thousands, in three major fields, 1973-2006: quadratic trend and annual variations.
SOURCE: Data extracted from National Science Foundation Survey of Doctorate Recipients, 1973-2006 and NRC analysis.
These estimates of the workforce cover not only those employed in jobs related to science (which includes those on postdoctorates) but also those in nonscience jobs, as well as the unemployed and those not looking for work—often women taking a break from employment (Figure D-2). The estimates exclude the retired. In 2006, those actually employed in science were 80-83 percent of the total workforce. This is a lower proportion than the historical average up to 2001, which is around 90 percent in each field. What has taken the place of jobs in science is non-science employment. In the Ph.D. surveys from 1973 to 2001, the proportion of the workforce employed in non-science jobs did not exceed 10 percent in any field, except once, just barely, among behavioral scientists in 1995. In the two surveys since 2001, in contrast, this proportion has been between 13 and 18 percent in each field.
Postdoctorates have been an important category of science employment, particularly for younger scientists. Across all fields, those on postdoctorates were 17,000 in 2006, or 7.8 percent of all those in science employment. For scientists under 35, postdoctorates made up 42 percent of science employment. The 2006 figures represented increases from 2001 and particularly 2003, when absolute numbers on postdoctorates actually declined. Although 17,000 was the highest figure recorded in the biennial surveys, in percentage terms it represented no more than a return to the levels of the late 1990s.
Another change in the U.S.-trained workforce, but one that has been largely gradual, is the increasing proportion of women (Figure D-3). Shortly after 2003, behavioral scientists reached a turning point, with the sex ratio falling to 100, or equal numbers of men and women. Among clinical scientists, this turning point was reached in 1994, and the sex ratio was down by 2006 to 64 men per 100 women and still falling. Among biomedical scientists, the sex ratio was still elevated at 175 in 2006, although extrapolation of current trends suggests that equality could be reached around 2020.
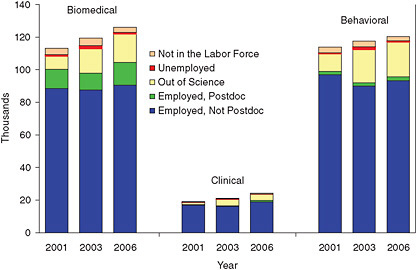
FIGURE D-2 U.S.-trained Ph.D.s by employment status and major field, 2001, 2003, and 2006 (thousands).
SOURCE: Data extracted from National Science Foundation Survey of Doctorate Recipients 2001, 2003, and 2006.
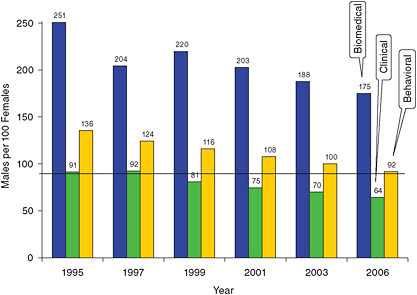
FIGURE D-3 Sex ratio in the U.S.-trained workforce by major field and survey year, 1995-2006.
SOURCE: Data extracted from National Science Foundation Survey of Doctorate Recipients, 1995-2006.
As the sex ratio fell, female scientists apparently became more likely to find scientific employment. In the biomedical field, 85 percent of male scientists were employed in science in 2006, but only 79 percent of female scientists were so employed. In the other two fields, employment in science was almost equally likely for each gender, which was not true in the past (Figure D-4). Female scientists are more likely than males, however, to be out of the labor force. (Those out of the labor force but not retired are counted, for current purposes, as being in the workforce, because one assumes, for projection purposes, that they could readily return to employment.) The numbers are small—about 5,000 in the three fields combined—but the proportion among women in 2006 was five to nine times the proportion among men.
The age of the labor force has also been changing gradually. The median age in 2006 was considerably lower among biomedical scientists, at 46.9 years, than in the other two
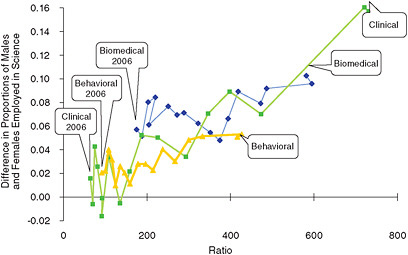
FIGURE D-4 Differences in male and female employment in science relative to the sex ratio in the U.S.-trained workforce between 1973 and 2006.
SOURCE: Data extracted from National Science Foundation Survey of Doctorate Recipients, 1973 and 2006.
fields. Among clinical scientists the median was 51.1 years, among behavioral scientists 52.3 years. These medians represent increases, since 1995, of 1.3 years in the biomedical field, 3.9 years in the clinical field, and 4.5 years in the behavioral field. Those 55 years and older have been a growing proportion of the workforce, but their gains have not been coming at the expense of the youngest scientists. The proportion of those under 35 has also shown some growth; though relatively slight (Figure D-5).
Foreign-Trained Ph.D.s
Foreign-trained Ph.D.s provide a substantial addition to the research workforce. They are not the only immigrants in the workforce. U.S.-trained Ph.D.s include many non-citizens, both permanent residents and temporary residents, the latter having risen to a quarter of Ph.D. graduates. These noncitizens have been incorporated into the preceding tabulations, and this section adds only those who received their Ph.D.s outside the United States.
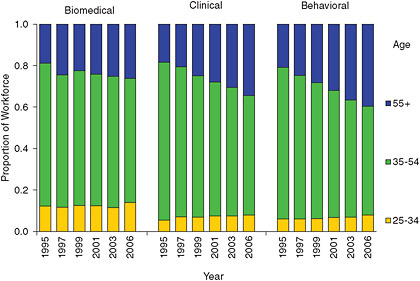
FIGURE D-5 Proportional age distribution of U.S.-trained workforce by major field, 1995-2006.
SOURCE: Data extracted from National Science Foundation Survey of Doctorate Recipients, 1995-2006.
The foreign-trained were not all included in surveys. They were counted in 2003 and 2006 (although not in 2001), but in both cases, the sample frame was based on the decennial census. Any Ph.D.s who entered the country after the census were therefore not counted. Estimates were generated of these additional migrants through a complicated process involving estimating the preceding inflows and extrapolating forward. The specific procedures are described below. They produced upward adjustments to the survey figures of 20-40 percent (varying by field) for 2003 and 40-90 percent for 2006.
Before adjustment, the foreign-trained were equivalent to a fourth of the U.S.-trained in the biomedical field in 2006. After adjustment, they were equivalent to about a third. In the clinical field, the adjustment increases the numbers of the foreign-trained from almost half to two-thirds of the U.S.-trained. The behavioral field is a stark contrast, where the foreign-trained are much fewer, and the adjustment increases their numbers from 3 to 5 percent of the U.S.-trained (Figure D-6). Taking into account the foreign-trained, the workforce in biomedical sciences, instead of being only slightly larger than the workforce in behavioral sciences, was actually 50 percent larger in 2006.
The proportions employed in science among the foreign-trained were generally similar to those among the U.S.-trained, with no consistent variation across fields. For instance, in 2006 in the biomedical field, the foreign-trained were slightly more likely to be employed in science and slightly less likely to be employed out of science, but the reverse was true in the behavioral field. Similarly, gender composition was largely similar, except that, in the biomedical field, the sex ratio was slightly higher among the foreign-trained than the U.S.-trained. One important way in which the foreign-trained differed from the U.S.-trained was in age distribution. Their median ages were five to eight years lower, the difference mainly having to do with fewer foreign-trained scientists 55 years or older and more under 35 years. As a result, whereas foreign-trained biomedical and clinical scientists made up 21 percent of those 55 years and older in 2006, of those under 35 years, they made up 45 percent in the biomedical field and 56 percent in the clinical field (Figure D-7).
WORKFORCE ENTRANTS
The three main groups of entrants who regularly augment the workforce correspond to its three major segments, and as with these three segments, most of the data available cover Ph.D. graduates of U.S. universities. This section focuses mainly on them but adds estimates of foreign-trained Ph.D. migrants.
To summarize the main characteristics of these entrants, we note that, from 2000 to 2007 (the last year for which data are available), the numbers of Ph.D. graduates in the three major fields have mostly been rising, but the trends have been somewhat erratic. NIH funding appears to play an outsize role in producing these graduates. Their demographic characteristics indicate why the workforce is changing. As a group, they have become increasingly female and, in a reversal of previous trends, are now slightly younger on average than earlier.
Trends
From 2000 to 2007, annual Ph.D. graduates in the biomedical field increased 23 percent and in the clinical field 33
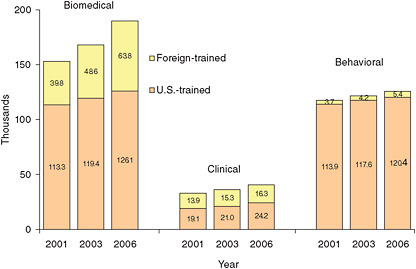
FIGURE D-6 U.S.-trained and foreign-trained Ph.D. workforce, by major field and year (thousands).
SOURCE: Data extracted from National Science Foundation Survey of Doctorate Recipients and National Survey of College Graduates, 2001-2006.
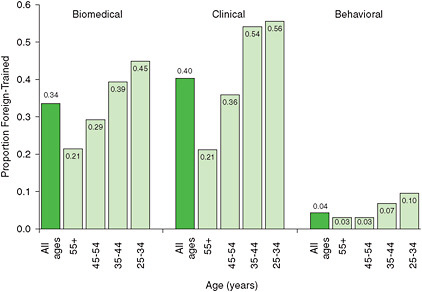
FIGURE D-7 Proportion foreign-trained in the workforce by age group and major field, 2006.
SOURCE: Data extracted from National Science Foundation National Survey of College Graduates, 2006.
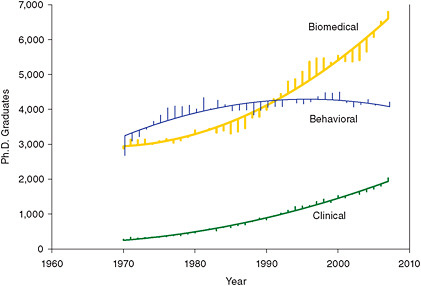
FIGURE D-8 Ph.D. graduates from U.S. universities by major field, 1970-2007: quadratic trend and annual variations.
SOURCE: Data extracted from National Science Foundation Survey of Earned Doctorates, 2007.
percent. In the behavioral field, however, they fell 6 percent, although the trend since 2005 has been positive. These trends have generally been in line with earlier trends (Figure D-8). Roughly around 2001-2002, however, each field experienced a drop in Ph.D. graduates that was deeper, at least in the biomedical and behavioral fields, than previous declines dating to the 1970s. Figure D-9 shows growth rates over 15 years for graduates in each field. (Since annual rates are quite erratic, we show five-year moving averages.) A dip in growth around 2000 or shortly after is evident, but since then growth has rebounded, although by 2007 it had not reached the levels of the early 1990s.
Ph.D. graduates include a number on temporary U.S. visas. In 2007, they were 30 percent of biomedical graduates, 23 percent of clinical graduates, and 10 percent of behavioral graduates. Their numbers appear to rise when the numbers
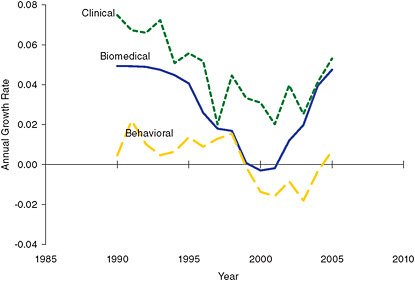
FIGURE D-9 Annual growth rates for Ph.D. graduates by major field (five-year moving averages).
SOURCE: Data extracted from National Science Foundation Survey of Earned Doctorates, 2007.
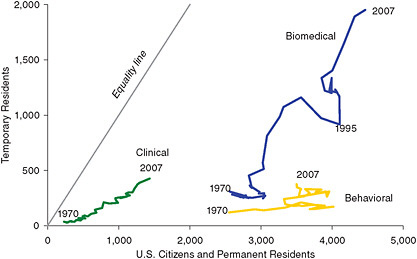
FIGURE D-10 Ph.D. graduates who are U.S. citizens or permanent residents versus temporary residents, by major field, 1970-2007.
SOURCE: Data extracted from National Science Foundation Survey of Earned Doctorates, 2007.
of those who are U.S. citizens or permanent residents rise, although not necessarily as fast (Figure D-10). The correlations between the sizes of the two groups over time are 0.94 among biomedical graduates, 0.99 among clinical graduates, and smaller although still positive at 0.32 among behavioral graduates. This suggests that temporary resident students do not mainly fill in for citizens but instead respond to similar changing incentives and disincentives to enroll (or at least to graduate), although they may respond more or less strongly than citizens and permanent residents. The rising numbers of temporary residents among graduates show no apparent lasting impact, at least so far, from any recent changes in immigration regulations.
Most U.S. citizens and permanent residents intend to stay and work in the United States immediately after graduation. Only 3-4 percent of those who express an intention say they
would work elsewhere. The percentages do not vary by sex or major field and have not changed much over the years, although recently they may have become marginally more similar recently across fields.
For temporary residents, intentions to stay in the United States after graduation vary across fields, being generally lowest among behavioral graduates and female clinical graduates, intermediate among male clinical graduates, and highest among biomedical graduates. Overall, intentions to stay have been rising, generally as the proportion who are temporary residents has also been rising (Figure D-11). The combination of rising proportions of temporary residents and rising proportions of them intending to stay in the United States implies that, among those newly minted Ph.D.s entering the U.S. workforce, temporary residents are increasingly prominent (Figure D-12). Among biomedical graduates, they
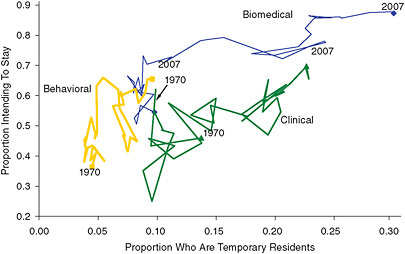
FIGURE D-11 Temporary-resident Ph.D. graduates and their proportion intending to stay in the United States, by major field, 1970-2007.
SOURCE: Data extracted from National Science Foundation Survey of Earned Doctorates, 2007.
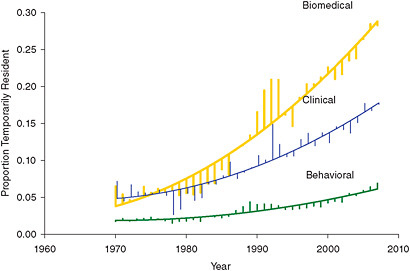
FIGURE D-12 Temporary residents as a proportion of those Ph.D. graduates intending to stay in the United States, by major field, 1970-2007: quadratic trend and annual.
SOURCE: Data extracted from National Science Foundation Survey of Earned Doctorates, 2007.
were 17 percent in 1990 and 28 percent by 2007. Even among behavioral graduates they showed an increase in this period, from 4 to 7 percent.
Sex and Age
The proportion of graduates who are female is rising in each field. Women have been the majority among clinical graduates since 1983, just over a decade before they became a majority in the clinical workforce. Among behavioral graduates women have been the majority since 1986, and it took 17 more years before they became a majority in the workforce. By 2007 in these two fields, female graduates outnumbered male graduates by two to one, and the female-male gap has continued to grow. Women are still a minority, but not by much, in the biomedical field, in which the sex ratio (the ratio of males per 100 females) was down to 109 by 2007, from 163 in 1990. The sex ratio has been falling faster among biomedical graduates than in the other two fields. All the graduate sex ratios are well below those in the research workforce as a whole.
The clinical and behavioral fields differ in one important respect. Figure D-13 shows the trend in numbers of female clinical graduates plotted against male graduates over time, with the trend for each decade shown separately, and the parallel trend among behavioral graduates. In the 1970s and through the early 1980s, numbers of male and female clinical graduates were mostly uncorrelated. In the late 1980s, however, both numbers tended to increase in parallel, a tendency clearly continuing in the 1990s and 2000s. Factors that increase the number of female graduates also appear to increase the number of males, although not quite as strongly, leading the sex ratio to drift further from equality. Trends among biomedical graduates (not shown) resemble those for clinical graduates. The behavioral field shows a contrasting pattern. In the early 1970s, male and female graduates increased in parallel, but since then, increases in female graduates have gone with decreases in male graduates. The sex ratio is dropping among behavioral graduates as females replace males.
Since roughly 1995, Ph.D. graduates have been getting younger. This is true in each field even when male and female graduates are examined separately (Figure D-14). The change has been relatively gradual and by 2007 still fell short of reversing the rising trends in the median age over the preceding 15 years. By 2007, median age among biomedical graduates was 31.3 years, down from the high of 32.2 in 1995 and the lowest since 1984. Among behavioral graduates, the median age of 33.6 years was two years younger than the peak in 1990 and the lowest since 1983. In both these fields, the median age for female graduates was lower than that for males by half a year to a year, a divergence that started mainly in the 1990s. Among clinical graduates, median age has also declined, but from considerably higher levels, as high as 36.5 among males (in 1994) and 42.6 among females (in 1997). The 2007 medians of 35.0 and 38.1 thus represent substantial declines. As these estimates indicate, female clinical graduates have been substantially older than males, unlike in the other two fields.
The declines in age have involved mainly reductions in older graduates, those in their late thirties or older. Graduates have become somewhat more concentrated at relatively younger ages. The tendency has been for younger average ages and a greater concentration of graduates at modal ages to go
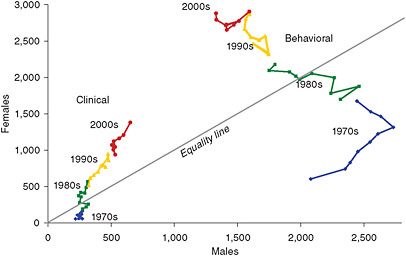
FIGURE D-13 Numbers of male and female clinical and behavioral graduates, 1970-2007.
SOURCE: Data extracted from National Science Foundation Survey of Earned Doctorates, 2007.
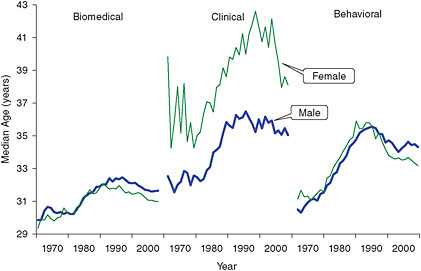
FIGURE D-14 Median age among Ph.D. graduates by major field and sex, 1970-2007.
SOURCE: Data extracted from National Science Foundation Survey of Earned Doctorates, 2007.
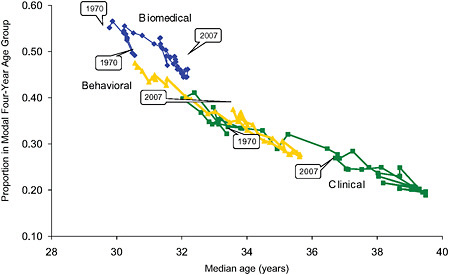
FIGURE D-15 Proportion of graduates in the modal four-year age group, by median age and major field, 1970-2007.
SOURCE: Data extracted from National Science Foundation Survey of Earned Doctorates, 2007.
together. In the biomedical field, which has a lower median age than the other two fields, 53 percent of 2007 graduates were in the modal age range of 27-31 years. In the clinical field, with the highest median age, only 27 percent were in the modal age range of 30-33 years. Across fields and over time, the pattern is unmistakable (Figure D-15). As median ages rose in each field, the modal age covered fewer graduates, but then the trend reversed, leaving median ages and modal concentrations in 2007 at intermediate levels in each field.
The declines in median age do not imply that training is becoming more efficient or even shorter. Offsetting slightly earlier graduation is increasing resort to postdoctoral work. In 1995, 30 percent of behavioral graduates planned on a postdoctoral fellowship. By 2007, this proportion had risen to 46 percent. Clinical graduates showed a smaller increase, from 21 to 28 percent. Although biomedical graduates did not show an increase in this period, they were already at a very high level: 82 percent by 2007.
NIH Support
Graduates in the biomedical field passed 5,000 in 1995, about the same time that the number of NIH predoctoral biomedical awards (National Research Science Awards [NRSAs], for trainees and fellows combined) also passed 5,000. Graduates passed 6,000 in 2005, and predoctoral awards passed 6,000 two years later (Figure D-16). In the 1980s and early 1990s, the ratio of biomedical Ph.D. graduates to NRSA-supported doctoral students was close to 0.8:1, rising to around 1.1:1 after 2000. This suggests that the clear majority of Ph.D.s in these fields were NRSA awardees. If three out of four awardees completed the Ph.D., then slightly more than that proportion of graduates were awardees after 2000.
In the clinical field, NRSAs have fluctuated somewhat in number between 500 and 900. The ratio of graduates to current NRSAs was around 1.6:1 in the 1980s and 1990s and settled to 2:1 in the 2000s. Assuming all the awardees graduate, close to half of graduates would have received an award. In the behavioral field, NRSAs since 1990 have fallen short of the number in the clinical field and are proportionally much less important. The ratio of graduates to current awardees is between 5:1 and 7:1, suggesting that a minority of graduates—around 15 percent—receive such awards.
Foreign-Trained Ph.D.s
No counts or sample estimates are available for the flow of foreign-trained Ph.D.s into the U.S. workforce. From the stock information in the 2003 survey, considered above, we estimated the probable annual inflow from the 1990s, making assumptions about retirements and deaths.
Tabulating the 2003 stock by date of entry into the United States, we reverse-survived each immigrant cohort to date of entry to determine its initial size. We used retirement rates and mortality rates by age for the workforce as a whole, described below. These calculations were done separately for men and women in each field. The results suggested a rising trend among foreign-trained biomedical scientists and considerable variability but no convincing trend among foreign clinical and behavioral scientists, who were considerably fewer.
Figure D-17 shows the estimated inflows of these foreign-trained Ph.D.s, compared with the trends in the other entrants into the workforce: the U.S.-trained Ph.D. graduates (citizens and temporary residents) who choose to stay in the United States. Annual immigrant numbers are relatively volatile. In the biomedical field in 2000, they were 50 percent of the entrants into the workforce, up from only 15 percent in 1990. (Estimates were also made for the years 1980-1984 combined and 1985-1989 combined, when inflows were even smaller.) Because U.S.-trained temporary-resident graduates were an additional 10 percent of the total in 2000, immigrants made up the majority of new workforce entrants in that year, and could have been an even larger proportion, because permanent residents are lumped with citizens. In the clinical field, foreign-trained immigrants outnumbered graduates in some years in the early 1990s, and in the late 1990s were 20-40 percent of the total. In the behavioral field they were much less consequential, averaging only 7 percent of the entrants over the decade.
These immigrant flow figures are in a sense underestimates, because those who may have returned to their countries of origin or emigrated elsewhere were not counted
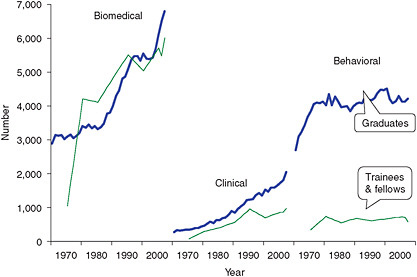
FIGURE D-16 Ph.D. graduates and NRSA predoctoral trainees and fellows by major field, 1970-2007.
SOURCE: Data extracted from National Science Foundation Survey of Earned Doctorates, 2007, and NIH IMPACII Database.
FIGURE D-17 Estimated workforce entrants: foreign-trained Ph.D.s and U.S.-trained citizens and temporary residents, by major field, 1990-2000.
SOURCE: NRC analysis.
in 2003 and were not added to the inflow. The figures represent only immigrant Ph.D.s who stay in the United States for some variable period of time. (Roughly half of those surveyed in 2003 had already stayed in the United States at least 10 years.) These figures for immigrant flow were used to adjust the foreign-trained stock numbers for 2003 and 2006, and also provided estimates of stock in 2001, as described below.
WORKFORCE TRANSITIONS
Leaving the Workforce
Individuals leave the workforce through death, emigration, or retirement. TIAA-CREF mortality tables provide some indication of mortality patterns: 79 percent of male scientists and 87 percent of female scientists should live at least up to age 75.
Data on emigration are largely lacking. Initial tabulations suggest very few U.S.-trained Ph.D.s abroad, although the completeness of these data is uncertain. Some graduates do not intend to stay in the United States, and these intentions, as described above, may be taken into account. But subsequent emigration, after initially entering the U.S. workforce, is assumed, in the absence of adequate data, to be inconsequential. Where foreign-trained Ph.D.s are concerned, emigration data are also lacking. However, we estimated the immigration flow only of those who stayed in the United States for some period, so many of those who subsequently enter and then emigrate are probably not counted as entrants.
Retirement produces more departures from the workforce than death or emigration. From retirement rates estimated between pairs of surveys since the 1990s, the proportions that have retired by age 66 have ranged from 5 up to 50 percent (Figure D-18). These are period estimates, i.e., they assume that a cohort of individuals moves through its career following the retirement rates estimated in a given period for individuals of different ages. No trend over time is evident in the proportions having retired by age 66 except possibly for the period 2003-2006, when lower retirement rates are shown. Because this period between surveys is three years rather than two (as is the case for all other successive surveys), these rates are adjusted, but even without adjustment some decline in the likelihood of retirement appears in each group.
This is illustrated in Figure D-19, which covers only male biomedical scientists. The proportion retired at each age was lower using 2003-2006 rates than using rates for biennial surveys from 1993 to 2001. Adjusting for the fact that the 2003 and 2006 surveys were three years apart makes the difference larger. Rates for 2001-2003, however, provide a less clear contrast with 1993-2001 rates. The contrasts are generally similar in other fields.
Moving Within the Workforce
Although the great majority of Ph.D.s are in science-related occupations, some are not. Some movement does occur among employment categories, particularly between science-related and nonscience-related jobs (Figure D-20).
FIGURE D-18 Proportion that would have retired by age 66, from retirement rates in specified periods, by major field and sex.
SOURCE: Data extracted from National Science Foundation Survey of Doctorate Recipients, 1993-2006.
FIGURE D-19 Proportion that would have retired by each age, from retirement rates in specified periods: male biomedical Ph.D.s.
SOURCE: NRC analysis.
Across the three major fields, patterns of such movement do not vary greatly. Between males and females, the main difference involves those not working. There are more of them among women, and among women more in this group do not return to work within two years—60 percent, in contrast to 40 percent among men.
Over time, the main change in these movements has involved non-science jobs (Figure D-21). Those in such jobs may have increased in the early 2000s mainly because fewer of them have been returning to science jobs. This appears to be true for males and females in each field.
PROJECTION APPROACH
In projecting the research workforce, our concern is with its likely size and growth between 2006, the date of the latest
FIGURE D-20 Proportional distribution of the workforce by initial employment status and status two years later: pooled 1993-2006 estimates for all fields combined, by sex.
SOURCE: Data extracted from National Science Foundation Survey of Doctorate Recipients, 1993-2006.
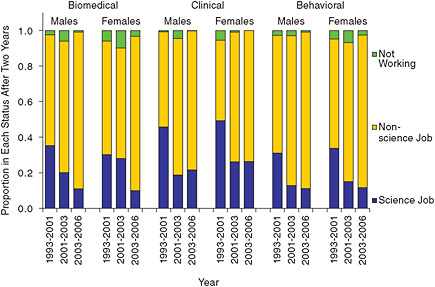
FIGURE D-21 Proportional distribution two years later of those in nonscience jobs, by major field and sex, selected periods.
SOURCE: Data extracted from National Science Foundation Survey of Doctorate Recipients, 1993-2006.
survey of the Ph.D. workforce, and 2016. We estimate the likely entrants in this period and allow the workforce to age, so a certain number retire or die. We run these calculations by age and sex, so we can see how the demographic composition of the workforce will change. In order to determine how many will probably be engaged in scientific work, we also model transitions into and out of science jobs. We focus on Ph.D.s, both U.S.- and foreign-trained, leaving out M.D.s with research interests, for whom recent data have not been released.
The base for the projection is the research workforce in 2006, distributed by major field, age, sex, and employment status. The survey gives two-year age groups, and in order to facilitate annual projections, we divide each age group in two, not equally but proportional to the size of the neighboring age groups.
Graduates
Among entrants to the workforce, U.S.-trained Ph.D. graduates, should they increase as they have since around 2005 or, even more, in the early 1990s, should see fairly rapid growth in their numbers. However, a reversal could set in, as it did around 2000-2002, leading to much slower growth or even decline. Or the long-term trend since the 1970s or 1980s could reassert itself. We define future trends to represent this range of possibilities. The period from 1988-1992 to 1993-1997 will be used to represent rapid growth in graduates and the period from 1996-2000 to 2001-2005 to represent slow (or no) growth. The average between rapid and slow growth rates, thus defined, will be taken to represent a medium growth trend.
Table D-2 shows the estimated growth rates. The rapid or high growth estimates are close to, although short of, the highest levels since 1990 (see Figure D-9), and similarly the slow or low estimates are close to but not as low as the lowest levels. Medium rates come close to the long-term growth rates since 1970 for biomedical and clinical graduates, and since 1980 for behavioral graduates (for whom a 1970s growth spurt has never been duplicated).
Under these assumptions, biomedical graduates could rise from 6,500 in 2006 to anywhere from 7,100 to 10,300 by 2016 (Figure D-22). Behavioral graduates, who were two-thirds as numerous as biomedical graduates in 2006, would increase at most 13 percent by 2016 or possibly even decrease a little. Clinical graduates would increase the fastest and could, in the right combination of circumstances, almost catch up with behavioral graduates. From 44 percent as numerous as behavioral graduates in 2006, they would rise to at least 57 percent and as much as 94 percent of behavioral graduates by 2016.
To project changes in gender composition of Ph.D. graduates, we linearly extrapolate the trends in the sex ratios from 1995 to 2007 (Table D-3). In this projection, the sex ratio among biomedical graduates will hit 100, meaning equal numbers of both sexes, by 2010 or 2011. For the other two
TABLE D-2 Annual Growth Rates for Ph.D. Graduates in Three Major Fields, Selected Periods
|
Period |
Biomedical |
Clinical |
Behavioral |
Used to Project: |
|
From 1988-1992 to 1993-1997 |
0.046 |
0.062 |
0.011 |
High growth |
|
From 1996-2000 to 2001-2004 |
0.006 |
0.030 |
−0.011 |
Low growth |
|
Mean of Preceding Estimates |
0.026 |
0.046 |
0.000 |
Medium growth |
|
For Comparison: |
|
|
|
|
|
From 1970 to 2007 |
0.023 |
0.054 |
0.012 |
|
|
From 1980 to 2007 |
0.026 |
0.055 |
0.002 |
|
|
SOURCE: NSF. 2007. National Science Foundation Survey of Earned Doctorates. Washington, DC: NSF. |
||||
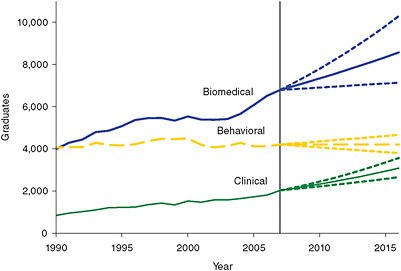
FIGURE D-22 Past and projected trends in Ph.D. graduates under high-, medium-, and low-growth assumptions, by major field, 1990-2016.
SOURCE: Data extracted from National Science Foundation Survey of Earned Doctorates, 2007, and NRC analysis.
TABLE D-3 Linear Regressions for Sex Ratio Among Graduates on Year, 1995-2007, by Major Field
|
Major Field |
Intercept |
B |
t |
R2 |
|
Biomedical |
5370 |
−2.622 |
−10.44 |
0.908 |
|
Clinical |
1582 |
−0.765 |
−3.64 |
0.546 |
|
Behavioral |
2034 |
−0.990 |
−7.26 |
0.827 |
|
SOURCE: NRC Analysis. |
||||
fields, projected sex ratios are much lower and similar, falling to 40 by 2015 or 2016.
To represent the age distribution among graduates over time, we begin with the percentage distribution for the periods 1993-1997 and 2005-2007 in each field by sex. These distributions are smoothed to eliminate as much as possible alternating increases and decreases in percentages at successive ages. Assuming that changes in age distribution between these periods continue, we extrapolate to give projected age distributions (by field and sex) by 2020 and interpolate for intermediate years. Figure D-23 illustrates the results for male behavioral graduates, among whom median age, 35.2 in 1993-1997 and 34.4 in 2005-2007, would fall to 34.1 in 2015 and 33.9 in 2020.
We need to model changes in the proportion of the graduates who will be temporary residents rather than citizens or permanent residents, since temporary residents are less likely to enter the U.S. workforce. Given the fluctuations in this proportion over time, we select data for particular time periods to give alternatives. Data for the period 1995-2007 give moderate future projections, 2000-2007 data give high projections, and 1990-2007 data give low projections (except for female clinical graduates, for whom we substitute the period 2004-2007). The projections are defined from linear regressions on the logits for the annual proportions in these periods who were temporary residents, separately for males and females in each major field. The resulting projected proportions of temporary residents by 2020 are in Table D-4.
We rely on stated intentions to stay in the United States to determine the proportion of graduates entering the U.S. workforce. For U.S. citizens and permanent residents, we use constant “stay rates” that are the average, by field and sex, of intentions for 2005-2007—i.e., 96-97 percent for each group. For temporary residents, uncertainties about future immigration policy, the job market, and opportunities elsewhere suggest the need for alternatives. The simplest alternative is for stay rates to remain at recent levels, and to represent this we use average 2005-2007 rates for each group by sex and field. Stay rates could also revert to previous lower levels. Average rates for 1993-1997 are used to represent this possibility. Finally, rates could continue their secular rise. We use linear regressions from 1990 to project what rates could be in 2020. For biomedical graduates, however, this would give rates exceeding 100 percent, so instead we use the more moderate trend for 2000-2007. Table D-4 also shows the projected stay rates in 2020 estimated by these methods.
The combination of these varying stay rates for temporary residents and the proportions of them among graduates affects the total numbers of graduates entering the U.S. workforce. However, the effect is small. Relative to projections using medium-variant parameters, the number of graduates entering the workforce in 2016 would be only 1-3 percent higher (varying by field) given the most favorable combi-
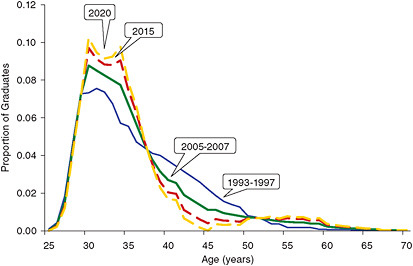
FIGURE D-23 Past and projected age distribution of male behavioral graduates, selected years.
SOURCE: Data extracted from National Science Foundation Survey of Earned Doctorates, 2007, and NRC analysis.
TABLE D-4 Latest and Projected Proportions of Graduates Who Are Temporary Residents and Stay Rates (Proportions of Graduates Who Plan to Stay in the United States) by Citizenship Status, and by Field and Sex
|
Status |
Biomedical |
Clinical |
Behavioral |
|||
|
Male |
Female |
Male |
Female |
Male |
Female |
|
|
Proportion of Temporary Residents Among Graduates |
||||||
|
2007 |
0.320 |
0.287 |
0.337 |
0.181 |
0.107 |
0.092 |
|
2020, low |
0.352 |
0.360 |
0.308 |
0.244 |
0.112 |
0.104 |
|
2020, mediium |
0.414 |
0.463 |
0.340 |
0.255 |
0.120 |
0.142 |
|
2020, high |
0.434 |
0.514 |
0.438 |
0.271 |
0.180 |
0.196 |
|
Stay Rates, U.S. Citizens and Permanent Residents |
||||||
|
2007 |
0.974 |
0.971 |
0.968 |
0.972 |
0.959 |
0.972 |
|
2020 |
0.969 |
0.968 |
0.966 |
0.973 |
0.965 |
0.974 |
|
Stay Rates, Temporary Residents |
||||||
|
2007 |
0.878 |
0.866 |
0.754 |
0.651 |
0.672 |
0.646 |
|
2020, low |
0.763 |
0.763 |
0.615 |
0.464 |
0.421 |
0.468 |
|
2020, mediium |
0.878 |
0.873 |
0.734 |
0.640 |
0.629 |
0.650 |
|
2020, high |
0.917 |
0.899 |
0.851 |
0.757 |
0.745 |
0.809 |
|
SOURCE: NRC Analysis. |
||||||
nation of assumptions or 3-4 percent lower given the least favorable. The varying assumptions do have a greater effect on the proportion, among the graduates entering the workforce, who are temporary residents (Figure D-24). Whether, and if so how long, they remain temporary residents, we do not attempt to predict.
Foreign-Trained Ph.D.s
The estimates of immigrant flow described above were projected forward, first to adjust estimates of stock in 2003 and 2006 (and to provide stock estimates for 2001) and then to provide estimates of flow through 2016. The procedure involved several steps.
-
We projected 1990-2000 trends in estimated immigrant cohorts beyond 2000. For male biomedical scientists, based on a linear regression, we assumed 2,850 migrants in 2001, increasing by 190 annually thereafter. For female biomedical scientists, we assumed 2,410 migrants in 2001, increasing by 130 annually thereafter. For the other groups, 1990-2000 flow numbers (combined with five-year estimates for the early 1980s and late 1980s) fluctuated too much—from over 1,000 down to zero from one year to the next—to permit the
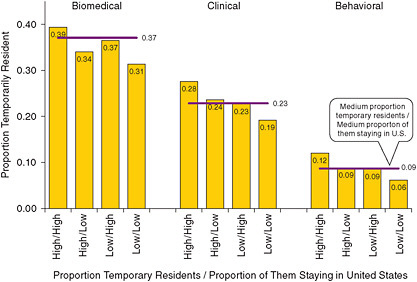
FIGURE D-24 Proportion temporarily resident among graduates entering the workforce in 2016, under various assumptions.
SOURCE: NRC analysis.
-
extrapolation of trends. We took the average for 1990-2000 and assumed that migrants stay constant at this level, which was 450 annually for male clinical scientists, 470 for female clinical scientists, 130 for male behavioral scientists, and 150 for female behavioral scientists.
-
With the survival rates used is estimating the earlier inflows, we determined how many of each cohort entering after 2000 survived to 2003 and to 2006, and added them to the survey estimates. (We also made estimates, using the entire flow rather than just post-2000 entrants, for 2001.) As part of this calculation, we multiplied the numbers reported in each survey for the 2000 migrant cohort by four, to allow for the fact that the census, dated April 1, 2000, would have covered migrants only in the first quarter of the year. (This adjustment was incorporated in the flow numbers.)
-
We distributed the resulting foreign-trained stock by employment status in 2003 and 2006, relying on proportions in the survey results, or, in a few cases at the extremes of the age distribution where data were sometimes lacking, on proportions for the U.S.-trained workforce.
-
Beyond 2006, we applied the same projected trends to give a medium projection. Alternative high and low projections of migrant inflows were made based on data for particular periods. For biomedical scientists, data for 1995-2000 suggested higher inflows, whereas including data from the 1980s suggested lower inflows. For the other groups, averages over 1990-1995 suggested higher inflows, and averages over 1995-2000 suggested lower inflows. Figure D-25 shows how these alternative projections compare among themselves and with the medium projection for U.S.-trained graduates. Much greater variation is possible in the biomedical field than in the other two fields. Only in the biomedical field, also, is there some possibility that migrants will actually outnumber graduates—and if the high projections for migrants and the medium projections for graduates prove correct, by a substantial margin.
Transitions
For exits from the workforce, as well as for movements between different employment statuses, we use only one set of parameters for each major field, each of them age- and sex-specific. Transition rates are therefore assumed not to change, although the numbers exiting and the numbers in different statuses should change as the composition of the workforce changes.
For future mortality rates, we use the TIAA-CREF mortality table. Mortality rates are applied to the age distribution before other movements are allowed. Unlike other assumed transition rates, mortality rates are assumed not to vary across fields.
Future retirement rates, as well as rates for moving between employment statuses, are derived from the biennial survey data from 1993 to 2003, plus the 2006 survey. The procedure to estimate rates involved these steps:
-
Each individual in two successive surveys is classified by status in both surveys. We sum the numbers in each compound category (e.g., employed in the first survey/retired in the second survey) across all surveys. In effect this gives slightly more weight to surveys with larger numbers, usually later surveys. For the 2003-2006 surveys, numbers are adjusted to allow for the fact that the period between surveys was extended to three years.
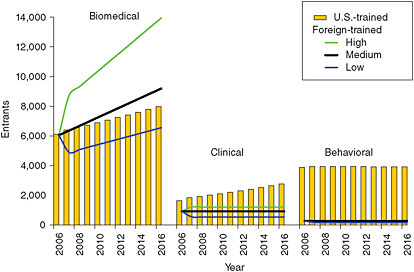
FIGURE D-25 Alternative projections of foreign-trained Ph.D.s entering the workforce (contrasted with medium projection for U.S.-trained graduates), by major field, 2006-2016.
SOURCE: NRC analysis.
-
From these pooled data, we calculate the proportion in each initial status ending up in every other status in two years. These proportions are estimated stepwise. First, we estimate the proportions retiring. Then, leaving out the proportions who have retired, we estimate the proportion of the remainder who become unemployed. Leaving out the retired and the unemployed, we estimate the proportion of the remainder who leave the labor force, followed, in similar fashion, by the proportion who take non-science jobs and the proportion who take employment in science. This stepwise procedure helps ensure that subsequent adjustments of the proportions will not result in total proportions deviating from 100 percent.
-
Each estimated proportion refers to a two-year cohort (e.g., 61-62 years old), and we apply the same proportion to each age. Each estimate x also applies to a two-year period (e.g., 1997-1998), and to estimate a proportion for each year, we use the formula y = 1 − (1 − x)0.5.
-
To smooth some of the irregularities across ages, we use the average over five successive ages (or over three ages at the ends of the age distribution), except for the proportion retiring, which is not smoothed because we assume it to have specific peaks.
Scenarios
Alternative projection assumptions have been reviewed regarding four variables: numbers of graduates, proportion of them who are temporary residents, proportion of temporary-resident graduates who stay in the United States, and number of migrating foreign-trained Ph.D.s. To avoid having to sort among 81 different scenarios, we assemble four main scenarios from among these options.
First, a medium-growth scenario is defined as the medium variant regarding each of these variables. Second, a high-growth scenario is defined as the high variant regarding each variable, except for the proportion of graduates who are temporary residents. For this variable, we use the low variant, which leads to more rapid growth because fewer temporary residents means more citizen graduates, who are more likely to enter the U.S. workforce. Third, a low-growth scenario is defined as the low variant on each variable, except for the proportion who are temporary residents, for whom we take the high variant. Finally, to represent an extreme situation in which immigrants cease to arrive, we add a no-migrant scenario. The number of graduates is assumed to be low, the number of migrant foreign-trained Ph.D.s is taken as zero from 2010 on, the proportion of temporary residents among graduates is assumed to be high, and the proportion of them staying in the United States is assumed to be zero from 2008 on.
Table D-5 summarizes the scenarios by giving the projected numbers of graduates and immigrant Ph.D.s. We focus primarily on the medium scenario in the discussion and note what variations from it the alternative scenarios suggest.
PROJECTION RESULTS
In the medium scenario, the projected research workforce in 2016 will total 306,000 biomedical scientists, 64,000
TABLE D-5 Projected Numbers of Ph.D. Graduates and Immigrating Foreign-Trained Ph.D.s in Alternative Projections, by Major Field, 2006-2016
|
Projection and Year |
Graduates |
Immigrant Ph.D.s |
||||
|
Biomedical |
Clinical |
Behavioral |
Biomedical |
Clinical |
Behavioral |
|
|
Medium Projection |
|
|
|
|
|
|
|
2006 |
6,514 |
1,807 |
4,123 |
6,050 |
919 |
280 |
|
2007 |
6,793 |
2,028 |
4,208 |
6,363 |
918 |
281 |
|
2008 |
6,974 |
2,122 |
4,210 |
6,676 |
918 |
281 |
|
2009 |
7,154 |
2,230 |
4,212 |
6,993 |
918 |
281 |
|
2010 |
7,344 |
2,327 |
4,205 |
7,311 |
918 |
281 |
|
2011 |
7,529 |
2,438 |
4,210 |
7,624 |
918 |
281 |
|
2012 |
7,731 |
2,558 |
4,210 |
7,938 |
918 |
281 |
|
2013 |
7,933 |
2,673 |
4,208 |
8,253 |
918 |
281 |
|
2014 |
8,137 |
2,809 |
4,206 |
8,569 |
918 |
281 |
|
2015 |
8,351 |
2,943 |
4,210 |
8,885 |
918 |
281 |
|
2016 |
8,575 |
3,084 |
4,207 |
9,198 |
918 |
281 |
|
High Projection |
|
|
|
|
|
|
|
2006 |
6,514 |
1,807 |
4,123 |
6,050 |
919 |
280 |
|
2011 |
8,174 |
2,605 |
4,406 |
11,063 |
1,214 |
299 |
|
2016 |
10,302 |
3,567 |
4,663 |
13,951 |
1,214 |
299 |
|
Low Projection |
|
|
|
|
|
|
|
2006 |
6,514 |
1,807 |
4,123 |
6,050 |
919 |
280 |
|
2011 |
6,946 |
2,287 |
4,022 |
5,634 |
551 |
165 |
|
2016 |
7,141 |
2,660 |
3,800 |
6,564 |
551 |
165 |
|
SOURCE: NRC Analysis. |
||||||
clinical scientists, and 137,000 behavioral scientists, up from 2006 figures of 190,000, 41,000, and 126,000 respectively. Workforce growth will be substantial in the biomedical and clinical fields: 61 percent and 58 percent respectively over the entire period. In the behavioral field, however, growth will be only 9 percent (Table D-6).
Characteristics
The biomedical workforce will grow considerably faster than biomedical Ph.D. graduates—at a rate of 4.8 percent annually rather than just 2.7 percent—which will not be true in the other two fields. In the biomedical field, migrant foreign-trained Ph.D.s will help swell the workforce (Figure D-26). The number of foreign-trained biomedical scientists, already three times the number of foreign-trained clinical and behavioral scientists combined, will be more than four times the combined number in 2016. They will make up 43 percent of all biomedical scientists.
Overall, clinical scientists will increase almost as fast (at 4.6 percent annually), mainly due to an increase in U.S. graduates twice as rapid as in the biomedical sciences. The increase in foreign-trained clinical scientists will be slower but still rapid at 3.6 percent annually, and by 2016 the foreign-trained will be 37 percent of all clinical scientists.
Among behavioral scientists, growth will be slow, at 0.9 percent annually, for a 10-year increment of 11,000 behavioral scientists, only half the increment of clinical scientists and one-tenth the increment of biomedical scientists. Relative to behavioral Ph.D. graduates, whose rate of increase
TABLE D-6 Projected Workforce in Three Major Fields, by Sex, 2006-2016
|
Year |
Biomedical |
Clinical |
Behavioral |
||||||
|
Total |
Male |
Female |
Total |
Male |
Female |
Total |
Male |
Female |
|
|
2006 |
189,860 |
122,754 |
67,106 |
40,511 |
18,291 |
22,220 |
125,794 |
59,639 |
66,155 |
|
2007 |
200,233 |
128,207 |
72,026 |
42,705 |
19,062 |
23,643 |
127,965 |
59,703 |
68,262 |
|
2008 |
210,841 |
133,711 |
77,130 |
44,945 |
19,819 |
25,126 |
129,836 |
59,609 |
70,227 |
|
2009 |
221,648 |
139,267 |
82,381 |
47,196 |
20,560 |
26,636 |
131,355 |
59,307 |
72,048 |
|
2010 |
232,755 |
144,943 |
87,812 |
49,488 |
21,295 |
28,193 |
132,668 |
58,900 |
73,768 |
|
2011 |
244,224 |
150,782 |
93,442 |
51,779 |
22,011 |
29,768 |
133,923 |
58,505 |
75,418 |
|
2012 |
255,970 |
156,677 |
99,293 |
54,089 |
22,732 |
31,357 |
134,975 |
57,978 |
76,997 |
|
2013 |
267,958 |
162,603 |
105,355 |
56,443 |
23,464 |
32,979 |
135,770 |
57,245 |
78,525 |
|
2014 |
280,194 |
168,594 |
111,600 |
58,836 |
24,215 |
34,621 |
136,370 |
56,430 |
79,940 |
|
2015 |
292,748 |
174,702 |
118,046 |
61,294 |
24,995 |
36,299 |
136,867 |
55,632 |
81,235 |
|
2016 |
305,571 |
180,876 |
124,695 |
63,808 |
25,771 |
38,037 |
137,221 |
54,752 |
82,469 |
|
SOURCE: NRC Analysis. |
|||||||||
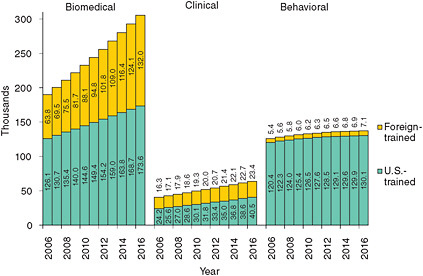
FIGURE D-26 Workforce projections by major field and source of Ph.D., 2006-2016 (thousands).
SOURCE: NRC analysis.
will be an anemic 0.2 percent annually, the foreign-trained will show a respectable rate of growth of 2.7 percent annually, but from a very low level.
The research workforce in each field will be considerably more female than in 2006. Sex ratios in the clinical and behavioral fields—82 and 90 per 100, respectively, in 2006—will be almost identical—68 and 66 in 2016. The sex ratio in the biomedical field, about twice as high as in the other fields in 2006, will also fall by 2016, to 145. The foreign-trained will make different contributions to these changes (Figure D-27). The sex ratio among foreign-trained biomedical scientists is higher than among the U.S.-trained, and although it will decline will remain higher. In the clinical field, the situation is similar, although the gap between the sex ratios among foreign-trained and U.S. trained is and will remain larger. In the behavioral field, the situation is to a degree reversed, with higher sex ratios among the U.S.-trained coming down and by 2016 approximating the constant and low sex ratios among the foreign-trained.
Another perspective is provided by comparing sex ratios in the workforce with sex ratios among potential entrants (Figure D-28): U.S. graduates and immigrants. Sex ratios
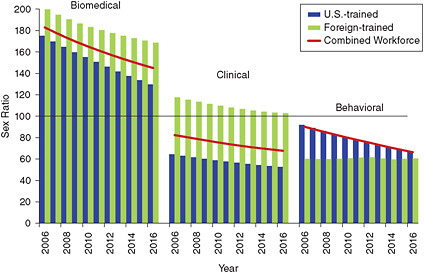
FIGURE D-27 Projected sex ratio by major field and source of Ph.D., 2006-2016.
SOURCE: NRC analysis.
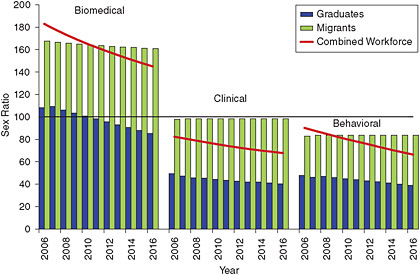
FIGURE D-28 Projected sex ratio of workforce and potential entrants by major field, 2006-2016.
SOURCE: NRC analysis.
among immigrants will be essentially constant (which is expected at least among clinical and behavioral scientists given our assumption of a constant flow). Among U.S. graduates, however, sex ratios will be falling in each field. They are already well below sex ratios in the workforce as a whole—35 to 60 points below—and by 2016 will be 45 to 75 points below, with the greatest gap in the biomedical field. A predominantly male biomedical professoriate, therefore, will be training a majority female student body.
Median ages among behavioral scientists will rise, but in the other two fields, trends will be less clear. Male behavioral scientists, already the oldest in 2006 with a median age of 54.7 years, will become older still, reaching a median of 57 years by 2016. The median age among female behavioral scientists will also rise, from 49.2 to 49.9 years. The median age is lowest among female biomedical scientists, at 41.6 years, and will inch upward to 41.9 years. At the same time the median age for male biomedical scientists will be falling, from 47 to 46.4 years. Trends in median age among clinical scientists will also provide a contrast between males and females, although the trends will not be linear. Among males, median age will rise and then fall; among females it will fall and then rise, in neither case producing much net change.
Some of the complications in age trends are due to differences between U.S.-trained and foreign-trained scientists (Figure D-29). The foreign-trained have been younger than the U.S.-trained in each field and have helped keep the median age down. Median age is projected to rise among the foreign-trained in most cases, however. At the same time, median age should fall among the U.S.-trained biomedical and clinical scientists, while it rises among behavioral scientists.
The aging of the workforce will be most notable among behavioral scientists, among whom the proportion 55 years and older will rise from 39 percent in 2006 to 44 percent in 2016. This proportion is much smaller in the other two fields and will rise only to 24 percent among biomedical scientists and 30 percent among clinical scientists (Figure D-30). Younger foreign-trained researchers clearly help keep ages down in the biomedical and clinical fields, although even without them, the workforce in these fields would be younger than in the behavioral field.
One consequence of having more older scientists is more retirements and deaths. The proportion retiring or dying annually will rise in each field, from a range of 1.2-1.6 percent of the workforce in 2007 to 1.4-2.8 percent in 2016. The proportion retiring or dying will be particularly high among male behavioral scientists, at 3.8 percent by 2016. Among male behavioral scientists, this number already exceeded the number of graduates actually entering the workforce in 2006 (leaving out those not intending to stay in the United States) and will be almost twice as numerous by 2016 (Figure D-31). The 3,800 behavioral scientists, both male and female, projected to retire or die in 2016 will be barely under the number of new Ph.D. graduates, which is projected at 4,200. This does not account for foreign-trained Ph.D.s, but they are few in the behavioral field.
The proportion of the workforce employed in science should stay roughly the same, about 80-85 percent in each field. The proportion working in non-science jobs should also stay at 12 percent in the biomedical field but could drop in the other two fields. It was slightly higher in the clinical field than in the biomedical field in 2006, at 17 percent, and could fall to 11 percent. It was also higher in the behavioral field, at 18 per-
FIGURE D-29 Median age of projected workforce by major field, sex, and source of Ph.D., 2006-2016.
SOURCE: NRC analysis.
FIGURE D-30 Projected age distribution of the workforce by source of training and major field, 2006-2016.
SOURCE: NRC analysis.
FIGURE D-31 Projected proportions dying and retiring, compared to entering graduates as a proportion of the workforce, by major field and sex, 2007-2016.
SOURCE: NRC analysis.
cent, and could fall to 15 percent. Since transition rates among these statuses were based on rates over more than a decade and not allowed to change, one would expect quite recent changes in transition rates, such as the mid-2000s, increase in proportion out of science, to be reversed to some degree.
The greatest proportional change in employment status could involve the proportion not in the labor force. This small segment of the workforce, between 1.5 and 3 percent of the workforce in 2006, could grow 50-250 percent faster than those employed in science. The greatest increase will be in the biomedical field (Figure D-32). The obvious explanation is the growing proportion of women in the workforce. Although this factor should have a role, decomposition of the change suggests it is not the main explanation. In the biomedical field, it is due instead to a projected change among women themselves. Between 2003 and 2006, the proportion out of the labor force among female biomedical scientists fell by a third, from an unusually high 7.5 percent to a still very
FIGURE D-32 Projected number and percentage of the workforce not in the labor force by major field, 2006 to 2016.
SOURCE: NRC analysis.
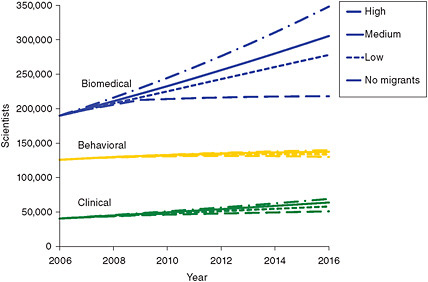
FIGURE D-33 Alternative workforce projections by major field, 2006-2016.
SOURCE: NRC analysis.
high 5.0 percent. With no evidence that this is the start of a long-term trend or even a long-term downward adjustment, we have allowed rates to return to previous levels, which accounts for the major part of the increase in those not in the labor force in this field.
Alternative Scenarios
The alternatives to the medium scenario provide much more variation in the biomedical field than in the other two fields (Figure D-33). The medium scenario gives almost identical 61 percent and 58 percent increases in the workforce between 2006 and 2016 in the biomedical and clinical fields. The high scenario gives an increase in the biomedical field of 84 percent, 23 percentage points higher than the medium scenario (Figure D-34). In the clinical field, the high scenario gives an increase that is only 13 percentage points higher than the medium scenario. In the behavioral field, the medium 10-year increase is only 9 percent, and the high scenario gives an increase only 2 percentage points higher.
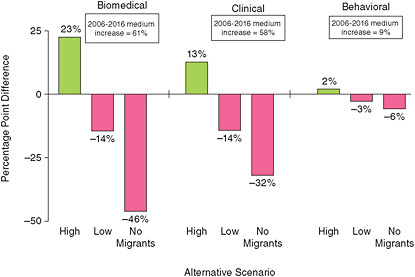
FIGURE D-34 Difference of alternative scenarios from the medium projection in percentage change from 2006 to 2016, by major field.
SOURCE: NRC analysis.
On the other side of the ledger, the low scenario gives a 14 percentage point lower increase in both the biomedical and clinical fields than the medium scenario and a 3 percentage point lower increase in the behavioral field.
One could of course select arbitrarily symmetrical alternative scenarios, but the ones chosen are derived from some past experience with inflows and outflows, and therefore presumably represent more realistic possibilities. The range of past growth rates has been narrower in the clinical field in the past than in the biomedical field, and still narrower in the behavioral field, which is why the scenarios for biomedical researchers produce much more variation.
An extreme scenario has migrant inflows ending and temporary-resident graduates all deciding to work overseas. Combined with the low projection for total graduates, this would produce larger reductions relative to the medium projection, as much as 46 percentage points lower in the biomedical field. But the workforce would still grow in each field.
Could an increase in graduates make up for the hypothesized lack of immigrants in this scenario? We have not assessed the factors that might make a substantial increase in graduates possible, such as faculty, funding, and student interest. We can, however, assess whether this is likely given past trends in graduates, as reflected in the different projection scenarios. Comparing scenarios suggests that, absent an ahistorical boost in graduates, they would not increase enough to fill all the niches that immigrants would potentially leave vacant. Figure D-35 compares additional alternative scenarios with the medium scenario, showing how percentage growth between 2006 and 2016 would be greater or smaller under different combinations of immigrant and graduate growth. Except in the behavioral field, where the foreign-trained workforce is only a small percentage of the total, the variation between high and low numbers of graduates has a smaller effect on the projected workforce than the variation between high and low numbers of immigrants. And high numbers of graduates would clearly not make up for zero immigrants. Still, because zero immigration is in fact an ahistorical situation, one cannot entirely rule out an ahistorical increase in graduates that goes beyond past trends.
The proportion who will be foreign-trained varies in different scenarios, especially in the biomedical field (see Figure D-36 and Table D-7). In the high projection for biomedical scientists, the foreign-trained would reach almost half of the total by 2016, in the low scenario only 40 percent. In the no-migrant scenario, there will still be foreign-trained researchers, because we assume that immigration does not cease until 2010, and in addition do not assume that foreign-trained researchers already in the United States all emigrate. By 2016, they would still be 32 percent of the total. In the clinical field, the proportion foreign-trained in 2016 varies in a more limited range, from 38 percent to 31 percent (in the no-migrant scenario), and in the behavioral field the variation is even more limited.
Across the different scenarios, variations in projected sex ratios are relatively slight. The greatest variation will be in the biomedical field in 2016, when the sex ratio could range from 149 to 138. Variation in age will be somewhat greater.
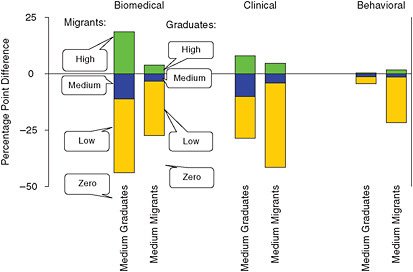
FIGURE D-35 Difference of other projections from the medium projection in percentage change from 2006 to 2016, by major field.
SOURCE: NRC analysis.
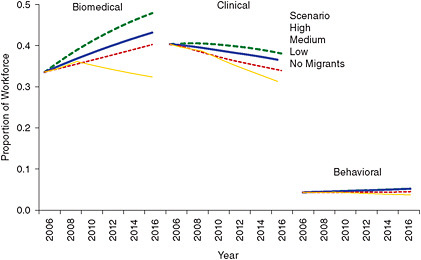
FIGURE D-36 Foreign-trained Ph.D.s as a proportion of the workforce in alternative scenarios, by major field, 2006-2016.
SOURCE: NRC analysis.
In general, more rapid growth implies a younger workforce. Regardless of the scenario, however, behavioral scientists will be older in 2016 than in 2006 (Figure D-37). Clinical scientists will also be older in almost every scenario. But biomedical scientists could be younger in 2016, under the high or medium scenarios, or older, under the low or no-migrant scenarios. When scientists are divided by field and sex, four of the six groups are not that different in current and projected median age. The exceptions are male behavioral scientists, who are clearly older and will get older still, and female biomedical scientists, who are clearly younger and will not catch up in age to any other group in any scenario.
Will Growth Be Adequate?
What workforce growth would be enough to maintain the research infrastructure in various disciplines, to nurture sufficient scientific discovery, and to allow for new disciplines to develop within each field? This would require much more information, as well as value judgments about what is suf-
TABLE D-7 Alternative Workforce Projections by Major Field and Source of Training, 2006, 2011, and 2016
|
Projection and Year |
Biomedical |
Clinical |
Behavioral |
||||||
|
Total |
U.S.-Trained |
Foreign-Trained |
Total |
U.S.-Trained |
Foreign-Trained |
Total |
U.S.-Trained |
Foreign-Trained |
|
|
Medium Projection |
|||||||||
|
2006 |
189,860 |
126,098 |
63,762 |
40,511 |
24,165 |
16,347 |
125,794 |
120,354 |
5,439 |
|
2011 |
244,224 |
149,367 |
94,848 |
51,779 |
31,754 |
20,025 |
133,923 |
127,584 |
6,339 |
|
2016 |
305,571 |
173,588 |
131,986 |
63,808 |
40,454 |
23,351 |
137,221 |
130,100 |
7,120 |
|
High Projection |
|||||||||
|
2006 |
189,860 |
126,098 |
63,762 |
40,511 |
24,165 |
16,347 |
125,794 |
120,354 |
5,439 |
|
2011 |
260,153 |
150,901 |
109,241 |
53,660 |
32,161 |
21,500 |
134,533 |
128,106 |
6,428 |
|
2016 |
348,292 |
181,402 |
166,896 |
68,966 |
42,676 |
26,288 |
139,804 |
132,510 |
7,293 |
|
Low Projection |
|||||||||
|
2006 |
189,860 |
126,098 |
63,762 |
40,511 |
24,165 |
16,347 |
125,794 |
120,354 |
5,439 |
|
2011 |
234,116 |
147,791 |
86,319 |
49,536 |
31,339 |
18,198 |
132,802 |
127,037 |
5,766 |
|
2016 |
278,070 |
166,087 |
111,985 |
58,046 |
38,320 |
19,723 |
133,653 |
127,658 |
5,994 |
|
No-migrants Projection |
|||||||||
|
2006 |
189,860 |
126,098 |
63,762 |
40,511 |
24,165 |
16,347 |
125,794 |
120,354 |
5,439 |
|
2011 |
215,341 |
140,073 |
75,261 |
47,036 |
29,936 |
17,099 |
131,381 |
125,945 |
5,437 |
|
2016 |
218,034 |
147,388 |
70,645 |
50,887 |
34,942 |
15,941 |
129,988 |
125,134 |
4,853 |
|
SOURCE: NRC Analysis. |
|||||||||
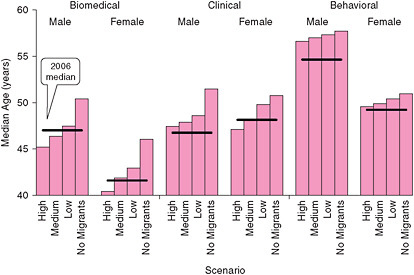
FIGURE D-37 Median age in 2016 in alternative scenarios, compared with 2006, by major field and sex.
SOURCE: NRC analysis.
ficient, to determine. We can, however, compare projected workforce growth with past growth, particularly of the U.S.-trained workforce. (These comparisons are limited to the U.S.-trained only, since no long series is available for the foreign-trained.) As Figure D-38 shows, in the biomedical field projected growth is roughly in the range of percentage increases in the U.S.-trained workforce in previous decades, except for the zero migrant scenario, in which growth would fall well below the norm. For the clinical and behavioral fields, all the projections—even the high scenario—are well below previous experience, suggesting that growth will continue to slow, as it has for some decades, although not stop. A possible hypothesis is that these fields are maturing or have matured, and would need striking and expansive new ideas to reenter a rapid-growth phase.
Research funding levels are of course highly relevant
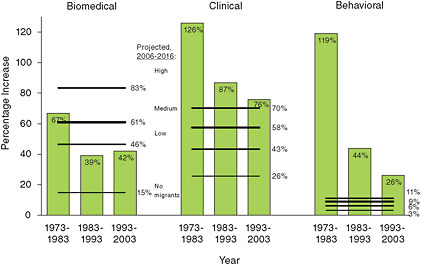
FIGURE D-38 Percentage increases in the U.S.-trained workforce in past decades and alternative projections for the entire Ph.D. workforce for 2006-2016, by major field.
SOURCE: NRC analysis.
to the question of whether the projected workforce will be adequate. In 2003, total U.S. funding for biomedical research—from the NIH and other government sources, industry, and foundations and other private sources—totaled $75.5 billion.2 If this were distributed equally among Ph.D.s in the three major fields combined, research funds would amount to $232,000 per researcher. The 2006 total of $93.4 billion would imply $262,000 per researcher in that year. This was an apparent increase in funds per researcher of 13.3 percent in three years, but, if one adjusts for rising research costs (using the Biomedical Research and Development Price Index3), the increase is reduced to a trivial 0.4 percent. In this period at least, workforce growth and research funding kept pace with each other.
This may not always have been the case. From 1994 to 2003, total U.S. research funding grew at an annual rate of 7.5 percent (adjusted for changing research costs).4 Figure D-39 shows this earlier trend (expressed as an index, with 2003 levels set to 100), distinguished from the trend since 2003 because data sources differed and gave somewhat higher estimates. In 1994-2003, the U.S.-trained biomedical workforce grew at a rate of 3.5 percent, and the clinical workforce at 5.5 percent. Foreign-trained researchers might have made up the gap, but we do not have adequate data before 2001 to determine this. That some correspondence was maintained between research funding and the workforce is suggested by the fact that funding, in the 1994-2003 period, shifted to some degree from basic biomedical research to clinical research,5 at the same time that the clinical workforce appeared to be growing faster than the biomedical workforce (at least where U.S.-trained Ph.D.s are concerned).
Whether projected workforce growth keeps pace with research funding depends on the trend in funding. Biomedical Ph.D.s are projected to increase 4.8 percent from 2006 to 2016, clinical Ph.D.s, 4.5 percent. Both these estimates are lower than the annual funding growth rate (adjusted for research costs) of 7.5 percent in 1994-2003 but higher than the more recent growth rate of 3.4 percent in 2003-2007. Since the 3.4 percent rate predates the great recession, one might expect funding growth up to 2016 to slow even further. The additional $8.6 billion from the American Recovery and Reinvestment Act of 2009 provides a short-term boost for 2009 and 2010,6 but even adding $4.3 billion more for every year thereafter on top of an annual 3.4 percent increase would raise the funding growth rate only to 3.7 percent.
The implication appears to be that growth in the biomedical and clinical workforces will somewhat exceed growth in research funding, if funding growth (in real rather than constant dollars) follows or falls short of the growth rate for 2003-2007. The reverse situation, where funding grows faster than the workforce, may be understandable, but diminishing research funding per capita would seem to be an uncomfort-
|
2 |
Dorsey, E.R., et al. 2010. Funding of U.S. biomedical research, JAMA 303(2):137-143. |
|
3 |
National Institutes of Health, Office of Budget. 2010, Biomedical Research and Development Price Index (BRDPI). Available at: http://officeofbudget.od.nih.gov/gbiPriceIndexes.html. |
|
4 |
Moses, H. III, et al. 2005. Financial anatomy of biomedical research. JAMA 294(11):1333-1342. |
|
5 |
Ibid., pp. 1336-1337. |
|
6 |
This includes $8.2 billion for the NIH for extramural scientific research and $0.4 billion for AHRQ for comparative effectiveness research, according to NIH, 2010, PowerPoint presentation on NIH Implementation of ARRA, available at: http://grants.nih.gov/recovery/. |
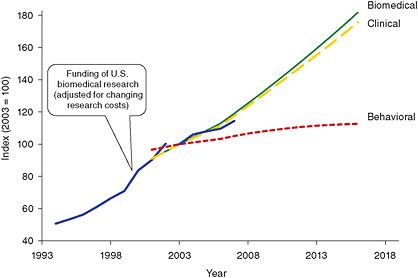
FIGURE D-39 Index of research funding compared with indexed past and projected growth of the research workforce (2003 = 100).
SOURCES: Moses, H. III, et al. 2005. Financial anatomy of biomedical research. JAMA 294(11):1333-1342; Dorsey, E.R., et al. 2010. Funding of U.S. biomedical research. JAMA 303(2):137-143; and NRC analysis.
able situation. In the low scenario, growth in these two fields is reduced to 3.8 and 3.6 percent annually, which is closer to the expected trend in funding growth if it follows 2003-2007 rates but could still be higher than recession-affected rates. Behavioral Ph.D.s are excluded from this calculation because so much of the funding—from pharmaceutical, biotechnology, and medical device firms—is likely to involve at best limited behavioral research. (These three types of firms accounted for almost 60 percent of research funding in 2007.) However, if one included behavioral Ph.D.s, combining the medium projections for the three fields, the projected workforce growth rate of 3.5 percent annually for 2006-2016 would also be closer to the recent funding growth rate.
Should the research workforce grow more slowly than projected, one possibility would be slower growth in foreign-trained Ph.D.s. The large role of foreign-trained Ph.D.s in the workforce (other than in the behavioral sciences) is probably predictable from research funding patterns. U.S. funding for biomedical research represents 70-80 percent of global funding.7 We do not have data on the global workforce in these fields, but of science and engineering researchers worldwide, U.S. researchers make up only 25 percent.8 The probable mismatch between providing so much of the research funding and possibly a smaller share of researchers could help explain why large numbers of foreign researchers are entering the workforce. Their numbers could understandably decline should U.S. funding increase at a slower pace than elsewhere.
Projection Accuracy
The accuracy of these projections cannot be determined prospectively. We can, however, make two types of comparisons: of these projections with projections from other sources and of earlier projections that used the current methodology with subsequent survey estimates.
Alternative projections have been produced by the Bureau of Labor Statistics9 (BLS), as part of a regular program that produces 10-year projections for all occupations and industries. Comparisons with BLS projections are not straightforward because occupational classifications differ. The closest to our categories of biomedical and clinical scientists (who as earlier noted numbered 190,000 and 40,500, respectively, in 2006) are their categories of biological scientists and medical scientists (95,000 and 114,200, respectively, in 2008). The BLS subcategories are too limited to allow sorting into biomedical and clinical groups, and the categories include some without Ph.D.s. But totals at least are close, and we make comparisons of both BLS categories against both of those used here.
For 2008-2018, BLS projects much slower growth in numbers of both biological and medical scientists than we project for 2006-2016 for biomedical or clinical scientists. Whereas we project annual growth rates of 4.5-4.8 percent,
|
7 |
Dorsey et al., op. cit., p. 141, citing Schweitzer, S. O. 2007. Pharmaceutical Economics and Policy. New York: Oxford University Press. |
|
8 |
American Association for the Advancement of Science. 2008. Guide to R&D funding data—International comparisons. Available at: http://www.aaas.org/spp/rd/guiintl.htm. |
|
9 |
Bureau of Labor Statistics. 2010. National employment matrix. Available at: http://www.bls.gov/emp#data. |
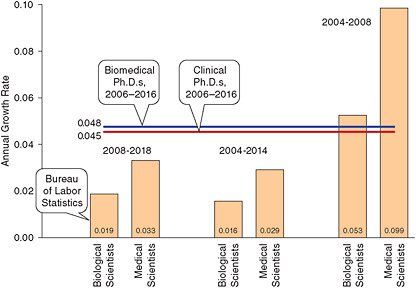
FIGURE D-40 Annual growth rates for biological and medical scientists for various periods from the Bureau of Labor Statistics and current projections for biomedical and clinical Ph.D.s.
SOURCES: Bureau of Labor Statistics data downloaded from www.bls.gov/emp#/data in January 2010; Hecker, D.E. 2005. Occupational employment projections to 2014. Monthly Labor Review 128(11):70-101; and NRC analysis.
BLS projects rates of 1.9-3.3 percent. Could BLS be taking into account the current recession, which is not reflected in the survey data from which we derive projection parameters? One way to investigate this possibility is to see how their projections have changed. A paper10 published in 2005 gives projections for 2004-2014. This paper gives growth rates for their two categories as 1.6 and 2.9 percent, actually less optimistic than the recent ones, so recent economic upsets do not seem to have been a factor in their projecting slow growth. Their earlier projections do give 2004 baseline data, however, which can be compared with the more recent 2008 baseline (Figure D-40). This comparison suggests surprisingly high annual growth rates for 2004-2008 of 5.3 and 9.9 percent. For whatever reason, BLS appears to project far slower growth for these occupations than is actually reflected in the base data they use for their projections. Our projections look much more reasonable in comparison, and the fact that they are lower than the 2004-2008 rates could be justified by the potential impact of the great recession.
BLS categories for behavioral scientists are even more difficult to match with ours. We combine the BLS categories of psychologists, sociologists, and anthropologists, recognizing that the “most significant” source of personnel in some of these categories is individuals with a master’s rather than a doctoral degree. The total for these categories is 180,900 in 2008, much greater than our 125,800 behavioral scientists in 2006. (We have excluded speech-language pathologists, who would have added 119,300 to the total.) BLS projects annual growth of 1.7 percent for 2004-2014 and 1.2 percent for 2008-2018 for the combined group, in contrast to our 0.9 percent for 2006-2016 (Figure D-41). The BLS projections, in this case, indicate faster growth than our projections, but its 2004-2008 data actually show annual change of –1.1 percent. As with biomedical and clinical scientists, our projections differ from the BLS’s in the direction of relatively more acknowledgment of past trends.
Have projections such as those made here been accurate in the past? The 2005 report on national needs11 contained similar projections for 2001-2011. From this series, projections up to 2006 can be compared with the 2006 survey results, although this is not a simple matter. The 2001 survey did not count foreign-trained Ph.D.s, who had to be estimated previously and were reestimated in the current exercise from later data. The 2006 survey undercounted the foreign-trained, and immigrants arriving since 2000 had to be estimated and added. We make the comparisons nevertheless in Figure D-42. The growth rates projected in the 2005 report were too low for biomedical scientists, too high for clinical scientists, and slightly too high for behavioral scientists. The range between high and low projections was
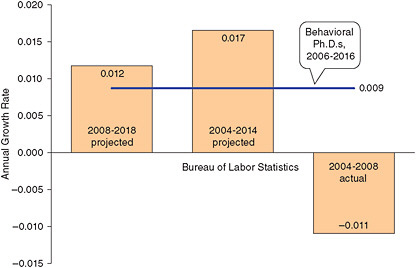
FIGURE D-41 Annual growth rates for psychologists, sociologists, and anthropologists for various periods from the Bureau of Labor Statistics and current projections for behavioral Ph.D.s.
SOURCES: Bureau of Labor Statistics data downloaded from www.bls.gov/emp#/data in January 2010; Hecker, D.E. 2005. Occupational employment projections to 2014. Monthly Labor Review 128(11):70-101; and NRC analysis.
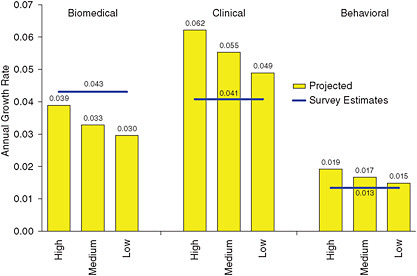
FIGURE D-42 Workforce annual growth rates, 2001-2006, as previously projected and as derived from surveys, by major field.
SOURCE: National Research Council. 2005. Advancing the Nation’s Health Needs. Washington, DC: The National Academies Press; and NRC analysis.
apparently not wide enough to encapsulate actual (or at least estimated) trends.
The 2005 biomedical projection may have been too low mainly because foreign-trained Ph.D.s were estimated from 1993 survey data and projected forward to 2001 to provide the base for a further projection to 2011. The substantial increase in immigrants in 1999 and 2000 was therefore not factored into the projection. The errors regarding the clinical projection, in contrast, may involve the size of the group, which is relatively small and was fast growing, with considerable year-to-year volatility.
One implication that should be drawn, clearly, is that the
alternative high and low projections here should not be taken to represent the limits of possible future variation. They are not based on the most extreme trends in past data and should not be taken to represent the extreme future possibilities, but are rather alternatives that depart somewhat modestly from the main scenario. A second implication is probably that better, up-to-date data are needed on foreign-trained Ph.D.s.
CONCLUSION
Projecting the research workforce in three major fields—biomedical, clinical, and behavioral—indicates that each faces different prospects. This variation in prospects is visible from a close examination of survey data on the workforce and on graduates. Running projections serves to confirm and concretize conclusions that might be drawn from such an examination.
The biomedical research workforce has grown rapidly, particularly in recent years. From 2001 to 2006, it expanded 24 percent, adding 37,000 scientists. The behavioral research workforce, in contrast, grew only 7 percent in the same period, adding only 8,000 scientists. The clinical research workforce is much smaller than the other two, in total only slightly larger than the 2001-2006 increment in the biomedical workforce. It grew almost as fast as the biomedical workforce, at 23 percent.
Reflecting this recent history, the biomedical workforce is projected to grow, over a decade from 2006 to 2016, by 61 percent, the clinical workforce almost as fast at 58 percent, and the behavioral workforce by an anemic 9 percent. Slow growth in the past has gone with less volatility, and alternative projections for behavioral and clinical scientists show less variation than alternatives for biomedical scientists.
Among those with U.S. Ph.D.s, behavioral scientists were almost as numerous as biomedical scientists in 2006, and actually more numerous up to 2001. However, behavioral Ph.D. graduates of U.S. universities have hardly changed in number since 1990, a period during which biomedical Ph.D. graduates have increased strongly. In addition, and just as crucially, foreign-trained Ph.D.s are far more numerous in the biomedical field than in the behavioral field and are also increasing.
The biomedical workforce could therefore be more strongly affected than the behavioral or clinical workforces by an interruption in immigrant flow. In the most extreme situation modeled, immigration would cease in 2010, and none of the U.S. Ph.D. graduates who are temporary residents would stay in the U.S., beginning with the 2008 cohort. Under these conditions, the decadal increment to the biomedical workforce would drop from 116,000 to 28,000—which would still be double the highest projected increment to the behavioral workforce. For the biomedical workforce to actually decline by 2016, a still more extreme situation would have to be imagined, such as, in addition, the departure of all foreign-trained Ph.D.s now in the United States. They were a third of the biomedical workforce in 2006, and their departure, together with a halt to immigration, would reduce the 2016 biomedical workforce by 42,000 from its 2006 level.
An increasing proportion of U.S.-trained Ph.D.s in the workforce are female. In the U.S.-trained clinical workforce, they have been the majority since 1994, and in the behavioral workforce, they became the majority around 2004. In both cases, their majority is projected to become larger. In the biomedical field, they are still the minority. Although they will remain so until 2016, the gap will narrow, with the sex ratio falling from 183 males per 100 females in 2006 to 146 in 2016. In the biomedical workforce as a whole, however, the gap will be greater, because women are a smaller minority among foreign-trained Ph.D.s, both in the biomedical and clinical field, although not in the behavioral field. Even among the foreign-trained, however, the sex ratio appears generally to be falling.
The workforce will almost certainly age in the slow-growing behavioral field, where the proportion 55 years and older will reach 44 percent by 2016. Whether the workforce will also age in the other two fields is less clear, since an increase in the smaller proportions 55 years and older is to some extent balanced by increases in the proportions under age 35.
Will sufficient research funding be available for the projected workforce? For 2006, total U.S. biomedical research funding, from government, industry, and foundations, was $93.4 billion, or $262,000 per scientist in the three major fields combined. Real growth in funding, from 2003 to 2007, was 3.4 percent annually. If the growth rate stays at this level (or declines because of recession), funding growth will be slower than the projected growth of the biomedical or clinical workforces, which will be more than 1 percentage point faster.
How accurate projections of this sort can be, drawing on data and trends that predate the economic crisis, it is not possible to say. It may take a while for data to emerge that would permit more confident projections.


