
3
Technology Readiness
A major hurdle to the mass deployment of renewables in China and the United State is their relatively high cost. Both countries are working to reduce those costs and, over time, have developed strategies to overcome that hurdle by taking advantage of each country’s unique circumstances—namely, U.S.-led innovations have contributed to improved performance for a variety of technologies, and more recently, China’s entry into the manufacturing space has helped reduce product costs for wind turbines and PV modules.
In this chapter, several technologies for renewable electricity generation and the technological readiness of the electrical system for increasing the share of energy from renewables are described. This is followed by an overview of the salient technological changes that might affect the widespread proliferation of renewable energy in both countries. This chapter does not analyze costs of each type of renewable generation, but these costs are analyzed in some detail in NAS/NAE/NRC (2010a) Chapter 4. Renewable power system costs are dynamic and highly influenced by location-specific conditions (e.g., quality of the resource, availability of transmission). “All-in” cost analysis should include all items required to reliably serve customer load with the generation resource, such as: the direct capital and operating costs of the renewable generation resource; costs for required transmission; and costs of other incremental resources required to integrate the renewable generation resource into the overall grid system (e.g., balancing services or backup generation). These are typically reflected in the levelized cost of electricity (LCOE) for a given project. Ultimately, it is the LCOE that must be competitive with alternative sources of power, and this competitiveness is influenced by the factors listed above, as well as the projected costs for fossil-fuel generation.
WIND POWER
Wind power generation involves using wind turbines to generate electricity from the kinetic energy of moving air. This mature technology has achieved good economic performance and is ready for widespread implementation.
Status of Technology
Many of the negative perceptions about wind power are based on early-generation wind turbines. Modern turbines have technological improvements to control low-voltage ride-through and output/ramp rate and provide volt-ampere-reactive support. With these capabilities, turbines can remain connected to the grid during voltage disturbances, mitigate their draw on the grid’s reactive power resources, and maintain continuous real-time communications and data exchange with the control area operator.
Wind farms in the United States generated an estimated 70,760 GWh of electricity in 2009, which represented about 1.2 percent of the U.S. electricity supply (EIA, 2010c [Renewable Energy Consumption and Electricity Preliminary Statistics]). The U.S. wind power capacity spans 34 states and totaled 33.5 GW of capacity in 2009 (EIA, 2010d). At the end of 2009, there were approximately 300 GW of proposed capacity additions in transmission interconnections queues, nearly nine times current installed capacity, although not all of these projects are likely to be installed (Wiser et al., 2010). The state of Texas is currently home to two of the largest wind farms in the world—Roscoe Wind Farm (780MW) and Horse Hollow Wind Energy Center (735MW).
China has the largest industry and market for mini- and micro-wind generators in the world. From 1983 to 2009, 609,039 small- and medium-sized turbines were produced in China. In 2009, 34 manufacturers produced 100,318 sets, of which 47,020 were exported (CWEA, 2010). China set initial goals of 5 GW of installed wind capacity by 2010, and 30 GW by 2020 (NDRC, 2007). The 2010 goal was quickly revised to 20 GW, and China still reached the goal a year earlier than planned (2009 instead of 2010) and more than doubled its installed capacity from 2008 to 2009 (12.2 GW to 25.8 GW) (CWEA, 2010). The latter goal of 30 GW will likely be reached by the end of 2010, and the revised 2020 goal of 100 GW installed capacity may be further revised to 150 GW. To put this in perspective, global installed capacity as of 2009 was 158 GW (GWEC, 2010), and China would annually be installing capacity that is greater than total installed capacity of the UK, Portugal, and Denmark (as of 2009). To achieve this goal, China will have to expand its production capabilities to produce not only 1.5 MW units, but also 3 to 5 MW units. Figure 3-1 shows how wind deployment has evolved over the years in the United States, China, and the rest of the world.
One aspect of wind energy projects that must be taken into consideration is the capacity factor, that is, the measure of a wind turbine farm’s productivity. In the United States, the capacity factor increased from 22 percent for projects
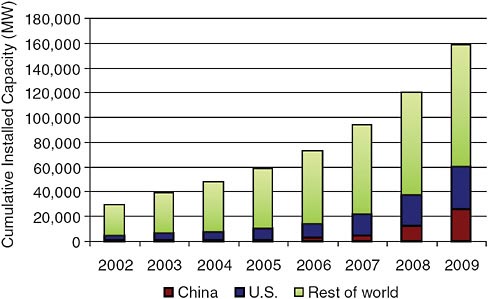
FIGURE 3-1 Deployment of wind turbines in the United States, China, and the rest of the world. Sources: AWEA, 2009, 2010; GWEC, 2010.
installed before 1998 to roughly 30 to 33 percent for projects installed from 1998 to 2003 and roughly 35 to 37 percent for projects installed from 2004 to 2007 (DOE, 2008a). The increased capacity factor is partly the result of a better understanding of wind resources and their availability.
Another aspect to consider in wind deployment is that most wind resources are relatively far from urban centers and other sources of electricity demand. In the United States, wind resources are particularly abundant in the Midwest; in China, the strongest winds blow in the Inner Mongolia region. Further deployment of wind resources must therefore be concurrent with the development of the transmission and distribution system, particularly the deployment of low-loss, high-voltage transmission lines (750 kV and higher).
Compared to Europe, the deployment of offshore wind turbines in the United States and China has been somewhat slow. Nine projects are in various stages of development in U.S. state and federal waters, but in addition to technical risks and high costs, the projects have been slowed by social and regulatory challenges (DOE, 2008a; NAS/NAE/NRC, 2010a; Wiser et al., 2010). China is interested in offshore wind development but faces the additional hurdle of deploying wind turbines that are resilient to typhoons and other severe weather events, because their most abundant offshore wind resources are in coastal areas prone to typhoons. This is partially reflected in the standards being discussed in China for turbines suitable for extreme weather conditions (typhoons and cold/ice conditions).
In June 2010, 34 wind turbines in the Shanghai Donghai Daqiao wind farm were brought on-line in China’s (and Asia’s) first offshore wind project, totaling 102 MW of installed capacity. China will begin an offshore wind power concession program in late 2010, and there are plans for two additional offshore projects of 300 MW each and two more inter-tidal projects (at depths of less than 5 m of water) totaling 200 MW each (CWEA, 2010).
Key Technological Opportunities
Goals for improved turbine components include building taller towers and larger rotors, developing better power electronics, and reducing the weight of equipment at the top of the turbine and the cables coming down the tower. Improvements in rotor technology might be achieved with airfoil-shaped rotors instead of designs based on helicopter blades. Efforts have also focused on improving gearboxes by incorporating more rare-earth, permanent magnets in the generator design and investigating single-stage drives with low-speed generators and distributed drive trains with a rotor to power several parallel generators. To improve the tower design, some researchers are investigating the potential of self-erecting towers and on-site blade manufacturing.
For onshore facilities, once the prime high wind speed sites are developed, more attention is likely to turn to sites with lower wind speeds (NAS/NAE/NRC, 2010a). Efficiently harnessing energy at lower wind speeds will likely require taller towers and larger rotors made from lighter, stronger materials. Table 3-1, from the DOE (2008a) study, summarizes these and other incremental improvements currently under consideration.
Summary of Wind Power Technological Assessment
The United States leads the world in installed capacity, although deployment in China is expanding rapidly and outpaced U.S. deployment in 2009. Although technological breakthroughs are unlikely in the wind energy sector in the short term (out to 2020), incremental improvements are certain to occur. Likely breakthroughs in wind technology are more for offshore wind turbines that must be resistant to the harsh marine environment and extreme weather events. In 2010, a U.S. company (American Superconductor Corporation) and Chinese company (Dongfang) established a partnership to jointly design and develop a next-generation 5 MW offshore wind turbine.
Ongoing deployment, increased manufacturing capability, and incremental improvements in component technologies are likely to drive down the cost of wind turbines in both the United States and China. It is significant to note that no enhancing technologies in particular are necessary for wind to provide approximately 20 percent of U.S. electricity generation (DOE, 2008a). However, concurrent with the deployment of turbines, there will have to be an emphasis on
TABLE 3-1 Potential Advances in Wind Energy Technology
|
Technical Area |
Potential Advances |
Performance and Cost Increments (Best/Expected/Least Percentages) |
|
|
Annual Energy Production |
Turbine Capital Cost |
||
|
Advanced Tower Concepts |
Taller towers in difficult locations New materials and/or processes Advanced structures/foundations Self-erecting, initial, or for service |
+11/+11/+11 |
+8/+12/+20 |
|
Advanced (Enlarged) Rotors |
Advanced materials Improved structural-aero design Active controls Passive controls Higher tip speed/lower acoustics |
+35/+25/+10 |
−6/−3/+3 |
|
Reduced Energy Losses and Improved Availability |
Reduced blade soiling losses Damage-tolerant sensors Robust control systems Prognostic maintenance |
+7/+5/0 |
0/0/0 |
|
Drivetrain (Gearboxes and Generators and Power Electronics) |
Fewer gear stages or direct-drive Medium-/low-speed generators Distributed gearbox topologies Permanent-magnet generators Medium-voltage equipment Advanced gear tooth profiles New circuit topologies New semiconductor devices New materials (gallium arsenide [GaAs], SiC) |
+8/+4/0 |
−11/−6/+1 |
|
Manufacturing and Learning Curve |
Sustained, incremental design and process improvements Large-scale manufacturing Reduced design loads |
0/0/0 |
−27/−13−3 |
|
Totals |
+61/+45/+21 |
−36/−10/+21 |
|
|
Source: DOE, 2008a. |
|||
the implementation of distribution infrastructure to connect areas of generation with urban centers.
SOLAR PHOTOVOLTAIC POWER
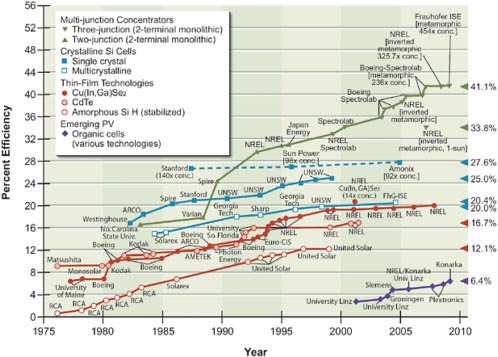
The efficiency of PV technologies has steadily improved in the past 30 years. Today’s commercial modules typically offer 10 to 15 percent conversion efficiency, with China’s Suntech reaching a record 15.6 percent efficiency in 2009, a record eclipsed later that year by a Kyocera module with a reported 17.3 percent efficiency (Green et al., 2010). Research laboratories are producing cells that, although more expensive, achieve efficiencies upwards of 50 percent greater than their commercial counterparts. Figure 3-2 shows the historical progress of the highest reported solar cell efficiencies. It is worth noting that conversion efficiency is not necessarily the primary way to reduce overall costs. In a study of PV cost reductions from 1980-2001, efficiency gains accounted for approximately 30 percent of overall reductions, while manufacturing plant size accounted for more than 40 percent of reductions and other factors, such as lower-cost input materials, had substantial impacts as well (Nemet, 2006).
Status of Photovoltaic Technology
A solar cell generally consists of two layers of materials. The first layer absorbs light, and the second controls the direction of the current flowing through an external circuit. Using different materials or combinations of materials in the first layer of the solar cell produces different levels of conversion efficiency.
Over 80 percent of commercial solar cells are flat-plate PV fabricated with crystalline silicon wafer technology (SolarBuzz, 2010). The typical efficiency of these cells is 12 to 18 percent. Further development will be necessary to increase efficiency and lower production costs (DOE, 2007c). The other main type of PV technology relies on thin films. Typically 1 μm to 20 μm in thickness, thin film cells require only 1 to 10 percent of the expensive semiconductor material used in flat-plate PV and can be fabricated using a relatively low-cost deposition process. These advantages may compensate for their generally lower conversion efficiencies (upwards of 10 percent) (DOE, 2007b). Cadmium Telluride (CdTe) cells represent the largest share of the commercial thin film market, but thin films can also be made with amorphous silicon or “CIGS cells” so-called because they use Copper, Indium, Gallium, and Selenide as their semiconductor metals.
Some of the most efficient solar cells are multi-junction CIGS cells. A triple-junction structure has been shown to have a conversion efficiency of 41 percent at up to 454 suns intensity (Dimroth et al., 2009; Guter et al., 2009). However, cells of this kind are expensive and therefore are not advantageous to use in a panel configuration. Concentrated photovoltaic (CPV) systems can use these more expensive cells because the area required to produce a given amount of power in
these systems is reduced by the concentration ratio (typically between 10 and 50). High-concentration PV (HCPV) systems use two-axis trackers with concentration ratios of 200 to 500. Current research is focusing on enhancing the efficiency of cells using II-VI alloys (Carmody et al., 2010; Du et al., 2010).
Figure 3-3 shows the evolution of PV production from 2000 to 2009 in different parts of the world. It is evident that China has rapidly surpassed PV manufacturing in the United States and is now the largest producer of PV cells in the world by a large margin, although this progress in PV manufacturing has been based, in part, on cooperation with companies and research personnel from outside of China. By the end of 2007, the stock exchanges in New York, London, Hong Kong, Singapore, and China listed about 20 Chinese-owned companies. More factories are under construction, and production capability could reach 8,000 MW by 2010. In attempting to reach this goal, China has increased its silicon production capability from 400 tons(t)/year in 2005 to 4,310 t/year in 2007, and it could reach 44,700 t/year by the end of 2010 (Yan, 2009).
Deployment of PV has not always been proportional to production rates. As shown in Figure 3-4, China’s PV production in 2009 was greater than 10 times its installed capacity, while U.S. PV production was roughly half of installed capacity. China’s trade surplus of PV cells suggests that having access to the international export market is an important factor in its renewable energy strategy. In order to establish a domestic market for PV deployment, China established a PV power concession program in 2010, including 13 PV power station projects ranging in size from 20-30 MW each and 280 MW in total, all in the northwest
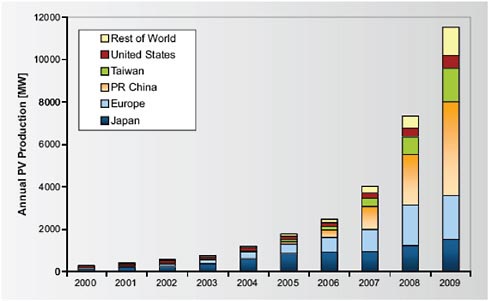
FIGURE 3-3 Production of photovoltaics in the world, 2000–2009. Source: JRC, 2010.
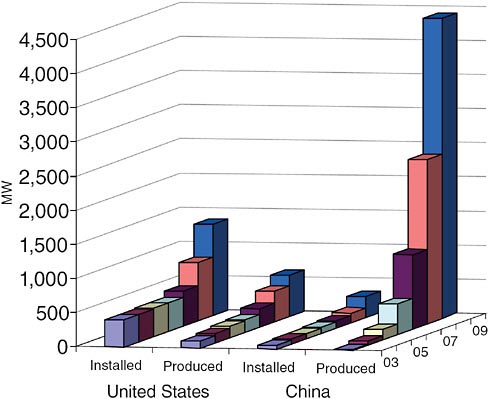
FIGURE 3-4 Annual production of PV modules and cumulative installed capacity of PV in the United States and China, 2003–2009. Sources: EIA, 2010d; JRC, 2009, 2010.
part of the country. Developers are selected by a bidding process. Preliminary prices were low—approximately US $1.4/W for multi-crystalline modules and US $0.15/kWh for electricity generated.
Potential Technology Development
Achieving ultra-low costs in solar technology will likely require a combination of learning-curve-based cost reductions and scaling opportunities, as well as the development of future generations of PV materials and systems to increase efficiency. Thin-film technologies have the potential to bring down costs substantially over current wafer-based crystalline silicon methods because thin-film processes require less material (due to direct band gaps), fewer processing steps, and simpler manufacturing technology for large-area modules. Thin-film technologies are also high throughput and have a continuous production rate, and some technologies require lower temperatures for processing (and thus lower energy inputs). Another advantage thin-film technologies (especially amorphous
silicon) typically display over crystalline silicon panels is a higher energy yield in hazy climates. This is an important factor in coastal areas where PV might be deployed (see Chapter 2 on resource base).
Even lower costs may be possible with plastic organic solar cells, dye-sensitized solar cells, nanotechnology-based solar cells, and other new PV technologies. Organic cells, for example, which can be about 10 times thinner than thin-film solar cells, present opportunities for lower costs because they have low-cost constituent elements, require less material, include materials with high-conversion efficiency, and can be manufactured with high-volume production techniques.
It is interesting to note that reductions in deployment costs could also result from streamlining deployment by capturing efficiencies related to large-scale deployment or from producing lower cost structures that support solar panels (commonly referred to as the balance-of-system and sometimes comprising 50 percent of total costs). Opportunities for cost reductions could also result from a better understanding of the impact of distributed PVs on distribution systems and electricity demand. The performance and operation of existing installed systems could be monitored to provide data for future optimization as the industry expands.
Summary of Potential for Solar Photovoltaic Technology
The level of development of different solar PV technologies varies. Silicon (Si) flat-plate PV technologies are mature and are widely deployed today. China has developed a manufacturing capacity to produce these types of solar cells relatively cheaply compared to the United States. Continued reductions in cell production costs and increases in conversion efficiency and module reliability could make Si PV cells even more attractive to customers. Thin-film technologies, which have great potential to reduce costs, are in a relatively mature stage of development in the United States, although further research and testing are required (NAS/NAE/NRC, 2010a). Other competing technologies, such as dyesensitized PV and nanoparticle PV technologies are at an earlier stage of development and will require further technological improvements before they become commercial.
CONCENTRATING SOLAR POWER SYSTEMS
Concentrating solar power (CSP) systems turn solar energy into high-temperature heat, which is then used to produce electricity or drive chemical reactions (syngas or hydrogen). CSP technologies are categorized by three types, namely parabolic troughs, power towers (also known as central receiver concentrators), and dish-Stirling engine systems (also known as parabolic dishes). The differences between these technologies are in the optical system and the receiver that absorbs the concentrated solar radiation. These differences define the potential
plant size, from the smallest (dish-Stirling concentrator) to the largest (parabolic troughs and power towers).
Status of Technology
The parabolic trough combined with a conventional Rankine cycle uses concave mirrors to focus direct-beam radiation on a linear receiver containing synthetic oil. The heated oil is used to superheat steam, which in turn drives a conventional turbine/generator to produce electricity. These plants can incorporate solar energy storage capabilities (e.g., concrete, molten salt, or thermocline storage) that can extend power generation capabilities for several hours. Solar-to-electric conversion efficiency at these plants typically ranges from 12 to 25 percent, with capacity factors of 26 to 28 percent (not including storage) (NAS/NAE/NRC, 2010a).
Power towers and dish-Stirling technology are similar in that they employ two-axis tracking. Power towers consist of many two-axis mirrors (heliostats) that track the sun and direct the incoming beam radiation to a receiver located at the top of a tower. Dish-Stirling technology uses a two-axis parabolic dish to concentrate solar energy into a cavity receiver where it is absorbed and transferred to a Stirling heat engine/generator (Mancini et al., 2003). There is no large-scale solar dish-Stirling plant at this time to provide operational experience, but annual solar-to-electric efficiencies are expected to be 22 to 25 percent (NAS/NAE/NRC, 2010a).
CSP technologies are now commercially available, with trough systems dominating the U.S. market. Some of the more recent plants for CSP in the United States include the 64 MW Nevada One Plant (developed by Solargenix and operational since 2007), the 1 MW Saguaro Plant in Arizona, and the 5 MW Sierra Power Tower in Lancaster, California. The CSP industry estimated in 2006 that it could provide approximately 13.4 GW of additional peak capacity by 2015, if the market could absorb that much capacity (WGA, 2006a). This was not a projection of demand; it was meant to signal that industry production capacity could meet the needs of a much larger potential market. Signed purchase agreements for CSP were about 4 GW in the United States as of February 2009, but there is probably twice that capacity in planned projects (Mancini, 2009). Some of these large projects—the 250 MW Solana Project in Arizona and the 440 MW power tower project in Ivanpah, California—benefitted from federal loan guarantees in 2010, which allowed them to proceed with construction. Data on CSP projects around the world, including projects that are under development, under construction, and already operational, are being compiled by the International Energy Agency and made available through its SolarPACES program (see solarpaces.org).
CSP in China is still under development. A national program to build a 1 MW experimental solar tower was approved in 2006 and is scheduled for operation in 2010, and solar thermal power has been included in the national renewable
development program. Beyond the 1 MW tower, there is also a 100 MW station planned for 2015 and a 300 MW plant for 2020, and by some estimates China could increase its installed capacity to 100 GW by 2025 (Wang, 2009). Overall, the United States has relatively more experience with this type of technology and therefore could aid in ramping up production of CSP in China.
Key Technology Opportunities
In the short term, incremental improvements in design are likely to drive down costs and reduce uncertainties in performance predictions. Costs could be driven down further as more systems are installed and manufacturers take advantage of economies of scale. In terms of specific components, cost reductions are anticipated for increasing the reflector size of the concentrator (heliostat or dish), low-cost structures, better optics, and high-accuracy tracking. Improvements in receiver technology are also expected.
A key opportunity for improvement is in storage technologies, such as concrete, graphite, phase-change materials, molten salt, and thermocline storage. Molten-salt tanks can provide storage for a number of hours, but improved pumps and valves are likely to lengthen storage time. Molten-salt receivers, which provide storage at about 550ºC to power a turbine, can extend storage time to 12 hours. There are no molten-salt receiver plants in commercial operation today, although the Solar I project in California (a 10 MW pilot plant built in 1981) used molten-salt storage in an updated configuration from 1995 to 1999. Several are planned, however, as part of projects under development in Spain.
BIOPOWER
Status of Technology
The vast majority of biomass-fired power plants operate on a steam-Rankine cycle in which the biomass feedstock is directly combusted to create high-pressure steam that drives an electric generator. With a gaseous fuel, a more efficient turbine engine (operating on the gas-Brayton cycle) can be used, similar to natural gas-fired power plants. A gas-reciprocating engine is also frequently used for small-scale (<5 MW) installations where it is more cost-effective than a turbine engine.
A key difference between dedicated biomass power plants and plants powered by fossil fuels is the size of the power plant. Wood-based biomass power plants (accounting for about 80 percent of biomass electricity) are usually smaller than 50 MW (average size of 20 MW), as compared to the 100 to 1,500 MW range of conventional coal-fired power plants (NAS/NAE/NRC, 2010a). Landfill gas (LFG) power plants have capacities in the 0.5 to 5 MW range, whereas those operating on natural gas are on average about 100 times larger, in the 50 to 500 MW range.
The small size of biomass plants is partly the result of the high cost of shipping low-energy-content biomass. Typical wood has a moisture content of about 20 wt-percentage and an energy content, even after drying, of about 9,780 Btu/lb (18.6 MJ/kg), as compared to about 14,000 Btu/lb (25 MJ/kg) for coal (NAS/NAE/NRC, 2010a). It is worth noting that the heat content for much of the coal used in the United States and China is lower than this unit value (and closer to the unit value for dried biomass), thus making biomass a suitable candidate for co-firing in many locations. As a consequence of their small size, dedicated biomass power plants are typically less efficient than their fossil-fuel-fired counterparts (in the low 20 percent range as opposed to high 30 percent range for coal), because the cost of implementing high- efficiency technologies is not economically justified at the small scale.
LFG power plants can be located directly at the landfill site, which eliminates shipping costs, and the size of the plant is determined by the rate of LFG production, which, in turn, is determined by the overall size of the landfill. Co-location and size matching are also characteristic of biomass power plants operated on black liquor, the lignin-rich by-product of fiber extraction from wood.
Co-fired power plants for which coal is the primary fuel source and solid biomass is the secondary source are relatively large, and therefore enjoy higher efficiencies. With optimal design, co-fired plants can operate over a range of coal-to-biomass ratios, allowing operators the flexibility to adjust the fuel mix based on the lowest-cost inputs (NAS/NAE/NRC, 2010a). Furthermore, co-firing tends to produce lower SOx and particulate emissions and have less ash residue than coal-fired power plants, although NOx emissions can be higher due to the presence of nitrogen in the biomass. Emissions reductions are an important driver for biomass co-firing, and this extends to GHG reductions as well. The emissions profile from co-fired plants depends largely on the specific characteristics of the biomass. In addition, the impact of biomass co-firing on the effectiveness of selective catalytic-reduction technologies is an important issue that must be resolved.
Although municipal solid waste (MSW) contains significant amounts of energy, it is not universally recognized as a renewable fuel source because a large fraction of the carbon in waste products derives from petroleum resources, and storage of that carbon in landfill sites can be considered “carbon sequestration” (NAS/NAE/NRC, 2010a). As a consequence, several U.S. states exclude MSW from their renewable portfolio standards. Nevertheless, the process of MSW electricity production is comparable to a typical biomass power plant, often relying on direct combustion to create steam that subsequently powers a generator.
LFG, the gaseous product that results from the anaerobic decomposition of solid waste, contains about 50 percent CH4, 50 percent CO2, and trace components of other organic gases (NAS/NAE/NRC, 2010a). In contrast to solid waste, LFG is not “sequestered” in the landfill, and the methane that is naturally released is about 20 times as potent as CO2 as a greenhouse gas.
In the United States, biopower use increased substantially after the Public Utilities Regulatory Policy Act (PURPA) of 1978 guaranteed small electricity
producers (< 80 MW) would purchase surplus electricity at a price equal to the utilities’ avoided cost of producing electricity. The passage of PURPA, along with various state incentives, resulted in a three-fold increase in grid-connected biopower generating capacity from 1980 to 1990. The certainty of these contracts propelled industry investment to $15 billion dollars and the creation of 66,000 jobs (Bain et al., 2003). However, by the early 1990s, the biopower industry began to stall for many reasons, including increased costs for feedstock because of inadequate infrastructure and the absence of explicit accounting for the environmental benefits in utility regulation or market costing and much higher new generation costs compared to natural gas combined cycle. In addition, avoided-cost contracts signed under PURPA (contracts that required utilities to purchase renewable power from independent producers at the cost of what the utilities would have spent to build new fossil plants) were expiring, and utilities were unsuccessful in petitioning to buy back the contracts.
In recent years, biomass has accounted for about 10 percent of renewable electricity capacity in the United States, second only to hydroelectric power (see Table 1-1). In 2007, the generation capacity of 10.72 GW came from about 7 GW of forest product residues and agricultural industries, and about 3.75 GW from MSW residue.
The use of LFG for electricity production can be expected to increase in the near future, because it not only yields electricity in settings close to demand points (i.e., urban areas), but also reduces the release of methane, an extremely potent greenhouse gas (NAS/NAE/NRC, 2010a). As of July 2010, approximately 518 LFG energy projects were operational in the United States. These projects generate approximately 12 billion kWh of electricity per year (and deliver 285 million cubic feet per day of LFG to direct-use applications), amounting to just under 20 percent of biomass electricity generation. The Environmental Protection Administration (EPA) has identified approximately 520 candidate landfills with a total annual electricity generating potential of 10 billion kWh (EPA, 2010).
China had 3.14 GW of biomass power generation capacity at the end of 2008, including: 1.7 GW bagasse, 603 MW waste combustion, 592 MW non-waste direct combustion, 173 MW biogas combustion, 50 MW rice mill (small-scale off-grid systems), and 18 MW biomass gasification. The costs for power generated at these plants is typically not competitive with coal-fired power, but it is worth noting that between 30 and 50 percent of the costs of biomass power generation are in the transportation and storage of biomass feedstocks. China’s first direct combustion biomass power plant was commissioned in late 2006, and growth in this sector has been rapid. From 2004 to 2007, the Chinese government approved approximately 87 biomass power plants with a combined capacity of 2,200 MW, and in 2008 over 600 MW of capacity was installed.
Biomass gasification for power generation is a technology suitable for China—the Chinese Academy of Sciences developed a circulating fluidized bed gasification facility that is currently operational. This initial project, which uses
a gas engine-driven generator, has an installed capacity of 5.5 MW and was completed in 2006. Four additional projects are complete or nearing completion and will total 18 MW of installed capacity. By contrast, electricity generation from biogas has developed rapidly in China since 2005. Of the 173 MW of installed capacity noted above, 79 MW make use of waste streams from light industries (e.g., breweries and distilleries, paper mills), 45 MW use MSW and LFG, and 31 MW use biogas from livestock.
As mentioned above, biomass is also used for co-generation in thermal power plants, and for this reason it accounted for almost 50 percent of the U.S. renewable energy supply in 2005, the largest single source of renewable energy (EIA, 2007b). Co-generation has been slow to develop in China, primarily because of problems related to biomass supply measurement and regulation, which has impeded any attempts at subsidies. Two pilot projects currently exist, firing 20 percent biomass, with plans to increase the ratio to 80 percent.
Potential Technology Development
In the short term, technology improvements are likely to relate to biomass power plant design to ensure fuel flexibility, particularly in co-fired plants (NAS/NAE/NRC, 2010a). This will require fuel-feed and emissions-control systems that can be adapted to a range of biomass feedstocks. Fuel-mixing strategies include premixing coal and biomass in a single feed system or providing separate coal and biomass inlets.
Technological developments in the medium term are likely to focus on a pretreatment step that converts biomass to a gaseous or liquid fuel, which is more suitable than solids for power generation. Solid fuels cannot be directly used in gas turbine engines, which have relatively high operating efficiencies; thus the fuel must be converted to a gas or liquid using a method generically called gasification. Lower cost, high-temperature materials for both steam engines and gas turbines are also potential areas for development (NAS/NAE/NRC, 2010a).
Potential long-term breakthroughs in biopower could come from direct conversion to clean fuels (NAS/NAE/NRC, 2010a). Essentially, the high-temperature catalytic steps of gasification or pyrolysis would be replaced with ambient-temperature steps using bacteria, and the resulting biogas would be fed into an internal combustion engine to produce electricity or used directly for heating and cooking.
GEOTHERMAL POWER
Existing geothermal facilities typically produce electricity with hydrothermal resources (hot water or steam) accessible within 3 km of the Earth’s surface. These facilities operate 90 to 98 percent of the time and can therefore provide base load electricity. Although the use of this technology is expected to increase modestly,
a more aggressive deployment scenario may be possible if heat stored in deeper layers of Earth’s crust can be extracted. Research continues on this early stage technology, commonly referred to as enhanced geothermal systems (EGS) or “hot dry rock.” One approach for EGS is hydraulic stimulation. As one example, the Iceland Deep Drilling project plans to access a high-temperature (400 to 650 ºC) hydrothermal resource 4 to 5 km deep in the Krafla, Hengill, and Reykjanes geothermal fields (Stefansson et al., 2008).
Status of Technology
Geothermal steam plants either use steam directly from the source to directly drive a turbine or use flash plants to produce steam by depressurizing hot water from the source (175 to 300ºC). Binary-cycle plants convert geothermal waters (normally from 90 to 175ºC) to electricity by routing the hot water through a closed-loop heat exchanger, where a low-boiling-point hydrocarbon, such as isobutane or isopentane, is evaporated to drive a Rankine power cycle. Lower temperature reservoirs are far more common than steam reservoirs, so binary plants are more prevalent than steam plants. Also, binary plants can be located in areas with limited water resources. In addition, the cycle is self-contained and, therefore, produces no emissions other than water vapor.
If successfully exploited, EGS could recover the vast thermal energy stored at depths of 3 to 10 km. However, there are still technical and economic challenges to the widespread implementation of EGS because of the required drilling depths, the low permeability, and the need for reservoir enhancement.
The world’s overall installed geothermal power capacity is 10,500 MW, which generates about 70,000 GWh of electricity worldwide. The United States has the largest installed geothermal energy capacity and represents nearly one-third of global geothermal power generation capacity. The United States also has the largest installed capacity.
Increases in conventional hydrothermal electricity are expected, primarily in the western United States. The Western Governors Association assessed the potential for new development of about 140 known, accessible geothermal sites and concluded that the western states share an untapped capacity of 5.6 GW that could be developed within 10 years (WGA, 2006b). The U.S. Geothermal Energy Association (GEA, 2009) has identified more than 100 geothermal projects under development in 13 states that represent more than a doubling of conventional geothermal capacity by 2020. No additional technological developments are necessary to tap into these resources, although advances in exploration and resource assessment could have an impact on the development of new plants (NAS/NAE/NRC, 2010a).
Although China is a world leader in use of low-temperature geothermal energy resources (for heating and cooling), it has limited experience with geothermal power generation. China’s largest geothermal power plant, in Yangbajing, Tibet,
has eight double-flash units and a total capacity of 25.2 MW (Wang and Zhang, 2008). Another plant with capacity of 48.8 MW is under construction in Yunnan province. Government targets for geothermal power are modest—100 MW capacity by 2010 and 500–1,000 MW by 2050, although these estimates do not reflect the potential of technological advances in EGS.
Key Technology Opportunities
The primary technical challenges of EGS are accurate resource assessment and understanding how to reliably achieve sufficient connectivity in fractured rock to yield commercially feasible, sustainable production rates. Other issues to be resolved include potential risks of inducing seismicity, land subsidence, and water requirements. Modeling analysis shows a large capability for EGS wells to yield significant heat (MIT, 2006). However, given the depths, experience and success in developing EGS wells at sufficient flow rates in the field have been limited.
Technology is not a major barrier to the development of conventional hydrothermal resources, but improvements in drilling and power conversion technologies could lead to cost reductions and more reliable systems. There are many ways in which EGS technology can by improved and better understood. Based on EIA projections of electricity prices, successful implementation of EGS will require sustained production of 80 kg per second (equivalent to a productive hydrothermal reservoir) at a temperature of 250 ºC and generation of about 5 MW per well (DOE, 2007a).
There might also be challenges to drilling, because geothermal resources are typically found in crystalline rocks, as opposed to the much softer sedimentary rocks targeted for oil and natural gas exploration. There is also significant uncertainty in the flow rate and heat flux that can be achieved in an enhanced reservoir.
HYDROPOWER
Conventional hydropower is one of the least expensive sources of electricity. Converting energy stored in flowing water to electricity can be done with conventional hydroelectric technologies, as well as emerging technologies that can extract energy from ocean tidal currents, wave energy, and thermal gradients. Currently, the largest source of renewable electricity is energy captured from freshwater rivers (known as conventional hydroelectricity or simply hydropower). Hydropower is an important component of electricity generation in both the United States and China. China’s Three Gorges Dam, the world’s largest hydropower plant, has a capacity of 21.5 GW of power. Another generating station planned for 2011 will bring the Three Gorges Dam capacity to 25.6 GW. As of 2008, China’s hydropower capacity was approximately 172 GW, corresponding to 17 percent of its overall electricity production. Hydropower capacity in the
United States is nearly 80 GW, representing approximately 6 percent of overall electricity production.
Status of Technology
Most hydropower projects require a dam to back up and control the flow of water, a penstock to siphon water from the reservoir and direct it through a turbine, and a generator to convert the mechanical energy to electricity (NAS/NAE/NRC, 2010a). The amount of electricity produced is a function of (1) the capacity of the turbines and generators, (2) the volume of water passing through the turbines, and (3) the hydraulic head (the distance the water drops in the pen-stock). Categories of hydropower include large, conventional hydropower with a generating capacity of greater than 30 MW, low-head (<65 ft) hydropower with a generating capacity of less than 30 MW, and micro-hydropower with a generating capacity of less than 100 kW.
Although the potential for new dam construction in the United States may be limited, there are opportunities for “run-of-the-river” projects—diverting water from a river, using a flowline and penstock, and returning the water to the river downstream below the powerhouse (Table 3-2). There is also increasing interest in “conduit” hydro projects that use a flowline initially constructed for a non-hydroelectric purpose (such as irrigation) to create hydroelectric power. A small fraction (~3 percent) of the roughly 80,000 existing dams in the United States are presently used to generate electricity (NHA, 2010).
Submerged turbines are used to harness tidal, river, and ocean currents, but there is no single approach to converting the energy from waves into electricity. Approaches include floating and submerged designs that harness energy directly from the impacting wave, and designs that exploit the hydraulic gradient between the top and bottom of the wave to generate power (Minerals Management Service, 2006). The latter design concentrates waves and allows them to overtop into a reservoir, which generates electricity as the water in the reservoir drains out through a turbine.
Ocean thermal energy conversion (OTEC) converts solar radiation to electric power by using the ocean’s natural thermal gradient to drive a power-producing cycle. OTEC pilot plants have been in various stages of demonstration since the
TABLE 3-2 Permit Activity for Hydrokinetic Sources
|
|
Number of Permits |
Capacity in MW |
|
Tidal |
16 |
2,253.846 |
|
Wave |
11 |
469.70 |
|
Inland |
114 |
6,864.225 |
|
TOTAL |
141 |
9587.77 |
|
Source: FERC, 2010. |
||
1970s, and future projects may rely on improvements in offshore platforms to increase the scale of the plants. Power systems could also theoretically exploit the energy of the osmotic pressure difference between freshwater and salt water (i.e., the salinity-gradient), but designs have not yet moved beyond the conceptual stage. Although these unconventional sources of hydropower have substantive amounts of energy, significant technological and cost issues must be addressed before they can significantly contribute to electricity generation (NAS/NAE/NRC, 2010a).
Key Technology Opportunities
Many of the prime sites for large-scale conventional hydropower in the United States have already been exploited, and many of the opportunities for improvement involve mitigating impacts on aquatic wildlife, and in some cases, boosting efficiency at existing sites (O’Donnell et al., 2009). Although no breakthrough technologies are expected, a number of technological improvements for non-conventional hydropower are likely to result from learning opportunities from the implementation of large-scale demonstration projects in the next 10 to 25 years. For example, four 250 kW floating buoys recently placed in Makah Bay, Washington, will be connected to the electricity grid by a 3.7-mile-long submarine cable (Miles, 2008).
Summary of Hydropower Potential
In the United States, the public is increasingly in favor of returning river systems to free-running conditions. Although this is not likely to lead to the removal of major generating facilities, it could impede plans for substantial additions to hydropower stations. In China, despite the potential for several hundred GW of additional hydropower capacity, there are similar concerns about the impacts of large-scale projects. In addition, there are great technological uncertainties about the future of new current, wave, and tidal generators. Demonstrations of marine and hydrokinetic technologies are under way, some of which have been connected to the grid, but no uniform designs have been developed, and no one has long-term experience with these technologies.
MODERNIZING THE ELECTRICITY GRID
Modernizing the electricity grid will make it easier to integrate variable-output renewable sources into the overall power supply. Grid integration will also have other advantages, such as improving security and power quality, creating a capacity for self-healing, and making possible operation at a higher load factor with less risk of thermal overload. In addition, a modernized grid will create a dynamic, interactive infrastructure that will provide real-time power and infor-
mation exchange, and, therefore, will greatly improve demand management. The two main aspects of grid integration, namely storage technologies and so-called “intelligent” technologies, are described in more detail below.
Energy Storage
Energy storage is a rapidly changing space in which new technologies are moving into the commercial arena. Storage technologies are valuable to electrical power systems regardless of the generation resource, but they provide specific attributes that are especially important for systems with large shares of wind and solar. We include a brief overview of potential storage functionality, but do not fully evaluate its uses or its latest technical developments. Fuel cells and hydrogen technologies are not discussed in this section, although fuel cells are commercially available and are capable of catalyzing renewable fuels; hydrogen technologies, although not commercially available, have generated considerable interest as a method of energy storage, particularly as related to fuel cells.
Because large penetrations of renewable electricity from wind and solar (beyond 20 percent) will potentially exacerbate the challenges of load management, developing storage technology can alleviate these challenges. Multiple-hour MW-scale storage can also be used to “shift” the availability of power from solar and wind farms to be better aligned with demand—this is particularly useful for large wind farms that are most productive in late evening hours, when demand is lowest.
Storage is a valuable component of any power system and can provide numerous benefits. Benefits of energy storage include such items as avoided upgrades to transmission and distribution infrastructure, frequency regulation, improved power quality, and avoided GHG emissions (e.g., eliminating the need for coal- or gas-fired backup). The need for storage, or the cost of intermittency, can vary widely based upon a particular region’s pre-existing generation stock, demand/pricing policies, and the degree of fit between renewable generation and load patterns. It will not be necessary to “back up” or augment every variable-output generation source, nor will it be the only option available to manage intermittency.
One way to evaluate energy storage is by a flexibility supply curve. Many sources of flexibility are available in different amounts at different prices, and supply curves differ by region, based on many factors. Typically, the most readily available source of flexibility is competitive wholesale markets—fast markets, slow markets, and price-responsive load markets, for both energy and ancillary services. In areas with no available markets, flexible generation, most often in the form of gas turbine capacity or hydro capacity, is used. The most economical sources of flexibility are generally tried first, and at today’s prices, new energy storage is at the end of the flexibility supply curve.
Storage technologies are characterized in terms of discharge duration vs. power (Figure 3-5) and are typically used for one of three functions: frequency
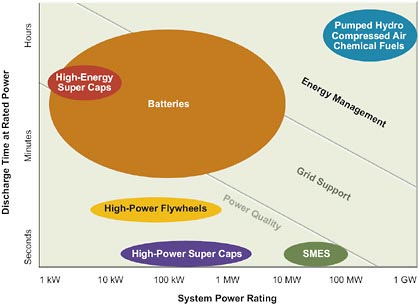
FIGURE 3-5 Capabilities of a variety of storage technologies. SMES = superconducting magnetic energy storage. Source: NAS/NAE/NRC, 2010a.
regulation, stabilization, or load-shifting. Technologies that can discharge energy rapidly are useful in frequency regulation. These technologies include super capacitors (not yet commercial) and high-power flywheels (in commercial use for frequency regulation in the New York and New England control areas of the United States). High-power approaches for multiple-hour energy storage include pumped hydropower, compressed air, some types of batteries, and devices that convert electricity into chemical fuels, such as hydrogen.
Pumped Hydropower
Pumped hydropower storage involves using energy to pump water into a hydropower reservoir and then releasing the water through a turbine when electricity is needed. This is a mature, effective technology and the only significant type of electricity storage in the United States today that can buffer fluctuations in electricity demand and supply. There are currently 40 pumped hydropower storage projects in the United States and as of late 2009, an additional 23 projects had preliminary permits from the Federal Energy Regulatory Commission (FERC), representing 15 GW of capacity. Additionally there are 15 projects, representing another 16 GW of capacity, pending Preliminary Permits from FERC (Miller and Winters, 2009). In 2006, there were 19 pumped hydro stations in operation in China with a generating capacity of 9.27 GW. China plans to have 18 GW by 2010, 32 GW by 2015, and 50 GW by 2020. However, increases in pumped
hydro energy storage in the United States could be limited because of the lack of environmentally acceptable sites and because pumped hydropower is a relatively low-energy-density storage solution.
Compressed Air Energy Storage
Compressed air energy storage (CAES) is a method of storing energy as compressed air, usually in underground, airtight caverns, but sometimes in depleted natural gas fields or above-ground storage tanks. CAES works by converting electricity into mechanical energy in the form of compressed air—when the air is released, it is heated (typically by combusting natural gas) and then used to spin a turbine to produce electricity.
In a diabatic storage process, air is cooled before it enters a cavern and, when electricity is needed, the air is expanded by external heating applied from a modified gas turbine. Because diabatic CAES power plants are in many ways similar to conventional natural gas power plants, the two existing systems in the United States have operated reliably since they were commissioned, and the technology is considered mature (NAS/NAE/NRC, 2010a). New approaches to diabatic CAES systems are directed toward microscale systems that store smaller volumes and capitalize on underground natural gas storage or depleted gas fields.
Adiabatic CAES systems do not require combustion fuels because they store not only the mechanical energy of compression, but also the thermal energy produced when the air is compressed. Electric power generation from an adiabatic CAES system uses the hot air to operate a turbine (in the absence of combustion), which, in turn, operates an electric generator. Although most of the components of these systems are known technologies (Figure 3-5), adiabatic systems have not yet been demonstrated.
Batteries
A battery generally consists of two reactive electrode materials separated by an electrolyte membrane that allows select ions to pass through it. The battery’s ability to be recharged depends on the nature of the reaction at the electrodes. Rechargeable batteries can be composed of a variety of chemical systems—commercially available batteries include lithium-ion, lead-acid, nickel-cadmium, or sodium-sulfur. These compositions have varying efficiencies, ranging between 65 and 95 percent. Sodium-sulfur batteries have proven effective and reliable for charging and discharging over many hours and in megawatt scale, and have thus been candidates for grid-scale applications. Lead-acid batteries are used in China by the hundreds of thousands for distributed grid-connected systems and to support wind and PV power generation in remote areas.
Alternatives to conventional batteries are flow batteries and regenerative batteries. Flow batteries have inert electrodes that simply collect current. The overall
reaction in these batteries occurs between two chemical solutions separated by an electrolyte membrane. The energy capacity is fixed by the storage volume of the reactant solution, rather than by the dimensions of the electrodes as in a conventional battery.
Regenerative batteries, another alternative, are complex systems involving pumps, valves, and corrosive fluids. This makes them difficult to use for portable applications, but they are useful for utility-scale storage especially because the energy storage and energy delivery components of the battery are clearly separated.
It is unclear whether fundamental breakthroughs will bring revolutionary advances in conventional or flow batteries. For example, the energy density stored in gasoline is still much greater than the energy density that can be stored in current lithium-ion or flow batteries. Both the United States and China are actively involved in research, development, and demonstration projects for these types of storage systems. Research in the United States is focused especially on developing batteries for the transportation sector, but there is a growing recognition that batteries for utility-scale electricity storage are also important.
Grid Intelligence (The Smart Grid)
Energy storage is only one technological solution to facilitating the integration of renewables into the electrical grid. Other technologies will be useful to ensure reliability and optimize available renewable energy resources. These technologies will include smart meters (meters that can turn appliances on and off and enable time-of-day pricing), power converters, conditioners, source- and load-control technologies, and improved software for forecasting and operations (Kroposki, 2007).
In general reinstrumenting the grid will increase the available grid information and allow a more realistic scheduling methodology that will in turn provide for better utilization of the existing grid components. These benefits will then cascade from the transmission, distribution, and generation down to the fine tuning of residential, commercial, and industrial loads. In the United States, electricity markets provide some of this information today, but their operation will be greatly enhanced by the information generated in the smart grid.
Although the modern grid is not thoroughly defined as yet, it is likely that it will include devices such as the following:
-
Synchrophasors and other monitoring equipment will be installed to monitor grid status in many locations enabling the recognition of congestion at critical spots across the grid. This will let new, more sophisticated control algorithms to optimally dispatch transmission, generation, and demand resources to resolve congestion. Additionally, the momentum provided by these responsive resources will provide a more reliable grid capable of smoothing the output of an increasing number of volatile generation resources.
-
Smart meters, currently being deployed in the United States, will relay information on pricing and/or grid conditions so that smart resources can respond.
-
Controllers will be installed (many exist today) on many resources to enable them to alter their load profile based on smart meter output. Those may include small generators, motors, pumps, load shifting air conditioners, storage devices, variable speed pumps, and almost any other load that is capable of intermittent or variable operation.
Advanced Metering and Demand Response
Advanced metering (or smart meters) refers to electricity meters that (1) provide the consumer with detailed profiles of electricity consumption and (2) allow for more demand management. Smart meters could help shave peak load by allowing certain devices to cycle off in periods of high demand. Advanced meters would also provide consumers with pricing signals that reflect the real-time availability and cost of energy. This could be especially useful in systems with large wind loads in the evening—devices (e.g., dishwashers) could be programmed to operate only when sufficient wind power is available.
Demand response is a general approach to managing consumer consumption of electricity based on supply conditions and is frequently used by utilities to help reduce peak demand. However, demand response can also be used as an approach to smoothing the integration of variable-output technologies like wind and solar, by reducing load at times of low renewable generation and “dispatching” demand when a resource like wind is available (to reduce the need for curtailment).
Software/Modeling Support
New grid-operating tools will help in the reliable incorporation of renewable energy resources into the electricity grid. Operating models and system-impact algorithms could make the transient and intermittent energy from renewables more manageable. Specifically, software algorithms that can better predict fuel source availability, whether it is wind or solar, and modeling tools for predicting how the system will react both in steady state and dynamic conditions, could help operators adjust to higher penetrations of wind and solar in the generation portfolio. In addition, improved visualization techniques, new training methodologies, and advanced simulation tools could give operators a better understanding of grid behavior.
FINDINGS
In the near term (to 2020), wind, PV, CSP, conventional geothermal, solar thermal applications, conventional and low-head hydro, and some biopower tech-
nologies are technically ready for expanded and accelerated deployment. China has emphasized PV over CSP for planned large-scale power plants, even though CSP has been proven at utility scale (mostly in the United States). CSP could be a suitable technology for large-scale solar energy bases, particularly if it is coupled with low water-use and storage technologies. Wind turbines for onshore deployment have matured and now incorporate technology that addresses past concerns about turbine reliability. These new turbines are therefore ready for large-scale deployment. Continued developments for turbines will include designs for offshore applications that are resilient to storms and typhoons.
Other technologies, particularly hydrokinetic (ocean, wave, and tidal) technologies, look promising as locally available baseload generation options. However, they will require further development. Biomass production has the advantage of reliability, but concerns about land use, especially about replacing food production, must be addressed. Improvements in biomass yields and conversion technologies might lead to liquid fuels.
As both countries continue and accelerate the build out of renewable power generation facilities, it would be highly beneficial if a mechanism can be established to rapidly exchange information. Although learning and cost reductions have already been achieved from deployment in the United States, the rapid growth of renewable energy projects in China is likely to expand learning opportunities. China is now moving ahead of the United States in terms of offshore wind development and has plans to begin deploying next-generation 5 MW wind turbines. Readily available information on these developments could enhance technology evolution and make renewable technologies more accessible globally, especially in developing nations. Cooperation will require settling some potentially contentious issues, such as sharing intellectual property or protected business data, which will be important for continued improvement in renewable technologies.
Unlike fossil or nuclear energy, renewable energy resources must be located at the source of the energy flux they exploit. They are also inherently intermittent, which has complicated their integration into the transmission and distribution system. Issues related to power-system management will become increasingly important as renewable energy provides a larger share of total energy. Ensuring the viability and continued expansion of renewable energy will call for a contemporaneous overlaying of unified “intelligent” electronic controls and communication-system technologies throughout the power delivery infrastructure. Improvements in the grid could not only facilitate the integration of renewable electricity, but could also simultaneously improve system reliability, provide significant capacity and cost advantages, and reduce the need for backup power and storage.
Further deployment of renewables will be more likely as the cost of existing renewable technologies come down as a result of learning and scale opportunities. However, dominant penetration of renewable energy into the electricity system will require technologies that have yet to be developed, or that have yet to become available at sufficiently low cost. In addition, further deployment will eventually
require large-scale, distributed, cost-effective energy storage, new methods of cost-effective, long-distance electricity transmission, and the management of large amounts of dynamic data.
To a large extent, major deployment of renewable power generation is constrained by location and intermittency issues. In addition, technologies to harness these resources are modular (allowing projects to easily be scaled up or down), and some resources are more amenable to distributed and off-grid applications. Given these conditions, it is clear to the committee that China and the United States will need to transform power delivery systems to accommodate and integrate large amounts of variable-output renewable electric power. Both the United States and China are making sizeable public investments (greater than $7 billion each for 2010) in next-generation grid technologies, with China spending nearly 10 times that amount ($70 billion from its economic recovery package) on new high-voltage transmission infrastructure. This presents a tremendous opportunity for China and the United States to learn from one another. Specific issues that deserve attention are grid stability, load management, system flexibility including MW-scale multiple-hour storage, and compatibility with an electrified transportation infrastructure.
In addition, joint efforts could include the analysis of distributed PV options at a regional level (e.g., metropolitan areas) for both countries. A stronger focus on deploying distributed PV could encourage rapid reduction of balance of system cost and make the overall system more cost effective. China is a world leader in integrating solar thermal technologies for direct use in buildings, and there are lessons from this experience that could transfer well to building-integrated PV. Regional analyses would help optimize PV to best meet peak demand and take advantage of existing electrical distribution infrastructure.
RECOMMENDATIONS
-
China and the United States should cooperate on defining the needs and requirements to transform power delivery systems to accommodate and integrate large amounts of variable-output renewable electric power.
-
China and the United States should cooperate in developing large-scale (>50 MW) physical energy storage systems. Both countries have experience with pumped hydro and are currently investigating options to create additional capacity, which could directly benefit large wind and solar farms. The United States could also work with China to develop and demonstrate a compressed air energy storage system (CAES) in China, which currently has no experience with CAES.
-
China and the United States should share information on, and consider conducting a joint analysis of, experiences with the integration of variable-output renewables (e.g., wind and solar) to gain a better understanding of what has been learned about their impacts and to look into approaches by grid operators in both their countries, and elsewhere, to manage these impacts.


