
PARADIGMS OF ENERGY EFFICIENCY’S COST AND THEIR POLICY IMPLICATIONS: DÉJÀ VU ALL OVER AGAIN
Mark Jaccard1
May 15, 2010
Introduction
The issue of the cost of and potential for energy efficiency improvement is of great importance for the global effort to reduce greenhouse gas (GHG) emissions. The global energy system is over 80% dependent on fossil fuels, whose combustion is a major contributor to GHG accumulation in the atmosphere. Shifting, in less than half a century, from fossil fuel combustion to major contributions from renewable energy, nuclear power and carbon capture and storage when using fossil fuels will be less difficult if humanity can simultaneously improve significantly the efficiency with which it produces, transforms and uses energy (Jaccard, 2005).
During the oil price crisis of the 1970s, many energy technologists and efficiency advocates argued that great improvements in energy efficiency are economically efficient, a win-win that would increase profits while reducing energy use. Many economists, however, disputed this claim, arguing that analysis indicating the existence of profitable opportunities for energy efficiency must be overlooking some real, but perhaps intangible, costs for consumers and firms.
In the 1980s and 90s, expectations of high energy prices abated and with them the debate about the cost and potential for energy efficiency. But with rising concerns for GHG reduction, the issue of energy efficiency profitability has re-emerged. The McKinsey (2007) consulting firm has contributed to the issue by producing recent estimates of energy efficiency profitability for the United States and other countries, estimates which imply that substantial reductions of GHG emissions could be realized at little or no cost. Policy-makers who want to reduce GHG emissions are understandably attracted to this analysis as it suggests that such reductions may be cheap and easy. But for energy analysts aware of the history of this debate, it’s “déjà vu all over again.”
In this paper, I provide an overview of the ongoing evidence and arguments with respect to the profitability of energy efficiency and its relevance for the estimated cost of GHG emissions reduction as well as for climate policy design. I begin with a background review of the analysis suggesting the profitability of energy efficiency and the implications for the cost of GHG emissions reduction. I follow with a conceptual model to explain criticisms of this approach and to show how different perceptions of costs and market failures explain the divergent paradigms of energy efficiency profitability. I then describe recent efforts by energy analysts to design energy-economy policy models that bridge the differences between the two paradigms in order to better inform policy-makers. In conclusion, I return to the general question of how energy efficiency analysis might best aid policy makers seeking to rapidly reduce GHG emissions at the lowest possible cost to society.
The Paradigm of Profitable Energy Efficiency
For over three decades there has been an ongoing and at times aggressive debate on the potential for win-win investments that would improve both energy and economic efficiency—in other words, opportunities for profitable energy efficiency. Physicists, engineers and environmentalists, who tend to dominate one side of the debate, repeatedly find substantial opportunities for profitable energy efficiency investments in industrial facilities, buildings, equipment and transportation systems. When asked why such opportunities go unexploited in market economies, these “technologists” point to various institutional, information and financial barriers. In contrast, economists, who tend to dominate the other side of the debate, are instinctively skeptical of claims there is a large, untapped potential for profitable energy efficiency investments. They tend to assume that there must be hidden costs and risks facing firms and households such that these so-called profitable opportunities are exaggerated.
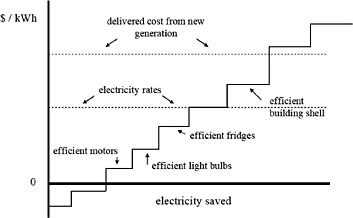
FIGURE C.1 Energy conservation cost curve.
The method to calculate the economic returns on energy efficiency investments was initially developed in the 1970s by researchers seeking to compare energy supply investments with incremental investments in greater energy efficiency that could, in effect, eliminate the need for the supply investments in the first place (Lovins, 1977). Energy efficiency in the electricity sector was especially targeted. By focusing on specific energy services (lighting, space heating, refrigeration, etc.) researchers compared the capital costs of two technologies that provided the same service. The more efficient device usually had higher capital purchase costs. Using a discount rate, the incremental capital costs of the efficient device could be set in a ratio to the discounted stream of energy savings to calculate a life-cycle cost of conserved or saved energy (for example, $/kWh saved with a more efficient fridge).2
Researchers then extended this analysis from a single choice between two technologies providing the same energy service to an estimate of the quantity of energy conservation that is possible throughout the economy for that service if everyone opted for the more efficient device. For each energy service, an estimate is made of the average efficiency of existing equipment stocks. Then, it is assumed that all these stocks could be converted to higher-efficiency models, which results in an estimate of the total amount of energy that could be saved for that particular end-use and the life-cycle cost per unit of conserved energy. The next step is to graph these economy-wide quantities of conserved energy in ascending order of cost, thus providing a total estimate of the energy efficiency potential at each cost level—an “energy conservation cost curve” or “life-cycle cost of conserved energy curve” (Figure C.1).
The energy conservation cost curve provides information about the value of energy efficiency from different perspectives. First, efficiency investments for which the curve is below zero indicate instances where the efficient device has a lower life-cycle cost than the device it would replace. Second, all efficiency investments whose life cycle costs are below current electricity rates are profitable from the private perspective of the firm or household. Third, if rates do not reflect the full cost of delivering electricity from new supplies (many utilities charge prices reflecting average costs rather than the costs of new supply) then those efficiency investments whose life-cycle costs are less than the cost of new supply are also profitable, albeit this time from a social rather than a private perspective.
Life-cycle cost estimates of energy efficiency became extremely influential in the 1980s in the U.S. electric
utility industry, with utility regulators in most states requiring utilities to use this analysis to determine how to apportion their spending between new supply and “acquiring” energy efficiency—the latter referred to as demand-side management (DSM). Since utilities lack the mandate to apply regulations or pricing adders to motivate efficiency investments, the only DSM policies available to them were programs to educate and inform firms and households of profitable efficiency opportunities (labels, audits, advertisements, public engagement campaigns) and some application of subsidies for the acquisition of high efficiency devices. In the policy discussion below, I explain what recent hindsight analyses now suggest about the efficacy of these policies.
The interest in energy efficiency declined in the 1990s with the advent of electricity market reforms that emphasized competition in supply and threatened the ability of monopoly utilities to collect the revenues needed to run DSM programs. Over the last decade, however, interest in energy efficiency has re-emerged as this is one of the few options to reduce energy-related GHG emissions and as the stalled electricity reform movement has left distribution utilities and, in some cases, vertically integrated utilities in a position to continue their DSM efforts.
Moreover, some analysts have applied basically the same life-cycle costing methodology to estimate the costs of GHG emissions reductions investments. In this method, technologies that provide the same service (energy demand or energy supply or some other service in the economy that produces GHG emissions) are compared on the basis of their capital and operating costs using a discount rate to produce life-cycle costs for each technological option. One of the competing options will be a low- or zero-emission technology. An estimate is made of the average emissions of existing equipment stocks for that service, which then provides the basis for estimating the GHG emissions that could be abated by converting all stocks to the low- or zero-emission alternative. These are again graphed in ascending order of cost—cost being defined as the incrementally higher life-cycle cost of switching to the lower-emission alternative—to produce a GHG abatement cost curve. The lowest steps on the curve might even have negative costs if the life-cycle-cost of the low-emission alternative is lower than that of its high-emission competitor.
Whether the curve is for energy efficiency or GHG emissions, this approach of looking at individual energy services and then explicitly assessing the technologies that could meet that service is referred to as “bottom-up analysis” or “bottom-up modeling.” This is in contrast with the analysis and models of most economists, which conventionally do not include explicit representation of technologies.
Figure C.2 shows a recent bottom-up GHG abatement cost curve for the United States produced by the McKinsey (2007) consulting firm. I have overlaid a circle to show that energy efficiency completely dominates the low-cost options for GHG reduction. The energy efficiency analysis in Figure C.1 is closely linked to the GHG abatement cost estimates in Figure C.2, meaning that the analytical approach that produced profitable and low-cost estimates for energy efficiency is equally responsible for the low cost estimates of GHG abatement. In the case of the United States, the graph suggests that about 40% of U.S. GHG emissions could be eliminated by 2030 at a cost of less than $50/tCO2 and that the net cost to the economy is likely to be zero, given the substantial profits from so many of the energy efficiency actions. This is shown in the figure by the shaded area below the line being equal to the shaded area above the line for 3 gigatonnes of reductions—about 40% of total U.S. current emissions.
Debates on the Profitability of Energy Efficiency
While technologists have mostly focused on estimating the magnitude of the profitable energy efficiency potential, they have also been asked to explain why it exists. Their response usually points out the lack of awareness of efficiency opportunities by firms and households (“information barriers”), the difficulty of borrowing money for the up-front costs of an efficiency investment (“financial barriers”), the inadequate level of technical know-how for installing and maintaining high-efficiency devices and structures (“capacity barriers”), and a disconnect between those responsible for investment costs and those responsible for operating costs (“split-incentive barriers”), such as the landlord who pays for appliances and the tenant who pays the electricity bills (Geller, 2003).
In contrast, economists tend to argue that all technology choices face these types of barriers and that even new technologies that are more energy-intensive may face lack of information, financing constraints, inadequate know-how and split-incentives. While economists might agree that some real market failures, like average cost pricing by utilities, or unpriced environmental harms, can be used to justify greater energy efficiency, they would
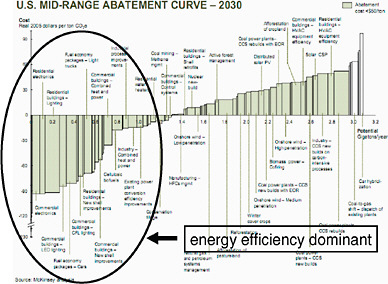
FIGURE C.2 GHG abatement cost curve. SOURCE: Adapted from McKinsey, 2007.
be interested in research that probed the intangible costs and risks that may be associated with acquiring more efficient technologies (Jaffe and Stavins, 1994; Jaffe et al., 1999; Jaccard et al., 2003).
Figure C.3 depicts these two competing perspectives, or paradigms, of the amount of the profitable energy efficiency. The base of the figure is the current level of efficiency, with upward movement indicating an increase in efficiency.
The energy efficiency of individual devices and structures is usually increasing over time. As capital stocks are renewed, the general (but not universal) tendency throughout most of the past several decades has been for firms and households to acquire more efficient devices than the average efficiency of existing stocks. This means that at any given time, a technology survey can find opportunities for energy efficiency, even though these very opportunities will naturally be exploited as devices and structures are renewed over the coming years. In the figure, this natural rate of energy efficiency is depicted as the “baseline efficiency trend,” efficiency that will occur simply through capital stock replacement.
It is possible that society could accelerate this natural rate of stock turnover, but then the cost would be not just the incremental capital cost of a more efficient device, but also some part of the full cost of the existing equipment, since that device was otherwise slated to operate for several more years. When technologists estimate the potential for profitable energy efficiency, they are not usually referring to costly expenditures that prematurely retire existing equipment and structures. Only with a model that provides a detailed representation of the age structure of the capital stock, and its natural rate of turnover, is it possible to estimate how the profitability of energy efficiency is affected by the rate of stock turnover.
Moving up the vector, many economists acknowledge there are market failures that prevent the adoption of energy efficient technologies that would be profitable from a societal or private perspective. From a societal perspective, it could be that the energy prices facing businesses and households do not reflect the emerging cost of providing that energy. This is often found where monopoly electric utilities are regulated to set customer tariffs that energy efficiency dominantenergy efficiency dominant
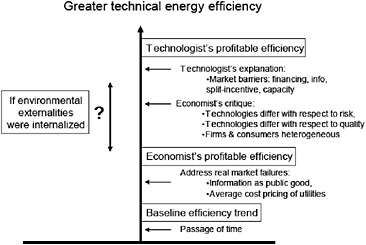
FIGURE C.3 Competing depictions of energy efficiency profitability. SOURCE: Author, inspired by Jaffe et al. (1999).
reflect only the average costs of production and delivery, in order to prevent excessive profits by these monopolies. If the cost of new supply is higher than the average cost, then there could be energy efficiency investments that are not profitable when compared to average costs but are profitable when compared to the incremental costs of producing and delivering new energy supply. Although such an investment is not profitable for a private company or household (given the regulated, average-cost tariffs they face), it is profitable from a societal point of view. Economists recognize that there will be energy efficiency investments that become profitable if average rates are adjusted to reflect the marginal cost of new energy supply.
From a private perspective, there are profitable energy efficiency investments that do not occur because the decision maker is unaware of them. This is what technologists call the information barrier. To the economist, in some circumstances information can be a “public good,” meaning that its social value exceeds the value to any one individual who might provide it for themselves. Because the individual cannot capture all the value from information provision, it tends to be underprovided by the market, hence a “market failure.” Economists are generally willing to recognize the public good market failure associated with information and would thus acknowledge the potential value of efficiency investments that would occur were this information provided. This leads to the “economist’s profitable efficiency” level in the figure.
But there is one caveat. The economist would argue that one should include the “cost of providing information” when estimating the amount of efficiency that is profitable. If, for example, government or a utility must outlay considerable funds, with teams of energy auditors visiting plants, offices and homes, in order to provide information about efficiency potential before it is acted upon, it could be that some of the efficiency potential is not actually profitable when these additional costs are included. The cost of correcting a market failure may be so high that society is better off not to correct it. This is a question for which the answer may change over time as society improves its capacity to disseminate at low cost information about efficiency opportunities.
Finally, economists also recognize environmental externalities as a market failure. If these externalities were priced, this could increase the amount of energy efficiency that is profitable. The size of the efficiency potential depends on the magnitude of the price changes implied by internalizing externalities into prices, which is highly uncertain. This uncertainty is depicted on the left side of the vector by a question mark. It is kept separate from issues on the right side of the vector. This is because the technologist’s argument for profitable energy efficiency is
that its potential is large even when environmental externalities are zero or are completely ignored. If externalities were priced, and did lead to rising energy prices and some investments to improve energy efficiency, the higher prices would also enable technologists to find additional efficiency investments that were now profitable but not being realized.
The top level in Figure C.3 depicts the amount of efficiency that technologists claim is profitable. As noted, the technologist explains the gap between the economist’s position and this upper technologist’s position as the result of market barriers that prevent firms and households from making energy efficiency investments that are otherwise profitable. These barriers include lack of information (without the economist’s qualification that the cost of information provision must be counted), inability to get financing for profitable efficiency investments, lack of capacity in terms of technical know-how for selecting, installing and maintaining efficient technologies, and a disconnect between the efficiency incentive for the user (tenant) but not the acquirer (landlord) of some buildings and equipment.
Many economists suggest, however, that these so-called barriers may simply be a reflection of true differences between technologies in terms of the risks they present and the quality of service they provide. The common light bulb provides an example. To a technologist, an incandescent light bulb and a compact fluorescent light bulb might be considered perfect substitutes if they both produce 700 lumens of light. This allows one to focus on their different capital costs, electricity use and life expectancies when estimating the profitability of acquiring the more efficient bulb. But life expectancy estimates, for example, are usually based on laboratory testing. The risk of a user accidently breaking a light bulb is not considered. In reality, however, the capital cost risks of the two technologies (risk being probability of occurrence multiplied by outcome) is not the same. For while the probability might be the same that a user will accidentally break a light bulb during a given year, the negative outcome (financial loss) in the case of the more expensive, more efficient bulb is likely to be higher than for the cheaper, less efficient bulb. The “expected” (adjusted for risk) capital cost of the compact fluorescent light bulb might be 1.3 times its off-the-shelf cost while the expected cost of the incandescent light bulb might be 1.1 times its off-the-shelf cost. Yet technologists’ energy efficiency studies do not adjust capital costs of efficient technologies to reflect this asymmetric risk.
This risk differential between technology substitutes is not only a function of long payback investments—it is also a function of newness. More efficient technologies are usually newer technologies and because these tend to fail more frequently their capital cost should again be multiplied by a factor different than that applied to a conventional technology. Again, however, technologist studies of the profitable potential for energy efficiency do not adjust technology capital costs upward to reflect this risk.
Technologies may differ not just with respect to financial cost risk. They may also not be the perfect substitutes suggested by a simple analysis of their services, such as of the amount of lumens produced by efficient and inefficient light bulbs. For much of the first two decades of their commercial availability, compact fluorescent light bulbs provided a markedly different quality of service than incandescent bulbs in terms of hue of the light, size and appearance of the bulb, timing to reach full intensity, compatibility with light dimmers, resistance to cold, and other attributes. These are what economists refer to as intangible or non-financial costs, which are very real to the firms and households contemplating technology acquisition. Again, however, technologist studies of the profitable potential for energy efficiency do not adjust the costs of more efficient technologies to reflect these non-financial considerations that have an immediate bearing on the value of an energy efficiency investment.
Finally, it is important to understand that market conditions are not the same everywhere, with different firms and consumers facing different costs of learning about, finding, acquiring, installing, operating and maintaining more efficient devices. Thus, single point estimates based on the most favorable financial costs of efficient devices will exaggerate the total benefits of the economy-wide adoption of such devices.
Implications for Energy-Economy Modeling
Figures C.1 and C.2 show how bottom-up energy efficiency cost curve analysis has been used to provide estimates of the profitable amount of energy efficiency and GHG abatement. While economists argue that these curves are likely to underestimate the full costs of energy efficiency, an additional concern is expressed by energy
system modelers who point out that any step on the curve (an efficiency or GHG abatement action) must be assessed simultaneously with all other steps, rather than in the piecemeal fashion of bottom-up cost curve analysis. In the following text and figures I explain these problems and show how their correction results in alternative cost curves whose meaning must be interpreted differently.
First, energy system modelers point out that bottom-up cost curve analysis represents a form of extreme “partial equilibrium analysis” in that each step on the cost curve (energy efficiency or GHG emissions reduction) is calculated while assuming the other steps are kept frozen. In reality, there is likely interdependence of many steps. At the level of distinct energy services, changing the efficiency of lighting affects the costs of actions to improve building shell efficiency and the efficiency of equipment for heating, ventilation and air conditioning. At the level of energy supply and demand interaction, greater electricity efficiency will lower the price of electricity generation, which in turn will reduce the profitability of energy efficiency investments from a private and social perspective. Likewise, changing the GHG emissions produced by the electricity sector will change the emissions that are saved by more efficient fridges, and thus the costs of GHG abatement by this action. The response of most energy researchers to this problem has been to abandon conventional cost curves in favor of an integrated energy-economy model that treats all actions (efficiency, GHG abatement) as happening simultaneously. This is why such models have been developed and are frequently relied upon by decision-makers. The NEMS model of the Energy Information Administration (2009) in the United States is an example of such an energy system model.
Second, bottom-up cost curve analysis assumes that market conditions are homogeneous for each energy service. In reality, the life-cycle cost of more efficient, or lower GHG, equipment will be different for different market segments—such as increasing efficient fridges from 10% to 20% market share versus increasing them from 80% to 90% market share. This is because of differences throughout the market in terms of the age of existing equipment and the costs of learning about, finding, acquiring, installing, operating and maintaining more efficient or lower emission devices. This is why models have been developed that keep track of capital stocks and reflect market heterogeneity. Again, the NEMS model is an example.
Third, bottom-up cost curve analysis assumes that, with the exception of their differences in capital and operating costs, two technologies are perfect substitutes for a given energy service. As described above, competing technologies often differ in terms of the quality of service they provide and the risk profiles they present, and there are transaction costs to acquiring more efficient devices as these tend to be less well known and relatively untested. These factors mean that the steps of the cost curves are likely to under-represent the full costs of energy efficiency or GHG abatement such that the real-world cost curves should be higher. This is why modelers have developed technology simulation models with parameters that reflect how firms and households value different technologies. Again, the NEMS model is an example.
Figure C.4 depicts graphically how an energy-economy systems model can be used to produce a cost curve that is comparable to yet different from that produced by the bottom-up cost curve approach, in this case in terms of GHG abatement. The curve in this figure represents the amount of GHG emissions reduction that occurs as ever higher prices are applied to emissions in model simulations to the year 2030. Modelers refer to this as a marginal abatement cost curve. It is distinct from the previous bottom-up cost curve because a given action, like the acquisition of efficient fridges, occurs all the way along the curve, instead of at a single step, to reflect market heterogeneity. Also, at each point on the curve, simultaneous actions are occurring within energy demand and between energy supply and demand, as in the real world. Finally, the curve includes transaction costs and intangible differences in quality and risk, so it is likely to be higher than the initial bottom-up abatement cost curve.
In the debates about the cost of energy efficiency and GHG abatement, technologists have repeatedly countered that the type of curve depicted in Figure C.4 is equally not reflective of reality in that, as normally depicted by economists, it starts at or above the origin. This implies the absence of any profitable energy efficiency opportunities anywhere in the economy, or at least none once the model accounts for efficiency gains that occur normally as capital stocks are renewed (these are absent because the curve only shows incremental GHG abatement associated with a rising price for GHG emissions). Technologists argue that the energy-economy models of most economists exclude a priori the potential for profitable energy efficiency because they present only an abstract (“top-down”) representation of technologies and assume that the existing set is optimal from the cost-minimizing perspective of firms and households.
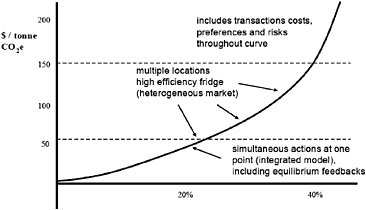
FIGURE C.4 Energy-economy model: marginal abatement cost.
In the past, this criticism has had validity in that economists have indeed favored such models. But over the past two decades, many energy-economy modelers have developed technology-explicit models that keep track of equipment stocks and can estimate the potential for profitable energy efficiency once all intangible costs, preferences and risks have been taken into account. These are sometimes referred to as “hybrid” models and, once again, the NEMS model of the U.S. EIA is an example. Another example is the CIMS model, which I have been involved in developing over the past two decades, with applications to Canada, the United States and other countries (Jaccard, 2009). This model is technologically explicit, keeping track of vintages of capital stocks of different efficiency and other qualities, but its behavioral parameters are estimated from a combination of market research into past technology choices (revealed preferences) and discrete choice surveys of possible future technology choices (stated preferences).
Figure C.5 overlays the results of a CIMS hybrid model simulation of a rising price for GHG emissions in the United States, producing a marginal abatement cost curve, with the McKinsey bottom-up cost curve that was depicted in Figure C.2—both of these for what could be achieved by the year 2030. As expected, the hybrid abatement cost curve is higher than the bottom-up cost curve. Unlike a typical top-down curve, however, it does suggest that some reductions of GHG emissions in the United States would be profitable, presumably from energy efficiency actions (the line starts below the origin). But it suggests that a reduction of 3 gigatonnes from projected levels would require much greater costs and an emissions price of $200/tCO2 instead of the $50 suggested by the McKinsey bottom-up cost curve.
Implications for Policy Assessment
These competing paradigms of the profitability of energy efficiency are relevant not just for estimating the cost of GHG abatement. They are also important in terms of GHG policy design. If a considerable amount of energy efficiency is profitable, it might be easy to achieve with a package of non-compulsory policies like information programs and strategically placed subsidies, essentially the DSM policies that electric utilities have applied for much of the past three decades. If, however, energy efficiency is more expensive, it may be that stringent regulations on fuels and technologies and/or pricing policies (like a carbon tax or an emissions cap and trade system) must dominate the policy package.
Fortunately, electric utility DSM programs of the past three decades provide a rich data set for assessing the effectiveness of information and subsidy programs. Government departments have also implemented for several
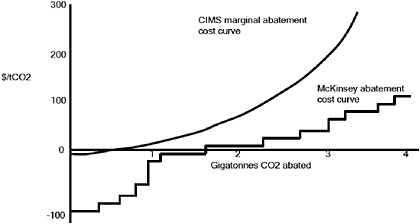
FIGURE C.5 U.S. abatement cost: bottom-up versus hybrid. SOURCE: Author (CIMS curve) and inspired by McKinsey (2007).
decades energy efficiency policies that emphasized this lighter approach to accelerating the economy’s normal trend toward more efficient devices, although governments sometimes also tightened efficiency regulations on equipment, vehicles, appliances and buildings. Data on these utility and government programs is available either as evidence in utility regulatory processes or in the budgetary records of government departments and agencies. Arimura et al. (2009) summarize empirical studies of the effectiveness of these past programs and assemble a comprehensive data set of utility and government efficiency programs from which they provide their own estimates. Their results suggest that energy efficiency subsidy and information programs have not achieved all the predicted energy efficiency gains and that, as a consequence, the cost of achieving energy efficiency in this way is higher than assumed. It should be noted, moreover, that these utility cost estimates would already have been higher than the pure bottom-up cost estimates from studies such as that of McKinsey because utility predictions of DSM effects try to incorporate the intangible costs that may cause firms and households to forego energy efficient options.
Thus, the research suggests that utilities would generate higher cost estimates for energy efficiency than would a conventional bottom-up study of the type shown in Figure C.2. In addition, once the effectiveness of information and subsidy policies is taken into consideration, the actual achievement of energy efficiency through these policies is likely to be much less than if one assumed that all of the so-called profitable efficiency gains identified by McKinsey- type studies could be somehow realized.
Research into the effectiveness of subsidy programs in particular highlights the problem of “adverse selection,” meaning that such subsidies are often captured by firms and households to help pay for efficiency improvements they were going to make anyway, improvements that were part of the natural rate of efficiency gain. Such beneficiaries of subsidy programs are sometimes referred to as “free riders” in that they benefit from the subsidies for doing nothing different than they would have done anyway—such as upgrading the insulation when retrofitting their home. From a policy design perspective, it is impossible to prevent this from occurring, which is a substantial challenge for subsidy programs.
Because subsidies represent a transfer payment from one group of taxpayers and/or ratepayers to another, the subsidies do not affect the profitability of the efficiency actions themselves. The only issue is the extent to which subsidies can be effective as a policy tool for accelerating the efficiency trend. If, because of ineffectiveness, really large transfers are required for only small gains in efficiency, there will also be equity concerns with respect to the costs incurred by those who are unable to participate in the subsidy programs for some reason: having already
made efficiency investments, ignorance of the subsidy program, slowness in applying for limited subsidy funds, or having a low income or poor credit rating that hinders the ability to get financing to cover the non-subsidized portion of the efficiency investment.
Conclusion
For over three decades, some technologists have argued that there are extensive opportunities for profitable energy efficiency investments. For much of these three decades, however, some economists have countered that these estimates of profitable energy efficiency overlook important intangible costs facing firms and consumers. These include transaction costs, investment risks facing new technologies and long payback investments, heterogeneity in the market, and differences in quality of service. While these costs are usually ignored by technologists, economists have done little research to estimate their actual magnitude—so fault lies on both sides.
These competing paradigms are confusing to policy makers trying to assess the cost-effectiveness and likely contribution of energy efficiency to efforts to reduce GHG emissions. Bottom-up cost curve analysis by technologists suggests an extremely large and profitable potential, which implicitly suggests that information and subsidies alone may reduce emissions substantially. Top-down marginal abatement cost curve analysis by economists suggests the opposite, implying the need for strong emissions pricing and/or regulations. More recent research with hybrid models that are technologically explicit but behaviorally realistic suggests that while there is some profitable potential for energy efficiency, strong pricing and regulatory policies will indeed be required for a modern economy to achieve substantial GHG emissions abatement over the coming decades.
References
Arimura, T., Newell, R. and K. Palmer, 2009, “Cost-effectiveness of electricity energy efficiency programs,”Resources for the Future, Discussion Paper DP 09-48.
Energy Information Administration (U.S.), 2009, The National Energy Modeling System: An Overview 2009, Washington, D.C.: Energy Information Administration.
Geller, H., 2003, Energy Revolution: Policies for a Sustainable Future, Washington, D.C.: Island Press.
Jaccard, M., Nyboer, J., Bataille, C. and B. Sadownik, 2003, “Modeling the cost of climate policy: distinguishing between alternative cost definitions and long-run cost dynamics,” The Energy Journal 24 (1): 49-73.
Jaccard, M., 2009 “Combining top-down and bottom-up in energy-economy models,” In Evans, J. and L. Hunt (eds.) International Handbook on the Economics of Energy, Cheltenham, UK: Edward Elgar, 311-331.
Jaccard, M., 2005, Sustainable Fossil Fuels: The Unusual Suspect in the Quest for Clean and Enduring Energy, Cambridge: Cambridge University Press.
Jaffe, A. and R. Stavins, 1994, “The energy-efficiency gap. What does it mean?” Energy Policy 22 (10): 804-810.
Jaffe, A., Newell, R. and R. Stavins, 1999, “Energy-efficient technologies and climate change policies: issues and evidence,” Resources for the Future, Climate Issues Brief #19.
Lovins, A., 1977, Soft Energy Paths: Toward a Durable Peace, New York: Ballinger.
McKinsey, 2007, Reducing U.S. Greenhouse Gas Emissions: How Much at What Cost? New York: McKinsey & Company and the Conference Board.


