
4
Identification and Use of Process Safety Metrics
INTRODUCTION
This chapter describes recent efforts by the chemical and petroleum industries to define process safety metrics suited to the needs of their enterprises. It then discusses how such concepts can be leveraged and applied at the Pueblo Chemical Agent Destruction Pilot Plant (PCAPP) and the Blue Grass Chemical Agent Destruction Pilot Plant (BGCAPP).
Leading and lagging process safety metrics have been of great interest for at least the last 5 years. Process safety and the metrics for such safety have been of concern especially in the chemical and petroleum industries, because it is those sectors that handle or produce toxic and flammable materials, which if released into the environment have the potential to cause multiple fatalities or injuries and significant environmental damage. Since the mid-1990s, these industries have used major unplanned releases of chemicals or energy as a primary process safety metric. Trade associations, including the American Chemistry Council and the American Petroleum Institute (API), have developed and implemented a common definition of a process safety incident (PSI) and have used the PSI to measure the relative performance of the companies that are members of those associations. The definition developed in the mid-1990s included any unintended releases of hazardous chemicals that exceeded the threshold quantity given in 40 CFR 302.4, a listing of designated CERCLA1 hazardous substances, or events that resulted in serious injury or damages in excess of $25,000.
Although the PSI was used, as defined, for more than 15 years by many U.S. chemical and petroleum companies as a performance metric, it never achieved sufficient acceptance and utilization as a benchmark owing to the lack of broad consensus that it was a good indicator of performance. This was in part because the table of threshold quantities given in 40 CFR 302.4 was not itself viewed as a good indicator of equivalent risks of the chemicals listed nor did it include all chemicals. International acceptance was also hampered by the metric’s association with a U.S. regulation.
PROCESS SAFETY METRICS FROM INDUSTRY AND ORGANIZATIONS
American Institute of Chemical Engineers’ Center for Chemical Process Safety Metrics
In 2006, the Center for Chemical Process Safety (CCPS) launched a project to develop better leading and lagging process safety metrics.2 The aim of the CCPS Metrics Project was to establish definitions of lagging metrics that would be broadly accepted internationally and be useful for benchmarking relative performance and parallel the Occupational Safety and Health
|
1 |
CERCLA is the Comprehensive Environmental Response, Compensation, and Liability Act, commonly known as the Superfund. This document lists dangerous chemicals and gives threshold quantities for the purpose of defining a process safety incident. |
|
2 |
“Leading metric” and “lagging metric” are defined in Appendix A. |
Administration’s (OSHA’s) injury/illness metric, which has been utilized broadly to benchmark worker safety performance. Another aim of the project was to identify leading metrics that would monitor management systems or other early indicators of necessary actions that had to be taken to avoid process safety incidents, especially catastrophic incidents such as those at Union Carbide in Bhopal, India; BP in Texas City, Texas; and Phillips in Pasadena, California.
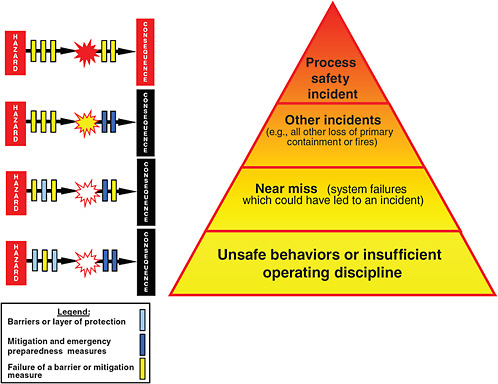
Industry interest and participation in the CCPS Metrics Project grew with the release of The Report of the BP U.S. Refineries Independent Safety Review Panel (also known as the Baker panel) and the U.S. Chemical Safety Board’s (CSB’s) Investigation Report: Refinery Explosion and Fire, Report No. 2005-04-I-TX, following the incident at the BP Texas City refinery in 2005. Both reports called upon industry to develop and implement better leading and lagging metrics. The CCPS Metrics Project resulted in two publications, a process safety metric pamphlet in December 2007 that recommended specific metrics for industry benchmarking3 and a book in 2009 titled Guidelines for Process Safety Metrics. The latter document recommended a process for companies to adhere to in selecting and implementing other metrics appropriate for their facilities.4 The metrics in the CCPS publications were embraced by many U.S. and international trade associations and became the basis for metrics collected by those organizations. These publications also describe a hierarchy of metrics, both lagging and leading. Lagging metrics relate to events that actually occurred (e.g., unintended releases of chemicals). Leading metrics may include near-miss events that did not result in an unintended release, management system failures (e.g., missed or overdue inspections), activation of safety systems, or other events that might indicate areas requiring attention to reduce the likelihood of a significant event. The hierarchy is illustrated as a pyramid in Figure 4-1. There are typically more minor events than major events, more near misses than actual releases, and more management system defects or other early indicators than near misses.
The CCPS Guidelines for Process Safety Metrics expanded the discussion of metrics by describing the processes that a company or organization should use to select metrics that are specific or applicable to that organization. It also included an appendix document containing several hundred potential metric options that an organization should consider, depending upon the areas of performance that are most important or in need of strengthening for that organization.
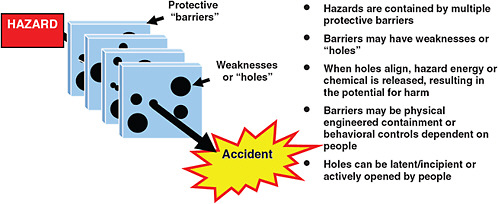
The relationship of the hierarchy of incident categories to the James Reason barrier model is shown in Figure 4-1. The latter model illustrates independent layers of protection, which can alternatively be illustrated by the “Swiss cheese” model that is shown in Figure 4-2. As explained in the two previously noted CCPS documents, there are typically multiple independent layers, or barriers, that prevent an incident from occurring or that limit the severity of an incident. When all process safety barriers are in place, a single barrier can typically fail without significant consequences. However, when multiple barriers fail, the probability that an incident can occur is increased. Individual barrier failures may often occur without being noticed until a second or third barrier has failed. For this reason, metrics are needed to ensure the integrity of all barriers.
American Petroleum Institute Metrics
Following the completion of the CCPS Metrics Project, the CSB still desired that an American National Standards Institute (ANSI) standard be developed to codify the recommendations on process safety metrics. It hoped in this way to ensure that all relevant companies and stakeholders would support a common set of metrics. CSB requested that API work with the United Steelworkers’ Union to sponsor an ANSI standard project. A committee was organized, and an ANSI standard, Process Safety Performance Indicators for the Refining and Petrochemical Industries (ANSI/API RP 754), was created. The vast majority of definitions and concepts developed by the CCPS Metrics Project were retained in the ANSI/API RP 754 document.5 Since this document was developed shortly after issuance of the original CCPS metric definitions, the API committee used the opportunity to make minor modifications to metric definitions based upon lessons learned from early implementation by users of the original CCPS metrics. See Box 4-1 for definitions of Tier 1-4 process safety events from API RP 754.
|
BOX 4-1 Definitions of Tier 1-4 Process Safety Events from API Recommended Practice (RP) 754 A Tier 1 Process Safety Event (T-1 PSE) is a loss of primary containment (LOPC) with the greatest consequence as defined by this RP. A Tier 2 Process Safety Event (T-2 PSE) is an LOPC with lesser consequence. A T-2 PSE is an unplanned or uncontrolled release of any material, including non-toxic and non-flammable materials (e.g., steam, hot condensate, nitrogen, compressed CO2 or compressed air), from a process that results in one or more of the consequences listed below and is not reported in Tier 1:
A Tier 3 PSE typically represents a challenge to the barrier system that progressed along the path to harm, but is stopped short of a Tier 1 or Tier 2 LOPC consequence. Indicators at this level provide an additional opportunity to identify and correct weaknesses within the barrier system. Tier 4 indicators typically represent performance of individual components of the barrier system and are comprised of operating discipline and management system performance. Indicators at this level provide an opportunity to identify and correct isolated system weaknesses. Tier 4 indicators are indicative of process safety system weaknesses that may contribute to future Tier 1 or Tier 2 PSEs. In that sense, Tier 4 indicators may identify opportunities for both learning and systems improvement. Tier 4 indicators are intended for internal Company use and for local (site) reporting. SOURCE: API (2010). Note: Table number refers to table in API RP 754, not this report. |
United Kingdom Health and Safety Executive Metrics
In 2006, the United Kingdom Health and Safety Executive (HSE) published a methodology for establishing metrics, Developing Process Safety Indicators: A Step-by-Step Guide for Chemical and Major Hazards Industries (HSG 254), based on specific processes.6 This document recommended that facilities examine their specific process details or their particular process unit and develop leading metrics that are specific to that process and that could be monitored to prevent and mitigate the occurrence of a major accident. For example, if the most significant hazard in a plant is the overflow or overpressurization of a specific vessel, the HSG 254 approach to metrics might call for specific lagging metrics that serve as a track record for keeping that vessel within safe operating limits, or leading metrics that serve as an track record for maintenance of the vessel’s instrumentation that measures the content’s level or pressure.
|
6 |
HSE HSG 254 is available from HSE at http://books.hse.gov.uk/hse/public/home.jsf and is also included on a CD included with the CCPS book Guidelines for Process Safety Metrics. |
APPLICABILITY OF PUBLISHED CHEMICAL AND PETROLEUM INDUSTRY METRICS TO PCAPP AND BGCAPP
Elements in each of the CCPS, API, and HSE metrics publications could be appropriate for the Assembled Chemical Weapons Alternatives (ACWA) program to consider using at PCAPP and BGCAPP. An example would be for the Program Manager for Assembled Chemical Weapons Alternatives (PMACWA) to define what is meant by a “process safety incident.” This definition would be used in developing metrics to measure the frequency and severity of process safety incidents.
There are established chemical release thresholds and associated metrics for common industrial chemicals such as caustic and nitric acid that could be directly applied to process safety at ACWA sites.7 However, the physical properties of chemical warfare agents may not align well with the release threshold quantities used in the API or CCPS definitions. Perceptions of the toxicity of chemical warfare agents require that the Army treat any unintended release of agent as a process safety incident.8
Finding 4-1. At the present time, there is no definition of a process safety incident other than “release of agent” within the Assembled Chemical Weapons Alternatives program. Establishing or adopting a common definition for process safety incidents would improve consistency of reporting and sharing of lessons learned within the program.
Recommendation 4-1. The Program Manager for Assembled Chemical Weapons Alternatives should adopt the definitions of Tier 1-4 process safety events in Recommended Practice 754, Process Safety Performance Indicators for the Refining and Petrochemical Industries, a joint recommendation of the American National Standards Institute and the American Petroleum Institute, with the exception that the reporting threshold for chemical agents should be defined as any unintended release.
PROCESS SAFETY METRICS DERIVED FROM PRIOR OPERATING EXPERIENCE AT CHEMICAL AGENT DISPOSAL FACILITIES
As was noted in Chapter 3, causal factors for process safety events at other chemical demilitarization facilities were not directly related to the specific process used for agent destruction, so it is reasonable to expect that the same types of causal factors will be associated with any events and incidents that may occur at ACWA demilitarization facilities. The causal factors identified in Chapter 3 provide an excellent basis for the ACWA sites to develop process safety metrics that relate directly to chemical weapons destruction experiences.
At 28.4 percent of the total, standard operating procedure (SOP) deficiencies was the most prevalent causal factor identified. For PCAPP and BGCAPP, metrics that enable early identification and avoidance of SOP deficiencies should be a priority. Among the parameters that could be considered are these:
-
Documenting the percentage or number of process safety operations and maintenance procedures reviewed or revised as scheduled.
-
Tracking revisions to SOPs and documenting the communication of those revisions and training on revised SOPs.
-
Implementing and documenting job cycle checks9 to ensure that training in roles and responsibilities is understood and implemented. Such reviews evaluate employees’ understanding of SOPs and assess the adequacy of SOPs.
Human factors, which include “human error,” “mindset,” and “improper technique,” altogether accounted for approximately 37 percent of the causal factors. Again, metrics derived from training activities and job cycle checks can be useful in developing actions to mitigate these causal factors and to identify areas where regular annual, or more frequent, training should be improved or changed. Other possible considerations are these:
-
Results of periodic employee attitude or perception surveys.
-
Frequency with which upper managers visit the worksite, or percentage of scheduled visits that actually take place.
-
Number of unresolved recommendations from risk analyses, incident investigations, audits, and safety suggestions.
-
Percentage of near misses and incidents identified as being caused by unsafe acts or shortcuts.
Equipment malfunction was the second most prevalent causal factor (19 percent) noted at other chemical demilitarization facilities. While the definition of equipment malfunction did not include design deficiencies, it should be noted that design deficiencies caused some equipment malfunctions and that equipment malfunctions and design deficiencies were present in over 29 percent of the total number of incidents. At the two ACWA facilities, this factor could become even more pronounced because first-of-a-kind equipment that has never been used before will be installed. Conducting design audits and basing metrics on the results could assist in finding design deficiencies before they cause an equipment malfunction or other process incidents or upsets. A system of process-safety-critical equipment inspections is key to minimizing equipment malfunctions. Metrics-based parameters such as the following could be considered:
-
Safety-critical equipment inspections could be assessed, for example, by the percentage of these inspections completed on time. This metric relies on the prior identification of equipment deemed to be critical to safety. Such equipment might include pressure vessels, storage tanks, piping systems, pressure relief devices, pumps, instruments, control systems, interlocks and emergency shutdown systems, mitigation systems, and emergency response equipment.
-
Scheduled and preventive maintenance activities.
-
Equipment repair logs.
Communications deficiencies are not typically documented until after a failure but should be considered as integral to the full complement of process safety metrics. Audits of communications systems (active and passive) and documentation of communications failures might be one metric for communication failures.
Finding 4-2. Developing metrics for the Pueblo Chemical Agent Destruction Pilot Plant and the Blue Grass Chemical Agent Destruction Pilot Plant based on operating experience at other chemical agent disposal facilities would help to avoid failures that lead to process safety incidents.
Recommendation 4-2. The Program Manager for Assembled Chemical Weapons Alternatives should take into account the causal factors in past process safety incidents at chemical agent disposal facilities when devising process safety metrics for the Pueblo Chemical Agent Destruction Pilot Plant and the Blue Grass Chemical Agent Destruction Pilot Plant.
OTHER PROCESS SAFETY METRICS THAT MAY BE RELEVANT TO PCAPP AND BGCAPP
Other leading metrics recommended in the CCPS and API documents could also be relevant to PCAPP and BGCAPP. The committee believes that the following metrics could be utilized at ACWA sites.
Process Safety Near-Miss Events
Near-miss events are undesired events that, under slightly different circumstances, could have resulted in harm to people or damage to property, equipment, or the environment. This metric includes the following:
-
Critical operating limit excursions. This is a process parameter deviation that exceeds the operating limits for critical steps in the process. The operating limits may be different for the same equipment depending on the operating phase. For example, the required temperatures might depend on the pressure. Troubleshooting efforts should end when the established operating limits are exceeded at critical points in the process, and predetermined action should be taken to return the process to a known safe state.
-
Demands on safety systems. This is a demand on a safety system that is designed to prevent a loss of primary containment (LOPC) or to mitigate the consequences of an LOPC. The safety system being activated may be known as a “safety instrumented system” following the terminology in the International Electrotechnical Commission standard Functional Safety—Safety Instrumented Systems for the Process Industry Sector (IEC-61511).
-
Other unanticipated LOPC events. Recognizing that leaking chemical munitions are a known concern, the sites may wish to have separate metrics for leaks or LOPCs that were known to exist before munition processing begins and those that occur during the processing. This would serve to identify aspects of the overall disposal operation that are increasing risk (CCPS, 2008).
Action Item Closure
This metric looks at the percentage and/or number of process-safety-related actions that remain unresolved past the date by which they were to have been resolved. These might include outstanding action items from hazard evaluations, compliance audits, overdue training, or prior incident investigations or drills (API, 2010).
Completion of Emergency Response Drills
This metric pertains to the number of completed emergency response drills that use a realistic failure scenario, completed written records, and completed identification and closure of identified deficiencies (API, 2010).
Management of Change
In the area of process safety management, management of change (MOC) refers to a specific system that, prior to the implementation of a change, identifies, reviews, and approves any change to (1) equipment, (2) personnel assigned to the area, (3) raw materials, or (4) the process technology or operating conditions. Another aspect of MOC that must be recognized is that some changes are subtle. A subtle change might be one involving the supplier of a raw material or a chemical or the rerouting of a pipeline to a different elevation. As an example of the former, a new material might meet basic technical specifications but contain a contaminant that has not been reported to the purchaser but might cause a reaction in the process, with undesirable results. These “subtle” changes are often labeled as “not replacement in kind.”
Each change should be reviewed and assessed for its impact on operations and on safety, health, and the environment. The review should be documented and approved by management and should include any actions needed to move forward, specify responsible parties, and set closing dates for action items. MOC actions would be sampled quarterly or biannually, and the percent of sampled MOC actions that met all requirements and quality standards would be determined (CCPS, 2008; API, 2010).
Understanding and using MOC leading indicators requires that the staff operating a facility understand its current operations: the technology, the operational knowledge possessed by personnel, and the physical specifications of equipment. Implementing a system to manage change must be preceded by a program to train a facility’s staff in MOC. There must also be a strong process safety culture for MOC to be effective. Particularly in the area of subtle change, the people best positioned to recognize the impacts of any proposed changes are those directly involved in operating a facility.
Metrics Related to Other Management Systems
CCPS’s book Risk-Based Process Safety contains a number of process safety best practices. It also lists potential metrics for the implementation status of those practices. PCAPP and BGCAPP managers could work to identify common process safety management system elements that may not be well implemented yet are important to the safe and reliable operation of the facilities. In light of what they learn, they could review the extensive listing of CCPS metrics to find metrics that could be used at their facilities.10 While PCAPP and BGCAPP might not adopt many of these metrics, a number of them could be beneficial to their process safety efforts.
Finding 4-3. Many process safety metrics that could be used by the Pueblo Chemical Agent Destruction Pilot Plant and the Blue Grass Chemical Agent Destruction Pilot Plant are available to the public, including those in the list of metrics in the Center for Chemical Process Safety publication Guidelines for Process Safety Metrics. These metrics could complement process-specific metrics developed at the respective sites.
Recommendation 4-3. The Pueblo Chemical Agent Destruction Pilot Plant and the Blue Grass Chemical Agent Destruction Pilot Plant should adopt the metrics listed below and develop process-specific leading and lagging metrics. The ACWA program should also
consider a metric associated with emergency planning and response as well as published lists of process safety metrics and should adopt those that appear to be of value to these sites.
-
Count of process safety near-miss events.
-
Training records such as validation of job cycle checks and completion of training, including refresher training.
-
Job procedures:
-
Statistics on whether a procedure was used and, if it was, was the procedure the correct one?
-
Validation that procedures are current and accurate.
-
-
Statistics on the closure of action items.
-
Percent of inspections of safety-critical equipment completed on time.
-
Percent of sampled management of change instances that met all requirements and quality standards.
EXAMPLES OF ACWA PROCESS-SPECIFIC METRICS
The United Kingdom HSE’s publication HSG 254, Developing Process Safety Indicators: A Step-by-Step Guide for Chemical and Major Hazard Industries, could be readily applied to PCAPP and BGCAPP processes and operations. For example, one hazard at PCAPP would be the premature release of contents from the agent neutralization system before complete neutralization (see Figure 4-3). This could be caused by the incorrect sequencing of the neutralization steps
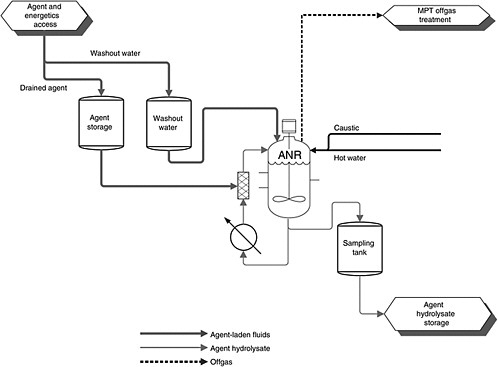
FIGURE 4-3 Process flow diagram for agent neutralization. SOURCE: Chris Haynes, Blue Grass Design Build Manager, Bechtel Parsons, “BGCAPP MDB intermediate design,” presentation to the BGCAPP intermediate design review executive overview, February 15, 2005.
or inaccurate readings from instruments, among other things.
Process-specific leading metrics for this portion of the process could therefore include the following:
-
Calibration records for analysis equipment associated with the agent neutralization system, including any performance deviations or drift in calibration;
-
Maintenance records associated with the agent neutralization reactor agitator, including any changes in vibration or current; and
-
Training validation and job cycle checks (see above) for all operators involved in the operation of the agent neutralization system.
Lagging metrics for this portion of the process could include records of any near-miss events or process safety incident associated with the agent neutralization system before complete neutralization—for example, the premature opening of valves, faulty instruments, or the failure of caustic valves to open.
Another example of a possible equipment-specific process safety event is failure of one of the energetics batch hydrolyzers (EBHs) that are to be used at BGCAPP (see Figure 4-4). The committee has identified the sudden failure of the drive train, bearings, or any other aspect of the rotating drum either when filled with energetics that have not been neutralized, or after neutralization when there are still metal parts that need to be removed, as a process safety risk associated with
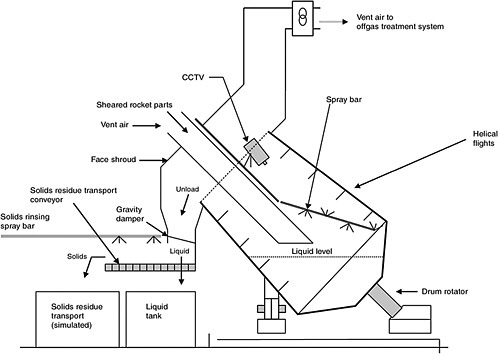
FIGURE 4-4 Diagram of EBH. SOURCE: John Ursillo, Bechtel, “Process design overview (Blue Grass),” presentation to the Committee to Assess Designs for the Pueblo and Blue Grass Chemical Agent Destruction Pilot Plants, September 22, 2004.
this piece of equipment. Specific leading metrics for this portion of the process could include the following:
-
Maintenance records associated with the rotating drum, including any changes in vibration readings for the main bearing or in vibration or current readings for the drive train motor(s);
-
Training validation and job cycle checks (see above) for all technicians involved in the maintenance of this equipment; and
-
Having an SOP for emptying the EBH if the unit does not function or turn or tip to be emptied.
Lagging metrics for this portion of the process could include records for any near-miss events or process safety incident associated with the EBH—for instance, bearing failures, motor failures, or drum leaks.
These two examples illustrate the concept of developing process-specific leading and lagging process safety metrics. PCAPP and BGCAPP could utilize a similar approach to develop such metrics for other equipment that poses the greatest potential for process safety events.
Finding 4-4. The United Kingdom Health and Safety Executive’s Health and Safety Guidance 254 (UK HSE HSG 254) provides a methodology to develop process-specific leading and lagging metrics.
Recommendation 4-4. Given that the two facilities are pilot facilities and make extensive use of first-of-a-kind equipment, the Pueblo Chemical Agent Destruction Pilot Plant and the Blue Grass Chemical Agent Destruction Pilot Plant should review their hazard assessment documents to identify and consider implementing leading or lagging metrics specific to each piece of equipment or area of the plant. These efforts should follow the approach outlined in the United Kingdom’s Health and Safety Executive Health and Safety Guidance 254 (UK HSE HSG 254), Developing Process Safety Indicators: A Step-by-Step Guide for Chemical and Major Hazard Industries.
MANAGEMENT OF BEST PRACTICES OF PROCESS SAFETY METRICS IN INDUSTRY
Managerial leadership encompasses responsibility for setting the tone and performance expectations in an organization. When process safety metrics are set for an organization, the operation’s line leadership must set performance milestones and must review the operation’s performance against those milestones with the organization’s top managers at least quarterly. If performance does not meet expectations or the goals that have been set, the organization must develop an action plan to rectify the situation so that goals can be achieved. Such performance reviews may suggest that additional or different metrics are needed to help the organization strive for and achieve continuous improvement and operational excellence. Reviews of operations should be conducted not only at the site leadership level but also above the plant level, including reviews by ACWA off-site leadership.
Finding 4-5. A formalized mechanism for a periodic review of process safety metrics by management is an established best practice in industry to verify that management is involved and can drive continuous improvement.
Recommendation 4-5. The Program Manager for Assembled Chemical Weapons Alternatives and site management should perform periodic reviews of process safety metrics utilized at PCAPP and BGCAPP and implement action plans as appropriate to drive continuous improvements.
PROCESS SAFETY COMPETENCY
The chemical, petroleum, and related industries have learned that maintaining a staff of trained process safety professionals is vital to the avoidance of process incidents. The focus on this area started in the mid-1950s, when the chemical industry experienced a number of process safety incidents. Following the serious incidents at Bhopal and elsewhere, the chemical industry invested heavily in developing process safety expertise in its companies. Following the BP Texas City incident in 2005, a second wave of hiring safety experts and building safety competency occurred in many petroleum and chemical companies.
Such process safety professionals, partnering with senior management, can educate staff and track the performance of key process safety programs such as management of change, the generation and use of good SOPs, incident investigations and corrective actions, reporting of near misses and incidents, and process safety training programs for operators. They review all these findings with management and propose and develop programs as required to address issues. Part-
nership with and support from higher levels of management is essential for the success of these professionals. Examples of metrics for process safety competency are available from CCPS and can be tracked. In addition to tracking the proportion of positions key to process safety that are currently staffed, other metrics, such as completed process safety training and the enhancement of process safety competence for relevant personnel, such as managers, supervisors, and technical staff, can be utilized as well.
Although the practice of having safety professionals is not as widespread outside the chemical and petroleum industries, several other industries (nuclear power is one) and government facilities engaged in hazardous processes have also been hiring full-time staff members to develop and monitor their process safety programs. These individuals often participate in industry conferences in order to learn about the best practices being implemented by other companies, with the aim of sharing them with their own facilities and possibly implementing them there.
Process safety technology conferences such as the American Institute of Chemical Engineers’ annual Global Congress of Process Safety and other meetings hosted by organizations such as the CCPS and the Mary Kay O’Connor Process Safety Center provide ongoing programming on process safety and the identification of best practices. The CCPS, the API, and the U.K. HSE documents discussed above would also provide a starting point for learning about industry best practices for process safety.
Finding 4-6. The chemical and petroleum industries have found it very beneficial to have employees on staff with process safety expertise. These individuals partner with senior management and are accountable for monitoring industry best practices in process safety and for implementing those that are applicable within their facilities. These individuals are also tasked with assisting in embedding process safety into the organization’s culture by organizing and leading grassroots process safety teams while reviewing outcomes and metrics with management.
Recommendation 4-6. The Program Manager for Assembled Chemical Weapons Alternatives should maintain process safety expertise at the programmatic level to ensure effective implementation of process safety metrics. To be successful, process safety experts must partner with and be supported by management.
Finding 4-7. There are a number of resources that the Program Manager for Assembled Chemical Weapons Alternatives can use to learn about best practices for process safety management in the chemical and petroleum industries. Process safety technology conferences such as the American Institute of Chemical Engineers’ annual Global Congress of Process Safety and others hosted by organizations such as the Center for Chemical Process Safety and the Mary Kay O’Connor Process Safety Center provide ongoing programming on process safety and the identification of best practices.
Recommendation 4-7. The Program Manager for Assembled Chemical Weapons Alternatives should undertake a review of best practices in process safety management, especially in the chemical and petroleum industries. These practices are described in the Center for Chemical Process Safety book Guidelines for Risk Based Process Safety. Those that are applicable should be incorporated into the Pueblo and Blue Grass Chemical Agent Destruction Pilot Plants.
REFERENCES
API (American Petroleum Institute). 2010. Process Safety Performance Indicators for the Refining and Petrochemical Industries. American Petroleum Institute: Washington, D.C.
CCPS (Center for Chemical and Process Safety). 2008. Process Safety Leading and Lagging Metrics: You Don’t Improve What You Don’t Measure. New York, N.Y.: American Institute of Chemical Engineers.
CCPS. 2009. Guidelines for Process Safety Metrics. Hoboken, N.J.: John Wiley & Sons, Inc.
UK HSE (United Kingdom’s Health and Safety Executive). 2006. Developing Process Safety Indicators: A Step-by-Step Guide for Chemical and Major Hazard Industries. Health and Safety Guidance 254. Available online at http://www.hse.gov.uk/pubns/priced/hsg254.pdf. Last accessed March 11, 2011.


