
4
Review of Potential Indicators of Adequacy and Selection of Indicators: Calcium and Vitamin D
APPROACH
The first step in the decision-making process associated with the development of Dietary Reference Intakes (DRIs) is the identification of potentially useful measures—indicators—that reflect a health outcome associated with the intake of the nutrient. As described in Chapter 1, this is classically referred to as hazard identification, the first step of risk assessment. The available data are examined to determine their relevance and validity as well as strengths and limitations for elucidating a relationship between the health outcome of interest (including chronic disease risk) and the intake of the nutrient.
In considering reference values for calcium and vitamin D, there are challenges in organizing a data review to examine these nutrients independently, because they act in concert and are often administered together in experimental studies. To the extent possible, the independent effects of these nutrients were explored and taken into account; when this was not possible or not appropriate, the combined effect was considered. This chapter reviews evidence for calcium and vitamin D jointly to avoid redundancy. Evidence related to potential indicators for adverse effects of excess intake of calcium and vitamin D is reviewed separately in Chapter 6.
Identification of Potential Indicators for Calcium and Vitamin D
The array of potential health outcomes to be considered for these two nutrients was identified using five sources:
-
Agency for Healthcare Research and Quality (AHRQ) evidence report issued in 2007 (Cranney et al., 2007), hereafter referred to in this chapter as AHRQ-Ottawa without a reference citation; and
-
AHRQ evidence report issued in 2009 (Chung et al., 2009), hereafter referred to in this chapter as AHRQ-Tufts without a reference citation;
-
The Institute of Medicine (IOM) report Dietary Reference Intakes for Calcium, Phosphorus, Magnesium, Vitamin D, and Fluoride (IOM, 1997);
-
Literature searches conducted by the committee;
-
Publicly available input from stakeholders either through written submissions to the committee or as presented during the information gathering workshop.
As outlined in Chapter 1, the ARHQ analyses are highly relevant to DRI development. Evidence-based systematic reviews have been identified as a useful tool for the purposes of dietary reference value development (Russell et al., 2009), and the work of this committee was enhanced by the availability of these two high-quality evidence reports from AHRQ. The approach used, questions asked, data search criteria, and the detailed results from the AHRQ-Ottawa and AHRQ-Tufts can be found in Appendixes C and D.
In sum, the focus of AHRQ-Ottawa was on the:
-
Association of specific circulating 25-hydroxyvitamin D (25OHD) concentrations with bone health outcomes in children, women of reproductive age, postmenopausal women, and elderly men;
-
Effect of vitamin D dietary intake (fortified foods and/or supplements) and sun exposure on serum 25OHD levels;
-
Effect of vitamin D on bone mineral density (BMD) and fracture or fall risk; and
-
Identification of potential harms associated with vitamin D exposures above current reference intakes.
The AHRQ-Tufts evidence report analyzed data related to calcium and vitamin D with respect to a broader spectrum of health outcomes. AHRQ-Tufts also served to update and expand AHRQ-Ottawa. Specifically, AHRQ-Tufts focused on the:
-
Relationship between vitamin D and growth, cardiovascular disease (CVD), body weight, cancer, immunological outcomes, bone health, all-cause mortality, hypertension/blood pressure, and BMD and bone mineral content (BMC); and
-
Relationship between calcium and growth, CVD, body weight, and cancer.
Neither AHRQ report reviewed calcium alone as a factor in bone health.
A key component of systematic reviews of scientific literature is a specification of the quality of the available data. The AHRQ grading system is summarized in Box 4-1. In the case of the systematic analysis carried out by AHRQ-Ottawa, the Jadad scale (Jadad et al., 1996) was used for quality assessments of randomized controlled trials (RCTs). The Jadad scale is a validated scale designed to assess the methods used to generate random assignments and double blinding. The scale also scores whether there is a description of dropouts and withdrawals by intervention group. Jadad scores range from 1 to 5, and a total score of 3 and above indicates studies of higher quality. Further, to assess the quality of the observational studies, a grading system adapted from R. P. Harris et al. (2001) was used. In the case of the AHRQ-Tufts analysis, a three-category grading system (“A,” “B,” or “C”) was adapted from the AHRQ Methods Reference Guide for Effectiveness and Comparative Effectiveness Reviews (AHRQ, 2007). This system defines a generic grading system that is applicable to each type of study design including interventional and observational studies; it is summarized in Box 4-1.
The committee’s literature search identified relevant evidence outside the scope of, or not included in, the two AHRQ reports as well as newer data available after the cutoff date of the AHRQ-Tufts analysis in 2009. The nature of the literature search is outlined in Appendix E. The literature base that was included in the 1997 report of the IOM committee tasked with DRI development for calcium and vitamin D (IOM, 1997) was also considered. Additionally, information gathered as part of a public workshop and several open committee sessions (see Appendix J) and a white paper requested by the committee (Towler, 2009) were taken into account.
Through use of the five data sources listed above, health outcomes of potential interest were identified. They are listed alphabetically in Table 4-1 and are grouped by general outcome. In addition, there is the possibility of intermediate variables that are not validated biomarkers of effect for health outcomes, but which may have the potential to be useful in the development of DRIs. Two such variables were considered: serum 25OHD concentrations and levels of parathyroid hormone (PTH).
Review of Data
General Principles
Within the scientific and clinical literature, there is a general hierarchy of study design. The lowest form of evidence is the idea or opinion,
|
BOX 4-1 AHRQ Critical Appraisal and Grading of Evidence Grading system used by AHRQ-Ottawa: Basic Jadad score is assessed based on the answer to five questions listed below. Questions that are answered with a “yes” gain 1 point; questions answered with a “no” receive 0 points; the maximum score is 5. A score of 0 to 2 points is considered “low” quality, and a score of 3 to 5 points is considered “high” quality.
Grading system used by AHRQ-Tufts (based on criteria below): A = highest quality Studies have the least bias and results are considered valid. These studies adhere mostly to the commonly held concepts of high quality, including the following: a formal study design; clear description of the population, setting, interventions, and comparison groups; appropriate measurement of outcomes; appropriate statistical and analytical methods and reporting; no reporting errors; less than 20 percent dropout; clear reporting of dropouts; and no obvious bias. Studies must provide valid estimation of nutrient exposure from dietary assessments and/or biomarkers with reasonable ranges of measurement errors and justifications for approaches to control for confounding in their design and analyses. B = medium quality Studies are susceptible to some bias, but not sufficient to invalidate the results. They do not meet all the criteria in category “A”; they have some deficiencies, but none likely to cause major bias. The study may be missing information, making it difficult to assess limitations and potential problems. C = low quality Studies have significant bias that may invalidate the results. These studies have serious errors in design, analysis, or reporting; there are large amounts of missing information or discrepancies in reporting. SOURCES: Jadad et al., 1996; Cranney et al., 2007; Chung et al., 2009. |
TABLE 4-1 Alphabetical Listing of Potential Indicators of Health Outcomes for Nutrient Adequacy
|
Indicator |
AHRQ (Ottawa and Tufts) |
|
Cancer/neoplasms |
|
|
• All cancers |
|
|
• Breast cancer |
|
|
• Colorectal cancer/colon polyps |
|
|
• Prostate cancer |
|
|
Cardiovascular diseases and hypertension |
|
|
Diabetes (type 2) and metabolic syndrome (obesity) |
|
|
Falls |
|
|
Immune response |
|
|
• Asthma |
—a |
|
• Autoimmune disease |
|
|
○ Diabetes (type 1) |
|
|
○ Inflammatory bowel and Crohn’s disease |
|
|
○ Multiple sclerosis |
|
|
○ Rheumatoid arthritis |
|
|
○ Systemic lupus erythematosus |
—a |
|
• Infectious diseases |
|
|
○ Tuberculosis |
—a |
|
○ Influenza/upper respiratory infections |
—a |
|
Neuropsychological functioning |
—b |
|
• Autism |
—b |
|
• Cognitive function |
—b |
|
• Depression |
—b |
|
Physical performancec |
|
|
Preeclampsia, pregnancy-induced hypertension, and other non-skeletal reproductive outcomes |
|
|
Skeletal health (commonly bone health) |
|
|
• Serum 25OHD, as intermediate |
|
|
• Parathyroid hormone, as intermediate |
|
|
• Calcium absorption |
|
|
• Calcium balance |
|
|
• Bone mineral content/bone mineral density |
|
|
• Fracture risk |
|
|
• Rickets/osteomalacia |
|
|
aSpecific condition not reviewed as a health outcome in AHRQ. bOutcome category not considered in AHRQ. cIn the discussions within this chapter, physical performance is considered together with falls to avoid redundancy. |
|
followed, in ascending order, by case reports, case series, case–control studies, cohort studies, and, finally, the highest form of evidence, the randomized, controlled, double-blind trial (Croswell and Kramer, 2009). Only the RCT can show a causal relationship between an intervention and an outcome. Observational evidence can show only associative links, not causality. The highest level of observational evidence is the cohort study—a large, population-based, prospective investigation to compare an exposed group with an unexposed group. However, the cohort study does not reach the level of evidence of an RCT, because the intervention is not a random or chance event; rather it is the choice of the investigator (Croswell and Kramer, 2009). Nested case–control studies are a type of cohort study and were considered at that level of evidence; in some literature, populations from RCTs were evaluated as a cohort (adjusting for treatment assignment or limiting the analysis to the control group) and thus are at the same level of evidence as other observational research.
A summary of the strengths and weaknesses of the various types of observational studies and RCT studies is shown in Table 4-2. Flaws, biases, and confounding effects are an inevitable aspect of any study design, and the strength of a study therefore depends on the ability of the investigator to control such methodological obstacles. In addition, even well-designed studies can be weakened by complications such as loss to follow-up, missing outcomes, subject non-compliance, and a biased selection process (Baker and Kramer, 2008).
The Process
In addition to its consideration of the AHRQ analyses, the committee conducted searches of several online bibliographical databases, including Medline, Science Direct, and WorldCat/First Search. Evidence searches were carried out to identify relevant RCTs in support of a causal relationship between vitamin D and/or calcium and the health outcome under consideration, and these were weighted as the strongest type of evidence for development of a DRI. The second tier of evidence considered was observational to support associative relationships between vitamin D and/or calcium and a health outcome. Further examination was carried out to determine the quality of the observational evidence and whether the results were in agreement with RCT outcomes for a specific indicator. Potential confounders were also taken into account. Figure 4-1 shows the committee’s ranking of evidence by the strength of the study design. In the figure, RCTs prevail over observational and ecological studies as the strongest evidential support and were therefore necessary for a health outcome indicator to be further considered for DRI development. When the totality of evidence, including causal evidence, was supported by concordance
TABLE 4-2 Comparison of the Strengths and Weaknesses of Observational Study Designs and Randomized Controlled Trials for Use in DRI Development
|
Study Type/Definition |
Strengths |
Weaknesses |
Quality Ranking For DRI Development |
|
Ecological |
|
|
Low |
|
An observational study in which the units of analysis are populations or groups of people, rather than individuals |
|
||
|
Cross–sectional |
|
|
Low moderate |
|
An observational study in which a statistically significant sample of a population is used to estimate the relationship between an outcome of interest and population variables as they exist at one particular time |
|
||
|
Case–control |
|
|
Moderate |
|
An observational epidemiological study of persons with the outcome variable of interest and a suitable control group of persons without the variable of interest |
|
|
Study Type/Definition |
Strengths |
Weaknesses |
Quality Ranking For DRI Development |
|
Cohort |
|
|
High moderate |
|
A method of epidemiological study in which subsets of a defined population can be identified as exposed to a factor hypothesized to influence the probability of occurrence of an outcome |
|
||
|
Randomized controlled trial |
|
|
High |
|
An experimental study design in which exposure is randomly assigned and in which the frequency of the outcome of interest is compared between one or more groups receiving an experimental treatment and a group receiving a placebo or the current standard of care |
|
||
|
SOURCE: Gordis (2009). |
|||
between RCTs and high-quality observational evidence and had strong biological plausibility, the committee gave further consideration to a potential indicator for development of a DRI. When observational evidence failed to support the findings of RCTs, the indicator’s validity for consideration was reevaluated, and a decision to give further consideration was made on the balance of the totality of evidence.
For each potential indicator discussed in this chapter, the review of evidence included consideration of the analytical approach, study population, and research protocol design and the overall quality of the evidence for each study reviewed. The introductory statement for each indicator includes ecological studies. Observations made from such studies require caution in their interpretation because the outcome measures are not known at the individual level, and inferring individual characteristics or
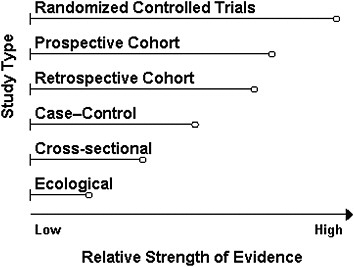
FIGURE 4-1 Ranking study designs: Ranking is shown in descending order of quality from top to bottom; the length of bars is arbitrary and indicates the relative strength of a study design.
relationships from group-level measures would be fallacious. Ecological studies, however, can contribute important information in more than an exploratory manner. Where it was relevant or needed in the absence of human studies, evidence for biological plausibility was included in the review as gleaned from experimental animal and mechanistic studies. The observational evidence reviewed included cross–sectional, case–control, and cohort (prospective and retrospective) studies. As pointed out previously, the strongest evidence among observational studies is from the cohort study. This study design offers an advantage over the case–control design in that it allows for observation of the incidence of a health outcome or the rate at which the health outcome develops in association with vitamin D or calcium intake or status in the population under study. In case–control studies, cases are included without identifying the entire “exposed” and “unexposed” populations from which they were derived, thus inferences drawn about a health outcome related to vitamin D or calcium intake or status are less reliable using this type of design.
As a tool to aid in the review process, the committee developed evidence “maps” for each indicator to provide an overarching view of the balance of relevant evidence from ecological and biological plausibility studies, observational studies, systematic reviews, and RCTs (including trials where the indicator was a primary outcome as well as other evidence from trials where the indicator was a secondary or non-pre-specified outcome). These served largely as an organizing tool and are included in Appendix F.
The organizational construct of the maps did not allow distinctions between studies relative to the quality of the study design; however, this was considered by the committee in the overall evaluation of data.
The nature of the data surrounding each potential indicator is described below, beginning with a brief statement about the condition under consideration, followed by a summary of the evidence for ecological and biological plausibility studies, observational studies, systematic reviews from the two AHRQ reports, and additional evidence not covered in the AHRQ reviews. Each indicator is then evaluated in a summary discussion of the utility of the evidence for DRI development.
REVIEW OF POTENTIAL INDICATORS
Owing to the importance of a variety of acute and chronic diseases as public health concerns and the accumulating data focused on the hypothesis that vitamin D and/or calcium may have an impact on disease risk, it was crucial that this committee consider a wide spectrum of indicators for DRI development. After reviewing the available data, including recent systematic reviews from AHRQ and other literature, the committee chose to focus on areas where the research database is most compelling and the indicator is of public health concern within the context of DRI development. The following discussions review the roles of vitamin D and calcium in the reduction of risk for the health indicators identified in Table 4-1.
The entirety of evidence for each indicator that was reviewed by the committee cannot be presented in detail here, and the following discussions are a summary of relevant evidence. In drawing its conclusions about an indicator, the committee evaluated the strengths and weaknesses of the studies considered for each indicator, including an examination of the methods used for measuring an indicator, its relevance to total intake and functional or physiological outcomes, and the strength of the study design. This approach is summarized in Box 4-2.
Cancer/Neoplasms
As the second leading cause of death in the United States, cancer is a major public health concern. Cancer encompasses a wide range of malignancies with many variations in etiology and pathogenesis. Thus, the committee considered not only total cancer, but also specific malignancies in which vitamin D and/or calcium have been examined for an interaction thought to play a role.
Cancer is a disease in which genetically damaged cells within a tissue experience uncontrolled growth and invasion with subsequent spread to other host organs. The metastatic spread leads to dysfunction of vital organs causing significant morbidity and culminating in death. An expanding
|
BOX 4-2 Evaluation of Evidence for DRI Development In its review of evidence, the committee used a qualitative approach to determine its confidence in interpreting positive or negative relationships between vitamin D and/or calcium and indicators of disease outcomes for DRI development. In analyzing and weighing the data, the committee considered the following factors:
The committee’s findings and conclusions were derived from its weighing of the totality of evidence and its ranking of evidence based on examination of study methods, relevance to dietary intake, effect of vitamin D and/or calcium on disease outcome, and overall strength of the study design. |
array of experimental studies examining cells in culture and rodent models of cancer are providing evidence that vitamin D may have an impact on carcinogenesis at several organ sites (Deeb et al., 2007; Welsh, 2007; Davis, 2008). In parallel, epidemiological investigations of diverse approaches are examining the role of vitamin D in human cancer (WCRF/AICR, 2007; Yetley et al., 2009). In contrast, very few randomized and controlled prospective intervention trials with vitamin D targeting cancer as the primary outcome have been undertaken, leaving major gaps in understanding of causal relationships. Although more challenging to study in vitro, studies of dietary calcium in rodent models have also suggested a potential role in cancer risk; there are, as discussed below, experimental and clinical studies providing evidence in support of calcium as a modulator of carcinogenesis, particularly in the colon and rectal mucosa.
All Cancers
Cancer represents hundreds of different histopathologically distinct types of malignancy derived from virtually all organs and tissues. Investi-
gations into the cellular defects contributing to the carcinogenic process indicate that cancers, regardless of tissue origin, share in a specific set of defective biological processes (Hanahan and Weinberg, 2000) that enhance cell proliferation, survival, invasion, and metastasis. Although cancer studies initially suggested the possibility of a tissue-specific gene expression signature unique to a cancer type, it is now appreciated that multiple different mutational patterns contribute to the heterogeneity in biology and response to intervention among humans with cancer.
Biological plausibility Serum 25OHD levels are determined by both dietary intake and endogenous synthesis in the skin upon exposure to ultraviolet B (UVB) light. UVB exposure is often used as an indirect estimate of endogenous production of vitamin D in ecological studies of cancer incidence patterns. Several investigators associated lower UVB exposure with higher cancer mortality beginning decades ago (Apperley, 1941) and continuing with improved methods of estimating exposure (Boscoe and Schymura, 2006), as reviewed by IARC (2008). However, a large literature suggests that increasing latitude cannot be equated with decreasing vitamin D status, and cancer risk factors (exposure to UVB or other forms of ionizing radiation) vary with latitude. Importantly, an opposite gradient is well established for skin cancers, with a greater risk among populations residing in areas of high sun exposure (IARC, 1992). In general, ecological studies based upon estimated UVB exposure, vitamin D status, and cancer risk have many potential biases due to methodological considerations making causal biological inferences, particularly at the level of the individual, impossible.
Systematic reviews and meta-analyses Assessment of total cancer risk has been the subject of systematic reviews, including IARC (2008), WCRF/AICR (2007), and AHRQ-Tufts. Several studies, including those reviewed in AHRQ-Tufts, were examined by the committee in detail. Three intervention trials that examined total cancer as an outcome were identified from these reviews; these trials were originally designed to assess fracture risk, and none included total cancer as a pre-specified primary outcome (see Table 4-3). In both the Trivedi et al. (2003) and Lappe et al. (2007) osteoporosis trials cancer risk was determined from a secondary analysis of safety data that relied upon subjects notifying the investigators of the new diagnosis. Neither trial indicated a significant reduction in cancer incidence with vitamin D supplementation, whether given alone (Trivedi et al., 2003) or in combination with calcium and compared with calcium supplementation alone (Lappe et al., 2007). In the Lappe et al. (2007) trial, however, logistic regression analysis showed a significant reduction in risk for all cancers in the vitamin D plus calcium treatment group when
TABLE 4-3 Vitamin D, Calcium,a and Total Cancer: Results of RCTs Reviewed in AHRQ-Tuftsb
|
Reference; Location (Latitude) |
Population Description |
Background Calcium and Serum 25OHD |
Outcome |
Intervention, Daily Dose |
n Event/N Total |
Outcomes: Metric (Comparison); Result; 95% CI |
|
Lappe et al., 2007 |
Postmenopausal women |
25OHD: 71.8 nmol/L |
Incident cancer (all causes) |
Vit D3 1,000 IU + Ca (citrate 1,400 mg or carbonate 1,500 mg) |
13/446 |
RR (Vit D + Ca vs. Ca) |
|
0.76 |
||||||
|
Nebraska, United States (41°N) |
Mentally and physically fit |
|
|
|
|
|
|
|
|
|
|
0.38–1.55 |
||
|
|
|
Ca (citrate 1,400 mg or carbonate 1,500 mg) |
17/445 |
|||
|
Mean age 67 years |
|
|
||||
|
|
Incident cancer (restricted to patients who were free of cancer at 1-year intervention) |
Vit D3 1,000 IU + Ca (citrate 1,400 mg or carbonate 1,500 mg) |
8/403 |
RR (Vit D + Ca vs. Ca) |
||
|
|
0.55 |
|||||
|
|
0.24–1.28 |
|||||
|
|
Ca (citrate 1,400 mg or carbonate 1,500 mg) |
15/416 |
|
|||
|
Trivedi et al., 2003 |
General population |
25OHD: 53.4 nmol/L |
Incident cancer (all causes) |
Vit D3 ~ 833 IU (100,000 IU every 4 months) |
188/1,345 |
HR (Vit D vs. placebo) |
|
1.09 |
||||||
|
Oxford, UK (52°N) |
Mean age 75 (65–85) years |
Calcium intake: 742 mg/day (at 4 years; no difference by treatment allocation) |
|
Placebo |
173/1,341 |
|
|
|
|
|
0.86–1.36 |
|||
|
Total cancer mortality |
Vit D3 ~ 833 IU (100,000 IU every 4 months) |
63/1,345 |
HR (Vit D vs. placebo) |
|||
|
0.86 |
||||||
|
Placebo |
72/1,341 |
|
||||
|
|
|
0.61–1.2 |
||||
|
NOTE: CI = confidence interval; HR = hazard ratio; IU = International Units; RR = relative risk; UK = United Kingdom; Vit = vitamin. aCalcium is included in Lappe et al. (2007) only. bThis table has been truncated for the purposes of this chapter, but it can be found in its entirety in Appendix D. SOURCE: Modified from Chung et al. (2009). |
||||||
compared with the placebo group. Notably, the investigators could not exclude that cancers had been present at baseline or that cancers remained unnoticed at the end of the study. Moreover, the analysis of the multitude of outcomes in safety data raises the possibility of chance results that seem to be statistically significant but are the result of multiple comparisons being made within one data set.
Observational evidence in AHRQ-Tufts included a large 12-year prospective study of a cohort from the Third National Health and Nutrition Examination Survey (NHANES III) that examined associations between serum 25OHD levels and total cancer mortality as well as specific cancer mortalities. Serum 25OHD levels were found to be associated with gender, educational level, and race/ethnicity, but not with season/latitude. No interaction was detected, however, between serum 25OHD level and total cancer mortality (Freedman et al., 2007). In one frequently cited study included in the AHRQ-Tufts review, Giovannucci et al. (2006) prospectively examined a large cohort from the Health Professionals Follow-up Study (HPFS) for 14 years for multiple determinants of vitamin D, including diet, supplements, skin pigmentation, adiposity, and geography, and their associations with cancer mortality. This study found that each incremental increase in serum 25OHD level of 25 nmol/L was associated with a 17 percent reduction in total cancer incidence and a 29 percent reduction in total cancer mortality. Each of the determinants considered was found to influence plasma 25OHD levels among older men. These results should be viewed with caution, however, because of heterogeneity in serum 25OHD levels that is not accounted for by the variables used in the study, which included intakes based on self-administered semiquantitative food frequency questionnaires and self-reported weight and physical activity levels.
Taken together, the studies reviewed by AHRQ-Tufts, IARC (2008), and WCRF/AICR (2007) as a whole are not supportive of a role for vitamin D, with or without calcium in reducing risk for cancer.
Additional evidence from randomized controlled trials In addition to the trials identified in AHRQ-Tufts, a secondary analysis of data from the Women’s Health Initiative (WHI) trial examined the effect of combined supplementation of vitamin D and calcium (400 International Units [IU] of vitamin D and 1,000 mg of elemental calcium) on various health outcomes including cancer mortality (Lacroix et al., 2009). The results, with an average of 7 years of follow-up, indicated a non-significant trend toward reduction in risk for cancer mortality among postmenopausal women.
Observational studies One additional large cohort study, not included in the AHRQ reviews, was identified that examined serum 25OHD levels and risk for cancer mortality. This study examined cancer mortality among patients referred for coronary disease after a median of 7.75 years and
found a significant correlation between low serum 25OHD level defined as less than 25.5 nmol/L, and increased cancer mortality. No associations were detected, however, between calcitriol level and cancer mortality (Pilz et al., 2008). In total, the observational studies reviewed suggest that the association between 25OHD level and risk of death from all cancers is generally weak when considered over a broad range of serum 25OHD levels because of variability in outcomes between the studies reviewed. However, there may be a stronger association between low serum 25OHD levels and cancer risk. The evidence reviewed was not strong enough to conclude that associations between cancer mortality were dependent on latitude, or race/ethnicity.
The role of calcium in cancer risk was examined in one large prospective cohort study over 7 years of follow-up (Park et al., 2009). Calcium intake was found not to be related to total cancer risk in men, but a non-linear reduction in total cancer incidence in women was reported. A decreased cancer risk was found for calcium intakes up to approximately 1,300 mg/day, although no additional risk reduction was observed for higher intakes. Taken together, the heterogeneity among outcomes exhibited in these studies and the discrepancy in outcomes between observational and randomized trial evidence do not support a relationship between vitamin D or calcium and total cancer risk.
Concluding statement The totality of the available evidence from RCTs and observational association studies for a relationship between vitamin D and/or calcium and the risk for either incidence of or mortality from all cancers does not support the use of cancer mortality as an indicator for DRI development. The interpretation of the evidence reviewed is limited by the small number of studies identified and lack of consistency in associations between vitamin D intake or serum 25OHD levels and all cancer mortality. Interpretation is further complicated by the absence of large-scale RCTs examining total cancer risk as a pre-specified primary outcome. Given the lack of consistent evidence on associations between vitamin D intake or serum 25OHD level and total cancer, and the paucity of evidence on cancer as a primary outcome of vitamin D or calcium intervention in randomized trials, as well as inconsistency between findings in the available research for an effect of vitamin D or calcium supplementation or status on reducing risk for cancer, the committee could not draw a conclusion about the utility of the evidence for this indicator to support DRI development.
Breast Cancer
Risk for breast cancer is largely defined by reproductive endocrinology, with increased risk for those with early age of menarche, late menopause, no pregnancy, later age of first pregnancy, shorter duration of lactation, the
use of postmenopausal hormonal supplementation (Fentiman, 2002; Velie et al., 2005; Narod, 2006; Parsa and Parsa, 2009; Dietel, 2010). Dietary-related factors have been extensively reviewed with alcoholic drinks, adult attained height, and adult weight gain likely contributing to risk and with physical activity showing some benefit (WCRF/AICR, 2007). These characteristics must be considered when evaluating other putative breast cancer risk factors.
Biological plausibility The influence of the active form of vitamin D (calcitriol) on breast cancer cells in vitro is well characterized and includes anti-cancer effects such as cell cycle inhibition, reduced proliferation, enhanced sensitivity to apoptosis, and induction of differentiation markers (Welsh, 2004), which are likely mediated by the vitamin D receptor (VDR) (Matthews et al., 2010). A shortcoming in applying results from cell culture studies to risk for disease, however, is that the dose of calcitriol necessary to achieve tumor inhibition in vivo is frequently associated with hypercalcemic toxicity (Welsh, 2004; Matthews et al., 2010). Novel genomic approaches have begun to elucidate the gene expression signature of vitamin D in breast cancer cells and the mammary glands of mice (Matthews et al., 2010). Many of the genes identified show a consensus vitamin D response element (VDRE) in their promoter elements, indicating that they are specific targets of the vitamin D receptor (VDR1) complex (Swami et al., 2003; Matthews et al., 2010). Since the discovery of polymorphisms in the Vdr gene, a search for associations of mutations with breast cancer has been undertaken, but with indeterminate results (Bertone-Johnson, 2009; McKay et al., 2009). An inverse association has been postulated between mammographic density, a putative breast cancer risk factor, and serum 25OHD levels in premenopausal women (Berube et al., 2004; Brisson et al., 2007). The role of dietary calcium intake and in breast cancer risk, however, is less well studied, and the potential biological mechanisms of action are not understood.
Systematic reviews and meta-analyses AHRQ-Tufts did not find any qualified systematic reviews that evaluated associations between vitamin D and calcium intake or serum 25OHD levels and risk for breast cancer. Three observational studies of sufficient methodological quality were identified that examined the relationship between 25OHD levels and breast cancer risk. A prospective cohort study described above for total cancer mortality reported that women whose 25OHD levels were in a higher stratification, were at significantly lower risk for breast cancer. There were, however,
only eight women in the higher stratification and a linear trend analysis was not significant (Freedman et al., 2007). A nested case–control study using data from the Nurses’ Health Study (NHS) (Bertone-Johnson et al., 2005) found no significant relationship between higher plasma 25OHD concentrations and decreased risk for breast cancer overall, except when the population was restricted to women over 60 years of age. Another nested case–control cohort study of postmenopausal women participating in the Prostate, Lung, Colorectal, and Ovarian (PLCO) Cancer Screening Trial also found no evidence supporting the hypothesis that higher plasma 25OHD concentrations were associated with reduced risk of breast cancer in this cohort (Freedman et al., 2008).
Analysis of the results of RCTs reviewed in AHRQ-Tufts found no significant effect of supplementation with both vitamin D and calcium on breast cancer incidence and no association between the intervention and risk for death from breast cancer. Subjects with lower baseline 25OHD levels were found to be at increased risk for breast cancer; however, the association was not significant after adjusting for body mass index and physical activity (Chlebowski et al., 2008).
A meta-analysis of evidence from observational studies carried out by IARC (2008) evaluated associations between serum vitamin D levels and cancer. The analyses for breast cancer risk indicated no significant or consistent associations. A literature review and all-inclusive meta-analysis of published studies of heterogeneous quality individually examined the impact of estimated vitamin D intake, circulating 25OHD levels, and calcium intake on breast cancer risk (Chen et al., 2010). Their analysis suggests an inverse relationship between risk and level of vitamin D intake, serum 25OHD3 level, and calcium intake.
Additional evidence from randomized controlled trials WHI was used as a data source in an 8-year follow-up study for risk of benign proliferative breast disease, a putative premalignant condition associated with increased risk of subsequent cancer (Rohan et al., 2009). This study identified an association between risk for breast cancer and baseline age but found no effect of supplemental calcium and vitamin D intervention on reducing risk for breast cancer.
Observational studies Several case–control and cohort studies conducted subsequent to the systematic reviews were identified that examined associations between dietary and supplemental intake of vitamin D and calcium and risk for breast cancer, and these have shown mixed results. Rossi et al. (2009), a large case–control study in Italy, found an inverse association between vitamin D intake and risk for breast cancer at intakes of 188 IU/day or greater, suggesting a threshold effect; however, when risk was cal-
culated in the upper three deciles compared with the lower seven deciles the significant difference was attenuated. A population-based case–control study of women ages 25 to 74 years in Canada compared vitamin D and calcium intake from food alone or from food and supplements. When intake above 400 IU of vitamin D per day was compared with no intake, a reduced risk was found. Calcium supplement intake alone, however, did not correlate with reduced risk, although a significant inverse trend was identified (Anderson et al., 2010). Two studies were identified that examined associations between dairy intake and risk of breast cancer. Shin et al. (2002) analyzed data from the NHS 1980 cohort for dairy intake and incident breast cancer. Over 16 years of follow-up, a significant inverse association was found for premenopausal women consuming low-fat dairy products and breast cancer risk. No association was found for calcium and vitamin D intake and postmenopausal breast cancer risk. Supplemental calcium intake had no linear association and supplemental vitamin D intake a weak but non-significant association with breast cancer risk in both premenopausal and postmenopausal women. Using a similar study design, McCullough et al. (2005), in an analysis of participants from the Cancer Prevention Study II Nutrition Cohort, found that two or more daily servings of dairy products were inversely associated with breast cancer risk; however, no association was found for either calcium or vitamin D supplementation. Women with dietary calcium intakes above 1,250 mg/day had lower breast cancer risk than women with intakes at or below 500 mg/day. Altogether, these observational studies were of lower quality and thus not considered as strong support for an association between vitamin D and risk for breast cancer, and they were not well supported by randomized trial evidence.
Concluding statement In summary, although experimental studies are suggestive of a role for vitamin D in breast biology, a review of the available evidence from both RCTs and observational studies of associations between vitamin D and calcium and risk of breast cancer shows a lack of consistency between study outcomes and insufficiently strong evidence to support DRI development. Both retrospective and prospective studies do not show consistent associations between estimated vitamin D intake or 25OHD status and breast cancer risk. A paucity of RCTs of vitamin D, calcium, or both with breast cancer as a primary outcome further limited the strength of the evidence.
Colorectal Cancer/Colon Polyps
Foods, nutrients, and physical activity all interact in a complex array of mechanisms to influence colorectal cancer risk. There is convincing evidence that physical activity protects against colorectal cancer, whereas
red and processed meat, body fatness, and alcohol may increase the risk (WCRF/AICR, 2007). The committee’s review of studies on vitamin D and calcium and risk for colorectal cancers and possible protective benefits identified for calcium and vitamin D was inconclusive.
Biological plausibility A major role of the active form of vitamin D is to enhance calcium absorption by the intestine, and the molecular and cell biology has been well defined (Song and Fleet, 2007; Xue and Fleet, 2009). The VDR and the vitamin D converting enzyme, 1α-hydroxylase, are both expressed in the colon and rectum (Cross et al., 1997; Holt et al., 2002). Vitamin D has been reported to act on colonic epithelial and cancer cells to regulate growth factor and inhibitor expression and signaling pathways, including modulation of the cell cycle, sensitivity to apoptosis, and enhancement of cellular differentiation (Harris and Go, 2004; Yang et al., 2007). Many rodent models of colon carcinogenesis suggest that there is an increased risk for colon cancer associated with vitamin D deficiency; and a decreased risk associated with supplementation (Harris and Go, 2004; Yang et al., 2008; Newmark et al., 2009). However, few studies were identified that examined vitamin D over a range of dose levels. A recent review of findings from the Vdr-null mouse model indicates an increase in hyperplasia of the distal colonic epithelium and greater deoxyribonucleic acid (DNA) damage in vitamin D–deficient compared with wild-type mice (Bouillon et al., 2008). The independent role of calcium in modulating colon cancer risk is also under investigation. Although intracellular calcium plays a key role in cell biology and influences growth control processes that may be related to carcinogenesis, serum calcium is tightly regulated over a wide range of intakes. Thus, the potential mechanisms by which serum calcium levels could mediate risk for colon cancer may be through indirect effectors in metabolic pathways involved in tumorigenesis.
Systematic reviews and meta-analyses
Colorectal cancer The AHRQ-Tufts systematic review considered evidence for associations between 25OHD levels and risk for colorectal cancer mortality or incidence. One RCT found no significant difference between colorectal mortality or incidence and supplementation with vitamin D in an elderly population. One cohort study was identified that found an inverse association between high serum 25OHD levels and risk for colorectal cancer mortality, and two nested case–control studies in women found an inverse trend between serum 25OHD level and colorectal cancer incidence. Two nested case–control studies in men and three in both men and women found no significant associations between serum 25OHD level and risk of colorectal cancer.
The IARC (2008) meta-analysis found a significant protective effect for
serum 25OHD level against risk for colorectal cancer that correlated with each 2.5 nmol/L increase, although there was significant between-study heterogeneity. The results did not significantly differ by gender, mean population age, or cancer subsite (colon or rectum). The review noted that, based on multiple studies of circulating 25OHD and colorectal cancer risk, individuals in the high quartile or quintile of 25OHD level had about half the risk of colorectal cancer as did those in the lowest group. In another systematic review of studies examining associations between serum 25OHD levels and colorectal cancer, Bischoff-Ferrari et al. (2006a) concluded that the protective effect of 25OHD for decreased risk of colorectal cancers began at 75 nmol/L, and optimal levels were between 90 and 100 nmol/L. In contrast to these findings, the AHRQ-Ottawa systematic review reported that the studies reviewed were too inconsistent to permit conclusions to be drawn about specific serum 25OHD levels that conferred a decrease in risk.
Colorectal adenomas/polyps The AHRQ-Tufts systematic review considered evidence for associations between 25OHD levels and risk for colorectal adenomas. Colorectal adenomas or polyps are precursor lesions for colon cancer, and a number of investigations focused on the influence of vitamin D or calcium on the incidence of these surrogate markers for human colon carcinogenesis. A meta-analysis by Wei et al. (2008) of seven studies suggested that at the upper quintiles of circulating 25OHD levels there was a significant decrease in risk for colorectal adenoma. In parallel, these authors conducted a meta-analysis of vitamin D intake and colorectal adenoma risk in seven cohort and five case–control studies and found a marginally significant (11 percent) decreased risk among persons with high compared with low vitamin D intakes. The cut-points for the highest category of vitamin D intake varied between studies, with about one-third of the studies reporting cut-points of approximately 600 IU/day, one-third reporting cut-points between 250 and 600 IU/day, and one-third reporting cut-points of below 250 IU/day.
Stronger evidence has accumulated for a role of dietary calcium. The AHRQ-Tufts analysis identified four good quality cohort studies that evaluated the association between calcium intake and risk for colorectal adenoma. Two of these studies recruited men and women with a history of previous colorectal adenoma. One study found a significant inverse association between total calcium intake and colorectal adenoma recurrence after an average of 3.1 years of follow-up (highest [> 1,279 mg/day] vs. lowest [< 778 mg/day]) intake, whereas another found no significant association. Among two studies of healthy women without a history of colorectal adenoma one found a significant inverse association between total calcium intake and colorectal adenoma (highest vs. lowest intake, whereas the other found a borderline significant trend (highest [median, 1,451 mg/day] vs. lowest [median, 584 mg/day] intake. A Cochrane systematic review identified two randomized trials that found that calcium supplementation
reduced the incidence of recurrent colorectal adenoma (Weingarten et al., 2008). Overall, the evidence is suggestive that vitamin D and probably calcium may reduce the risk of this intermediate endpoint for colorectal cancer, but the available data are not sufficient to allow a definitive assessment of the effects of vitamin D, calcium, and their interactions on risk for new or recurrent colorectal adenomas.
Additional evidence from randomized controlled trials The committee did not identify any additional relevant RCTs assessing vitamin D or calcium intake and risk for colorectal cancer or adenomas.
Observational studies The European Prospective Investigation into Cancer and Nutrition (EPIC) study has recently reported data on more than 1,200 colorectal cancer cases and an equal number of controls (Jenab et al., 2010). In this report, serum concentrations lower than the pre-defined mid-level concentrations of 25OHD (50 to 75 nmol/L) were associated with higher colorectal cancer risk. Jenab et al. (2010) also reported that higher 25OHD concentrations of 75 to less than 100 nmol/L and 100 nmol/L and higher were associated with a decreased risk. No other relevant observational studies were identified outside the AHRQ reviews. Although this evidence was largely in agreement with the IARC (2008) findings and Bischoff-Ferrari et al. (2006a), the committee did not consider it convincing enough to outweigh the conclusions from both AHRQ reviews.
Concluding statement Taken in aggregate, epidemiological studies examining associations between vitamin D status and colorectal cancer incidence generally support an inverse association, although the shape of the dose–response relationship curve over a wide range of vitamin D intake remains very speculative. The biological plausibility is supported by data from cell culture and rodents, with additional support from surrogate biomarker studies in humans. There remains a paucity of prospective randomized intervention studies, and those available have not shown a significant relationship at this time. Thus, the data are insufficient for the committee to utilize colon cancer as an outcome for establishment of vitamin D DRIs. The data for an effect of dietary calcium on colorectal cancer risk are also highly suggestive of a protective effect, but there are not sufficient data available on dose–response relationships to utilize colorectal cancer as a health outcome for DRI development.
Prostate Cancer
Prostate cancer risk is strongly associated with aging and is clearly dependent upon prolonged exposure to testosterone. Unlike breast cancer
in women, however, where specific reproductive events define risk, further characterization of the relationship has been challenging. Specific dietary and nutritional hypotheses, including a role for vitamin D and calcium, have been proposed but evidence supporting these relationships is not conclusive.
Biological plausibility Studies in vitro document that prostate cancer and prostate epithelial cells in culture respond to calcitriol with anti-proliferative effects and that calcitriol stimulates cell differentiation (Washington and Weigel, 2010). Evidence indicates that these effects, as for epithelial cells of other tissue origins, are mediated by the VDR expressed on prostate cells (Kivineva et al., 1998; Thorne and Campbell, 2008). Gene expression array studies provide evidence that calcitriol induces a pattern of gene expression that inhibits growth factor signaling and cell cycle progression, promotes differentiation, and is anti-inflammatory and anti-angiogenic (Krishnan et al., 2004; Peehl et al., 2004; Kovalenko et al., 2010). The role of dietary calcium intake in prostate cancer risk is less well studied, with inconsistent results, and the potential biological mechanisms of action are highly speculative.
Systematic reviews and meta-analyses The AHRQ-Tufts systematic review found no qualified systematic reviews assessing associations between serum 25OHD levels and incidence of prostate cancer. Among observational studies reviewed, 8 of 12 nested case–control studies found no association between baseline serum 25OHD levels and risk for prostate cancer, and only 1 (C-rated) (Ahonen et al., 2000) reported a significant association between baseline serum 25OHD levels below 30 nmol/L and higher risk of prostate cancer, compared to those with levels greater than 55 nmol/L. Further, the effect appeared to be stronger for men younger than age 52 at entry into the study. A meta-analysis by Huncharek et al. (2008) of 45 observational studies on dairy and milk intake and risk of prostate cancer showed no significant association between dietary intake of vitamin D and prostate cancer risk.
Additional evidence from randomized controlled trials No relevant RCTs that were not reviewed by AHRQ were identified for vitamin D or calcium intervention and risk for prostate cancer.
Observational studies Three observational studies not included in either AHRQ-Ottawa or AHRQ-Tufts were identified as potentially relevant to prostate cancer as a health indicator for vitamin D and calcium. Schwartz and Hulka (1990) suggested that vitamin D deficiency was a causative
factor in prostate cancer based upon the observation that the prevalence of vitamin D deficiency increases with age and is greater in those with dark-pigmented skin types and northern European populations, coupled with the observation that mortality rates for prostate cancer appear to be inversely related to sun exposure. However, a more recent case–control analysis of data from the Alpha-Tocopherol, Beta-Carotene Cancer Prevention (ATBC) Study, which examined male smokers, found no association; including any age-related associations to support a relationship between serum 25OHD levels and incidence of prostate cancer (Faupel-Badger et al., 2007). A potential procarcinogenic effect of higher dietary calcium was suggested by the HPFS (Giovannucci et al., 1998), which reported that calcium intake from the diet or from diet and supplements was independently associated with risk of locally advanced or metastatic prostate cancer especially when intakes exceeded 2,000 mg per day. The potential role for calcium as a risk factor for prostate cancer is discussed in detail in Chapter 6.
Because of the complexity of assessing vitamin D exposure over time relative to prostate cancer risk, high-quality evidence from observational studies was limited. The results of the HPFS, the only large, prospective cohort study identified for calcium, are not supported by evidence from available RCTs. Therefore, the evidence from human studies is insufficient to permit the committee to draw conclusions about a role for vitamin D and/or calcium in reducing prostate cancer risk.
Concluding statement Overall experimental data indicating that cultured prostate epithelial and prostate cancer cells respond to vitamin D via the VDR suggest a role for vitamin D in prostate cancer. However, associational studies of vitamin D status and risk of prostate cancer have provided mixed results, and randomized controlled clinical trials of substantial quality examining incidence or mortality have not been reported. Thus, there are insufficient data to permit the committee to draw a conclusion about the utility of the evidence for this indicator to support DRI development.
Cardiovascular Diseases and Hypertension
CVD broadly describes a range of diseases affecting the heart and blood vessels. Diseases that fall under the umbrella of CVD comprise coronary artery disease, myocardial infarction, stroke/cerebrovascular disease, peripheral artery disease, atherosclerosis, hypertension, arrhythmias, heart failure, and other vascular disorders. CVD is a public health concern because it is associated with an enormous burden of illness, disability, and mortality. CVD and hypertension were considered as potential indicators
based on proposed hypotheses that vitamin D alone or in combination with calcium may help to prevent CVD or hypertension. Calcium has also been implicated independently as a nutrient related to reducing risk for development of CVD. Limited data were available for this indicator in the 1997 DRI report (IOM, 1997); however, additional experimental animal and observational studies for both vitamin D and calcium and CVD have been published in the interim.
Biological Plausibility
Vitamin D has been linked to decreased risk for CVD. Ecological studies suggest that there is higher cardiovascular mortality during the winter and in regions with less average exposure to UVB radiation from sunlight (Zittermann et al., 2005). Various biological mechanisms have been proposed in support of this hypothesis. Experimental animal studies failed to demonstrate an effect of vitamin D on risk for hypertension (Li et al., 2004) and increased thrombogenicity (Aihara et al., 2004). In rodents, administration of calcitriol or its analogues enhances vascular reactivity (Hatton et al., 1994). In support of the hypothesis that biological activation of vitamin D is relevant to cardiovascular function, the Vdr-null mouse has been used to model CVD.
High dietary calcium intake may help to reduce CVD risk through its roles in decreasing intestinal absorption of lipids and increasing lipid excretion, lowering blood cholesterol levels, and promoting calcium influx into cells.
Systematic Reviews and Meta-Analyses
The AHRQ-Tufts report identified one RCT and four relevant observational studies for vitamin D and cardiovascular outcomes. The RCT (Trivedi et al., 2003) found no statistically significant difference in incidence of cardiovascular events and deaths for subjects treated with 100,000 IU of vitamin D every 4 months over 5 years of follow-up. Among the observational studies reviewed, the Framingham Offspring Study found a significant association between low serum 25OHD levels and incident CVD (T. J. Wang et al., 2008). However, a closer look at the individuals with the highest serum 25OHD levels suggests that there was no additional reduction in risk at levels greater than 75 nmol/L and that the dose–response relationship may be U-shaped above 75 nmol/L. In the HPFS, Giovannucci et al. (2008), using a nested case–control design, found a significant association between low (< 37.5 nmol/L) serum 25OHD levels and incident myocardial infarction. A study using data from NHANES III, however,
found no significant association between serum 25OHD levels and cardiovascular mortality overall, although individuals with the lowest 25OHD levels experienced a significant increase in total mortality compared with those with the highest levels. Echoing the findings for incident CVD in the Framingham Offspring Study, a closer examination of the highest 25OHD levels suggested a U-shaped dose–response relationship, with increased total mortality at both the lowest and highest 25OHD levels in this cohort (Melamed et al., 2008). The fourth observational study reported in AHRQ-Tufts (Marniemi et al., 2005) also failed to find an association between serum 25OHD levels and total CVD incidence, although it did find that vitamin D intake predicted a decreased risk for stroke. With the exception of one case–control study, the overall findings from the observational studies reviewed reaffirm a lack of significant association between 25OHD level and CVD risk and that higher 25OHD levels may incur an increased risk for CVD. From this, AHRQ-Tufts concluded that the evidence was insufficient to support a relationship between vitamin D or calcium and risk for CVD.
A recent meta-analysis of randomized trials using calcium supplements (without vitamin D) suggested that calcium supplementation was associated with an increase in the risk of myocardial infarction (Bolland et al., 2010a). However, another recent meta-analysis that included CVD as a secondary outcome found a slightly reduced, but not significant, risk for CVD with vitamin D supplementation, no association with calcium supplementation, and no association with a combination of vitamin D plus calcium supplementation (Wang et al., 2010).
Additional Evidence from Randomized Controlled Trials
No new RCTs were identified that examined CVD as a pre-specified primary outcome although several trials analyzed CVD as a secondary treatment outcome, and the findings of secondary outcome studies were not supportive of a reduction in CVD risk for either vitamin D or calcium. Among the additional RCTs reviewed outside the AHRQ reviews examining CVD as a secondary outcome (Hsia et al., 2007 [400 IU vitamin D3/1,000 mg calcium]; Major et al., 2007 [400 IU vitamin D/1,200 mg calcium]; Margolis et al., 2008 [400 IU vitamin D3/1,000 mg calcium]; Prince et al., 2008 [1,000 IU vitamin D2/1,000 mg calcium]; Manson et al., 2010 [400 IU vitamin D3/1,000 mg calcium]), none found a significant treatment-related effect of vitamin D on risk of CVD (see Evidence Map in Appendix F). In a 5-year study of calcium intake and risk for CVD in New Zealand, Bolland et al. (2008) found that women taking 1,000 mg of elemental calcium had a significantly higher risk (compared to placebo) for myocardial infarction and a composite CVD endpoint of myocardial infarction, stroke, and sud-
den death. However, when unreported events identified from a national database were added to the analysis, the increased cardiovascular risks in the calcium group were no longer statistically significant. A bone density trial, also conducted in New Zealand, assessing self-reported composite vascular events among men was also not significant for an interaction between 1,000 mg of calcium daily and CVD outcomes (Reid et al., 2008). The results of these trials are in agreement with the null findings of the AHRQ-Tufts review described above. The additional clinical trials reviewed did not show a statistically significant causal relationship between either vitamin D or calcium and decreased cardiovascular risk, and reductions in risk that were noted in some trials were not well supported by data analyses. Therefore, the totality of the evidence does not support an interaction between either vitamin or calcium and risk for CVD. Adverse cardiovascular effects associated with excess calcium intake were also noted, and these are discussed further in Chapter 6.
Observational Studies
In addition to the clinical trials reviewed, including those from AHRQ, several observational studies were identified that examined a role for vitamin D and/or calcium in reducing CVD risk. Two large, prospective cohort studies were identified. In one study of individuals at high risk of CVD, among coronary angiography patients followed for more than 7 years, those with the lowest serum 25OHD levels had significantly higher total mortality and cardiovascular mortality compared with those with the highest levels (Dobnig et al., 2008). Melamed et al. (2008) assessed 25OHD levels and prevalence of peripheral artery disease using data from NHANES 2001 to 2004. This study found a graded association between levels of 25OHD up to 29.1 nmol/L and levels of 29.2 nmol/L and above. In a trend analysis, a statistically significant difference was found between the lower 25OHD levels compared with the higher levels.
A number of small cohort studies were identified that evaluated serum 25OHD or calcitriol levels in patients at risk for various CVD indicators compared with control subjects who were free of CVD indicators. Watson et al. (1997) assessed calcitriol levels in subjects at high risk for developing coronary heart disease compared with asymptomatic individuals and found a significant inverse association between calcitriol and amount of vascular calcification in both groups, although the difference was greater in the at-risk group. Poole et al. (2006) compared serum 25OHD levels in a small group of patients admitted for a first stroke with those of healthy controls and found that serum 25OHD levels were significantly lower among stroke patients. Zittermann et al. (2003) compared both 25OHD and calcitriol levels against serum levels of biomarkers indicative of congestive heart
failure in a small group of patients admitted for treatment and in free-living controls. The study found a significant difference in biomarker levels between treated patients compared with controls for both 25OHD and calcitriol levels.
One small case–control study was identified that determined the relationship between serum 25OHD levels and risk for myocardial infarction in at-risk patients compared with normal controls. In this study, Scragg et al. (1990) found that serum 25OHD levels were significantly lower in myocardial infarction cases than in controls and that the difference was greater (but not significantly so) during the winter.
Although these studies together provide evidence for lower serum 25OHD levels in individuals with CVD, whether the low serum 25OHD levels are sufficient to predict risk for CVD has not been clearly established. Additional evidence indicates that low serum 25OHD levels are associated with risk factors for CVD—specifically, increased carotid arterial thickness (Targher et al., 2006)—and apparent CVD in patients with type 2 diabetes (Cigolini et al., 2006; Chonchol et al., 2008). Additionally, some studies suggest a positive association between vitamin D intake and CVD risk factors associated with other chronic conditions, including hypertension (Krause et al., 1998; Pfeifer et al., 2001; Forman et al., 2007; L. Wang et al., 2008; Wang et al., 2010), impaired glucose tolerance or type 2 diabetes (Liu et al., 2005; Pittas et al., 2006, 2007a; Mattila et al., 2007), and inflammation (Timms et al., 2002; Schleithoff et al., 2006; Shea et al., 2008).
Risk of incident hypertension in relation to dietary vitamin D intake has been evaluated in three large prospective study cohorts; NHS 1, NHS 2, and the HPFS for 8 years and longer. Women in NHS 1 and NHS 2 (a younger cohort) showed no association between vitamin D intake and risk for incident hypertension. Likewise, among men from the HPFS no association was found between vitamin D intake and risk for incident hypertension. Al-Delaimy et al. (2003) also found no association between calcium intake, vitamin D intake, or total dairy intake and risk for total ischemic heart disease in men enrolled in the HPFS. Similarly, no association was found when the cohort was analyzed for calcium supplement intake, although an inverse association was identified between calcium intake among supplement users compared with nonusers and fatal ischemic heart disease only.
In contrast to the intake studies, in a prospective study, Forman et al. (2007) found inverse associations between incidence of hypertension and measured serum 25OHD levels in a larger cohort in the HPFS and in women from a larger cohort in NHS.
In summary, three of four large, prospective cohort studies reviewed found associations between serum 25OHD levels and risk for CVD. Among the many smaller observational studies of lower quality that were identified,
most did not find a significant positive association between vitamin D and calcium intake and risk for CVD. Taken together, this observational evidence was strong enough to support a relationship between serum 25OHD levels and incident disease, but not a conclusion that higher serum 25OHD levels were associated with a lower risk for CVD. Additionally, the review of randomized trial evidence does not support a causal relationship between vitamin D intake and risk for CVD.
Concluding Statement
Review of the available evidence, from both RCTs and observational studies on associations between vitamin D and calcium intake and risk for CVD shows that although observational evidence supports a relationship between serum 25OHD levels and the presence of CVD, it does not show a relationship with risk for developing CVD, and evidence was not found for a causal relationship between vitamin D intake and development of disease. Given the lack of statistically significant evidence supporting associations between vitamin D intake or serum 25OHD level and risk for CVD and the lack of evidence on CVD as a primary outcome of treatment in RCTs with vitamin D and/or calcium, the committee could not draw an inference about the efficacy of this indicator to support DRI development.
Diabetes and Metabolic Syndrome
Type 2 diabetes is a blood glucose disorder characterized by insulin resistance and relative insulin deficiency. Metabolic changes that accompany chronic elevated blood glucose levels frequently lead to functional impairment in many organ systems, particularly the cardiovascular system, which contributes to substantially increased risk of morbidity and mortality.
Metabolic syndrome is a condition characterized by a constellation of metabolic risk factors, including abdominal obesity, atherogenic dyslipidemias, elevated blood pressure, insulin resistance, prothrombotic state, and proinflammatory state (e.g., elevated C-reactive protein).
Individuals with metabolic syndrome are at increased risk of coronary heart disease, stroke, peripheral vascular disease, and type 2 diabetes. Adiposity is a component of both type 2 diabetes and metabolic syndrome, which may have an impact on vitamin D status. Since the release of the 1997 DRIs (IOM, 1997), a number of studies have been published on relationships between vitamin D with or without calcium and type 2 diabetes and metabolic syndrome. The committee recognized that obesity can be a confounder to vitamin D analysis. However, as it is a component of the health outcome and because of the prevalence of both obesity and meta-
bolic syndrome in the general population, this indicator was considered as a candidate for DRI development.
Biological Plausibility
Vitamin D was first implicated as a modulator of pancreatic endocrine function and insulin synthesis and secretion in studies using rodent models more than three decades ago (Norman et al., 1980; Clark et al., 1981; Chertow et al., 1983). Since then, the role of calcitriol in the synthesis and secretion of insulin and regulation of calcium trafficking in β-islet cells as well as its effects on insulin action have been established in both rodent models and in vitro cell culture models (Frankel et al., 1985; Cade and Norman, 1986; Faure et al., 1991; Sergeev and Rhoten, 1995; Billaudel et al., 1998; Bourlon et al., 1999). These findings stimulated observational and intervention studies examining the role of vitamin D and calcium in type 2 diabetes and metabolic syndrome in humans.
Systematic Reviews and Meta-Analyses
Neither AHRQ-Ottawa nor AHRQ-Tufts included type 2 diabetes or metabolic syndrome in its systematic review, although AHRQ-Tufts did include body weight as a health outcome and found no effect of vitamin D or calcium on changes in body weight. A systematic review and meta-analysis by Pittas et al. (2007b) included a large body of observational evidence and six intervention studies (four small short-term and two long-term studies) of vitamin D supplementation, one study using combined vitamin D and calcium supplementation and five studies using calcium alone or dairy supplementation. The results from these trials were largely negative; among the short-duration vitamin D trials, three studies reported no effect, and one reported enhanced insulin secretion but no improvement in glucose tolerance following vitamin D supplementation. In one study included in the review, however, the relationship was statistically significant only when non-Hispanic blacks were excluded from the meta-analysis.
Overall, the evidence reviewed from the intervention studies did not support a role for vitamin D alone, although vitamin D in combination with calcium supplementation may have a role in preventing type 2 diabetes in populations already at risk. The observational evidence in the review included cross–sectional and case–control studies in which serum vitamin D and calcium levels were determined from individuals in a population with established glucose intolerance. Similar confounding and a lack of adjustment for confounders limited the cohort studies. Thus, the one meta-analysis that included both observational and intervention studies could
not be considered as supportive for a relationship between either vitamin D or calcium and the health outcomes of diabetes or metabolic syndrome.
Additional Evidence from Randomized Controlled Trials
Two randomized trials were identified that evaluated the effect of vitamin D supplementation with or without supplemental calcium on markers of glucose tolerance as a primary outcome and four additional trials were identified that evaluated glucose metabolism as a secondary outcome. A trial in New Zealand that examined the effect of supplementation with 4,000 IU of vitamin D3 per day for 6 months on insulin resistance in non-diabetic overweight South Asian women found a significant improvement in insulin sensitivity compared with those in the placebo group after 6 months (von Hurst et al., 2010). Among women who had low serum 25OHD levels at the beginning of the study, those who achieved a serum 25OHD level above 80 nmol/L at 6 months had significant improvement in insulin sensitivity. In contrast, sub-analysis of data from the Randomised Evaluation of Calcium and/Or vitamin D (RECORD) trial examining the association between incidence of self-reported development of type 2 diabetes or initiation of treatment for type 2 diabetes and supplementation with 800 IU of vitamin D3 and 1,000 mg of calcium in an elderly population found no association (Avenell et al., 2009a). Zittermann et al. (2009), in a weight loss trial evaluating the effect of supplemental vitamin D on markers of CVD in overweight adults as a primary outcome, found no significant difference for an effect on glucose metabolism. Jorde et al. (2010), in a 1-year trial in Norway with overweight or obese subjects, found no change in measures of blood glucose in vitamin D–supplemented subjects compared with control subjects, but they did identify an unexpected and significant increase in systolic blood pressure in the supplemented group compared with controls. Without further analysis, however, it is not possible to determine whether the increase in blood pressure was related to 25OHD levels in blood. A trial in India evaluated the effect of short-term vitamin D supplementation on homeostasis model assessment and oral glucose insulin sensitivity in healthy, centrally obese men (Nagpal et al., 2009). In an intention-to-treat analysis, the difference was not significant. Overall, higher waist-to-hip ratios and lower baseline serum 25OHD levels were significant predictors of improvement in oral glucose insulin sensitivity. A posthoc analysis of a trial testing the effects of long-term supplementation with 700 IU of vitamin D and 500 mg of calcium daily on health, including associations between combined supplementation and changes in fasting glucose levels, found that subjects with impaired fasting glucose who followed the supplementation regimen for 3 years had a significantly lower rise in fasting glucose levels and less insulin resistance compared with
placebo controls (Pittas et al., 2007a). Although the findings of this study are in agreement with a previous secondary analysis of data from the NHS cohort (see below: Pittas et al., 2006), the study is limited by the small number of outcomes measured compared with the total cohort; thus, an unintended bias cannot be ruled out. In addition, the study was designed for skeletal outcomes as the primary analysis. When the totality of the evidence was considered, the negative findings from the clinical trials for an effect of vitamin D or calcium on risk for type 2 diabetes together with the lack of significant evidence from either the AHRQ reviews or the meta-analysis by Pittas et al. (2007b) compelled the committee to conclude that there was not sufficient evidence to establish a causal relationship.
Observational Studies
Low serum 25OHD levels have been implicated in metabolic syndrome, abdominal obesity, and hyperglycemia.
In a prospective cohort analysis of data from NHS, women were followed for 20 years to examine associations between vitamin D and calcium intake and risk for type 2 diabetes (Pittas et al., 2006). A significant inverse association was found between total vitamin D intake and calcium intake and risk for type 2 diabetes. A separate analysis of the association between risk for type 2 diabetes and dairy food consumption found that women who consumed three or more dairy servings per day were at lower risk compared with those who consumed less than one dairy serving per day. These findings suggest that risk for type 2 diabetes is associated with vitamin D or dairy food intake. A small cohort study in obese and overweight individuals found that in addition to a significant inverse association between serum 25OHD level and weight and waist circumference there was a weak inverse relationship with hemoglobin A1c. However, no association between serum 25OHD level and any other indicators of type 2 diabetes or metabolic syndrome were observed (McGill et al., 2008).
In other observational evidence reviewed, a cross–sectional survey of Polynesian and white adult populations in New Zealand found a significantly lower serum 25OHD level in subjects with newly diagnosed diabetes and impaired glucose tolerance compared with controls. In addition, among the control groups, the native New Zealand populations (Maori and Pacific Islanders) were found to have significantly lower serum 25OHD levels compared with Europeans. The authors speculated that the low serum 25OHD level in the native populations explained, in part, the higher prevalence of diabetes in those groups (Scragg et al., 1995). Isaia et al. (2001), in a cross–sectional study in Italy, found that postmenopausal women diagnosed with type 2 diabetes had significantly higher body mass indexes (BMIs), lower activity scores, higher prevalence of serum 25OHD
levels below 12.5 nmol/L, and lower dietary calcium intake compared with controls. In summary, these observational studies fail to provide conclusive support of a relationship between vitamin D intake and risk for either type 2 diabetes or metabolic syndrome because of the lack of consistency among studies, the paucity of high-quality large cohort studies, and the lack of strength for an association between vitamin D status and incidence of type 2 diabetes or metabolic syndrome.
Concluding Statement
The available evidence from observational studies of the associations between vitamin D and calcium and risk for type 2 diabetes or metabolic syndrome and secondary analyses from RCTs on markers of glucose tolerance proved insufficiently strong to support DRI development. The association studies linking lower serum 25OHD levels to increased risk for type 2 diabetes may be confounded by overweight and obesity, which not only predispose individuals to type 2 diabetes, but also cause lower serum 25OHD levels as a result of sequestration in fat and possibly other mechanisms. Although both retrospective and prospective studies tend to support an inverse association between serum 25OHD levels and type 2 diabetes, these studies are limited by the study design and cannot show a causal relationship. Evidence from RCTs on the effect of vitamin D supplements on incident diabetes or markers of glucose homeostasis is variable, and few RCTs showing significant results were identified. Taken together, the evidence in support of a role for vitamin D as a modulator of pancreatic endocrine function and insulin synthesis and secretion is not conclusive and therefore is not sufficient to support glucose tolerance as an indicator for DRI development.
Falls and Physical Performance
The committee considered falls and physical performance as independent indicators. However, because of the integration of these indicators in the literature reviewed by the committee, the evidence for both indicators is examined together in this section.
The risk of falling is a major concern among the elderly, because falls can lead to fracture and long-term disability or death in this population. Vitamin D is necessary for normal development and growth of muscle fibers, and vitamin D deficiency may adversely affect muscle strength. Muscle weakness and pain (myopathy) are characteristics of rickets and osteomalacia and contribute to poor physical performance (Prineas et al., 1965; Skaria et al., 1975; Yoshikawa et al., 1979). Thus vitamin D-deficiency muscle weakness and the implications of poor muscle tone suggest a re-
lationship between serum 25OHD level and risk for falling and/or poor physical performance in susceptible populations.
Biological Plausibility
Experimental evidence suggests that vitamin D exerts its effect on muscle tissue via the VDR, but it may also use other pathways. In vitro and in vivo experiments provide evidence to support calcitriol regulation of calcium uptake by muscle, which, in turn, controls muscle contraction and relaxation, synthesis of muscle cytoskeletal proteins involved in muscle contraction, and muscle cell proliferation and differentiation (reviewed in Ceglia, 2008). Because intracellular calcium levels control the contraction and relaxation of muscle, thus affecting muscle function, it is possible that calcium intake may also affect risk for falls and poor physical performance (reviewed in Ceglia, 2008). However, the topic is not considered in more detail here because of the lack of observational and RCT data on the relationship between calcium intake and physical performance.
Systematic Reviews and Meta-Analyses
The AHRQ-Ottawa systematic review identified a total of 14 RCTs in addition to five prospective cohort studies and one case–control study that examined vitamin D and risk for falls in postmenopausal women and elderly men. The evidence between the RCTs and observational studies was discordant. Overall the review reported that the evidence for an association between low serum 25OHD levels and risk of falls and measures of physical performance among postmenopausal women and elderly men was inconsistent and rated the evidence as “fair.” The AHRQ-Tufts systematic review identified three additional RCTs (Bunout et al., 2006; Burleigh et al., 2007; Lyons et al., 2007), but these studies did not find a significant effect of vitamin D supplementation on reducing risk of falls or poor performance in the elderly and were given a “C” rating. No additional observational evidence was found for this indicator in the AHRQ-Tufts review.
A meta-analysis reported in AHRQ-Tufts, which included the AHRQ-Ottawa RCTs, highlighted the inconsistency of findings from RCTs on the effect of vitamin D treatment on reduction in risk or prevention of falls. A smaller meta-analysis by Bischoff-Ferrari et al. (2004a) examined RCTs in elderly populations for evidence of a reduction in risk for falls with “vitamin D”; however, only three studies used vitamin D, and the other two studies used calcitriol/1α-hydroxycholecalciferol. Some of the studies identified in this meta-analysis were also included in the AHRQ-Tuft analysis. In contrast to the AHRQ-Tufts analysis, Bischoff-Ferrari et al. (2004a) found, from pooled results, a significant reduction in risk of falling among sub-
jects treated with vitamin D compared with those treated with calcium or placebo. This disparity in findings is best explained by the small numbers in the Bischoff-Ferrari et al. (2004a) analysis and the fact that none of the vitamin D studies pooled by Bischoff-Ferrari et al. (2004a) was individually significant.
A meta-analysis published in 2009 by Bischoff-Ferrari et al. (2009a) examined fall prevention based on supplemental intake and serum 25OHD concentrations. From this analysis of the eight RCTs (n = 2,426 subjects) that met the inclusion criteria, the authors concluded that supplemental vitamin D intake (700 to 1,000 IU/day) reduced the risk of falling among older subjects by 19 percent and that serum 25OHD concentrations less than 60 nmol/L may not reduce the risk of falling. This meta-analysis as conducted has major limitations.
First, the stated inclusion/exclusion criteria and their application are problematic. As stated by the authors, to be included in the primary analysis, the trial design had to be double-blinded and the assessment of falls had to be a primary or secondary endpoint defined at the onset of the trial. The study had to include a definition of falls and how they were assessed, and falls had to be assessed for the entire trial period. Studies using patients with Parkinson’s disease, organ transplant recipients, or stroke patients were excluded as were trials using intramuscular injection of vitamin D. Of concern is the fact that some studies that met the inclusion/exclusion criteria were omitted, and at least one study that failed to meet the criteria was included. The Broe et al. (2007) study, did not have a secondary analysis that pre-specified falls as an outcome, was never powered to examine the incidence of falls; with the wide confidence interval due to small sample size the results are questionable. This study influenced the analysis considerably; other than the work of Pfeifer et al. (2009), it was the single largest contributor to the effect. The work of Law et al. (2006) was excluded because it was a cluster randomization design instead of individual randomization; however, such a design does not appear to violate the authors’ stated criteria. It was also excluded because the dose of oral vitamin D (50,000 IU) was given every 3 months; however, the serum 25OHD increased from 45 to 75 nmol/L, indicating an adequate therapeutic level. Had the Law et al. (2006) study been included, in which 44 percent of the vitamin D–treated group and 43 percent of the control group were fallers (not significantly different), the overall results would have been negative.
Second and more importantly, Figure 3 as reported in Bischoff-Ferrari et al. (2009a) is inappropriately presented. The figure is intended to demonstrate fall prevention with dose of vitamin D and achieved serum 25OHD concentrations. Specifically, the figure is a meta-regression analysis of the relative risk (RR) against vitamin D dose or serum 25OHD concentration. However, the meta-regression appears to be incorrectly carried out, or the
authors used assumptions that were not specified in the methods section of their publication. In their analysis, the dependent variable appearing in the graph is RR (linear scale of 0 to 2.5); however, log(RR) is typically used in this type of meta-regression, which is a weighted linear regression with each study being the unit of analysis. Even when RR is to be reported, a meta-regression of log(RR) against the predictor variable should be carried out and then retransformed back to the RR scale, in which case the line will be curvilinear instead of straight. Carrying out a meta-regression analysis using untransformed RR in the linear scale assumes an exponential relationship of the dose with effect. Moreover, the predictor variable (x-axis) is equally spaced for data points, but the data points are not equally spaced according to the vitamin D doses (or serum 25OHD concentrations). In the top panel of Figure 3 in Bischoff-Ferrari et al. (2009a), the dose intervals between the data points range from 0 IU (two 400 IU studies; two 800 IU studies) to 100 IU (between 600 IU and 700 IU) to 200 IU (between 200 IU and 400 IU, 400 IU and 600 IU, 800 IU and 1,000 IU). Two data points were also composed of multiple trials “collapsed” into a single data point for two levels (800 IU of vitamin D3; 1,000 IU of vitamin D2) of the predictor variables. This introduces considerable uncertainty as to the appropriateness of the location of the regression line. If the measurement intervals had been appropriately and evenly spaced, it is very likely that the conclusion of the analysis would have been that no significant relationship was demonstrated.
The importance of the limitations of this study becomes clear when the data are reanalyzed in the appropriate statistical manner. As shown in Figures 4-2 and 4-3, no dose–response relationship between vitamin D intake and risk of falls is evident. For this analysis, which used the STATA program, analyses were repeated by fitting a random effects meta-regression with the log(RR) of sustaining at least one fall as the response variable and the daily dose of vitamin D supplementation or the mean achieved 25OHD serum concentration in the vitamin D supplementation arm as the predictor variable (both predictor variables are continuous variables). Specifically, the results do not show a significant dose–response relationship between the risk of sustaining at least one fall and the daily dose of vitamin D supplementation or achieved 25OHD serum concentration (beta coefficient = −0.0005 ± 0.0003 and = −0.0087 ± 0.0056 standard error [SE] respectively; relative risk reduction = 0.95 for risk of falls per 100 IU/day and increased in dose of vitamin D, p = 0.13; relative risk reduction = 0.92 for risk of falls for every 10 nmol/L increase in 25OHD level, p = 0.17). Both analyses had significant heterogeneity across studies (I2 = 47 percent, p = 0.05; I2 = 54 percent, p = 0.03, respectively). Further, a non-linear dose–response relationship was explored by adding a quadratic term of the predictor variable to the model. The result suggests that a U-shaped curve
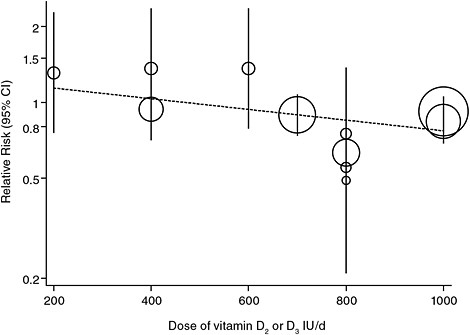
FIGURE 4-2 Relative risk of falls and vitamin D supplementation doses: Correct meta-regressions with continuous predictors showing non-significance.
NOTE: Relative risk reduction is 0.95 (95% confidence interval [CI] 0.89 to 1.02; p = 0.13) per 100 IU/day difference (increase) in dose.
better describes the relationship between the risk of sustaining at least one fall and the achieved serum 25OHD concentrations.
Additional Evidence from Randomized Controlled Trials
As discussed above, among RCTs that tested for effects of vitamin D with and without calcium on reduction in risk for falls, no consistent outcome was found. As described above, the data related to falls are questionable, and among muscle performance studies one included 12 subjects who were post-stroke patients and a second included 16 subjects for whom the study was only 8 weeks in length.
Two recent studies published after the AHRQ-Tufts analysis was completed have failed to show efficacy in reducing falls. A randomized but not placebo-controlled trial examined the effect of either 800 or 2,000 IU of vitamin D per day combined with enhanced or standard physiotherapy on the rate of falls and hospital re-admission following hip fracture in free-living adults with a mean age of 84 years (Bischoff-Ferrari et al., 2010). Neither of the two dosages of vitamin D3 reduced the rate of falls or improved
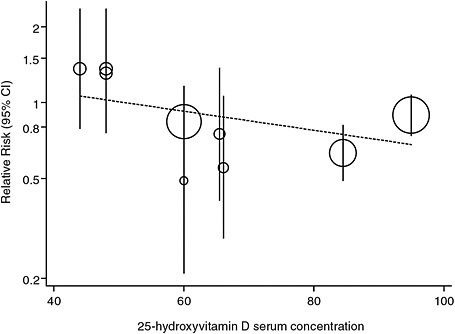
FIGURE 4-3 Relative risk of falls and mean achieved serum 25OHD concentrations: Correct meta-regressions with continuous predictors showing non-significance.
NOTE: Relative risk reduction is 0.92 (95% confidence interval [CI] 0.80 to 1.05; p = 0.17) per 10 nmol/L difference (increase) in mean achieved 25OHD concentration.
strength or function compared with physiotherapy. Another study (Sanders et al., 2010) that examined the incidence of falls and fractures in elderly women treated with 500,000 IU of vitamin D3 annually for 3 years found a significant increase in falls and fractures in the treatment group compared with the placebo group. Notably, the increased incidence of falls was significant in the treatment group by 3 months following administration of the supplemental vitamin D. Further, as described in Chapter 6, the authors of this study concluded that levels of 65 nmol/L were not consistent with reduced rates of fall or fractures.
When this committee considered the totality of evidence for causality pertinent to the relationship between vitamin D and incidence of or risk for falls, it became clear that the greater part of the causal evidence indicated no significant reduction in fall risk related to vitamin D intake or achieved level in blood. Table 4-4 illustrates the range of clinical trial data assessing changes in fall incidence or risk for falls with varying levels of vitamin D treatment that were taken into account. Of the 18 studies considered, including several studies identified in Bischoff-Ferrari et al. (2009a), only 4 (Pfeifer et al., 2000; Harwood et al., 2004; Flicker et al.,
TABLE 4-4 Outcome Measures for Falls: Summary of Evidence from Randomized Trials with Vitamin D and Calcium
|
Reference; Study Duration; Outcome |
N |
Vitamin D Dose |
Calcium Dose |
Serum 25OHD level (nmol/L) |
Falls |
Fallers |
RR/OR (95% CI)/(p-value) |
|
|
Baseline |
Achieved |
|||||||
|
Studies using oral doses |
||||||||
|
Bischoff et al., 2003a 12 weeks follow-up (primary analysis) |
122 |
Placebo |
1,200 mg/d |
29.0 (23.0–25.0) |
28.0 (24.5–41.5) |
|
0.68 (0.30–1.54) |
|
|
|
800 IU/d |
1,200 mg/d |
30.8 (23.0–55.0) |
65.5 (49.8–82.8) |
|
0.70 (0.30–1.50) |
||
|
Bischoff-Ferrari et al., 2006b 3-year trial (secondary outcome of primary analysis) |
Women: |
Women: |
Women: |
Women: |
Women: |
Women: |
Women: |
|
|
246 |
Placebo |
Placebo |
63.0 (± 30.3) |
68.0 (± 32.5) |
|
0.44 (0.21–0.90) |
||
|
|
700 IU/d |
500 mg/d |
70.0 (± 33.0) |
104.0 (± 41.8) |
|
|
|
|
|
Men: |
Men: |
Men: |
Men: |
Men: |
Men: |
Men: |
||
|
199 |
Placebo |
Placebo |
83.0 (± 33.5) |
76.5 (± 27.3) |
|
0.84 (0.42–1.66) |
||
|
|
700 IU/d |
500 mg/d |
82.0 (± 37.5) |
110.0 (± 34.0) |
|
|
|
|
|
Bischoff-Ferrari et al., 2010 12-month trial (primary outcome) |
173 |
800 IU/d |
500 mg/d |
30.8 (± 19.3) |
88.5 (± 25.3) |
|
28 (−4.0–68.0 |
|
|
|
2,000 IU/d |
500 mg/d |
33.0 (± 20.3) |
111.8 (± 26.0) |
|
|
|
|
|
Broe et al., 2007 5-month study period (secondary analysis) |
124 |
Placebo |
|
53.0 (± 28.5) |
|
|
|
|
|
|
200 IU/d |
None |
44.5 (± 23.0) |
|
|
|
1.10 (0.49–2.50) |
|
|
|
400 IU/d |
None |
51.8 (± 29.0) |
|
|
|
1.05 (0.48–2.28) |
|
|
|
600 IU/d |
None |
41.3 (± 18.5) |
|
|
|
1.21 (0.55–2.61) |
|
|
|
800 IU/d |
None |
53.5 (± 23.0) |
|
|
|
0.28 (0.10–0.75)b |
|
|
Burleigh et al., 2007a 30 days (primary outcome) |
203 |
Placebo |
1,200 mg/d |
24.7 (± 10.0) |
|
0.82 (0.59–1.16) |
||
|
|
800 IU/d |
1,200 mg/d |
21.7 (± 7.1) |
|
|
|
|
|
|
Chapuy et al., 20022-year trial (secondary analysis) |
583 |
Placebo |
none |
22.8 (± 17.3) |
15.0 |
|
1.08 (0.75–1.55) treatment groups combined |
|
|
|
800 IU/d or Ca combined |
1,200 mg/d |
22.5 (± 16.5) |
80.0 |
|
|
|
|
|
|
800 IU/d + Ca given separately |
1,200 mg/d |
21.3 (± 13.3) |
75.0 |
|
|
|
|
|
Flicker et al., 20052-year follow-up (primary outcome) |
540 |
Placebo |
600 mg/d |
42.5 |
|
0.73 (0.57–0.95)b |
||
|
|
10,000 IU/wk later 1,000IU/d |
600 mg/d |
40.0 |
|
0.82 (0.59–1.12) |
|||
|
Graafmans et al., 199628-week follow-up (primary outcome) |
|
Placebo |
none |
|
|
|
|
1.00 (0.60–1.80) |
|
|
400 IU/d |
none |
65.0 |
|
|
|
1.00 (0.60–1.50) |
|
|
Grant et al., 2005c 24- to 62-month follow-up (secondary analysis) |
5,292 |
Placebo |
none |
38.0 |
45.4 |
|
Subjects on Vit D vs no vit D |
|
|
|
Calcium |
1,000 mg/d |
|
42.0 |
|
|
||
|
|
800 IU/d |
none |
|
62.5 |
|
|
|
|
|
|
800 IU/d + Ca |
1,000 mg/d |
|
62.0 |
|
|
0.97 (0.84–1.12) |
|
|
Larsen et al., 2005 42-month trial (primary outcome) |
2,426 |
No intervention |
none |
|
|
|
|
Women: |
|
|
400 IU/d |
1,000 mg/d |
35.0 |
|
|
|
0.89 (0.79–1.03) |
|
|
|
|
|
|
|
|
|
Men: |
|
|
|
|
|
|
|
|
|
1.07 (0.90–1.27) |
|
Reference; Study Duration; Outcome |
N |
Vitamin D Dose |
Calcium Dose |
Serum 25OHD level (nmol/L) |
Falls |
Fallers |
RR/OR (95% CI)/(p-value) |
|
|
Baseline |
Achieved |
|||||||
|
Law et al., 2006 10-month trial (primary outcome) |
3,717 |
No pills |
none |
|
|
|
|
1.09 (0.95–1.25) |
|
|
1,100 IU/d |
none |
47.0 (35.0–102.0) |
74.0 (52.0–110.0) |
|
1.36 (0.80–2.34) |
||
|
Pfeifer et al., 2009 12-month trial; follow-up at 20 months (primary outcome) |
242 |
Placebo |
1,000 mg/d |
54.0 (± 18.0) |
57.0 (± 20.0) |
|
0.61 (0.34–0.76)b |
|
|
|
800 IU/d |
1,000 mg/d |
55.0 (± 18.0) |
84.0 (± 18.0) |
|
0.40 (p< 0.001) |
||
|
Pfeifer et al., 2000 8-week trial (primary outcome) |
137 |
Placebo |
1,200 mg/d |
24.6 (± 12.1) |
42.9 (± 20.1) |
|
|
|
|
|
800 IU/d |
1,200 mg/d |
25.7 (± 13.6) |
66.2 (± 27.0) |
|
0.55 (0.29–1.06)d |
||
|
Prince et al., 2008 1-year trial (primary outcome) |
302 |
Placebo |
1,000 mg/d |
44.3 (± 12.8) |
44.3 |
|
0.66 (0.41–1.06) |
|
|
|
1,000 IU/d |
1,000 mg/d |
42.3 (± 12.5) |
60.0 |
|
|
|
|
|
Trivedi et al., 2003c 5-year trial (secondary analysis) |
2,686 |
Placebo |
none |
|
53.4 (±21.1) |
|
|
Women: |
|
|
100,000 IU 3 doses/y |
none |
|
74.3 (± 20.7) |
|
|
1.03 (0.72–1.48) |
|
|
|
|
|
|
|
|
|
Men: |
|
|
|
|
|
|
|
|
|
0.87 (0.68–1.12) |
|
|
Studies using injected doses |
|
|
|
|
|
|
|
|
|
Dhesi et al., 2004a 6-month trial (secondary outcome) |
123 |
Placebo |
none |
25.0 (23.8–26.3) |
31.5 (28.5–34.5) |
|
0.24 (p = 0.28) |
|
|
|
600,000 IU IM injection once |
none |
26.8 (25.5–28.0) |
43.8 (41.3–46.3) |
|
11 (p = 0.52) |
||
|
Harwood et al., 2004c 1-year trial (secondary analysis) |
150 |
No treatment |
0 mg/d |
30.0 (12.0–64.0) |
27.0 |
|
0.48 (0.3–0.9) |
|
|
|
300,000 IU IM once |
0 mg/d |
28.0 (10.0–67.0) |
40.0 |
|
|
|
|
|
|
300,000 IU IM once |
1,000 mg/d |
30.0 (12.0–85.0) |
44.0 |
|
|
|
|
|
|
800 IU/d |
1,000 mg/d |
30.0 (12.0–64.0) |
50.0 |
|
|
|
|
|
Latham et al., 2003 6-month follow-up (secondary outcome) |
122 |
Placebo |
none |
47.5 |
47.5 |
|
1.12 (0.79–1.59) |
|
|
|
300,000 IU once |
none |
40.0 |
62.5 |
|
|
|
|
|
Sanders et al., 2010 3-year trial (primary outcome) |
2,256 |
Placebo |
none |
45.0 (40.0–57.5) |
Median 55.0–75.0 |
|
|
1.15 (1.02–1.30) |
|
|
500,000 IU/y |
none |
53.0 (40.0–65.0) |
|
|
|
0.74 (p = 0.03) |
|
|
Smith et al., 2007 3-year trial (secondary analysis) |
9,440 |
Placebo |
none |
56.5 |
56.5 |
|
|
|
|
|
300,000 IU IM injection/y |
none |
56.5 |
68.5 |
|
|
0.98 (0.94–1.04) |
|
|
NOTE: CI = confidence interval; IM = intramuscular; IU = International Units; OR = odds ratio; RR = relative risk; y = year. aIncluded in AHRQ-Ottawa (Cranney et al., 2007) and/or AHRQ-Tufts (Chung et al., 2009). bBolding indicates significant difference and is presented for assessment of causality. cDiscussed in the “Skeletal Health” section below. dData provided in Bischoff-Ferrari et al. (2009a). |
||||||||
2005; Broe et al., 2007) found a significant effect of vitamin D on fall incidence. The only two significant studies for fallers are Pfeifer et al. (2000, 2009), although Pfeifer et al. (2000) was a 2-month study and administered calcium with the vitamin D placebo.
Observational Studies
Observational studies have long suggested an association between a higher serum 25OHD level and a lower risk of falls in elderly persons; however, when analyzed as a whole in the AHRQ reviews, there was no consistency between study findings. Snijder et al. (2006), a study of elderly subjects participating in the Longitudinal Aging Study Amsterdam, a prospective cohort study, was not included in the AHRQ reviews. This study found that a low serum 25OHD level (< 25 nmol/L) was independently associated with an increased risk of falling for subjects who experienced two or more falls compared with those who did not fall or fell once; however the study outcome does not affect the discordant findings among observational studies identified in the AHRQ reviews.
Most observational studies of associations between serum 25OHD levels and physical performance have been cross–sectional, which limits causal inference. A cross–sectional study of 4,100 older adults from NHANES III found higher serum 25OHD concentrations associated with better lower-extremity function (Bischoff-Ferrari et al., 2004b). Much of the improvement occurred at concentrations ranging from 22.5 nmol/L to approximately 40 nmol/L, but some improvement was also seen from 40 to 94 nmol/L (the top of the reference range). Results were similar in men and women, three racial/ethnic groups (whites, African Americans, and Mexican Americans), active and inactive persons, and those with high and low calcium intakes. A study of Dutch adults 65 years of age and older found that serum 25OHD concentrations below 20 nmol/L were significantly associated with poorer physical performance at baseline and a greater decline in physical performance over a 3-year period (Wicherts et al., 2007). Another cross–sectional study of healthy post-menopausal women found that serum 25OHD level was significantly associated with physical fitness indexes, including balance, handgrip strength, androidal fat mass, and lean mass (Stewart et al., 2009). Finally, a cross–sectional study of 60 men and women with heart failure (mean age of 77 years) found a significant association between serum 25OHD level and 6-minute walk distance and frailty status (Boxer et al., 2008). Taken together, however, this evidence is weakened by the cross–sectional study design, does not provide strong support for an association between serum 25OHD level and physical performance, and does not contradict the findings of the AHRQ reviews.
Concluding Statement
A problem in a number of the RCTs is that falls rather than fallers are analyzed; consequently, individuals who fell more than once were also counted more than once in the primary outcome analysis. The studies generally did not have the statistical power to detect a significant difference in the number of fallers but relied on repeat fallers to achieve the desired number of total falls. Moreover, the meta-analyses described above combined data from the few trials in which fallers were counted with data from trials in which falls were the outcome. By comparison, the U.S. Food and Drug Administration (FDA) mandated primary outcomes in osteoporosis and cardiovascular trials are the number of individuals with fractures or cardiovascular events rather than the number of events. It remains uncertain whether a reduction in the number of falls can be used to infer that the number of fallers would be significantly reduced.
The committee’s review of the available evidence, including the results from RCTs and observational associations between vitamin D with or without calcium and risk for falls and poor physical performance, indicates a lack of sufficiently strong evidence to support DRI development. A limited review of observational data outside of the AHRQ reviews found some support for an association between 25OHD levels and physical performance. However, high-quality observational evidence from large cohort studies was lacking. Additionally, although the cross–sectional studies were more supportive of an association between high serum 25OHD levels and reduced risk for falls, evidence from RCTs in particular showed outcomes that varied in significance and thus did not support the observational findings or a causal relationship. The evidence was also not consistently supportive for a role for vitamin D combined with calcium in reduction of risk for falls.
Overall, data from RCTs suggest that vitamin D dosages of at least 800 IU/day, either alone or in combination with calcium, may confer benefits for physical performance measures. Although high doses of vitamin D (i.e., ≥ 800 IU/day) appear to provide greater benefit for physical performance than low doses (i.e., 400 IU/day), evidence is insufficient to define the shape of the dose–response curve for higher levels of intake. Thus, the outcome of physical performance is appropriate for identifying Estimated Average Requirements (EARs) of vitamin D, with or without calcium, in adults above the age of 50, but cannot be used to define the shape of the dose–response curve at higher levels of intake.
Immune Responses
Vitamin D has been reported to modulate immune functioning in cell culture and animal models. Vitamin D, specifically its active form, calcitriol,
is a regulator of both adaptive and innate immune responses. However, its role is complex and not fully understood. Many factors influence the specific effect of vitamin D on immune function including its target cells; the nature of the immune challenge and response (either autoimmune or anti-infective); the status and availability of calcium, depending on the tissue or cell type; the physiological, differentiated or activated stage of the tissue or cell type; and the expression and polymorphisms of the genes for the Vdr and 1α-hydroxylase.
Asthma
Asthma is a chronic lung disease that manifests as inflammation in bronchial tissue. The disease is characterized by recurrent periods of wheezing, chest tightness, shortness of breath, and coughing and may be accompanied by comorbidities, such as eczema or atopic dermatitis. Diet has long been linked to asthma and allergic disease. Dietary sodium and magnesium intakes were implicated as risk factors for asthma in the 1980s and 1990s (Burney, 1987; Britton et al., 1994a, b). Dietary lipids have also been hypothesized to contribute to increased prevalence of asthma (Black and Sharpe, 1997). More recently, vitamin D has been linked to asthma incidence in the developing fetus and in young children (Litonjua and Weiss, 2007).
Biological plausibility Genetic studies mapping the Vdr gene in animal models of asthma suggest that Vdr polymorphism is linked with expression of asthma. In humans, Poon et al. (2004) compared Vdr genetic variants between members of a family-based cohort (223 families of 1,139 individuals) with and without asthma. Their analysis found significant associations between six polymorphisms in the Vdr gene and clinical diagnosis of asthma. Wjst (2005) conducted genotyping on 951 individuals from pedigrees that had at least two asthmatic children to determine whether transmission of Vdr polymorphism was associated with asthma in the children. Preferential transmission of candidate polymorphisms in asthmatic children could not be confirmed; however, the authors did hypothesize the possibility of transmitting a protective effect to unaffected offspring based on their finding of a low probability of an unaffected phenotype in an affected cohort.
Systematic reviews and meta-analyses No systematic reviews or meta-analyses were identified for this indicator.
Additional evidence from randomized controlled trials No RCTs were identified for this indicator.
Observational studies A few studies were identified that examined a genetic linkage between vitamin D and risk for asthma or related conditions, and these were discussed above. Additional observational studies examined the relationship between perinatal serum 25OHD levels and risk of asthma in offspring. Devereux et al. (2007) examined associations between vitamin D intake during pregnancy and risk for childhood wheezing in a large prospective cohort study; a significant inverse association was found between maternal intake of vitamin D from diet and supplements and symptoms of wheezing at 2 and 5 years of age, although there was no significant association with diagnosed asthma at 5 years of age. In another study, Camargo et al. (2007) assessed the relationship between maternal dietary intake of vitamin D during pregnancy and risk of wheezing in children in Project Viva, a large prospective cohort study examining prenatal factors and pregnancy and child health outcomes. Overall, higher maternal intake of vitamin D during pregnancy was significantly associated with a lower risk for recurrent wheezing in the offspring at 3 years of age when compared with the lowest maternal vitamin D intake. Other associated symptoms of respiratory infection and eczema, however, were not significantly associated with maternal vitamin D intake. Similarly, Hypponen et al. (2004) found in a large prospective cohort study in Finland, that the prevalence of atopy and allergic rhinitis in subjects at age 31 years was higher among those who received regular vitamin D supplementation as infants than among those who did not; however, this study relied on retrospective recall of supplementation by the mother.
These large prospective cohort studies support an association between maternal or infant vitamin D intake and risk related to symptoms of asthma, particularly wheezing, but not with diagnosed disease. Several other observational studies have examined associations between 25OHD level in blood and risk for asthma. Gale et al. (2008), in a small prospective cohort study, found a five times increased risk for asthma at 9 years among children whose mothers’ serum 25OHD level was below 27.5 nmol/L, compared with those whose mothers had levels above 75 nmol/L. The small size of the cohort that was followed to 9 years of age (178 subjects) was a limitation to the reported finding. In contrast, a larger analysis of NHANES data found no association between serum 25OHD level and sensitization to allergens (Wjst and Hypponen, 2007). The study did identify an increased prevalence of allergic rhinitis across levels of 25OHD, although unrecognized confounding may account for the association.
In a cross–sectional study examining associations between vitamin D status and markers of allergic or asthmatic response, Brehm et al. (2009) found that serum vitamin D levels below 75 nmol/L were identified in 28 percent of children and that inflammatory markers (immunoglobulin E
[IgE] and eosinophil count) were significantly and inversely associated with vitamin D status. These lower quality observational studies largely support the associations with symptoms of asthma identified in the larger cohort studies but do not support an association between 25OHD level in blood and diagnosed asthma.
Although genetic studies support a possible biological mechanism for a functional role of vitamin D in development of asthma there are no RCTs to demonstrate a causal role.
Autoimmune Diseases
Autoimmune diseases such as multiple sclerosis (MS), rheumatoid arthritis (RA), inflammatory bowel disease (IBD), and lupus are characterized by abnormal T cell response to self, resulting in inflammatory reactions in peripheral tissues. Models of autoimmune diseases support a role for vitamin D in regulating the T helper 1 (Th1) immune response, an integral component of immune tolerance with regard to recognition of self (reviewed in Cantorna and Mahon, 2005; Szodoray et al., 2008). Recent genomic analyses for polymorphisms in the Vdr gene suggest that single nucleotide polymorphisms identified in individuals with type 1 diabetes could negatively modulate calcitriol synthesis and thereby play a detrimental role in autoimmune response and subsequent manifestation of the disease (Israni et al., 2009).
Diabetes (type 1) Type 1 diabetes is a chronic disease resulting from loss of β-cell function in the pancreas. The disease is characterized by diminished or absent insulin production and loss of control of blood glucose. Emerging evidence for an association between low vitamin D status and increased risk for type 1 diabetes comes from experimental animal, ecological, and observational studies; however, no intervention trials using supplemental vitamin D (not analogues) were identified to provide causal support for a relationship.
Biological plausibility Experimental animal, ecological, and observational evidence support a relationship between vitamin D status and risk for type 1 diabetes, although treatment protocols and dosages vary. Ecological evidence has suggested a link between type 1 diabetes risk and limited erythemal UVB exposure in Newfoundland (Sloka et al., 2009, 2010). Mohr et al. (2008) plotted incidence rates for type 1 diabetes by latitude in an ecologic study comparing geographical distribution, estimated UVB exposure and disease incidence and, using a polynomial analysis to best fit the data points, determined that the incidence of type 1 diabetes was greater at higher latitudes.
In nonobese diabetic (NOD) mice, which are genetically predisposed to develop insulitis and type 1 diabetes, disease developed earlier when the mice were fed vitamin D–deficient diet and reared in the absence of UV light (Giulietti et al., 2004). However, type 1 diabetes was not prevented when NOD mice were treated with a supraphysiological dose of vitamin D, beginning from conception and continuing to 10 weeks of age (Hawa et al., 2004). Additionally, in a study in which NOD mice were cross bred with mice null for the Vdr gene, the rate of disease presentation did not differ from that in mice carrying only the NOD mutation, even though immune abnormalities were aggravated by the absence of the VDR (Gysemans, 2008). These results indicate that severe vitamin D and UV deficiency can increase the risk of type I diabetes in a genetically predisposed animal, yet neither vitamin D nor the absence of the Vdr gene affects the onset of type 1 diabetes.
Systematic reviews and meta-analyses Neither AHRQ-Ottawa nor AHRQ-Tufts included type 1 diabetes as a health outcome in its systematic reviews. Another recent systematic review and meta-analysis of five observational, four case–control and one cohort study (no RCTs were found) assessed whether vitamin D supplementation of infants reduced risk for type 1 diabetes later in life (Zipitis and Akobeng, 2008). The meta-analysis of data from the four case–control studies revealed a significant 29 percent reduction in risk for type 1 diabetes among vitamin D–supplemented infants compared with controls, which was further supported by the cohort study. The authors also cited evidence for a dose–response effect based on studies indicating reduced likelihood for developing diabetes among subjects who received regular vitamin D supplements, whereas subjects who developed rickets early in life were more likely to develop diabetes. A limitation of this meta-analysis is that two of the studies included had study designs that relied on delayed retrospective recalls by the mothers of vitamin D–supplemented infants. Additionally, no other meta-analyses were identified that either support or refute the findings of Zipitis and Akobeng (2008).
Additional evidence from randomized controlled trials No RCTs were identified for this indicator.
Observational studies No additional observational evidence that was not included in the systematic reviews and meta-analysis was identified for consideration.
Inflammatory bowel and Crohn’s disease IBD is a group of conditions of chronic inflammation that usually involve the distal portion of the ileum. In Crohn’s disease, inflammation spreads to the colon and upper gastrointestinal tract and causes local abscesses, scarring, and bowel obstruction; the condition is also characterized by diarrhea, cramping, and loss of ap-
petite and weight. Vitamin D status has been linked to IBD in association studies of sun exposure and in genetic studies through down-regulation of the Th1-mediated immune response.
Biological plausibility Ecological studies have linked vitamin D, particularly 25OHD levels, to a number of autoimmune diseases. A connection between seasonal vitamin D status and risk for Crohn’s disease was proposed by Peyrin-Biroulet et al. (2009), based largely on ecological evidence for an association between low 25OHD levels in blood and other autoimmune diseases. The effect of seasonal variation on serum 25OHD levels in patients with Crohn’s disease, compared to matched controls found that mean serum 25OHD was lower in Crohn’s patients despite having vitamin D intake from foods and supplements and sunlight exposure similar to those of matched controls (McCarthy et al., 2005). Genetic evidence in humans and in animal models provides some support for a biological association between polymorphisms in the Vdr and susceptibility to IBD and Crohn’s disease. In a human study, a linkage analysis, used to identify the TaqI polymorphism in the Vdr gene, suggested that the variant may be a candidate for conferring susceptibility to IBD (Simmons et al., 2000). Animal model studies in both vitamin D–deficient and Vdr null mice suggested that the risk of developing IBD is increased in several respects: spontaneous occurrences are increased, the disease is more severe, and the disease is more easily provoked in response to agents that induce IBD or bacterial infections transferred from an affected animal (reviewed in Bouillon et al., 2008).
Systematic reviews and meta-analyses The AHRQ-Tufts systematic review found no RCTs for immune function clinical outcomes and no evidence for IBD or Crohn’s disease. Thus, the evidence was insufficient for further analysis in the systematic review. No meta-analyses were identified for this indicator.
Additional evidence from randomized controlled trials No RCTs were identified for this indicator.
Observational studies Two observational studies were identified that evaluated 25OHD levels in patients with Crohn’s disease and/or IBD. A cross–sectional assessment of serum 25OHD levels in children and young adults with IBD living in Boston found that prevalence of low 25OHD status (≤ 38 nmol/L) averaged 34.6 percent overall, with higher prevalence in winter compared with summer (Pappa et al., 2006). A small population-based cohort of patients with Crohn’s disease and ulcerative colitis in Scandinavia found a prevalence of 25OHD levels below 30 nmol/L in 27 percent of those with Crohn’s disease and 15 percent of those with ulcerative colitis. In addition, patients with Crohn’s disease had lower mean serum 25OHD levels compared with those with ulcerative colitis or the reference population (Jahnsen et al., 2002). The study design and poor con-
trols characteristic of these observational studies diminish the reliability of their findings. Another confounding problem is that vitamin D is absorbed with fat in the terminal ileum, and this is the area that is most inflamed in Crohn’s disease (and can become inflamed in ulcerative colitis). Consequently, low 25OHD levels can be expected to occur as a consequence of the inflammatory condition. The question not answered by these studies is whether low 25OHD levels can predispose individuals to the conditions.
Multiple sclerosis MS is a chronic disease of the central nervous system that manifests as numbness in the limbs or, in more severe cases, paralysis or loss of vision. The progress, severity, and specific symptoms of MS are unpredictable and vary among individuals. The disease is an autoimmune response directed against myelin. Damaged myelin forms scar tissue (sclerosis), which impairs nerve impulse conduction, producing the variety of symptoms associated with the disease.
Biological plausibility Similar to findings with other autoimmune-related diseases, low solar exposure, latitude, and polymorphisms in the Vdr gene have been implicated in susceptibility to MS (Partridge et al., 2004; Dwyer et al., 2008; Sloka et al., 2008; Dickinson et al., 2009). However, whether a lack of sun exposure is causally related to MS cannot be shown. Findings from animal models are not consistent. In a mouse model, vitamin D deficiency accelerated development of autoimmune encephalomyelitis (the murine model of MS in humans), whereas treatment with calcitriol reduced it (Cantorna et al., 1996). In contrast, a subsequent study, using a mouse model null for the Vdr gene, found that the Vdr null mice were protected from development of the disease compared with wild-type mice (Meehan and DeLuca, 2002). A recent genetic study in humans evaluating associations between specific Vdr gene polymorphisms (Apal and Taq1) and serum 25OHD levels in healthy adults compared with those with MS, found no relationship between mutations in Apal and Taq1 and incidence of MS (Smolders et al., 2009). Taken together, neither ecological studies nor genetic studies in animal models and humans show consistency in finding a significant relationship between serum 25OHD level and presence of MS.
Systematic reviews and meta-analyses The AHRQ-Tufts systematic review found no RCTs for immune function clinical outcomes and no evidence for MS related to vitamin D. In a recent review paper of observational studies on the effects of vitamin D on incidence and severity of MS, Smolders et al. (2008) concluded that there was no strong direct evidence supporting the ability of vitamin D to modulate MS or influence risk for the disease. Their review included observational evidence in humans linking low serum 25OHD levels with incidence of MS in white American adolescents; associations between lower circulating levels of 25OHD after onset of MS;
associations between skin pigmentation and lower disability scores in females; congruence of geographical distribution of MS with geographical distribution of low vitamin D levels; associations between seasonal variation in birth and in disease severity with the seasonal variation of low vitamin D levels; associations between remission and pregnancy (when calcitriol levels increase); and variations in risk associated with polymorphisms in the Vdr gene. In addition to the lack of positive evidence, the authors raised concerns about the safety of calcitriol treatment for MS because of the dose-dependent risk for hypercalcemia identified with calcitriol treatment in animal models. No meta-analyses were identified for this indicator.
Additional evidence from randomized controlled trials No RCTs were identified for this indicator.
Observational studies Observational studies in humans have also failed to show a consistent association between serum 25OHD levels and MS. A small longitudinal study of 23 MS patients and 23 controls found no differences in circulating 25OHD levels, no difference in seasonal variation, and comparable rates of vitamin D deficiency or insufficiency based on serum 25OHD levels between MS patients and controls (Soilu-Hanninen et al., 2008). Interestingly, in this study, serum 25OHD levels were significantly lower during relapse episodes, whereas serum levels of intact PTH were significantly higher than in remission periods in MS patients. A prospective nested case–control study in military personnel reported that, for white subjects, serum 25OHD levels were inversely related to the risk of MS and that effect was even greater when serum 25OHD levels were low in individuals under 20 years of age (Munger et al., 2006). Overall, serum 25OHD levels were lower in black and Hispanic compared to white subjects and 25OHD levels were more frequently in the range of 25 to 40 nmol/L in MS patients compared to controls. These findings, however, were unrelated to risk for MS (Munger et al., 2006). In a small population-based case–control study of individuals living at latitudes of 41 to 43°S (similar to New York City and Boston), van der Mei et al. (2007) found that serum 25OHD levels below 25 nmol/L were moderately associated with MS, compared with levels above 40 nmol/L. With more consistent serum 25OHD levels and less seasonal variability, there was an association with less disability.
Taken together, these observational studies show widely variable outcomes for associations between serum 25OHD levels and MS and such associations are not supported by meta-analyses. In addition, the lack of causal evidence further diminishes the likelihood for a relationship between vitamin D and MS.
Rheumatoid arthritis RA is a chronic disease characterized by systemic inflammation that may affect many tissues and organs, but particularly the joints. In RA inflammatory synovitis of the joints can progress to destruction of the articular cartilage and ankylosis. RA can also produce diffuse
inflammation in the lungs, pericardium, pleura, and sclera, as well as nodular lesions under the skin. This progressive disease can result in chronic pain, loss of function, and eventual disability.
Biological plausibility In experimental studies, Tetlow and Wooley (1999) found that the VDR was strongly expressed in cells associated with rheumatoid lesions, including macrophages, synovial fibroblasts, and chondrocytes, but weakly or not at all in normal articular cartilage tissue, suggesting an up-regulation of VDR-mediated activity in tissues affected by RA. Smith et al. (1999) found that cultured human synovial fibroblasts, but not human articular chondrocytes, when treated with the inflammatory cytokine, interleukin 1 (IL-1), followed by calcitriol, indicated inhibition of expression of the matrix metalloproteinases associated with RA. In a mouse model of RA, treatment with calcitriol decreased arthritis symptoms induced by injection with bovine collagen and halted the progression of arthritis after arthritic lesions were apparent (Cantorna et al., 1998). Together, this evidence is suggestive of an immunomodulatory role for vitamin D in expression of arthritic changes in some, but not all, cell types associated with RA.
Systematic reviews and meta-analyses The AHRQ systematic reviews found no RCTs for immune function clinical outcomes related to RA and no evidence that RA was related to vitamin D. No meta-analyses were identified for this indicator.
Additional evidence from randomized controlled trials No RCTs were identified for an effect of vitamin D and/or calcium on risk for RA.
Observational studies A number of studies have been conducted to determine whether serum 25OHD level and incidence of RA are associated. In a prospective cohort study, a small subset of subjects from the Iowa Women’s Health Study were followed to determine if dietary vitamin D intake (primary outcome) and/or calcium intake (secondary outcome) were associated with incident RA (Merlino et al., 2004). No significant associations were found for dietary (not supplemented) vitamin D intake and risk for RA, although the association was significant for daily supplemental intakes of 400 IU or more compared with less than 400 IU. No association was found between calcium intake and risk for incident RA. A cross–sectional analysis of women with RA living in Brazil, found a significant correlation between higher mean serum calcium level and normal BMD compared with calcium levels in women with osteopenia, although no significant difference was found between calcium and vitamin D intake and BMD (Sarkis et al., 2009).
With no large prospective cohort studies and no clinical trials to support a relationship between vitamin D and/or calcium and RA, along with a paucity of other observational evidence, the committee could not conclude that either vitamin D or calcium is related to risk for RA.
Systemic lupus erythematosus Systemic lupus erythematosus (SLE) is a chronic generalized connective tissue disorder characterized by skin eruptions, arthralgia, arthritis, leukopenia, anemia, visceral lesions, neurological manifestations, and lymphadenopathy. It has been proposed that vitamin D plays a role in maintenance of immune homeostasis, and recent studies have linked SLE to vitamin D deficiency although a causal relationship has not been established.
Biological plausibility Mouse models of SLE have been reported to produce high levels of IgG2a immune cells that are implicated in the pathogenesis of lupus (Slack et al., 1984). However, owing to the complexity of the disease, experimental animal studies have not shown consistent outcomes on questions regarding the role for vitamin D in preventing or alleviating manifestations of the disease. Administration of calcitriol in a murine SLE model using a treatment protocol of daily dosing with a low-calcium diet for 4 weeks followed by dosing every other day for 18 weeks resulted in attenuation of symptoms of SLE, including reduced dermatological lesions. All SLE mice in the study developed proteinuria by 20 weeks; however, among those treated with vitamin D, lower urinary protein/creatinine ratios indicated reduced levels of proteinuria (Lemire et al., 1992). In contrast to these findings, when Vaisberg et al. (2000) injected SLE-prone mice with vitamin D3, they found a worsening of the histopathological effects of SLE in the kidney. Upon examining serum levels of calcitriol and 25OHD in SLE patients compared with unaffected controls, Muller et al. (1995) found lower levels of calcitriol but not 25OHD, but were unable to speculate on a cause for the difference. In humans, vitamin D has been proposed to modulate maturation and induction of interferon alpha-(IFN-α)–mediated monocyte differentiation into dendritic cells that are activated in SLE. The findings of Ben-Zvi et al. (2010) suggest that such a role is likely via vitamin D–mediated inhibition of over-expression of IFN-regulated genes in cultured monocytes from both normal and SLE patients following exposure to an activation factor. Altogether, however, there is a lack of consistency in study outcomes between animal models and human experimental studies, and thus findings are not supportive of a biological role for vitamin D in SLE.
Systematic reviews and meta-analyses The AHRQ systematic reviews found no RCTs for immune function clinical outcomes related to SLE and no evidence for a relationship between SLE and vitamin D. No meta-analyses were identified for this indicator.
Additional evidence from randomized controlled trials No RCTs were identified that examined a role for vitamin D or calcium in reducing risk for or manifestations of symptoms of SLE.
Observational studies Epidemiological evidence to support an association between vitamin D status and incidence of SLE shows variability in
the levels of 25OHD associated with SLE. Kamen et al. (2006), in a small subset of a larger population-based cohort, found that 22 out of 123 SLE patients across race, age, and gender groups had 25OHD levels below 25 nmol/L and that African Americans had levels significantly lower than whites (40 nmol/L compared with 78 nmol/L [p = 0.04]). In a small pilot study of 50 subjects (25 per group), Huisman et al. (2001) found that 50 percent of female SLE patients had 25OHD levels below 50 nmol/L. The associations between vitamin D status and incidence of SLE identified in these studies are not borne out by evidence from a prospective cohort study of dietary factors and risk for developing SLE. An analysis of a small subset of women participating in NHS over a period of 22 years found no association between vitamin D (or calcium) intake assessed with a food frequency questionnaire and risk for developing SLE or RA (Costenbader et al., 2008). In a cross–sectional survey, Ruiz-Irastorza et al. (2008) found that 75 percent of patients with SLE had serum 25OHD levels below 75 nmol/L and 15 percent had levels below 25 nmol/L, and 25OHD levels in blood in patients with SLE were not responsive to calcium and vitamin D treatment. Thus, it is not clear whether therapeutic treatment would have any effect on disease manifestation. The few relevant studies identified for review, and the lack of uniformly significant findings between studies, which may be a result of the small study populations (< 200 participants), are not sufficient to permit the committee to draw a conclusion about an association between SLE and vitamin D intake or 25OHD levels in blood.
Infectious Diseases
Tuberculosis Pulmonary tuberculosis (TB) is a granulomatous infection in which hypercalcemia occurs in a subset of patients (Sharma et al., 1972; Abbasi et al., 1979; Need and Phillips, 1979). The increased production of immune and inflammatory cells in patients with TB correlates with increased serum levels of calcitriol (Adams et al., 1989) and with calcitriol in pleural fluid (Cadranel et al., 1994). Treatment of alveolar macrophages with IFN-γ appears to stimulate synthesis of calcitriol (Koeffler et al., 1985; Reichel et al., 1987). Although vitamin D has been used as a therapeutic agent in the management of TB (Martineau et al., 2007a), treatment of individuals with active TB with supplemental vitamin D exacerbates or reveals hypercalcemia (Sharma, 1981).
Biological plausibility Vitamin D may be an important factor in innate immunity in the upper respiratory tract (reviewed in Bartley, 2010). Although calcitriol does not have direct anti-bacterial activity, it induces anti-tubercular actions in cultured monocytes and macrophages (Chan et al., 1994). Recent evidence, stemming from the molecular cloning of 1α-hydroxylase (Monkawa et al., 2000), supports macrophages as the source
of 1α-hydroxylase that converts 25OHD to calcitriol and stimulates the mobilization of calcium seen in inflammatory diseases (Inui et al., 2001; Yokomura et al., 2003; Karakelides et al., 2006). Animal models provide additional evidence that calcitriol levels increase in tubercular infection. Rhodes et al. (2003) identified a transient increase in calcitriol levels following infection of cattle with bovine mycobacterium, but only among animals that went on to develop TB. This increase in activated vitamin D that accompanied infection suggests a role for vitamin D in the host immune reactivity to TB infection. In a mouse model, calcitriol increased production of nitric oxide, an endogenously produced anti-infective compound, suggesting a bactericidal mechanism for vitamin D in TB-infected animals (Waters et al., 2004). Other more recent studies have identified the peripheral cellular conversion of 25OHD to calcitriol as a mechanism for rapid local induction of anti-microbial peptides as a direct mechanism for killing TB and staphylococcal bacteria (Liu et al., 2006; Schauber et al., 2006). Immune responses to increased 25OHD levels may vary among individuals as a result of the genetic expression of Vdr polymorphisms. For example, Selvaraj et al. (2008) found that allelic variations in the Cdx-2 polymorphism were associated with either resistance or susceptibility to TB bacteria; however, more research is needed to better understand the genetic relationship between Vdr polymorphisms and TB susceptibility.
Systematic reviews and meta-analyses The AHRQ reviews did not identify relevant evidence for TB as an outcome. Nnoaham and Clarke (2008) systematically reviewed and meta-analyzed the relationship between low serum 25OHD levels and TB among diverse community- and hospital-based population groups in both developed and developing countries. The meta-analysis was restricted to studies that compared serum 25OHD levels in TB patients not on a treatment regimen with healthy matched controls. Seven observational studies were included in the meta-analysis, which found a 70 percent probability that a person without TB would have a higher serum 25OHD level than a person with TB. Whether this association predicts low serum 25OHD as a risk factor for active TB cannot be concluded from the analysis; however, the findings would increase the strength of similar findings from other high-quality observational studies or from a larger meta-analysis.
Additional evidence from randomized controlled trials Even though treatment of individuals with active TB with supplemental vitamin D can lead to hypercalcemia, vitamin D has been used as a therapeutic agent in the management of the disease. A small double-blind RCT of 131 individuals who had come into close contact with patients with TB (or TB contacts) in the United Kingdom (UK) measured the ability of a single oral dose of 100,000 IU of vitamin D to inhibit growth of recombinant mycobacteria,
an indicator of TB exposure, grown in vitro and detected using the Barger-Lux (BCG-lux) assay, from the study subjects (Martineau et al., 2007b). Compared with placebo, subjects who received the vitamin D treatment showed a significant increase in serum 25OHD levels for 6 weeks without hypercalcemia, as well as inhibition of in vitro growth of mycobacteria. Another small intervention trial examined the effect of UVB exposure on TB in recent Asian immigrants to the UK who have a higher TB prevalence than indigenous populations (Yesudian et al., 2008). Anti-microbial activity, expressed as response to the BCG-lux assay, varied between the subjects, showing a small transient decrease but no significant change following UVB exposure. Another RCT testing the effect of vitamin D supplementation on the clinical course of patients with TB also found no significant change in clinical outcome or reduction in mortality in patients treated with 100,000 IU of vitamin D three times over 8 months (Wejse et al., 2009). Only one of the two studies reviewed showed a significant effect of vitamin D treatment on 25OHD levels in TB patients, and none of the clinical trials showed a significant effect of vitamin D on clinical outcome. Thus, evidence from RCTs does not support a reduction in TB infections with vitamin D treatment.
Observational studies Because TB is rare in industrialized countries, particularly the United States, most observational studies are on populations from developing countries that have immigrated to developed countries. Gibney et al. (2008), in a retrospective analysis of hospitalized patients, found that low serum 25OHD levels in patients born in sub-Saharan African countries who immigrated to Australia were predictive of any form of TB infection as well as current and past infection. Another analysis of a small study of patients reporting to a TB clinic prior to treatment (Sita-Lumsden et al., 2007) found a statistically significant difference in serum 25OHD levels between TB patients and their contacts and the greatest difference among those patients with the lowest 25OHD levels. Although there was no difference in dietary intake of vitamin D between TB patients and their contacts, the TB patients did demonstrate a stronger correlation between dietary intake and measures of vitamin D in serum. Sun exposure did not differ between patients and their contacts. Strachan et al. (1995), in a case–control study of Asian immigrants to the UK who had a diagnosis of active TB, found a trend of increasing risk of TB correlated with a decreasing frequency of consumption of meat or fish and an 8.5-fold increased risk for TB among lactovegetarians compared with daily meat or fish eaters. Many observational studies of an effect of vitamin D on susceptibility to TB are confounded by endogenous production of calcitriol in infected individuals (Adams et al., 1989; Cadranel et al., 1994) and thus must be cautiously interpreted. Nevertheless, the few small studies identified support the findings
of the meta-analysis from Nnoaham and Clarke (2008) for higher serum 25OHD levels in TB patients; however, these studies did not uniformly find significant associations between vitamin D intake and risk for TB.
Influenza and upper respiratory infections Influenza is an acute contagious viral infection characterized by inflammation of the respiratory tract, fever, chills, and muscular pain. Upper respiratory infections are most commonly viral infections characterized by inflammation of the respiratory tract. Vitamin D has been hypothesized to act through the immune system to prevent influenza infections.
Biological plausibility Environmental observations of seasonal variation in serum 25OHD levels and occurrence of influenza have been proposed as an indicator to show a correlation between vitamin D and risk for influenza (Cannell et al., 2006; Hayes, 2009). In an animal study (Underdahl and Young, 1956), mice deficient in vitamins A, D, and E and inoculated with influenza had the same intensity of influenza infection as those mice replete in vitamins A, D, and E, showing no effect of vitamin D status on reducing influenza infection. This finding contrasts with earlier work by Young et al. (1949), which suggested that vitamin D could reduce the susceptibility of mice to influenza.
Systematic reviews and meta-analyses The AHRQ studies did not identify any relevant studies for influenza as a health outcome. There were no meta-analyses identified for this indicator.
Additional evidence from randomized controlled trials Available data from RCTs do not provide strong support for a role for vitamin D in reducing susceptibility to influenza infection. A small RCT testing the effect of 1,200 IU of vitamin D supplementation per day for 4 months found that for influenza A as the primary outcome, occurrence between days 1 and 30 was not significantly different between the vitamin D group and placebo, but between days 31 and 60, influenza A occurred significantly less often in the vitamin D than in the placebo group; between day 61 and the end of the study, the occurrence of influenza A was not significantly different between the vitamin D and placebo groups (Urashima et al., 2010). Analysis of other related secondary outcomes showed no significant difference for influenza B, influenza-like illness (negative in rapid influenza diagnostic tests), non-specific fever, gastroenteritis, pneumonia, hospital admission, or absence from school. Overall, the absolute reduction in influenza A cases was offset by a similar increase in the number of influenza B cases. These may be chance findings, however, as a result of confounding by the loss of subjects. In another 3-month prospective double-blind RCT (Li-Ng et al., 2009), even though 73 percent of subjects supplemented with 2,000 IU of vitamin D3 daily achieved a serum 25OHD level above 75 nmol/L, no benefit of supplementation was seen for either prevention of self-reported
upper respiratory infections or a decrease in their severity. This evidence from RCTs in both children and adults shows no causal role for vitamin D in either reducing or preventing influenza.
Observational studies Only one study of 16 patients was identified in which plasma 25OHD levels were measured in children undergoing tympanosotomy tube placement. The study showed that 50 percent of the children had 25OHD levels less than 50 nmol/L and 31 percent had levels between 52.5 and 72.5 nmol/L (Linday et al., 2008). The authors concluded from this finding that there was a possible relationship between vitamin D and susceptibility to bacterial infection and influenza. This small observational study is not adequate to support a relationship between vitamin D and one outcome related to influenza infection and no additional evidence was found to verify any causal or associative relationship between vitamin D and influenza.
Concluding Statement
The committee’s review of the results of large cohort studies showed support for a positive association between vitamin D intake and reduction in symptoms associated with asthma but not with diagnosed disease. Other observational evidence of lower quality was found to largely support an association between risk for asthma and 25OHD level in blood, but associations have not been shown for diagnosed asthma. The lack of causal evidence and the lack of observational data demonstrating a relationship between vitamin D and diagnosed asthma led the committee to conclude that development of a DRI for this indicator is not supported by the totality of the evidence reviewed.
Emerging observational evidence in humans and experimental studies in animals inversely links vitamin D measures to risk of autoimmune disorders such as type 1 diabetes, MS, and IBD as well as infectious diseases such as TB (Maruotti and Cantatore, 2010). However, even though animal models indicate plausibility for a mechanistic role for vitamin D in autoimmune or anti-microbial function, results from RCTs as well as from observational associations between vitamin D and calcium and risk for either autoimmune or infectious diseases show a lack of consistency. Although both retrospective and prospective studies tend to support an inverse association between serum 25OHD levels and autoimmune and infectious diseases, these studies are limited in their interpretation owing to confounding effects that require further verification. The evidence available from RCTs is of limited utility because of the small size of the trials, inconsistency in measured outcomes, and lack of dose–response data. Overall, the evidence was not consistently supportive of a causal role for vitamin D combined with calcium or for vitamin D alone in reducing risk for developing auto-
immune or infectious diseases. In the absence of verifiable dose–response data from RCTs a conclusion about asthma, autoimmune, or infectious diseases as indicators for DRI development cannot be reached.
Neuropsychological Functioning
Emerging evidence is suggestive of a role for vitamin D in neuropsychological functioning, including a range of diseases from autism to Alzheimer’s.
Autism
Autism is a neurodevelopmental disorder of unknown etiology that manifests as repetitive behaviors, social withdrawal, and communication deficits. A number of factors are implicated in development of the disorder, including genetic (Abrahams and Geschwind, 2008) and environmental (Deth et al., 2008) factors.
Biological plausibility Although mechanistic studies using animal models tend to support an association between vitamin D intake during pregnancy and subsequent development of autism, these studies are limited in their interpretation and extrapolation to humans. There are some animal models suggesting a mechanism whereby vitamin D may influence the development of autism (reviewed in McGrath et al., 2004). These experiments demonstrate that pre-natal deprivation of vitamin D3 results in gross abnormalities in fetal rat brains at birth. Feron et al. (2005) subsequently reported that vitamin D deprivation and associated disruptions in brain development seen in rat pups at birth persisted into adulthood.
In humans, Vdr gene polymorphisms have been proposed as a possible link to psychiatric diseases, including autism. Yan et al. (2005) analyzed the coding sequences and splice junctions of 100 patients with schizophrenia and, in a pilot study within the same population, 24 patients with autism. The frequency of the sequence variants identified, however, was not significantly different from that of sequence variants found in control subjects.
Systematic reviews and meta-analyses The AHRQ reviews did not identify evidence to support autism as a relevant health outcome for vitamin D. No meta-analyses were identified for this indicator.
Additional evidence from randomized controlled trials No RCTs were identified for this indicator.
Observational studies No large, prospective cohort studies were identified that examined associations between either vitamin D intake or 25OHD
levels in blood and risk for autism. Three lower-quality observational studies were identified for further consideration: one retrospective chart review, one small cohort from a developing country, and one cross–sectional study. A recent study in Sweden that retrospectively reviewed serum 25OHD levels from medical records of out-patients receiving psychiatric care, including autism, suggested a high prevalence of vitamin D insufficiency in psychiatric outpatients (Humble et al., 2010). Although the study did not include matched controls, comparisons made with previously published samples from healthy Swedish populations suggested that the prevalence of vitamin D insufficiency was greater in the population receiving psychiatric care. The study, however, did not take into account dietary intake of vitamin D. Fernell and Gillberg (2010) tested the association between serum 25OHD levels and prevalence of autism in an analysis of a small cohort of mothers of children with autism from Somalia and Sweden, but they found no statistically significant differences in serum 25OHD levels between either group of mothers and controls.
Herndon et al. (2009), in a cross–sectional study, examined associations between vitamin D and calcium in dairy foods and autism. This study found that children with autism spectrum disorders consumed less calcium and fewer servings of dairy foods compared with children with typical development. Interpretation of this evidence for an association between vitamin D measures and risk for autism, however, is confounded by other potential factors that could influence vitamin D measures.
Concluding statement Owing to the lack of causal evidence from RCTs and a paucity of evidence, as well as a lack of data from large, prospective cohort studies and inconsistent findings for an association between vitamin D and incidence of autism from largely cross–sectional observational studies, autism was not considered further as an indicator for DRI development.
Cognitive Function
Loss of cognitive function in the form of dementia is frequently associated with aging. Between the ages of 60 and 85, the prevalence of dementia in the general population increases from 1 to 40 percent (Bolla et al., 2000). Dementia is classified into four major subtypes: Alzheimer’s disease, Lewy body dementia, frontotemporal dementia, and vascular dementia (Bolla et al., 2000; Grossman et al., 2006). Vitamin D has been hypothesized to confer neuroprotective effects and reduce the risk for developing dementia (Buell and Dawson-Hughes, 2008; McCann and Ames, 2008).
Biological plausibility Vitamin D has been proposed to prevent cognitive decline, and plausible biological mechanisms support this hypothesis. Vitamin D may protect against cognitive decline by promoting vascular health
through anti-inflammatory or other pathways, but may also have direct neuroprotective effects (Buell and Dawson-Hughes, 2008; McCann and Ames, 2008). Rodent models show morphological and biochemical effects of vitamin D on brain tissue. Early experiments on rat brain revealed that vitamin D-deficiency reduced vitamin D–dependent enzyme activity in the cerebral context, including non-sodium-mediated glucose transport, that was restored when rats were treated with calcitriol (Stio et al., 1993). Subsequent work in mouse models demonstrated that developmental vitamin D deficiency had a negative effect on brain development, as manifested by changes in brain size and shape and ventricular size and reduced nerve growth factor expression (McGrath et al., 2004; Feron et al., 2005), as well as effects on brain function and exploratory behavior (Harms et al., 2008). When adult offspring of dams deprived of vitamin D during pregnancy underwent learning tests, they displayed impaired learning at 30 weeks of age but not at 60 weeks (de Abreu et al., 2010).
VDR and 1α-hydroxylase are found throughout the brain. Vitamin D affects gene and protein expression in brain tissue, including expression of neurotropins and glial cell–derived neurotrophic factor (Naveilhan et al., 1996; Sanchez et al., 2002). A battery of 40 different tests in Vdr-null mice showed them to have normal cognitive function but abnormal muscle and motor behavior, although the abnormal neuromuscular function may be due to hypocalcemia rather than a direct effect of loss of the VDR (reviewed in Bouillon et al., 2008). In neurological tissue, vitamin D modulates certain calcium-binding proteins, including calbindin-D28K, parvalbumin, and calretinin, which are important for brain function (de Viragh et al., 1989; Alexianu et al., 1998). In addition, calcitriol down-regulates the expression of calcium channel currents in rat hippocampal cells (Brewer et al., 2006), stimulates neurogenesis in human neuroblastoma cells (Moore et al., 1996; Taniura et al., 2006), and may affect other pathways (Garcion et al., 1997; Baas et al., 2000; Brown et al., 2003; Obradovic et al., 2006). Vitamin D restriction results in unfavorable structural and biochemical changes in the brain (Ko et al., 2004; Feron et al., 2005). However, experiments in rats rendered vitamin D deficient by dietary and UV radiation restriction and in Vdr null mice have not consistently shown learning impairments, although the data are sparse (Becker et al., 2005; Minasyan et al., 2007). Calcium independently of or in concert with vitamin D is involved in many physiological processes related to neural functioning, and disturbed calcium homeostasis is also characteristic of neurodegenerative disorders (Canzoniero and Snider, 2005; Mattson, 2007; Toescu and Verkhratsky, 2007).
Systematic reviews and meta-analyses The AHRQ reviews did not identify sufficient evidence to support cognition (or cognitive decline) as a relevant health outcome for vitamin D. No meta-analyses were identified for this indicator.
Additional evidence from randomized controlled trials In the WHI trial, a subset of participants completed a cognitive test battery, but results of analyses examining the vitamin D intervention’s effect on cognitive function are not yet available.
Observational studies Numerous observational studies that examined associations between vitamin D, serum 25OHD level, or calcium and cognitive function were identified as potentially relevant to DRI development. The greatest number of studies, however, were cross–sectional. No large prospective cohort studies were identified for review, although two analyses of data from large population-based annual surveys and several small cohort studies were included.
Low serum 25OHD levels have been associated with decreased cognitive function in various population groups. A cross–sectional analysis of 752 women 75 years of age and older in the Epidémiologie de l’Ostéoporose (EPIDOS) study found that participants with vitamin D deficiency (serum 25OHD level < 25 nmol/L) had twice the odds of cognitive impairment as other participants (Annweiler et al., 2010). In a population-based cross–sectional study, Lee et al. (2009) examined associations between serum 25OHD level and cognitive function and mood among adult men in a European population. In a spline regression model, significant associations were found between slower information processing and serum 25OHD levels below 35 nmol/L in men ages 40 years and older. In contrast to these findings, a more recent cross–sectional study found that among 1,604 men up to 65 years of age in the Osteoporotic Fractures in Men (MrOS) Study, there were no associations between serum 25OHD level and cognitive impairment, even after adjusting for age, race/ethnicity, education, and other potential confounders (Slinin et al., 2010). This study also examined vitamin D measures as a predictor of subsequent cognitive decline over a mean of 4.6 years of follow-up and found only a borderline significant trend across the first three quartiles of serum 25OHD levels, (≤ 49.75 nmol/L, 50.0 to < 62.75 nmol/L, and 62.75 to < 74.5 nmol/L, respectively), compared with the fourth quartile (≥ 74.5 nmol/L); serum 25OHD level did not predict decline on a timed test of executive function.
In a cross–sectional study of 318 older individuals (mean age 74 years) receiving home health care services, those who received a neurological exam and cranial magnetic resonance imaging (MRI), a lower serum 25OHD level (< 50 nmol/L) was associated with at least twice the odds for all-cause dementia, Alzheimer’s disease, and stroke, as well as increased white-matter hyperintensity volume and prevalence of large-vessel infarcts (Buell et al., 2010). Among three age groups (adolescent, adult, and elderly) examined from NHANES III, no association was found between high serum 25OHD levels and learning or memory, and only the elderly population group was found to have an inverse association between 25OHD level
and performance on a task of learning and memory. Within the elderly population group, those in the highest quintile for serum 25OHD level were also the most impaired; thus, the results fail to confirm the hypothesis that serum 25OHD level enhances performance in learning and memory (McGrath et al., 2007).
There are few observational studies on calcium and cognitive function. In a cross–sectional study on Korean adults 60 years of age and older, a positive association was found between calcium intake and score on the Mini-Mental State Examination for Koreans (MMSE-K) in women but not in men after adjustment for age (Lee et al., 2001). In contrast, another study in Portuguese adults more than 65 years of age found no association between calcium intake and MMSE score after 8.5 months of follow-up (Velho et al., 2008). Using a cross–sectional analysis, Wilkins et al. (2009) found, as expected, lower serum 25OHD levels among the African American population compared with the white population, and poorer cognitive performance among African Americans with the lowest 25OHD levels compared with those with higher levels. Similarly, in a cross–sectional analysis in a British population of adults ages 65 years or older with serum 25OHD levels reported in quartiles, Llewellyn et al. (2009) found a greater risk for impaired cognitive performance among persons in the lowest (8 to 30 nmol/L) compared with the highest quartile (66 to 170 nmol/L). Even though the committee identified a large number of observational studies that evaluated associations between vitamin D and calcium and cognitive function, these were predominantly lower quality cross–sectional studies or small cohort studies, and their results were mixed. No causal evidence was found to support experimental evidence for biological plausibility and the relatively weak observational evidence. The committee took into account the generally lower quality of the study designs in its interpretation of the findings and in drawing conclusions about outcomes associated with this indicator.
Depression
Depression is a disease with characteristic signs and symptoms that interfere with the ability to work, sleep, eat, and enjoy once-pleasurable activities. These signs and symptoms include loss of interest in activities; a persistently sad or anxious mood; feelings of hopelessness, pessimism, guilt, worthlessness, or helplessness; social withdrawal; fatigue; sleep disturbances; difficulty in concentrating or making decisions; unusual restlessness or irritability; persistent physical problems that do not respond to treatment; and thoughts of death or suicide or suicide attempts. Depressive disorders include major depressive disorder, dysthymic disorder, psychotic depression, postpartum depression, and seasonal affective disorder, with
major depressive disorder and dysthymic disorder being the most common.2 Whether there is a functional relationship between measures of serum vitamin D or intake and mood or depression has not been determined.
Biological plausibility Seasonal affective disorder occurs more often at northern latitudes, and the etiology is presumed to be due, at least in part, to lack of sunlight exposure. In turn, lack of sunlight exposure causes low serum 25OHD levels unless the diet is adequate in vitamin D. Investigators have pursued the hypothesis that the low serum 25OHD levels are a cause of seasonal affective disorder, although it must be considered that the lack of sunlight may independently cause both seasonal affective disorder and low serum 25OHD levels without a direct link between them.
Systematic reviews and meta-analyses The AHRQ reviews did not identify sufficient evidence to support depression as a relevant health outcome for vitamin D. No meta-analyses were identified for this indicator.
Additional evidence from randomized controlled trials One RCT was identified that evaluated effects of vitamin D supplementation on depressive symptoms. Jorde et al. (2008) gave either 20,000 or 40,000 IU of vitamin D3 or a placebo treatment weekly for 1 year to men and women ages 21 to 70 years, living in Norway. Symptoms of depression were evaluated using the Beck Depression Inventory (BDI), and serum 25OHD level and BMI were measured. Participants whose serum 25OHD levels were below 40 nmol/L had significantly higher BDI scores, indicating a higher incidence of depressive disorder, compared with those whose serum 25OHD levels were 40 nmol/L and above after 1 year. Both treatment groups indicated significant improvement in BDI score compared with placebo.
Results of other randomized trials testing the effects of vitamin D on a subtype of depression that occurs during the winter months have been mixed. Three small, short-term trials examining effects of treatment with vitamin D for seasonal affective disorder reported that vitamin D improves mood (Lansdowne and Provost, 1998; Gloth et al., 1999; Vieth et al., 2004), but a larger, longer-term trial found no effect (Thys-Jacobs et al., 1998). Vieth et al. (2004) treated adults with serum 25OHD concentrations below 61 nmol/L with the equivalent of either 4,000 or 600 IU of vitamin D per day for 3 months over two consecutive winters and found evidence of a significant difference in measures of improved well-being at the higher compared with the lower dose. Lansdowne and Provost (1998) assigned healthy adults to 5 days of treatment with either 400 or 800 IU of vitamin
|
2 |
Available online at http://www.nimh.nih.gov/health/publications/depression/what-are-the-different-forms-of-depression.shtml (accessed April 5, 2010). |
D or placebo and found that both vitamin D doses increased positive affect and decreased negative affect compared with placebo. Gloth et al. (1999) assigned 15 people to either 100,000 IU of vitamin D or broad-spectrum light therapy for 1 month and found an increase in serum 25OHD level was significantly associated with improvement in depressive symptoms. However, Harris and Dawson-Hughes (1993) randomized 250 middle-aged and older women to treatment with 400 IU of vitamin D per day of vitamin D plus 377 mg of calcium per day or to calcium alone for 1 year and found no treatment-related changes in seasonal mood as assessed by the Profile of Mood States (POMS) questionnaire.
Observational studies Among four cross–sectional studies on small population groups (n < 50) that evaluated associations between serum 25OHD level and evidence for clinical diagnosis of depression in women (Michelson et al., 1996; Herran et al., 2000; Eskandari et al., 2007) or men and women (Schneider et al., 2000), only Eskandari et al. (2007) found a significant association between serum 25OHD level and diagnosis of depression and Michelson et al. (1996) found a significant association with calcitriol level. Another large population-based cross–sectional study among middle-aged and elderly Chinese also found, after controlling for confounders and geographic location, no significant associations between serum 25OHD level (grouped by tertile) and symptoms of clinical depression (Pan et al., 2009). In contrast to the cross–sectional studies, Hoogendijk et al. (2008) found, in a cohort study in the Netherlands, a significantly lower mean serum 25OHD level (47.5 nmol/L) among individuals with both major and minor depression compared with a mean level of 55 nmol/L among those who did not have depression.
Concluding Statement
Although some observational studies support an association between low measures of vitamin D exposure and risk for cognitive impairment or changes in mood, results have been inconsistent, and the majority of studies were cross–sectional in study design, including possible selection bias or other confounding factors that diminish the quality ranking of the studies. In addition, few or no clinical trials were identified to support biological plausibility. As a result of the many shortcomings in study design and quality of observational evidence and the paucity of high-quality evidence from RCTs identified by the committee, the findings for neuropsychological indicators are inconclusive. The committee’s review of the available evidence for either associations or a causal relationship between vitamin D and calcium and risk for cognitive disorders shows a lack of sufficient evidence to support DRI development.
Preeclampsia, Pregnancy-Induced Hypertension, and Other Non-Skeletal Reproductive Outcomes
Preeclampsia is a serious condition in which hypertension and proteinuria arise in pregnancy. It can affect both the mother and the unborn child. Pregnancy-induced hypertension is a transient hypertension without proteinuria that occurs during pregnancy. Pregnancy is a type of immunological challenge, and women with some autoimmune diseases, particularly type 1 diabetes and RA, are at increased risk for developing preeclampsia (Evers et al., 2004; Wolfberg et al., 2004). Clinical observations have noted that urinary calcium excretion is low in women with preeclampsia, whereas it is elevated in women during normal pregnancy. Calcium intake has been examined relative to reducing the risk of preeclampsia.
Biological Plausibility: Preeclampsia and Pregnancy-Induced Hypertension
Vitamin D metabolism may be altered under conditions of preeclampsia (August et al., 1992), when calcitriol level is low and hypocalciuria is present, but it is unclear whether these are causes or consequences of preeclampsia. The placenta and deciduas both express 1α-hydroxylase and activate 25OHD in vitro. Calcitriol regulates immunomodulatory cytokine production in cultured decidual cells (Evans et al., 2006) and placental trophoblasts (Diaz et al., 2009). However, the specific role of vitamin D in vivo is less clear. Its actions in vitro may provide some clues as to its physiological relevance, but these hypotheses need to be examined rigorously in future studies.
As mentioned above, it has long been observed that urinary excretion of calcium is increased during pregnancy, and hypercalciuria may result. In contrast, women with preeclampsia often have hypocalciuria. This observation has prompted a number of investigations to test whether low calcium intake predisposes a pregnant woman to both hypocalciuria and preeclampsia, although a biological mechanism to explain how low calcium intake would cause the preeclampsia has not been clearly elucidated.
Systematic Reviews and Meta-Analyses: Preeclampsia and Pregnancy-Induced Hypertension
The AHRQ-Tufts analysis identified a single nested case–control study (rated B for methodological quality) that evaluated the association between serum 25OHD concentration and the risk of preeclampsia (Bodnar et al., 2007). The researchers found a significant association between preeclampsia and serum 25OHD concentrations when the serum values were less than 37.5 nmol/L early in pregnancy.
A 2007 systematic review of evidence incorporated 12 RCTs (15,528 women) to examine the relationship between calcium supplementation and preeclampsia prevention (Hofmeyr et al., 2007). Calcium supplementation reduced overall hypertension in 11 of the studies reviewed and incidence of preeclampsia in 12 of them. There was also a significant effect for calcium among women at high risk, which was greatest among those with lower baseline calcium intakes.
Additional Evidence from Randomized Controlled Trials: Preeclampsia and Pregnancy-Induced Hypertension
Additional RCTs not included in the review from Hofmeyr et al. (2007), although of lower-quality study design, also reported similar results suggesting that there may be no effect from daily calcium supplementation when dietary calcium intake is already adequate (Hofmeyr et al., 2006 [1,000 mg/day]; Villar et al., 2006 [2,000 mg/day]; Hiller et al., 2007 [1,800 mg/day]; Kumar et al., 2009 [500 mg/day]).
A prospective non-randomized clinical trial of the effect of vitamin D (0.5 mg/day) and calcium (312 mg/day) supplementation in women at risk for preeclampsia found that the incidence of preeclampsia was 10.9 percent lower in treated women than in controls (Ito et al., 1994). However, women who had the highest level of angiotensin II, a marker for preeclampsia, also had the lowest incidence of preeclampsia; thus, the role of calcium and vitamin D supplementation in preventing of preeclampsia is not clear from this trial (Ito et al., 1994). A small randomized trial of pregnant women in India supplemented with 600,000 IU of vitamin D in the seventh and eighth months of pregnancy compared with controls found no significant difference in incidence of preeclampsia, although a significant reduction in systolic blood pressure of 8 mmHg was seen in the vitamin D–supplemented group (Marya et al., 1987). The relationship of this small decrease in blood pressure to pregnancy-induced hypertension is unclear.
Observational Studies: Preeclampsia and Pregnancy-Induced Hypertension
Findings from observational studies have shown mixed results. In addition to the nested case–control study reviewed in AHRQ-Tufts, the committee identified one large prospective cohort study, a large retrospective cohort study, and two small case–control studies examining vitamin D intake or serum 25OHD level and risk for preeclampsia, as well as one small case–control study of serum calcitriol level and pregnancy-induced hypertension (Lalau et al., 1993). In the large prospective study, Haugen et al. (2009) examined associations between risk for preeclampsia and intake of vitamin D from diet and supplements. This study found that women
who developed preeclampsia did not have a lower intake of vitamin D from foods compared with women without preeclampsia, but they did have a significantly lower intake of vitamin D from supplements, although the dose of the supplement was not correlated with prevalence of preeclampsia. Risk for preeclampsia was reduced by 31 percent in women who achieved a total vitamin D intake from food plus supplements between 300 and 400 IU/day, and the minimum combined intake of vitamin D needed for a protective effect was 200 IU/day. Hypponen et al. (2007) retrospectively examined the use of vitamin D supplements in infants of women with previously diagnosed preeclampsia in the Northern Finland Birth Cohort of 1966. The female children of mothers who had preeclampsia had a greater prevalence of preeclampsia in their own pregnancies, but vitamin D supplementation was significantly associated with a lower subsequent risk of developing preeclampsia. In contrast to these findings, two case–control studies, one in the United States (Seely et al., 1992) and one in Denmark (Frolich et al., 1992), found no significant difference in serum 25OHD levels between women with preeclampsia and those without, even though serum calcium levels were significantly lower in the women with pregnancy-induced hypertension or preeclampsia, respectively. In a small case–control study, women with pregnancy-induced hypertension had lower total and free serum calcitriol levels than did normotensive women during pregnancy (Lalau et al., 1993), but serum 25OHD levels and vitamin D intake were not measured.
Concluding Statement: Preeclampsia and Pregnancy-Induced Hypertension
Overall, two observational studies identified associations between supplementary vitamin D and incidence of preeclampsia, but data on associations between serum 25OHD level and preeclampsia were not conclusive. Similarly, only one observational study reported an association of pregnancy-induced hypertension with lower serum total and free calcitriol levels (Lalau et al., 1993), and no placebo-controlled RCTs were identified that examined a causal relationship between vitamin D and preeclampsia or pregnancy-induced hypertension.
Calcium supplementation has not been shown to have an effect on the incidence of preeclampsia in normal women meeting calcium requirements, but it may be of benefit in cases of low calcium intake. Associations between serum 25OHD level (as well as calcitriol level) and the onset of preeclampsia have not been well studied and a mechanism of action is unclear. Thus, because of the lack of a causal relationship and the inconsistent results in the observational studies for both vitamin D and calcium the committee concluded that neither preeclampsia nor pregnancy-induced hypertension can be considered as an indicator for DRI development.
Other Non-Skeletal Reproductive Outcomes
Neither AHRQ-Ottawa nor AHRQ-Tufts addressed maternal non-skeletal outcomes beyond preeclampsia and pregnancy-induced hypertension. However, other non-skeletal outcomes may include maternal events such as cesarean section, obstructed labor, and vaginosis. Regarding fetal outcomes, so-called developmental programming of health outcomes in the offspring may focus on immune-related outcomes such as type 1 diabetes and atopic eczema, which has been included above in autoimmune response, as well as measures of BMD and skeletal development, discussed below in the Skeletal Health section. Infant birthweight is also of interest.
One observational study has reported an increased risk of approximately 65 percent and 26 percent of bacterial vaginosis in women with serum 25OHD levels below 20 nmol/L and below 50 nmol/L, respectively, compared with those with serum 25OHD levels of 75 nmol/L (Bodnar et al., 2009). Two observational studies reported conflicting results for the association of serum 25OHD levels with maternal delivery (cesarean/obstructed), with one finding an inverse association (Merewood et al., 2009) and the other finding no relationship with serum 25OHD levels. Overall, insufficient evidence makes maternal Cesarean delivery/obstructed labor uninformative for DRI development.
Regarding infant birthweight, AHRQ-Tufts discussed two RCTs (Mallet et al., 1986 and Maxwell et al., 1981; quality graded B and C, respectively) and reported no effect of supplemental vitamin D during pregnancy on offspring’s birthweight or length, and also one RCT (Marya et al., 1988; quality graded C) that reported an increased birthweight in vitamin D–supplemented pregnant women with low dietary intakes of vitamin D. One additional RCT published after the AHRQ-Tufts report (Yu et al., 2009) also reported no effect of vitamin D on infant birthweight.
Brooke et al. (1980) reported on an RCT that involved 126 women treated with either a dose of vitamin D or a placebo during pregnancy. The intended dose for the treated group was 1,000 IU/day, but it appears that a higher dose was administered (10,000 IU/day) as the achieved cord level of 25OHD was 138 nmol/L for the treated group versus 10 nmol/L. In any case, no change in birthweight was evidenced. In a smaller study of 40 pregnant women, Delvin et al. (1986) showed no effect on birthweight comparing 1,000 IU/day versus a placebo.
Several observational studies have also examined this relationship, again with conflicting results. In a nested case–control study, a U-shaped relationship was found only in white women, with an increased probability (2.4 to 3.9) of small-for-gestational-age measures in those women in the lowest (21 to 58 nmol/L) and the highest (90.7 to 245.0 nmol/L) quartiles of serum 25OHD levels (Bodnar et al., 2010). In the same study, despite
lower serum 25OHD levels in black women, no relationship was found between small-for-gestational-age measures and maternal serum 25OHD levels. In a prospective cohort observational study, mean birthweight was lowest in infants born to women with 25OHD levels below 30 nmol/L, intermediate in those born to women with 25OHD levels 30 to 50 nmol/L, and highest in those born to women with 25OHD levels above 50 nmol/L (Leffelaar et al., 2010). Birthweight was 60 g lower for the infants of women who consumed less than 200 IU of vitamin D per day during pregnancy compared to those who consumed 200 IU of vitamin D or more per day, and there was a significant linear trend for increased birthweight from lowest to highest quintile of intake (Scholl and Chen, 2009). Morley et al. (2006) enrolled 475 women in a study that compared maternal serum 25OHD levels during pregnancy to offspring birth size. No relationship was reported. Other observational studies reported no effect of vitamin D on birthweight (Brunvand et al., 1998; Gale et al., 2008; Farrant et al., 2009). The relationship, however, has not been tested in a sufficiently powered clinical trial. Corrections for differences in gestational length and other potentially confounding factors are not usually possible with associational studies. The available evidence for non-skeletal outcomes is limited and presently conflicting among both RCTs and observational studies, precluding the ability to find these data useful at this time for DRI development.
Skeletal Health
Skeletal health, referred to commonly as bone health, is manifested by desirable growth and maintenance of skeletal tissue, including bones and teeth. The use of bone health outcomes as reflective of calcium and vitamin D requirements is long-standing. Bone health served as an indicator for determining the calcium and vitamin D DRIs in 1997, when nutrient reference values for these nutrients were last reviewed (IOM, 1997). Since that time, additional studies have added to the scientific understanding of the relationships between calcium and vitamin D and bone health and are reflected to a large extent in AHRQ-Ottawa and AHRQ-Tufts, completed in 2007 and 2009, respectively.
Bone health is a concern throughout the life span. Initially, it comprises skeletal development during the times of gestational development and growth in infancy, childhood, and adolescence; this is followed by bone maintenance in adulthood. Menopause and aging result in bone loss. Various measures and health conditions are relevant to considerations of bone health; these include BMC/BMD, calcium balance, rickets/osteomalacia, and fracture risk. The latter is particularly germane to older adults. Further, while not health outcomes, measures of serum 25OHD concentrations and of circulating PTH levels have been incorporated into
studies as intermediates related to bone health. Finally, although physical performance and the incidence of falls are defined by some as a component of bone health, these measures are reviewed separately in this report.
Compared with other potential indicators, this health outcome is characterized by a sizable number of RCTs as well as numerous observational studies from large cohorts. However, many of the studies evaluated calcium and vitamin D in combination, and there are relatively few studies that have evaluated the effects of calcium alone without vitamin D supplementation or vice versa. Given the nature of the available data and the need to integrate information to develop a set of measures reflective of bone health as a potential indicator for developing DRIs, this section is organized differently from those for other potential indicators. The understandings that link calcium and vitamin D to bone health and provide the basis for biological plausibility for an effect on bone health have been described in Chapters 2 and 3 and are therefore not repeated here. The many observational studies are briefly summarized.
Given the depth and breadth of the available AHRQ systematic analyses for the topic of bone health, the AHRQ analyses are considered in a single section. The two AHRQ analyses systematically reviewed, first, the published literature on the relationship between bone health and vitamin D (often in combination with calcium) (AHRQ-Ottawa) and, second, the relationship between bone health and vitamin D alone or vitamin D in combination with calcium (AHRQ-Tufts). Neither of the two AHRQ analyses considered calcium alone in relation to bone health. These two analyses have been described at the beginning of this chapter, and specific information about the studies included in AHRQ can be found in Appendixes C and D. Relevant information has been summarized and included in the tables presented below.
AHRQ included only minimal information about reproductive outcomes, and therefore the literature related to skeletal health during pregnancy and lactation is highlighted. AHRQ also included only minimal information about PTH level, a measure some investigators relate to bone health, so PTH level as a potential measure for bone health is examined separately.
The final component of this section integrates the available data on the basis of bone accretion, bone maintenance, and bone health. The preliminary step of specifying the utility of serum 25OHD level as a marker as well as the relationship between calcium absorption and serum 25OHD level provides the opening discussions for the integration section.
Summary of Observational Studies
The observational studies surrounding bone health are myriad. However, as is the case with the evidence hierarchy, the basis for the relation-
ship between the two nutrients and bone health is more appropriately explored by examining evidence from controlled interventions, although data from observational studies can lend support and offer confirmatory input. Observational data regarding calcium intake and bone health are mixed regarding the finding that a range of increasing calcium intakes above deficiency levels are associated with improved bone mass and reduced fracture risk. These studies are confounded by an array of variables that have an impact on measures of bone density.
Regarding serum 25OHD concentrations and bone health, the AHRQ-Ottawa analysis concluded that observational studies suggested a correlation between higher serum 25OHD concentrations and increased BMC for older children and adolescents. For postmenopausal women and elderly men, observational studies reviewed in AHRQ-Ottawa provided fair evidence to support an association between serum 25OHD level and BMD or changes in BMD at the femoral neck. This analysis noted that the observational data overall were discordant with the results from available RCTs. Newer observational studies for the most part are consistent with older observational studies with respect to a relationship between low serum 25OHD levels and outcomes such as bone loss, fractures, or osteomalacia (Cauley et al., 2008; Looker and Mussolino, 2008; van Schoor et al., 2008; Ensrud et al., 2009; Bolland et al., 2010b; Cauley et al., 2010; Melhus et al., 2010). However, there are confounders related to such studies, including age, calcium intake, and social situation.
Bone mineral content/bone mineral density: Serum 25OHD AHRQ conducted its analyses for serum 25OHD concentrations on the basis of certain age and gender groups, as presented below.
Infants Overall, AHRQ-Ottawa, for which some studies included combinations of calcium and vitamin D, has reported that there is inconsistent evidence for an association between serum 25OHD concentrations and BMC measures in infants. Of the two RCTs examining BMC (Greer et al., 1982; Zeghoud et al., 1997), one demonstrated no significant benefit of higher serum 25OHD concentrations on radial bone mass, whereas the other showed a transient increase of BMC compared with the unsupplemented group at 12 weeks, but not at 26 weeks. Based on case–control studies (Okonofua et al., 1986; Bougle et al., 1998; Namgung et al., 1998; Park et al., 1998), greater whole-body BMC was related to higher serum 25OHD levels. Data are summarized in Table 4-5. AHRQ-Tufts found no additional RCTs for infants published in the period since the completion of the AHRQ-Ottawa review.
Children and adolescents For children and adolescents, there was fair evidence from AHRQ-Ottawa of an association between serum 25OHD levels and baseline BMD and change in BMD or BMD indexes. However, the results from the RCTs (Ala-Houhala et al., 1988; El-Hajj Fuleihan et al.,
TABLE 4-5 Serum 25OHD Levels and Bone Health Outcomes for Infants: Summary from AHRQ-Ottawa Analysesa
|
Reference; Country; Jadad Score for RCTsb |
Population Description |
Intervention/Duration |
Bone Health Outcomes |
Results |
|
RCTs |
||||
|
Greer et al., 1982 |
Healthy full-term infants; exclusively breast-fed |
IG1: 400 IU vit D2/d CG: placebo |
Distal L radius BMC (SPA) |
Serum 25OHD, mean (nmol/L) |
|
Baseline: no significant difference between groups |
||||
|
United States |
|
|
|
|
|
|
|
12 wk: IG1: 95* (graph) CG: 50 |
||
|
n = 18 |
12 wk (double-blind) |
|
||
|
Measured at 3, 6, 12, 26, 40, and 52 wks |
||||
|
Jadad = 3 |
66% female |
|
||
|
|
At 6 mo, unblinded to mother, and placebo group began to receive 400 IU vit D2/d |
|||
|
17 Caucasian 1 Asian-Indian |
26 wk: IG1: 81.8 CG: 32.3 |
|||
|
|
|
BMC, mean (SEM) (mg/cm) 12 wk: IG1 79 (3); CG 64 (3); p< 0.003 26 wk: IG1 70 (6); CG 75 (5); NS 52 wk: IG1 108 (20); CG 120 (19) (CG receiving vit D for 6 mo) |
||
|
|
Followed to 1 y |
|
||
|
Greer and Marshall, 1989 |
Healthy full-term infants born to mothers willing to breastfeed for 6 mo |
IG1: 400 IU vit D2/d |
Distal L radius BMC (SPA) |
Total serum 25OHD, mean (SD) (nmol/L) At birth: IG1: 59.7 (11.8) CG: 58.8 (19.1) |
|
CG: placebo |
||||
|
United States |
|
|
|
|
|
6 mo, starting at birth |
|
|
||
|
Measured at 1.5, 3.0, and 6.0 mo |
6 mo: IG1: 92.4 (29.7) CG: 58.8 (24.9), p < 0.01 |
|||
|
n = 46 (+ 12 controls) |
|
|||
|
Jadad = 4 |
|
|||
|
46% female |
|
|
BMC, mean (SD) (mg/cm) |
|
|
All infants had Caucasian mothers (fathers included 1 black, 1 American Indian) |
|
|
No significant difference between groups at 1.5 and 3.0 mo. At 6.0 mo, CG was significantly greater than IG1: IG1 89.5 (12.5) vs. CG 101.0 (17.9), p < 0.05 |
|
|
|
|
However, change in mean BMC from 1.5 to 6.0 mo was not different between groups |
|
Reference; Country; Jadad Score for RCTsb |
Population Description |
Intervention/Duration |
Bone Health Outcomes |
Results |
|
Zeghoud et al., 1997 |
Healthy neonates and their mothers |
IG1: 500 IU vit D2/d IG2: 1,000 IU vit D2/d |
iPTH (RIA) |
Serum 25OHD, mean (SD) Baseline total sample: 29.5 (13.8) nmol/L; range 10–80 nmol/L 51/80 (63.7%) ≤ 30 nmol/L |
|
France |
n = 80 |
Measured at 3–6 d, 1 mo, 3 mo |
|
|
|
|
|
|
iPTH was significantly higher in neonates with 25OHD < 16 nmol/L than in those born with 25OHD > 30 nmol/L: mean (SD) 70 (30) pmol/L |
|
|
Jadad = 1 |
European |
|
|
|
|
|
|
Starting at 3–6 d after birth |
|
|
|
|
|
|
|
Mean baseline 25OHD by group** Group 1 (n = 14): 25OHD ≤ 30 nmol/L and iPTH > 60 ng/L: 17.9 (7.8) Group 2 (n = 36): 25OHD ≤ 30 nmol/L and iPTH < 60 ng/L: 22.7 (6.5) Group 3 (n = 29): 25OHD > 30 nmol/L and iPTH < 60 ng/mL: 43.7 (10.6) |
|
|
|
All infants fed formula with mean (SD) 426 (46) IU vit D3/L |
|
|
|
|
|
|
|
At 1 mo, all 3 groups (pooled vit D doses): mean serum 25OHD was significantly increased, and there was no significant difference between groups Group 1: 53.1 (12.0) nmol/L Group 2: 59.8 (17.7) nmol/L Group 3: 59.2 (11.4) nmol/L |
|
|
|
|
|
At 3 mo, mean 25OHD for total sample (pooled doses) was 69.0 nmol/L; highest value 92.5 nmol/L |
|
|
|
|
|
IG1 (500 IU D2/d): For group 1, at 1 mo (45.5 nmol/L) and 3 mo (56.1 nmol/L), serum 25OHD values were significantly lower than in the other 2 groups receiving same dose and lower than in all groups receiving 1,000 IU/d |
|
|
|
|
|
IG2 (1,000 IU vit D2/d): Change in serum 25OHD (3 mo) was not significantly different between the 3 groups |
|
Case–control studies |
||||
|
Okonofua et al., 1986 |
Healthy full-term infants |
NA |
Fractures during birth |
Serum 25OHD, mean (SD) (nmol/L): Lower in Asian vs. white full-term infants (p < 0.01) White: 15 (5) (range 9–39) Asian: 6 (4) (range < 5–20) |
|
UK |
n = 21 |
|
||
|
|
47.6% Caucasian 52.4% Asian |
|
|
|
|
|
|
|
Maternal 25OHD in white mothers was 30 (11) nmol/L and in Asian mothers was 15 (10) nmol/L; serum PTH was higher in Asian mothers 25OHD levels in mothers were significantly higher than neonatal levels; the two were correlated (r = 0.60) |
|
|
|
|
|
|
Fractures during birth: 0 |
|
Bougle et al., 1998 |
Healthy full-term infants |
NA |
LS BMD and BMC (DXA) |
Full-term infants: Serum 25OHD, mean (SD) nmol/L (range) 75 (52.5) (10.0–292.5) 25OHD negatively related to BMD (r = −1.7, p = 0.02) and to BMC (r = −0.04, p = 0.02) in a simple regression analysis, but not related to BMC orBMD in a multiple regression analysis |
|
France |
n = 82 (also 44preterm) |
|
|
|
|
|
Asian |
|
|
|
|
Reference; Country; Jadad Score for RCTsb |
Population Description |
Intervention/Duration |
Bone Health Outcomes |
Results |
|
Namgung et al., 1998 |
Healthy full-term infants |
NA |
Whole-body BMC measured before 3 d of age (DXA) |
Serum 25OHD, mean (SD) (nmol/L): Winter-born infants had lower 25OHD than summer-born infants (p < 0.001) Winter born: 26.8 (19.0) Summer born: 75.0 (24.0) |
|
Korea |
n = 71 (37 born in summer and 34 in winter) |
|
||
|
|
|
|
% of infants with levels < 27.5 nmol/L Winter born: 97% Summer born: 47% |
|
|
|
Summer 59% female Winter 38% female |
|
||
|
|
|
|
Winter-born infants had 8% lower whole-body BMC than summer-born infants (p = 0.0002) BMC LSM (SD) (g/cm): Winter born: 86.7 (7.7) Summer born: 93.9 (7.8) |
|
|
|
Korean |
|
|
|
|
|
|
|
|
Whole-body BMC correlated positively with serum 25OHD (r = 0.243, p = 0.047) |
|
|
|
|
|
Maternal 25OHD was lower in winter than in summer: 24 (13) vs. 43 (18), p < 0.001 |
|
Park et al., 1998 |
Healthy full-term infants born in winter (some exclusively breast-fed [n = 18] or formula-fed with 400 IU vit D [n = 17]) |
NA |
LS BMC and BMD (DXA) |
Serum 25OHD, mean (SD) (nmol/L): Mean was lower in breast-fed vs. formula-fed infants, p = 0.001 Breast-fed: 39.9 (28.2) Formula-fed: 72.5 (22.2) |
|
Korea |
|
|
|
|
|
|
|
|
% with 25OHD < 28 nmol/L Breast-fed: 8/18 (44%) Formula-fed: 1/17 (6%), p = 0.01 |
|
|
|
|
|
|
LS BMD no difference between breast-fed (n = 14/18) and formula-fed infants (n = 14/17) (data NR) |
|
|
n = 35 |
|
|
|
|
|
Breast-fed 28% female Formula-fed 47% female |
|
|
|
|
|
|
|
LS BMC, mean (SD) (g/cm) No difference between groups Breast-fed: 0.62 (0.2) Formula-fed: 0.65 (0.2) |
|
|
|
Korean |
|
|
|
|
|
|
|
|
25OHD did not correlate with BMC (r = 0.173, p = 0.39, n = 28) |
|
NOTE: *SEM provided in graph but not estimable; **1/80 infants did not clearly fit into any category and had findings suggestive of transient congenital hypoparathyroidism; BMC = bone mineral content; BMD = bone mineral density; CG = control group; d = day; DXA = dual-energy X-ray absorptiometry; IG = intervention group; iPTH = intact parathyroid hormone; IU = International Units; L = Left; LS = lumbar spine; LSM = least squares mean; mo = month(s); NA = not applicable; NR = not reported; NS = not significant; RCT = randomized controlled trial; RIA = radioimmunoassay; SD = standard deviation; SEM = standard error of the mean; SPA = single-photon absorptiometry; UK = United Kingdom; vit = vitamin; wk = week(s); y = year(s). aThis table has been truncated for the purposes of this chapter, but it can be found in its entirety in Appendix C. bJadad score is based on a scale of 1 to 5. See Box 4-1 for details on the scoring system. SOURCE: Modified from Cranney et al. (2007). |
||||
2006) did not confirm a consistent benefit on BMD or BMC across skeletal sites and age groups. Some studies included combinations of calcium and vitamin D.
There were seven studies in older children and adolescents (two RCTs, three cohort studies, one case–control study, and one before-and-after study) that evaluated the relationship between serum 25OHD concentrations and BMC or BMD (see Table 4-6). In older children, there was one RCT, one prospective cohort study, and one before-and-after study. The RCT (Ala-Houhala et al., 1988) did not find an association between serum 25OHD concentrations and distal radial BMC. Two of three non-RCT studies found a positive association between baseline serum 25OHD concentrations and BMC or BMD. The effect of bone size and muscle mass on these outcomes in relation to baseline serum 25OHD concentrations was not reported.
One RCT with children and adolescent girls (El-Hajj Fuleihan et al., 2006) demonstrated a significant relationship between baseline serum 25OHD concentrations and baseline BMD of the lumbar spine, femoral neck, and radius. However, only high dose supplementation with 14,000 IU of vitamin D3 per week increased BMC of the total hip.
AHRQ-Tufts identified two RCTs available after the AHRQ-Ottawa analysis, both rated C, that compared the effect of vitamin D supplementation alone on BMC in healthy girls between 10 and 17 years of age (El-Hajj Fuleihan et al., 2006; Andersen et al., 2008). Both RCTs were rated C because the results were not adjusted for important potential confounders, such as height, bone area, lean mass, sun exposure, and pubertal status. One RCT (Andersen et al., 2008) analyzed 26 healthy girls, who were Pakistani immigrants primarily living in the Copenhagen area of Denmark (latitude 55°N). Girls were randomly assigned to receive either a daily dose of 400 or 800 IU of vitamin D3 or placebo for 1 year. The mean baseline dietary calcium intake was 510 mg/day, and the serum 25OHD concentration was 11 nmol/L. At the end of the study, there were no significant differences in whole-body BMC changes between groups receiving the two doses of vitamin D3 (400 or 800 IU/day) and the placebo group. A second RCT (El-Hajj Fuleihan et al., 2006) analyzed 168 healthy girls living in the Greater Beirut area, Lebanon (latitude 33°N). Girls were randomly assigned to receive either weekly oral vitamin D doses of 1,400 IU (equivalent to 200 IU/day) or 14,000 IU (equivalent to 2,000 IU/day) or placebo for 1 year. The mean baseline dietary calcium intake was 677 mg/day, and the 25OHD concentration was 35 nmol/L. At the end of the study, there were no significant differences in whole-body BMC changes between either the low-dose vitamin D group (200 IU/day) or the high-dose vitamin D group (2,000 IU/day) and the placebo group. The same findings were seen when analyses were restricted to either premenarcheal or postmenarcheal girls.
TABLE 4-6 Serum 25OHD Levels and Bone Health Outcomes for Older Children and Adolescents: Summary from AHRQ-Ottawa Analysesa
|
Reference; Country; Jadad Score for RCTsb |
Population Description |
Intervention/Duration |
Bone Health Outcomes |
Results |
|
RCTs |
||||
|
Ala-Houhala et al., 1988 |
Children, 8–10 y old |
IG1: 400 IU vit D2 5–7×/wk CG: placebo |
Distal radius BMC (SPA) |
Serum 25OHD, mean (SD) (nmol/L) Baseline (winter): IG1: 49.3 (19.0) vs. CG: 46.0 (15.5) Mid-study (autumn): IG1: 78.0 (24.3) vs. CG 59.0 (17.8) End-of-study (winter): IG1: 71.3 (23.4) vs. CG 43.3 (19.5), p < 0.01 |
|
|
||||
|
|
n = 60 |
|
|
|
|
Finland |
|
13 mo |
|
|
|
|
IG1: 62% female CG: 48% female |
|
|
|
|
Jadad = 1 |
|
|
||
|
|
Caucasian |
|
|
|
|
|
|
|
|
No difference between groups in distal radius BMC at 13 mo |
|
Reference; Country; Jadad Score for RCTsb |
Population Description |
Intervention/Duration |
Bone Health Outcomes |
Results |
|
El-Hajj Fuleihan et al., 2006 |
Children and adolescent girls (premenarcheal and postmenarcheal), 10–17 y |
IG1: 1,400 IU vit D/wk IG2: 14,000 IU vit D/wk CG: placebo |
BMD and BMC LS, forearm, total body (DXA) |
25OHD, mean (SD) (nmol/L) baseline: IG1: 35.0 (22.5) IG2: 35.0 (20.0) CG: 35.0 (17.5) |
|
Lebanon |
|
|||
|
Jadad = 4 |
|
|
|
|
|
|
|
1 y |
|
1 y: IG1: 42.5 (15.0) IG2: 95.0 (77.5) CG: 40.0 (20.0) |
|
|
n = 179 |
|
|
|
|
|
Middle Eastern |
|
|
|
|
|
|
|
|
Covariates: percentage change in bone area, percentage change in lean mass Significant association between baseline serum 25OHD and: LS BMD (r = 0.16, p = 0.033) Femoral neck (r = 0.17, p = 0.028) Radius BMD levels (r = 0.24, p = 0.002) Radius BMC levels (r = 0.16, p = 0.033) Largest increases in bone mass in IG2 (high dose) subjects with lowest 25OHD levels at baseline |
|
Prospective cohort studies |
||||
|
Guillemant et al., 1999 |
Healthy adolescent boys from a jockey training center; age range 13 y 5 mo to 16 y 1 mo |
NA |
iPTH (immunoradiometric assay, Nichols) |
25OHD, mean (SD) (nmol/L) Post-summer 58.5 (10.0) Post-winter 20.6 (6.0), p = 0.0001 |
|
France |
|
|
||
|
|
|
At serum 25OHD > 83 nmol/L, iPTH plateau occurred at 2.48pmol/L |
||
|
|
n = 175 |
|
|
|
|
|
Caucasian |
|
|
|
|
Javaid et al., 2006 |
Children with known maternal 25OHD status in third trimester; 9 y old |
NA |
Total body and LS BMC and areal BMD, calculated volumetric BMD (DXA Lunar DPX-L) |
Maternal serum 25OHD in late pregnancy: 18% had serum 25OHD levels < 27.5 nmol/L and 31% had levels 27.5–50.0 nmol/L |
|
UK |
|
|
||
|
|
|
Mothers with lower 25OHD during pregnancy had children with reduced total body (r = 0.21, p = 0.0088) and lumbar spine BMC (r = 0.17, p = 0.03). Adjustment for height did notweaken the relationship between total body BMC and 25OHD; volumetric LS BMD was not associated with maternal 25OHD. |
||
|
|
n = 198 |
|
|
|
|
|
Caucasian |
|
|
|
|
|
|
|
|
Adjusted for age of child |
|
Reference; Country; Jadad Score for RCTsb |
Population Description |
Intervention/Duration |
Bone Health Outcomes |
Results |
|
Lehtonen-Veromaa et al., 2002 |
Healthy adolescent girls; 12.9 (1.7) y, range 9–15 y |
NA |
LS BMD and BMAD FN BMD and BMAD (DXA) |
25OHD, mean (SD) (nmol/L) Baseline: 34.0 (13.2) (winter) 1 y: 33.2 (11.1) 3 y: 40.6 (15.8) |
|
Finland |
n = 191 |
|
|
|
|
|
|
|
|
Baseline 25OHD correlated with ∆ LS BMD (r = 0.35, p < 0.001) and ∆ FN BMD (r = 0.32, p < 0.001) |
|
|
Caucasian |
|
|
|
|
|
|
|
|
Baseline 25OHD correlated with ∆ LS BMAD (0.35, p < 0.001) and ∆ FN BMAD (0.24, p < 0.002) |
|
|
|
|
|
Adjusted for: baseline reproductive year, bone mineral values, increases in height and weight, mean intake of calcium, and mean amount of physical activity |
|
|
|
|
|
Significant correlation between baseline 25OHD and ∆ 3-y adjusted LS or FN BMD and BMAD |
|
|
|
|
|
Difference in mean 3-y ∆ LS BMD between group with baseline 25OHD < 20 nmol/L and group with baseline 25OHD ≥ 37.5 was 4% |
|
Case–control studies |
||||
|
Marwaha et al., 2005 |
Healthy school children |
NA |
BMD (distal forearmand calcaneum) using DXA |
Serum 25OHD, mean (SD) (nmol/L): 29.5 (18.0) LSES: 26 (1); USES: 34 (1) 25OHD < 22.5 nmol/L: 35.7%; LSES 42.3% vs. USES 27%, p < 0.01 |
|
India |
(from LSES and USES); age range 10–18 y |
|
|
|
|
|
|
|
Prevalence of clinical vit D deficiency (defined by genu varum or genu valgum): LSES 11.6% vs. USES 9.7%, p = 0.07 |
|
|
|
n = 5,137 (3,089 LSES; 2,048 USES) |
|
|
|
|
|
|
|
Forearm mean BMD significantly higher (p < 0.01) in USES group compared with LSES |
|
|
|
LSES 65.1% female USES 52.7% female |
|
|
|
|
|
|
|
BMD adjusted for height and weight |
|
|
|
|
|
Serum calcium not significantly different between groups, but dietary calcium intake lower in LSES group |
|
|
Indian |
|
|
|
|
|
|
|
|
|
No significant correlation between BMD and serum 25OHD in either group |
|
Reference; Country; Jadad Score for RCTsb |
Population Description |
Intervention/Duration |
Bone Health Outcomes |
Results |
|
Before-and-after studies |
||||
|
Rajakumar et al., 2005 |
Healthy 6–10 y olds Tanner stage I/II (81% I) Skin type III/IV (81% IV); mean age 8.9 (1.2) y (range 6–10 y) |
400 IU vit D/d (isoform not specified) |
iPTH (Immulite iPTH chemiluminescent assay) |
Serum 25OHD, mean (SD) (nmol/L) Baseline: 60.0 (26.3) 49% < 50 71% < 75 |
|
United States |
|
|||
|
|
1 mo |
|
|
|
|
|
|
|
Group 1 = 25OHD < 50 nmol/L at baseline: 38.5 (8.0) Group 2 = 25OHD > 50 nmol/L at baseline: 80.3 (20.5) |
|
|
|
|
|
1 mo (total group): 68.8 (18.8) Group 1: 57.5 (16.0) Group 2: 79.5 (14.5) Increase in serum 25OHD was observed only in group 1 7/39 (18%) of group 1 continued to have a level < 50 nmol/L after 1 mo of supplementation |
|
|
|
Vit D dietary intake: mean (SD) 277 (146) IU/d 16/41 (39%) dietary intake < 200 IU/d |
|
|
|
|
|
|
|
Negative correlation of 25OHD with body weight (r = −0.378, p = 0.015) at baseline |
|
|
|
n = 42 |
|
|
|
|
|
34% female |
|
|
No significant differences at baseline or 1 mo in markers of bone turnover, 1,25(OH)2D or PTH between groups with 25OHD < 50 nmol/L or > 50 nmol/L at baseline |
|
|
African American |
|
|
|
|
NOTE: BMAD = bone mineral apparent density; BMC = bone mineral content; BMD = bone mineral density; CG = control group; DXA = dual-energy X-ray absorptiometry; FN = femoral neck; IG = intervention group; iPTH = intact parathyroid hormone; IU = International Units; LS = lumbar spine; LSES = lower socioeconomic status; mo = month(s); NA = not applicable; PTH = parathyroid hormone; RCT = randomized controlled trial; SD = standard deviation; SPA = single-photon absorptiometry; UK = United Kingdom; USES = upper socioeconomic status; vit = vitamin; wk = week(s); y = year(s). aThis table has been truncated for the purposes of this chapter, but it can be found in its entirety in Appendix C. bJadad score is based on a scale of 1 to 5. See Box 4-1 for details on the scoring system. SOURCE: Modified from Cranney et al. (2007). |
||||
Postmenopausal women and elderly men Overall, regarding serum 25OHD and bone density measures, AHRQ-Ottawa, which included some studies that combined calcium and vitamin D, reported discordance between the results from RCTs and the majority of observational studies; the authors attributed this as likely due to the impact of confounders relative to observational data as a general matter. Nineteen studies (see Table 4-7) evaluated the association between serum 25OHD levels and BMD. Of these, six studies were RCTs. One RCT (Ooms et al., 1995b) reported an association between serum 25OHD concentrations and BMD or bone loss, whereas the other five RCTs (Dawson-Hughes et al., 1995; Storm et al., 1998; Schaafsma et al., 2002; Cooper et al., 2003; Aloia et al., 2005) and three cohort studies did not. Four cohort studies found a significant association between 25OHD concentrations and bone loss, which was most evident at the hip sites, but the evidence for an association between 25OHD concentrations and lumbar spine BMD was weak. Six case–control studies suggested an association between 25OHD concentrations and BMD, and the association was most consistent at the femoral neck. A forest plot showing the effect of vitamin D plus calcium supplementation (versus placebo) for femoral neck BMD at 1 year is shown in Figure 4-4. Overall, significant increases at the femoral neck were observed with a combined estimate as reported in Table 4-7 of 1.37 percent (95% confidence interval [CI]: 0.24–2.50) from three trials after 1 year.
Based on the results from the observational studies, there is fair evidence to support an association between serum 25OHD levels and BMD or changes in BMD at the femoral neck. Specific circulating concentrations of 25OHD below which bone loss at the hip was increased ranged from 30 to 80 nmol/L.
AHRQ-Tufts identified two more recent RCTs, one that combined calcium with vitamin D and one that did not. The first, an A-quality RCT (Zhu et al., 2008a), compared the effect of vitamin D2 supplementation on hip BMC in 256 elderly women between 70 and 90 years of age. All elderly women in this trial had normal physical functioning. They were randomly assigned to receive either vitamin D2 (1,000 IU/day) plus calcium (1,200 mg/day) supplement or calcium (1,200 mg/day) supplement alone for 1 year. The mean baseline dietary calcium intake was 1,097 mg/day, and the mean serum 25OHD concentration was 44.3 nmol/L. Total hip BMD increased significantly in both groups, with no difference between the vitamin D2 plus calcium and calcium alone groups (hip BMD change: vitamin D, +0.5 percent; control, +0.2 percent).
The second, a B-quality RCT (Andersen et al., 2008), analyzed 89 healthy adult women and 83 healthy adult men separately. The participants were Pakistani immigrants living in the Copenhagen area of Denmark (latitude 55°N). Women and men were randomly assigned to receive either a daily dose of 400 or 800 IU vitamin D3 or placebo for 1 year. For women,
TABLE 4-7 Serum 25OHD Levels and BMC/BMD in Postmenopausal Women and Older Men: Summary from AHRQ-Ottawa Analysesa
|
Reference; Country; Jadad Score for RCTsb |
Population Description |
Intervention/Duration |
Bone Health Outcomes |
Results |
|
RCTs |
||||
|
Aloia et al., 2005 |
PM women; IG1: 59.9 (6.2) y CG: 61.2 (6.3) y |
IG: 800 IU vit D3 for 2 y, then 2,000 IU for 1 y + 1,200–1,500 mg CaCG: 1,200–1,500 mg Ca |
BMD: LS, total hip, total body, mid radius (DXA) |
No association between serum 25OHD and ∆ BMD |
|
Analyses examining those with low baseline 25OHD or high PTH showed no influence of 25OHD on ∆ BMD |
||||
|
United States |
|
|
||
|
n = 208 |
|
|
||
|
Jadad = 5 |
100% African American |
|
|
|
|
|
|
3 y |
|
|
|
Cooper et al., 2003 |
PM women not on HRT; IG1: 56.5 (4.2) y, CG: 56.1 (4.7) y |
IG1: 10,000 IU vit D2/wk + 1,000 mg Ca/d CG: 1,000 mg Ca/d |
BMD: LS, FN, Ward’s triangle, Tr, proximal forearm (DXA) |
No significant correlation between baseline 25OHD concentration and ∆ BMD at any site or between ∆ 25OHD and ∆ BMD at any site |
|
Australia |
|
|
||
|
|
n = 187 |
|
|
|
|
Jadad = 4 |
|
|
|
|
|
|
|
2 y |
|
|
|
|
Caucasian |
|
|
|
|
Dawson-Hughes et al., 1995 |
Healthy, ambulatory PM women; IG1: 63.0 y CG: 64.0 y |
IG1: 700 IU vit D3 + 500 mg Ca citrate malate CG: 100 IU vit D3 + 500 mg Ca daily |
BMD: LS, FN, and total body (DXA) |
25OHD concentrations during either season did not correlate with ∆ BMD at any site |
|
United States |
|
|
|
|
|
n = 247 |
|
|
|
|
|
|
|
2 y |
|
|
|
Jadad = 3 |
Caucasian |
|
|
|
|
Ooms et al., 1995b |
Elderly women; IG1: 80.1 (5.6) y CG: 80.6 (5.5) y |
IG1: 400 IU vit D3/d CG: placebo |
BMD: FN, Tr, and distal radius (DXA) |
Effect of vitamin D supplementation was independent of baseline 25OHD as well as 25OHD corrected for season |
|
Netherlands |
|
2 y |
|
|
|
|
n = 348 |
|
|
|
|
Jadad = 4 |
|
|
|
|
|
Schaafsma et al., 2002 |
Healthy, PM women 50–70 y |
IG1: eggshell powder + 200 IU vit D3 IG2: Ca carbonate + 200 IU vit D3 CG: placebo |
BMD: LS, hip (DXA) |
No significant correlation between 25OHD and BMD |
|
Netherlands |
n = 85 |
|
|
|
|
Jadad = 4 |
Caucasian |
|
|
|
|
|
|
12 mo |
|
|
|
Storm et al., 1998 |
PM women without OP |
IG1: 4 glasses of fortified milk (325 IU vit D/quart) daily IG2: Ca carbonate daily CG: placebo |
BMD: Tr, FN, LS (DXA) |
Serum 25OHD was not a significant determinant of FN BMD at baseline, during winter (p = 0.23), or over the entire study period |
|
|
n = 60 |
|
|
|
|
Netherlands |
|
|
|
|
|
|
Caucasian |
|
|
|
|
Jadad = 4 |
|
|
|
|
|
|
|
2 y |
|
|
|
Prospective cohort studies |
||||
|
Bischoff-Ferrari et al., 2005 |
Individuals with knee OA; 74.4 (11.1) y |
1–2 y |
BMD: FN (DXA Lunar DPX-L) |
Significant positive association between 25OHD and BMD independent of age, gender, BMI, knee pain, physical activity, and disease severity |
|
|
n = 228 |
|
|
|
|
United States |
|
|
|
Significant trend between being in a higher serum 25OHD group and having higher BMD (p < 0.04) |
|
64% female |
|
|
||
|
Reference; Country; Jadad Score for RCTsb |
Population Description |
Intervention/Duration |
Bone Health Outcomes |
Results |
|
del Puente et al., 2002 |
Active, noninstitutionalized females (menopausal and premenopausal); 58 (9) y |
2 y |
BMD: LS and FN (DXA) |
25OHD independent predictor of BMD change at FN and LS (FN ∆ BMD [β = 0.26 (0.13), p = 0.04] and LS ∆ BMD [β = 0.07 (0.03), p = 0.04]) |
|
Italy |
|
|
|
|
|
|
|
|
In stepwise analysis discrimination models, only FN significant (partial R2 = 0.26, p = 0.04) |
|
|
|
n = 139 |
|
|
|
|
|
Caucasian |
|
|
|
|
Dennison et al., 1999 |
Healthy adults age 60–75 y |
4 y |
BMD: LS and proximal femur (DXA) |
No association between baseline 25OHD and BMD at LS and proximal hip (β = 0.002 spine, 0.001 hip) and no association between 25OHD and bone loss after adjustment for adiposity |
|
UK |
n = 316 |
|
|
|
|
|
45% female |
|
|
|
|
Gerdhem et al., 2005 |
Ambulatory independently living women; 75 (75–75.9) y |
3 y |
BMD: FN and LS (DXA) |
No association between baseline 25OHD and BMD |
|
Sweden |
|
|
|
|
|
|
n = 1,044 |
|
|
|
|
Melin et al., 2001 |
Healthy, independent elderly individuals; 83.7 y |
1 y |
BMD: FN (DXA) |
FN BMD associated with serum 25OHD after summer (r = 0.38, p = 0.003) and winter (r = 0.37, p = 0.003) |
|
Sweden |
n = 64 |
|
|
After adjusting for BMI, 25OHD remained a significant determinant after winter (adjusted R2 = 0.14, p = 0.005) |
|
|
81% female |
|
|
|
|
|
Caucasian |
|
|
|
|
Rosen et al., 1994 |
Healthy independently living elderly women; 77 (2) y |
2 y |
BMD: LS and FN (DXA) |
∆ 25OHD between summer and winter was associated with LS BMD in 2nd y (r = 0.59, p = 0.04), but not FN BMD |
|
United States |
|
|
|
|
|
|
n = 18 |
|
|
|
|
Stone et al., 1998 |
Healthy elderly females > 65 y, |
42–71 mo |
BMD: total hip (DXA), calcaneal (SPA) |
Significant association between lower 25OHD levels and total hip BMD loss |
|
United States |
random sample, subcohort of individuals not on HRT from Study of Osteoporotic Fractures |
|
Lower 25OHD levels associated with increased loss at total hip after adjusting for estradiol, testosterone, SHBG, season, and use of supplements |
|
|
|
|
|
25OHD not associated with calcaneal BMD after adjusting for age and weight |
|
|
|
n = 261 |
|
|
|
|
|
Caucasian |
|
|
|
|
Case–control studies |
||||
|
Al-oanzi et al., 2006 |
Men with idiopathic OP |
NA |
BMD diagnosis of OP based on T-score FN and LS |
No significant difference between plasma 25OHD in cases and controls, but mean free plasma 25OHD was about 33% lower in men with OP vs. controls (p < 0.0001) |
|
|
Cases: 59.6 (13.6) y Controls: 62.4 (10.4) y |
|
||
|
UK |
|
|
||
|
|
n = 56 (+ 114 controls) |
|
|
|
|
|
Caucasian |
|
|
|
|
Reference; Country; Jadad Score for RCTsb |
Population Description |
Intervention/Duration |
Bone Health Outcomes |
Results |
|
Boonen et al., 1999 |
PM women (hip fracture patients and controls) |
NA |
BMD: FN and Tr (DXA) |
Mean 25OHD3 was lower in cases vs. controls (p < 0.001) |
|
|
|
|
|
Vit D deficiency (< 30 nmol/L): 64% of cases vs. 8% controls within the same 4-mo sampling period (no relation between 25OHD and month of sample collection) |
|
Belgium |
n = 100 |
|
Fractures |
|
|
|
Cases: 74.2 (7.8) y Controls: 75.8 (5.6) y |
|
|
|
|
|
|
|
FN and Tr BMD were significantly lower in cases than in controls. No significant relation found between the 25OHD3–PTH axis and BMD in cases and controls. In multiple regression of pooled data, models using 25OHD3 and PTH were highly predictive of FN BMD (R2 = 32%, p < 0.001). |
|
|
Landin-Wilhelmsen et al., 1999 |
PM patients with OP and age-matched controls from outpatient clinic |
NA |
BMD and BMC: LS, total body, and FN (DXA) |
25OHD significantly lower in OP patients vs. controls (p < 0.05) |
|
|
|
|
OP patients had lower body weight and BMI vs. controls (p < 0.001) |
|
|
Sweden |
n = 128 (+ 227 age-matched controls) |
|
Fractures |
|
|
|
|
|
|
|
|
|
Cases: 59 (6) y Controls: 59 (5) y |
|
|
|
|
Villareal et al., 1991 |
Ambulatory, independently living PM women, women with low (< 38 nmol/L) 25OHD and controls |
NA |
BMD: (LS, T12-L3), QCT |
Women with low 25OHD levels had a reduced LS BMD. In the low 25OHD group, LS BMD correlated with 25OHD (r = 0.41, p < 0.01). |
|
United States (Midwest) |
|
|
|
|
|
|
|
|
In multivariate analysis, iPTH was the major determinant of a decrease in LS BMD |
|
|
|
n = 98 |
|
|
|
|
|
Cases: 64 y Controls: 63 y |
|
|
|
|
|
Caucasian |
|
|
|
|
Thiebaud et al., 1997 |
Hip fracture patients, hospital controls, and community controls |
NA |
BMD: FN, total hip, and Tr (DXA) |
Women and men with hip fractures significantly lower 25OHD levels vs. controls |
|
Switzerland |
|
|
|
Fracture patients had lower hip BMD vs. controls (p < 0.001) |
|
|
n = 179 (+ 180 controls) |
|
Fractures |
|
|
|
|
|
|
Significant biochemical markers in the multivariate logistic regression model of the risk for hip fracture were serum albumin and PTH |
|
|
Cases: 81.0 y (women) and 77.7 y (men); hospital controls: 80.9 y (women) and 76.9 y (men); community controls: 71.7 y (women) and 71.3 y (men) |
|
|
|
|
|
|
|
In women FN, Tr BMD weakly correlated with 25OHD, and the only significant association was at the Tr (r = 0.13, p < 0.05) |
|
Reference; Country; Jadad Score for RCTsb |
Population Description |
Intervention/Duration |
Bone Health Outcomes |
Results |
|
Yan et al., 2003 |
Older individuals (60–83 y) |
NA |
BMC: FN(DXA) |
Significantly higher 25OHD levels in British subjects |
|
|
|
|
|
Weak association (r = 0.054, p = 0.05) between 25OHD and FN BMC in British subjects after adjusting for size, but not in Chinese subjects |
|
China 42°N and UK 52°N |
n = 352 |
|
|
|
|
Chinese: 50% female British: 50% female |
|
|
|
|
|
|
64% Chinese (Asian), 36% British (Caucasian) |
|
|
|
|
NOTE: BMC = bone mineral content; BMD = bone mineral density; BMI = body mass index; CG = control group; DXA = dual-energy X-ray absorptiometry; FN = femoral neck; HRT = hormone replacement therapy; IG = intervention group; iPTH = intact parathyroid hormone; IU = International Units; LS = lumbar spine; mo = month(s); NA = not applicable; OA = osteoarthritis; OP = osteoporosis; PM = postmenopausal; PTH = parathyroid hormone; QCT = quantitative computed tomorgraphy ; RCT = randomized controlled trial; SHBG = sex hormone binding globulin; SPA = single-photon absorptiometry; Tr = trochanter; UK = United Kingdom; vit = vitamin; wk = week(s); y = year(s). aThis table has been truncated for the purposes of this chapter, but it can be found in its entirety in Appendix C. bJadad score is based on a scale of 1 to 5. See Box 4-1 for details on the scoring system. SOURCE: Modified from Cranney et al. (2007). |
||||
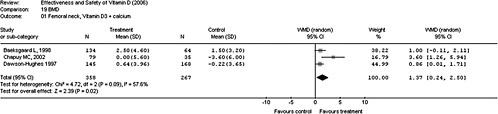
the mean baseline dietary calcium intake was 495 mg/day, and the mean serum 25OHD concentration was 12 nmol/L. For men, the mean baseline dietary calcium intake was 548 mg/day, and the mean serum 25OHD concentration was 21 nmol/L. At the end of the study, in both women and men, there were no significant differences in lumbar spine BMD changes between the groups receiving the two doses of vitamin D3 (400 or 800 IU/day) and the placebo group.
Pregnant or lactating women Overall, from AHRQ-Ottawa, there was insufficient evidence on the association between 25OHD concentration and change in bone density during pregnancy. Four studies (no RCTs, three cohort studies, one before-and-after study) assessed vitamin D nutriture at various time points in pregnancy, with vitamin D deficiency being observed in 0 to 50 percent of subjects, but only one cohort study (n = 115) rated
|
BOX 4-3 AHRQ Findings by Life Stage for Serum 25OHD Measures and BMC/BMD* 0–6 months: Inconsistent evidence for an association between a specific serum 25OHD concentration and the bone health outcome BMC in infants. 7 months–2 years: Fair evidence of an association between 25OHD concentrations and baseline BMD and change in BMD or BMC indexes from the studies in older children and adolescents. 3–8 years: Fair evidence of an association between 25OHD concentrations and baseline BMD and change in BMD or BMC indexes from the studies in older children and adolescents. 9–18 years: Fair evidence of an association between 25OHD concentrations and baseline BMD and change in BMD or BMC indexes from the studies in older children and adolescents. Two new RCTs identified by AHRQ-Tufts enrolled only girls in this life stage. The results showed no significant differences in whole-body BMC changes between groups receiving either lower doses of vitamin D (200 or 400 IU/day) or higher doses of vitamin D (800 or 2,000 IU/day) and the placebo group. 19–50 years: Discordance between the results from RCTs and the majority of observational studies in postmenopausal women and elderly men. Based on results of the observational studies, there is fair evidence to support an association between serum 25OHD concentration and BMD or changes in BMD at the femoral neck. One new RCT identified by AHRQ-Tufts enrolled primarily men and women in this life stage. The |
as good quality included maternal BMD as an outcome, and there was no relationship between vitamin D status and postpartum changes in BMD. Information on the four studies can be found in Appendix C. AHRQ-Tufts found no new RCTs.
Summary Evidence regarding serum 25OHD concentrations and BMC/BMD measures varied by life stage. The findings from the AHRQ analyses are summarized by DRI-relevant life stage group in Box 4-3 below.
Bone mineral content/bone mineral density: Vitamin D supplementation with or without calcium AHRQ addressed data primarily for menopausal women. One RCT for girls was also identified. Overall, AHRQ-Ottawa concluded that there is good evidence that vitamin D3 plus calcium supplementation resulted in small increases in BMD of the spine, total body,
|
results showed that there were no significant differences in lumbar spine BMD changes between the groups receiving two doses of vitamin D3 (400 or 800 IU/day) and the placebo group. 51–70 years: Discordance between the results from RCTs and the majority of observational studies in postmenopausal women and elderly men. Based on results of the observational studies, there is fair evidence to support an association between serum 25OHD concentration and BMD or changes in BMD at the femoral neck. One new RCT identified by AHRQ-Tufts enrolled some men in this life stage. The results showed that there were no significant differences in lumbar spine BMD changes between the groups receiving two doses of vitamin D3 (400 or 800 IU/day) and the placebo group. ≥71 years: Discordance between the results from RCTs and the majority of observational studies in postmenopausal women and elderly men. Based on results of the observational studies, there is fair evidence to support an association between serum 25OHD and BMD or changes in BMD at the femoral neck. One new RCT identified by AHRQ-Tufts enrolled only elderly women in this life stage. The results showed that vitamin D2 supplementation (1,000 IU/day) had no additional effect on hip BMD compared with calcium supplementation alone. Pregnant or lactating women: Insufficient evidence for an association between a specific serum 25OHD concentration and the bone health outcome BMC. SOURCE: Modified from Chung et al. (2009). |
femoral neck and total hip. Based on included trials, it was less certain whether vitamin D3 supplementation alone has a significant effect on BMD.
Seventeen RCTs evaluated the effect of supplemental vitamin D2 or vitamin D3 on BMD, predominantly in populations of late menopausal women (see Table 4-8). Only one small RCT included premenopausal women, and two trials included older men (> 60 years). Most trials were 2 to 3 years in duration and used vitamin D doses of up to 800 IU daily. Most trials used vitamin D3 and also included 500 mg of calcium as a co-intervention.
Meta-analysis results of 17 RCTs comparing vitamin D3 plus calcium with placebo (AHRQ-Tufts) were consistent with a small effect on lumbar spine, femoral neck, and total body BMD. The WHI trial found a significant benefit of supplementation with 400 IU of vitamin D3 plus 1,000 mg of calcium on total hip BMD. However, when the effect of supplementation with vitamin D3 plus calcium versus supplementation with calcium alone was assessed by AHRQ-Tufts, no significant increase in BMD was observed with either intervention, suggesting that vitamin D3 may be of less benefit in calcium-replete postmenopausal women. It is noted, however, that the dose administered was 400 IU/day, which is a lower level than has been used commonly, although the authors of the report did measure background intakes of vitamin D for participants, which, when added to the 400 IU dose results in an average intake of approximately 750 IU/day. Vitamin D3 alone versus placebo did not result in a significant increase in BMD in postmenopausal women, except in one trial that noted an increase in femoral neck BMD. Only a few trials reported the impact of baseline serum 25OHD concentrations on BMD; in all of these trials, baseline 25OHD concentration was not associated with increased BMD.
AHRQ-Tufts identified four RCTs that were made available after the completion of AHRQ-Ottawa, one of which focused on children (see Table 4-9). Two of the three new RCTs for women and elderly men indicated a significant increase in hip or total BMD in postmenopausal women, comparing vitamin D3 or vitamin D2 (300 or 1,000 IU/day, respectively) plus calcium (1,200 mg/day) with placebo. The RCT that focused on healthy girls, ages 10 to 12 years (Cheng et al., 2005) compared the effect of vitamin D3 (200 IU/day) plus calcium (1,000 mg/day) supplementation on bone indexes with placebo. The mean background dietary calcium intake was 670 mg/day. The intention-to-treat analyses suggested that after 2 years of supplementation, there was no significant difference in the BMC changes between girls who received vitamin D plus calcium supplement or placebo. The methodological quality of this study was rated C, as a result of being underpowered and having low compliance rate. The findings from AHRQ are summarized by DRI-relevant life stage groups in Box 4-4.
TABLE 4-8 Effect of Vitamin D3 or Vitamin D2 on BMD by Site in Individual Trials (for Women of Reproductive Age, Postmenopausal Women, and Older Men): Summary from AHRQ-Ottawa Analysesa
|
Reference |
Duration; Sample Size (n/Total N) |
Vitamin D Dose (IU/day); |
Lumbar Spine BMD % change (SD) |
Femoral Neck BMD % change (SD) |
Total Body BMD % change (SD) |
|||
|
Mean Dietary Vitamin D Intake |
Tx |
Control (e.g., placebo, calcium, or lower dose of vit D) |
Tx |
Control |
Tx |
Control |
||
|
(Tx/Control) |
||||||||
|
Aloia et al., 2005 |
3 years |
800 D3 for 2 y, then 2,000 D3 for 1 y + calcium |
0.25 (1.82) |
0.30 (1.82) |
NR |
NR |
−0.35 (1.60) |
−0.30 (1.50) |
|
|
208 |
|
|
|
|
|
|
|
|
|
|
184 IU/d |
|
|
|
|
|
|
|
Baeksgaard et al., 1998 |
2 years |
560 D3 + 1,000 mg calcium |
1.6 |
−0.2 |
1 |
0.4 |
NR |
NR |
|
|
240 |
|
|
|
|
|
|
|
|
|
|
158/140 IU/d |
|
|
|
|
|
|
|
Chapuy et al., 1992 |
1.5 years |
800 D3 + 1,200 mg calcium |
NR |
NR |
2.90 (6.40) |
1.80 (9.40) |
NR |
NR |
|
|
56 (56/3270) |
|
|
|
|
|
|
|
|
|
NR |
|
|
|
|
|
|
|
|
Chapuy et al., 2002 |
2 years |
800 D3 + 1,200 mg calcium |
NR |
NR |
−1.20 (7.40) |
−4.50 (7.10) |
NR |
NR |
|
|
114 (114/583) |
|
|
|
|
|
|
|
|
|
40/42 IU/d |
|
|
|
|
|
|
|
|
Cooper et al., 2003 |
2 years |
10,000 D2/wk + 1,000 mg calcium |
|
|
|
|
|
|
|
|
276 (187/187) |
|
0.21 (4.89) |
1.66 (5.27) |
0.87 (4.95) |
3.32 (5.10) |
NR |
NR |
|
|
NR |
|
|
|
|
|
|
|
|
Reference |
Duration; Sample Size (n/Total N) |
Vitamin D Dose (IU/day); |
Lumbar Spine BMD % change (SD) |
Femoral Neck BMD % change (SD) |
Total Body BMD % change (SD) |
|||
|
Mean Dietary Vitamin D Intake |
Tx |
Control (e.g., placebo, calcium, or lower dose of vit D) |
Tx |
Control |
Tx |
Control |
||
|
(Tx/Control) |
||||||||
|
Dawson-Hughes et al., 1991 |
1 year |
400 D3 + 377 mg calcium |
0.85 (2.41) |
0.15 (2.62) |
NR |
NR |
0.03 (1.35) |
−0.08 (1.25) |
|
261 (220–246/276) |
|
|
|
|
|
|
|
|
|
|
During treatment, 106/87 IU/d, August–November |
|
|
|
|
|
|
|
|
Dawson-Hughes et al., 1995 |
2 years |
700 D3 + 500 mg calcium |
−0.31 (2.87) |
−0.11 (3.15 |
−1.0 (3.76) |
−2.54 (4.07) |
−0.20 (1.66) |
−0.35 (1.56) |
|
215 (215–246/261) |
|
|
|
|
|
|
|
|
|
|
120/107 IU/d |
|
|
|
|
|
|
|
|
Dawson-Hughes et al., 1997b |
3 years |
700 D3 + 500 mg calcium |
2.12 (4.06) |
1.22 (4.25) |
0.50 (4.80) |
−0.70 (5.03) |
0.06 (1.83) |
−1.09 (1.71) |
|
389 |
|
|
|
|
|
|
|
|
|
|
|
Women: 174/184 IU/d |
|
|
|
|
|
|
|
|
|
Men: 202/197 IU/d |
|
|
|
|
|
|
|
Grados et al., 2003a |
1 year |
800 D3 + 1,000 mg calcium |
2.98* |
−0.21* |
1.19* |
−0.83* |
0.99* |
0.11* |
|
|
192 (67–72/192) |
|
|
|
|
|
|
|
|
Companions: Grados et al., 2003b; Brazier et al., 2005 |
84.9/83.9 IU/d |
|
|
|
|
|
|
|
|
Harwood et al., 2004 |
1 year |
800 D3 + 1,000 mg calcium |
−1.6 |
8.2 |
−1.9 |
−0.9 |
NR |
NR |
|
|
150 (40/150) |
|
|
|
|
|
|
|
|
|
300,000 D2 single injection |
|
|
|
|
|
|
|
|
|
|
300,000 D2 single injection + 1,000 mg calcium |
|
|
|
|
|
|
|
|
|
NR |
|
|
|
|
|
|
|
Hunter et al., 2000 |
2 years |
800 D3 |
0.00 (5.62) |
0.00 (5.56) |
— |
— |
— |
— |
|
|
128 |
135/134 IU/d |
|
|
|
|
|
|
|
|
Comparison of 64 pairs of twins |
|
|
|
|
|
|
|
|
Jackson et al., 2006 |
7 years |
400 D3 + 1,000 mg calcium |
Graph |
Graph |
Graph |
Graph |
Graph |
Graph |
|
|
2,431 of total sample |
|
|
|
|
|
|
|
|
|
Total vit D intake diet and supplements: 365/368 IU |
|
|
|
|
|
|
|
|
Jensen et al., 2002 |
3 years |
400 D3 + 1,450 mg calcium |
1.20 (4.32) |
0.73 (4.08) |
NR |
NR |
−1.10 (1.78) |
−1.78 (1.56) |
|
|
68/83 |
|
|
|
|
|
|
|
|
|
|
NR |
|
|
|
|
|
|
|
Komulainen et al., 1998 |
5 years |
300 D3 + 500 mg calcium |
−4.6 (5.08) |
−4.5 (4.90) |
−4.3 (5.03) |
−4.3 (4.9) |
NR |
NR |
|
|
206/425 |
|
|
|
|
|
|
|
|
|
|
NR |
|
|
|
|
|
|
|
Reference |
Duration; Sample Size (n/Total N) |
Vitamin D Dose (IU/day); |
Lumbar Spine BMD % change (SD) |
Femoral Neck BMD % change (SD) |
Total Body BMD % change (SD) |
|||
|
Mean Dietary Vitamin D Intake |
Tx |
Control (e.g., placebo, calcium, or lower dose of vit D) |
Tx |
Control |
Tx |
Control |
||
|
(Tx/Control) |
||||||||
|
Meier et al., 2004 |
2 years |
500 D3 + 500 mg calcium |
0.8 |
NR |
0.1 |
NR |
NR |
NR |
|
|
55 (43/55) |
|
|
|
|
|
|
|
|
|
NR |
|
|
|
|
|
|
|
|
Ooms et al., 1995b |
2 years |
400 D3 |
NR |
NR |
1.47 (6.13) |
−0.21 (6.12) |
NR |
NR |
|
|
348 |
NR |
|
|
left femoral neck |
|
|
|
|
Patel et al., 2001 |
2 years |
800 D3 |
NA crossover trial |
|
|
|
|
|
|
|
70 |
NR |
|
|
|
|
|
|
|
NOTE: * Median % change; Dawson-Hughes et al. (1997b) included 176/389 men (45% of participants) and Meier et al. (2004) included 19/55 men (35% of participants). All other studies included women only. BMD = bone mineral density; IU = International Units; NA = not applicable; NR = not reported; SD = standard deviation; Tx = treatment; vit = vitamin; wk = week(s). aThis table has been truncated for the purposes of this chapter, but it can be found in its entirety in Appendix C. SOURCE: Modified from Cranney et al. (2007). |
||||||||
TABLE 4-9 Combined Vitamin D and Calcium and Bone Mineral Density/Bone Mineral Content: Characteristics of RCTs Published after AHRQ-Ottawa Report: Summary from AHRQ-Tufts Analysesa
|
Reference; Location (Latitude) |
Population Description |
Background Calcium Intake and Vitamin D Data |
Comparisons |
Compliance |
Comments |
|
Cheng et al., 2005 |
Health status: Healthy Mean age (range), y: 11.2 (10–12) Male (%): 0 |
Diet vit D: 100 IU/d |
200 IU vit D3/d + 1,000 mg Ca carbonate/d vs. placebo |
65% completed intervention with > 50% compliance |
|
|
|
Ca: 670 mg/d |
|
|||
|
Jyvaskyla, Finland (62°24′N) |
|
||||
|
Bolton-Smith et al., 2007 |
Health status: Healthy (assumed postmenopausal) Mean age (range), y: 68 (≥ 60) Male (%): 0 |
25OHD: 59.4 nmol/L |
400 IU vit D3/d + 100 mg elemental Ca/d vs. placebo |
Good supplement adherence based on pill count (median, 99; IQE 97.3–99.8%) |
Noncompliant women were excluded |
|
|
Ca: 1,548 mg/d |
||||
|
UK (54°N) |
|||||
|
Zhu et al., 2008b |
Health status: nd (assumed postmenopausal) Mean age (SD), y: 74.8 (2.6) Male (%): 0 |
25OHD: 68 nmol/L |
1,000 IU vit D2/d + 1,200 mg Ca citrate/d vs. placebo |
No differences in adherence among groups (81–89% by tablet counting) |
|
|
Western Australia |
Ca: 1,010 mg/d |
|
|||
|
Moschonis and Manios, 2006 |
Health status: Postmenopausal |
Diet vit D: 23.6 IU/d |
300 IU vit D3/d + 1,200 mg Ca/d (from low-fat dairy products) vs. control (usual diet) |
Dairy group 93% (assessed via information obtained at the biweekly sessions) |
Control group had no intervention (or usual diet), so compliance issue not applicable |
|
Mean age (range), y: 61 (55–65) Male (%): 0 |
Ca 680.0 mg/d |
||||
|
Greece (31°N) |
|
||||
|
NOTE: IU = International Units; nd = not determined; SD = standard deviation; UK = United Kingdom; vit = vitamin; y = year(s). aThis table has been truncated for the purposes of this chapter, but it can be found in its entirety in Appendix D. SOURCE: Chung et al. (2009). |
|||||
|
BOX 4-4 AHRQ Findings by Life Stage for Vitamin D and Calcium and BMC/BMD* 0–6 months: No data 7 months–2 years: No data 3–8 years: No data 9–18 years: One RCT showed that, compared with placebo, there was no significant effect of vitamin D3 (200 IU/day) plus calcium (1,000 mg/day) on BMC changes in healthy girls between 10 and 12 years of age. 19–50 years: No data 51–70 years: No new data were identified in AHRQ-Tufts ≥ 71 years: No new data were identified in AHRQ-Tufts Postmenopause: Findings from the AHRQ-Ottawa report showed that vitamin D3 (≤ 800 IU/day) plus calcium (~500 mg/day) supplementation resulted in small increases in BMD of the spine, total body, femoral neck, and total hip in predominantly populations of late-menopausal women. Two of the three new RCTs showed a significant increase in hip or total BMD in postmenopausal women, comparing vitamin D3 or vitamin D2 (300 or 1,000 IU/day, respectively) plus calcium (1,200 mg/day) with placebo. Pregnant and lactating women: No new data were identified in AHRQ-Tufts SOURCE: Modified from Chung et al. (2009). |
Fractures and BMD in postmenopausal women and older men: Serum 25OHD The association between risk of fractures and vitamin D in combination with calcium, as well as vitamin D alone, was addressed by AHRQ. Neither analysis focused on fracture risk and calcium intake alone.
AHRQ-Ottawa, which included some studies that combined calcium and vitamin D, identified observational studies (ranging from poor to fair quality) that reported on the association between serum 25OHD concentrations and fractures. The studies are identified in Table 4-10. The analysis concludes that there is inconsistent evidence to support an association between serum 25OHD concentration and an increased risk of fracture. Five studies of good quality evaluated the association between serum 25OHD concentration and risk of falls (see discussion in section above on Falls and
TABLE 4-10 Serum 25OHD Levels and Fractures in Postmenopausal Women and Older Men: Summary from AHRQ-Ottawa Analysesa
|
Reference; Country |
Population Description |
Duration (or Matching Variables) |
Bone Health Outcomes |
Covariates; Summary of Results |
|
Prospective cohort studies |
||||
|
Cummings et al., 1998 |
Subset of a cohort of ambulatory community-dwelling women ≥ 65 years of age (nested case–control study); 72.6 y (subset) |
5.9 y |
Hip fractures |
Adjusted for age, weight, and calcaneal BMD (SPA) |
|
|
|
|
There were no statistically significant unadjusted or adjusted (age, weight, season, use of vit D supplements) associations between serum 25OHD or PTH and the risk of hip or vertebral fracture |
|
|
United States |
|
Vertebral fractures |
||
|
|
|
BMD calcaneus (SPA) |
For women in the lowest quintile of serum 25OHD levels, there was no increased risk for hip or vertebral fracture |
|
|
|
n = 9,704 |
|
|
|
|
|
|
|
|
Women in the lowest quintile of serum 1,25(OH)2D had a significant increase in hip fracture risk (RR 2.1, 95% CI 1.2–3.5), but not vertebral fracture risk |
|
|
Caucasian |
|
|
|
|
Gerdhem et al., 2005 |
Ambulatory independently living women, 75 y (range 75–75.9 y) |
3 y |
Fractures (low energy) |
119/986 (12%) had a total of 159 low-energy fractures (29 hip, 28 wrist, 12 proximal humerus, 43 vertebral, and 47 other) |
|
Sweden |
|
|
|
9/43 (21%) with 25OHD < 50 nmol/L had one or more fractures vs. 110/943 (12%) with 25OHD > 50 nmol/L: HR 2.04 (95% CI 1.04–4.04) |
|
|
n = 1,044 |
|
|
|
|
|
|
|
|
Fracture association was independent of season, although a seasonal difference was noted in mean level of 25OHD (September 101 nmol/L vs. February 89.8 nmol/L) |
|
Reference; Country |
Population Description |
Duration (or Matching Variables) |
Bone Health Outcomes |
Covariates; Summary of Results |
|
Woo et al., 1990 |
Elderly ≥ 60 y living independently in sheltered housing |
30 mo |
Fractures |
Adjusted for age, gender, drinking, smoking, and BMI |
|
|
|
|
Subjects with lower serum 25OHD (males < 79 nmol/L and females < 66 nmol/L) had a nonsignificant increase in adjusted RR for fracture |
|
|
Hong Kong |
|
|
|
|
|
|
n = 470 |
|
|
|
|
|
60% females |
|
|
|
|
|
Asian (Chinese) |
|
|
|
|
Case–control studies |
||||
|
Bakhtiyarova et al., 2006 |
Hip fracture cases (spontaneous or low trauma) and controls admitted to ophthalmology department |
NR |
Hip fractures |
Median serum 25OHD levels significantly lower in hip fracture cases vs. controls (graph only) |
|
Russian Federation |
|
|
Hip fracture patients more likely to have serum 25OHD < 25 nmol/L than controls (65% vs. 47%, p = 0.006) |
|
|
|
Cases: 68.8 (9.5) y Controls: 70.2 (8.3) y |
|
|
|
|
|
n = 64 (+ 97 controls) |
|
|
|
|
|
Cases: 69% female Controls: 55% female |
|
|
|
|
|
Caucasian |
|
|
|
|
Boonen et al., 1997 |
Elderly women with hip fractures and community-dwelling controls |
Age, PM status, gender, ethnicity |
Hip fractures |
Serum 25OHD significantly lower in cases vs. controls (p = 0.001) |
|
|
|
Hip BMD (FN and Tr) significantly lower in cases vs. controls (p < 0.001) |
||
|
Belgium |
|
BMD (FN and Tr) (DXA) |
|
|
|
|
n = 117 (+ 117 controls) |
|
|
|
|
|
Caucasian |
|
|
|
|
Boonen et al., 1999 |
PM women (osteoporotic hip fracture patients and independently living controls) |
Age, gender, PM status, sampled at the same time of year |
Fractures |
Adjusted for age |
|
|
BMD (FN and Tr) (DXA) |
Mean 25OHD3 was significantly lower in cases vs. controls |
||
|
Belgium |
25OHD < 30 nmol/L: 64% of cases vs. 8% controls within the same 4-mo sampling period (no relation between 25OHD and month of sample collection) |
|||
|
|
Cases: 79.2 y Controls: 77.7 y |
|
|
|
|
|
|
|
|
FN and Tr BMD were significantly lower in cases than in controls |
|
|
n = 50 (+ 50 controls) |
|
|
|
|
Cooper et al., 1989 |
Hip fractures and healthy controls |
Age (cases and one of the two control groups similar), gender |
Hip fractures |
Age and albumin |
|
|
|
|
Mean 25OHD was significantly lower in cases vs. controls (p < 0.01). When age and albumin were used as covariates in the analysis, there was no residual difference in serum 25OHD levels. |
|
|
UK |
Cases: 77.4 (8.6) y Controls: 73.3 (10.5) (inpatients) and 66.9 (11.8) y (outpatients) |
|
||
|
|
|
More hip fracture cases (49%) had 25OHD levels < 25 nmol/L vs. 15% of inpatient and 10% of outpatient controls |
||
|
|
n = 41 (+ 40 controls) |
|
|
|
|
Reference; Country |
Population Description |
Duration (or Matching Variables) |
Bone Health Outcomes |
Covariates; Summary of Results |
|
Diamond et al., 1998 |
Men with hip fracture and healthy controls |
Age, gender |
Hip fractures |
Age, body weight, comorbidity score, smoking history, alcohol intake, serum calcium, albumin, 25OHD, and free testosterone |
|
Australia |
Cases: 79.6 y Controls: 78.7 y and 77 y |
|
|
Men with hip fractures had significantly lower 25OHD levels vs. controls (p = 0.007) |
|
|
n = 41 (+ 82 controls) |
|
|
25OHD < 50 nmol/L: 63% of fracture patients vs. 25% of combined controls, OR 3.9 (95% CI 1.74–8.78) |
|
|
|
|
|
Multiple regression analysis showed that serum 25OHD level < 50 nmol/L was strongest predictor of hip fracture (r = 0.34 [0.19], p = 0.013) |
|
|
|
|
|
Age was the best determinant of a serum 25OHD level < 50 nmol/L, p = 0.028 |
|
Erem et al., 2002 |
Women with hip fractures and healthy PM women, all independent community-dwellers |
Age, gender, PM status |
Hip fractures |
NR |
|
|
|
|
Nonsignificant difference in 25OHD levels in hip fracture patients vs. controls |
|
|
Turkey |
|
|
||
|
|
Cases: 76.7 (6.5) y Controls: 75.4 (6.3) y |
|
|
25OHD levels in all groups < 37.5 nmol/L |
|
|
n = 21 (+ 20 controls) |
|
|
|
|
|
Far Eastern |
|
|
|
|
Landin-Wilhelmsen et al., 1999 |
PM women with OP, controls from outpatient clinic |
Age, gender, PM status |
Fractures |
NR |
|
|
BMD and BMC: LS, TB, and FN (DXA) |
25OHD significantly lower in osteoporotic women vs. controls (p < 0.05); PTH significantly higher in osteoporotic women vs. controls (p < 0.001) |
||
|
Sweden |
Osteoporotic women: 59 (6) y Controls: 59 (5) y |
|
||
|
|
|
Fracture history in 56% of osteoporotic women vs. 4% of controls (p < 0.001) |
||
|
|
n = 128 (+ 227 controls) |
|
|
|
|
|
|
|
|
Osteoporotic women had lower body weight and BMI vs. controls (p < 0.001) |
|
Lau et al., 1989 |
Hip fracture patients in hospital and community-living controls |
Ethnicity |
Hip fractures |
NR |
|
|
|
|
25OHD levels were significantly lower in cases vs. controls (p < 0.01) |
|
|
Hong Kong |
|
|
|
|
|
|
|
|
|
Hip fracture patients with low 25OHD (male < 36.5 nmol/L, female < 34.3 nmol/L, defined by lower limit of 95% CI for controls) were less mobile than those with normal 25OHD; 33% with low 25OHD could walk outdoors without an aid vs. 61% of those with a normal 25OHD level |
|
|
Age range: 49–93 y (cases), 60–90 y (controls) |
|
|
|
|
|
n = 200 (+ 427 controls) |
|
|
|
|
|
Asian |
|
|
|
|
LeBoff et al., 1999 |
Community-dwelling women [30 with hip fracture and OP (group 1); 68 women admitted for elective joint replacement with (17) or without (51) OP (group 2)] |
Gender, PM status, setting, surgical procedure |
Hip fractures |
Adjusted for age and estrogen replacement therapy |
|
|
|
Women with hip fracture and OP had significantly lower 25OHD vs. women with OP admitted for surgery (p = 0.01) and vs. women without OP admitted for surgery (p = 0.02) |
||
|
United States |
BMD: LS, FN, Tr, TB (DXA) |
|
||
|
|
|
% of women with 25OHD < 30 nmol/L: Significantly more in group 1 (50%) vs. OP or non-OP group 2 (graph only ~ 5% for OP and 10% for non-OP) (p < 0.002) |
||
|
|
OP in group 1 and subset of group 2 |
|
||
|
|
Group 1: 77.9 y Group 2: OP 69.9 y; non-OP 64.4 y |
|
|
Mean BMD (LS, FN, Tr) was significantly less in women with acute hip fracture/OP vs. elective surgery non-OP controls |
|
|
n = 98 |
|
|
|
|
Reference; Country |
Population Description |
Duration (or Matching Variables) |
Bone Health Outcomes |
Covariates; Summary of Results |
|
Lips et al., 1983, 1987 |
Consecutive patients with FN fracture and 74 healthy community controls |
Age |
Hip fractures |
Adjusted for age and sex |
|
|
|
|
Serum 25OHD levels lower in cases vs. controls (p < 0.001) |
|
|
Netherlands |
|
|
|
|
|
|
Cases: 75.9 (11) y Controls: 75.6 (4.2) |
|
|
|
|
|
n = 125 (+ 74 controls) |
|
|
|
|
|
Cases: 67% female Controls: 73% female |
|
|
|
|
Lund et al., 1975 |
67 consecutive cases of proximal femur fractures |
Age |
Proximal femur fractures |
There was no statistically significant difference in serum 25OHD levels vs. either controls |
|
Denmark |
Controls: middle-aged (30–59 y, n = 27) and elderly healthy individuals (60–95 y, n = 67) at same time of year |
|
|
|
|
Punnonen et al., 1986 |
Cases of hip fracture and controls (from gynecological clinic) |
Age, gender, setting |
Hip fractures (FN) |
NR |
|
|
|
|
25OHD levels were significantly lower in cases vs. controls (p < 0.01) |
|
|
Finland |
|
|
|
|
|
|
Cases: 77.1 (8.6) y Controls: 73.8 (8.4) y |
|
|
|
|
|
n = 40 (+ 25 controls) |
|
|
|
|
Thiebaud et al., 1997 |
179 hip fracture patients; 180 hospital controls; 55 community controls |
Age, setting (for cases and one control group) |
Fractures |
Adjusted for age, sex, and creatinine |
|
|
BMD: FN, TH, Tr (DXA) |
Women and men with hip fractures had significantly lower 25OHD levels vs. controls. Fracture patients had lower hip (TH, FN) BMD vs. either control group (p < 0.001). |
||
|
Switzerland |
|
|
||
|
|
Cases: women 81.0 y; men 77.7 y Hospital controls: women 80.9 y, men 76.9 y Community controls: women 71.7 y, men 71.3 y |
|
||
|
|
|
|
In multivariate logistic regression of the risk for hip fracture, serum albumin and PTH were significant. In women, BMD was weakly correlated with 25OHD, and the only significant association was at the Tr ( r = 0.13, p < 0.05). |
|
|
|
Cases: 76% female Hospital controls: 75% female Community controls: 85% female |
|
|
|
|
NOTE: Total 25OHD or either isoform of 25OHD (isoform not specified); BMC = bone mineral content; BMD = bone mineral density; BMI = body mass index; CI = confidence interval; DXA = dual-energy X-ray absorptiometry; FN = femoral neck; HR = hazard ratio; mo = month(s); LS = lumbar spine; NR = not reported; OP = osteoporosis; OR = odds ratio; PM = postmenopausal; PTH = parathyroid hormone; RR = relative risk; SPA = single-photon absorptiometry; TB = total body; TH = total hip; Tr = trochanter; vit = vitamin; y = year(s). aThis table has been truncated for the purposes of this chapter, but it can be found in its entirety in Appendix C. SOURCE: Modified from Cranney et al. (2007). |
||||
Physical Performance). Nineteen studies assessed the association between serum 25OHD concentrations and BMD, and there is fair evidence from observational studies for an association between serum 25OHD concentrations and changes in hip BMD sites. Some studies identified specific serum concentrations of 25OHD below which falls, fractures, or bone loss increased; these values ranged from approximately 40 to 80 nmol/L.
The findings from AHRQ are summarized by DRI-relevant life stage groups in Box 4-5.
Fractures in postmenopausal women and older men: Vitamin D supplementation with or without calcium3 Overall, AHRQ-Ottawa concluded that supplementation with vitamin D (most studies used vitamin D3) plus calcium is effective in reducing fractures in institutionalized older populations. AHRQ-Tufts did not identify new RCTs examining the combined effect of vitamin D plus calcium supplementation on fractures in postmenopausal women and older men.
As reported by AHRQ-Ottawa, 15 RCTs evaluated the effect of vitamin D2 or vitamin D3 (with or without calcium supplementation) on fractures in postmenopausal women and older men (Table 4-11). The majority of the trials used vitamin D3 preparations (300 to 800 IU/day). Ten trials were of higher quality, although high losses to follow-up and inadequate reporting of allocation concealment were limitations of a number of trials. Vertebral fractures were not included as an outcome in most trials. Vitamin D3 (700 to 800 IU/day) combined with calcium supplements (500 to 1,200 mg/day) significantly reduced non-vertebral and hip fractures although the benefit was predominantly in older subjects living in institutionalized settings (hip fractures: odds ratio [OR] = 0.69; 95% CI 0.53–0.90). The benefit of vitamin D and calcium on fractures in community-dwelling individuals was inconsistent across trials.
Specifically, AHRQ-Ottawa conducted a meta-analysis of 13 of the RCTs (omitting Anderson et al. [2004], which is an abstract only, and Larsen et al. [2004], which included no placebo control). Included in the 13 RCTs was the report from Jackson et al. (2006), which reflected data from the WHI trials based on 36,282 subjects. Reproduced in Figures 4-5 through 4-7 are the relevant forest plots for the outcomes related to total fractures from studies that used either oral vitamin D3 or vitamin D2 plus or minus calcium versus calcium or placebo, total fractures for studies that used vitamin D3 plus calcium versus placebo, and hip fractures (by setting)
|
BOX 4-5 AHRQ Findings by Life Stage for 25OHD and Fractures* 0–6 months: Not reviewed 7 months–2 years: Not reviewed 3–8 years: Not reviewed 9–18 years: Not reviewed 19–50 years: No data 51–70 years: The AHRQ-Ottawa report concluded that the associations between serum 25OHD concentrations and risk of fractures are inconsistent. No new data were identified in the AHRQ-Tufts report. ≥ 71 years: Findings from three new RCTs did not show significant effects of either vitamin D2 or vitamin D3 supplementation (daily doses ranged from 400 to 822 IU) in reducing the risk of total fractures among men and women in this life stage. Postmenopause: The AHRQ-Ottawa report concluded that the associations between serum 25OHD concentrations and risk of fractures are inconsistent. No new data were identified in the AHRQ-Tufts report. Pregnant and lactating women: Not reviewed SOURCE: Modified from Chung et al. (2009). |
for studies that used vitamin D3 plus or minus calcium versus placebo.
As highlighted above, the benefit in community-dwelling individuals was inconsistent, but benefit was evidenced for institutionalized individuals. As reported by AHRQ-Tufts, findings from three RCTs that postdated AHRQ-Ottawa (Bunout et al., 2006; Burleigh et al., 2007; Lyons et al., 2007) did not show significant effects of either vitamin D2 or vitamin D3 supplementation (daily doses of 400 to 822 IU) in reducing the risk of total fractures (Table 4-12). The findings from AHRQ are summarized by DRI-relevant life stage groups in Box 4-6.
Rickets in children Rickets was explored by AHRQ-Ottawa relative to serum 25OHD measures only. Overall, there was fair evidence for an association between low serum 25OHD concentrations and confirmed rickets, regardless of the types of assays used to measure serum 25OHD concentrations. There is inconsistent evidence to determine whether there is a
TABLE 4-11 Odds Ratio (95% Confidence Interval) for Total Fractures from Individual RCTs of Vitamin D: Summary from AHRQ-Ottawa Analysesa
|
Reference; Jadad Score for RCTsb |
Duration (y) |
Sample Size (n) |
Vitamin D (IU/day) Follow-up |
Mean Baseline 25OHD for IG (nmol/L) |
End of trial 25OHD for IG (nmol/L) |
OR (95% CI) |
|
Chapuy et al., 2002 |
2 |
583 |
800 D3 + 1,200 mg Ca |
22 |
75 (graph) |
0.79 (0.54–1.17) |
|
Jadad = 3 |
|
|
|
|
|
|
|
Chapuy et al., 1992 |
1.5 |
3,270 |
800 D3 + 1,200 mg Ca |
40 |
105 |
0.72 (0.58–0.90) |
|
Jadad = 2 |
|
|
|
|
|
|
|
Lips et al., 1996 |
4 |
2,578 |
400 D3 |
27 |
62 |
1.12 (0.86–1.44) |
|
Jadad = 5 |
|
|
|
|
|
|
|
Dawson-Hughes et al., 1997b |
3 |
389 |
700 D3 + 500 mg Ca |
82.7 M, 67.5 F |
112 |
0.42 (0.20–0.88) |
|
Jadad = 4 |
|
|
|
|
|
|
|
Law et al., 2006 |
1 |
3,717 |
1,100 D2 |
59 |
77 |
1.4 (0.9–2.0) |
|
Jadad = 2 |
|
|
|
|
|
|
|
Pfeifer et al., 2000 |
1 |
148 |
800 D3 + 1,200 mg Ca |
25.6 |
66.1 |
0.48 (0.12–1.99) |
|
Jadad = 3 |
|
|
|
|
|
|
|
Komulainen et al., 1998 |
5 |
232 |
300 D3 + 500 mg Ca |
28.6 |
37.5 |
0.71 (0.31–1.61) |
|
Jadad = 3 |
|
|
|
|
|
|
|
Grant et al., 2005 |
5 |
5,292 |
800 D3 with or without 1,000 mg Ca |
39 |
62.2 |
1.02 (0.84–1.22) |
|
Jadad = 5 |
|
|
|
|
|
|
|
Flicker et al., 2005 |
2 |
625 |
1,100 D2 + 1,000 mg Ca |
NR |
NR |
0.69 (0.4–1.18) |
|
Jadad = 4 |
|
|
|
|
|
|
|
Reference; Jadad Score for RCTsb |
Duration (y) |
Sample Size (n) |
Vitamin D (IU/day) Follow-up |
Mean Baseline 25OHD for IG (nmol/L) |
End of trial 25OHD for IG (nmol/L) |
OR (95% CI) |
|
Jackson et al., 2006 |
7 |
36,282 |
400 D3 + 1,000 mg Ca |
46 |
NR |
0.97 (0.91–1.03) |
|
Jadad = 4 |
|
|
|
|
|
|
|
Porthouse et al., 2005 |
2 |
3,314 |
800 D3 + 1,000 mg Ca |
— |
— |
0.96 (0.65–1.46) Unequal |
|
Jadad = 3 |
|
|
|
|
|
|
|
|
|
|
|
|
|
1.09 (0.60–1.96) Equal |
|
Trivedi et al., 2003 |
5 |
2,686 |
100,000 D3 4 mo |
NR |
74.3 |
0.78 (0.60–1.00) |
|
Jadad = 3 |
|
|
|
|
|
|
|
Harwood et al., 2004 |
1 |
150 |
800 D3 + 1,000 mg Ca |
28–30 |
40–50 |
0.58 (0.13–2.64) |
|
Jadad = 3 |
|
|
|
|
|
|
|
NOTE: CI = confidence interval; F = female; IG = intervention group; IU = International Units; OR = odds ratio; M = male; mo = month(s); NR = not reported; y = year(s). aThis table has been truncated for the purposes of this chapter, but it can be found in its entirety in Appendix C. bJadad score is based on a scale of 1 to 5. See Box 4-1 for details on the scoring system. SOURCE: Modified from Cranney et al. (2007). |
||||||
threshold concentration of serum 25OHD above which rickets does not occur.
Six studies (one RCT, three before-and-after studies, and two case–control studies) reported mean or median serum 25OHD concentrations below 30 nmol/L in children with rickets, whereas the other studies reported that the mean or median serum 25OHD concentrations were above 30 nmol/L (and up to 50 nmol/L). In seven of eight case–control studies, serum 25OHD concentrations were lower in children with rickets compared with controls. Information on the 13 studies is shown in Table 4-13.
AHRQ-Tufts identified no new RCTs concerning rickets since the completion of AHRQ-Ottawa.
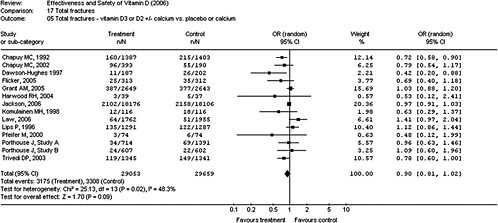
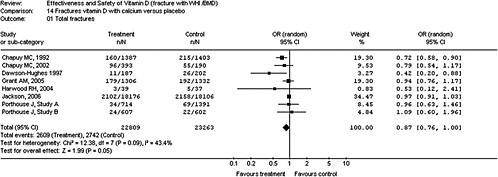
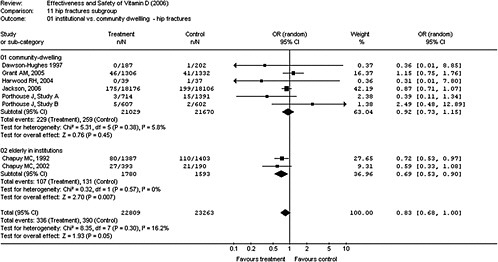
TABLE 4-12 Vitamin D and Bone Health: Characteristics of RCTs Published after AHRQ-Ottawaa
|
Reference; Location (Latitude) |
Population |
Description |
Background Calcium Intake and Vitamin D Data |
Comparisons |
Compliance |
|
Lyons et al., 2007 |
Health status |
Living in care facilities including some elderly with mobility, cognitive, visual, hearing, or communication impairments |
nd |
100,000 IU vit D2 4× monthly vs. placebo |
80% (percentage of occasions observed to take tablets) |
|
South Wales, UK (52°N) |
|
|
|||
|
|
Mean age (range), y |
84 (62–107) |
|
|
|
|
|
Male (%) |
23.7 |
|
|
|
|
Burleigh et al., 2007 |
Health status |
Inpatient with high levels of comorbidity, mortality, and polypharmacy |
25OHD: 22 nmol/L |
800 IU vit D3/d + 1,200 mg Ca carbonate/d vs. 1,200 mg Ca carbonate/d |
Ca group = 87%, vit D + Ca group = 89% (total study drug taken/total study drug prescribed, as recorded in drug prescription charts) |
|
Scotland (55°57′N) |
|
||||
|
|
Mean age (SD), y |
83 (7.6) |
|||
|
|
Male (%) |
40 |
|||
|
Bunout et al., 2006 |
Health status |
Healthy |
25OHD: ≤ 40 nmol/L |
800 mg Ca/d vs. 800 mg Ca/d + 400 IU vit D/d (with and without exercise training) |
92% (tablet counting) |
|
|
Mean age (SD), y |
76 (4) |
|||
|
Chile (32°S) |
|||||
|
|
Male (%) |
11.6 |
|||
|
NOTE: IU = International Units; nd = not determined; SD = standard deviation; UK = United Kingdom; vit = vitamin; y = year(s) aThis table has been truncated for the purposes of this chapter, but it can be found in its entirety in Appendix D. SOURCE: Modified from Chung et al. (2009). |
|||||
|
BOX 4-6 AHRQ Findings by Life Stage for Vitamin D and Calcium for Clinical Outcomes of Bone Health* 0–6 months: Not reviewed 7 months–2 years: Not reviewed 3–8 years: Not reviewed 9–18 years: Not reviewed 19–50 years: The AHRQ-Ottawa report concluded that supplementation with vitamin D (most studies used vitamin D3) plus calcium is effective in reducing the risk of fractures in institutionalized populations. One RCT of female Navy recruits ages 17 to 35 years showed that vitamin D (800 IU/day) in combination with calcium (2,000 mg/day) supplementation can reduce the risk of stress fractures from military training compared with placebo. 51–70 years: No new data were identified in the AHRQ-Tufts report ≥ 71 years: No new data were identified in the AHRQ-Tufts report Pregnant and lactating women: No data SOURCE: Modified from Chung et al. (2009). |
Pregnancy, Fetal Development, and Lactation
Pregnancy and lactation constitute specific, unique life stages that are of current interest regarding calcium and vitamin D functions and nutritional requirements. The body of evidence concerning skeletal health as it relates to the calcium and vitamin D nutriture of pregnancy, lactation, and fetal development is integrated below so as to provide context for the selection of indicators for DRI development.
Pregnancy: Calcium The developing fetus requires calcium, especially during the third trimester when the skeleton is undergoing mineralization. Direct measurements of the calcium content of the newborn skeleton have indicated that 25 to 30 g of calcium is transferred to the fetus by the end of gestation (Givens and Macy, 1933; Trotter and Hixon, 1974). Maternal intestinal calcium absorption doubles beginning early in pregnancy even though little calcium is transferred to the embryo at this stage (Heaney
TABLE 4-13 Serum 25OHD Levels in Infants and Young Children with Established Rickets: Summary from AHRQ-Ottawaa
|
Reference; Country |
Population Description |
Intervention; Duration |
Bone Health Outcomes |
Results |
|
RCTs |
||||
|
Cesur et al., 2003 |
Infants with nutritional rickets |
IG1: 150,000 IU vit D IG2: 300,000 IU vit D IG3: 600,000 IU vit D (single dose) |
Rickets |
25OHD3, mean (SD) (nmol/L): Stage I: 15.8 (6.4) Stage II: 15.4 (4.8) Stage III: 14.7 (3.9) |
|
Turkey |
10.7 (6.1) mo (range 3–36 mo) |
|
||
|
|
36% female |
|
||
|
|
n = 56 |
2 mo |
|
Ca, mean (SD) (mmol/L): All patients 1.9 (0.33) |
|
Before-and-after studies |
||||
|
Bhimma et al., 1995 |
Children with rickets: |
5,000–10,000 IU vit D3/d (plus 500–1,000 mg Ca/d) |
Rickets |
25OHD, mean (SD) (nmol/L): Vit D–deficient rickets: 9.3 (8.8) Ca-deficient rickets: 45.5 (10.0) |
|
|
vit D deficiency rickets (25OHD < 25 nmol/L); Ca deficiency rickets; phosphopenic rickets; healing/healed rickets |
|
||
|
South Africa |
|
|
|
|
|
|
12 mo |
|
Ca, mean (SD) (mmol/L): Vit D–deficient rickets: 2.09 (0.27) Ca-deficient rickets: 2.16 (0.28) |
|
|
|
Age range 1–12 y |
|
|
|
|
|
Vit D deficiency rickets 56% female |
|
|
|
|
|
n = 23 |
|
|
|
|
Reference; Country |
Population Description |
Intervention; Duration |
Bone Health Outcomes |
Results |
|
Elzouki et al., 1989 |
Children < 2 y admitted for treatment of rickets |
1–3 h/d of sunshine followed by single IM injection of 600,000 IU vit D2 |
Rickets |
25OHD: At diagnosis, 50% of patients had 25OHD > 20 nmol/L |
|
Libya |
n = 22 |
|
Range 4–65 nmol/L (graph) |
|
|
|
37.5% female |
|
|
|
|
|
|
Follow-up median 17 d |
|
Ca: ND |
|
|
African black |
|
|
|
|
Garabedian et al., 1983 |
Infants and children with rickets and controls |
IG1: 2,000 IU vit D2/d IG2: 400 IU vit D3/kg (single dose) |
Rickets |
25OHD mean (SD) (nmol/L): All patients: 11.5 (8.0) |
|
France/Belgium |
Infants and young children: range 4–26 mo |
|
|
Ca, mean (SD) (mmol/L): All patients: 1.8 (0.27) |
|
|
6 mo |
|
|
|
|
|
Older children: range 4–12 y |
|
|
|
|
|
n = 20 (+ 60 controls) |
|
|
|
|
|
80% immigrants from North Africa, Black Africa, Turkey, Portugal, Pakistan |
|
|
|
|
Markestad et al., 1984 |
Children with rickets |
1,700–4,000 IU vit D2/d (reduced to 500–1,000 IU in 3 children at 2–4 wk) |
Rickets |
25OHD median (range) (nmol/L): n = 9 diagnosed in summer: 21.0 (4.1–30.6) n = 8 diagnosed in winter: 12.1 (3.8–19.4) |
|
|
11 (64.7%) immigrants from Pakistan, Cape Verde Islands, Turkey, Morocco, Sri Lanka, and West Africa; 6 (35.3%) Norwegians |
|
||
|
Norway |
|
|||
|
|
10 wk |
|
Ca: ND |
|
Case–control studies |
||||
|
Arnaud et al., 1976 |
Children with mild, moderate, and severe rickets and controls; 2 mo–3.5 y |
5,000 IU vit D/d |
Rickets |
25OHD, mean (SD) (range) (nmol/L): Mild rickets: 45.0 (7.5) (range 40.0–52.5) Moderate rickets: 30 (5) Severe rickets: 20 (NR) Controls: 90 (30) |
|
|
4 wk |
|
||
|
Canada/Midwest United States |
|
|
|
|
|
|
n = 9 (+ 9 controls) |
|
|
|
|
|
Rickets: 22% female |
|
|
|
|
|
|
|
|
Ca, mean (SD) (mmol/L): ND for mild, moderate, severe subgroups Stage II rickets: 2.4 (0.15) Age-matched controls: 2.53 (0.1) |
|
|
Canadian (First Nations, West Indian black, Portuguese) and American (mid-northwestern United States) |
|
|
|
|
Balasubramanian et al., 2003 |
Children and adolescents with rickets/osteomalacia and controls |
Cases: 6,000 IU vit D/d or single dose of 600,000 IU |
Rickets |
25OHD, mean (SD) (nmol/L): Children: Rickets: 50.0 (38.9) Controls: 61.3 (35.9), NS |
|
India |
Children: Rickets: median 33 mo (range 11–120 mo) Controls: median 27 mo (range 6–84 mo) |
|
|
|
|
|
3 mo |
|
|
|
|
|
|
|
Adolescents: Rickets: 12.6 (7.1) all but one < LLN Controls: 46.0 (45.4), p < 0.001 |
|
|
|
Adolescents: Rickets: median 198 mo (range 168–240 mo) Controls: median 156 mo (range 120–228 mo) |
|
|
Ca, mean (SD) (mmol/L): Children: Rickets: 2.2 (0.3) Controls: 2.4 (0.3), NS |
|
|
|
|
|
Adolescents: Rickets: 2.1 (0.2) Controls: 2.3 (0.2), p = 0.008 |
|
|
n = 40 (+ 53 controls) |
|
|
|
|
|
Rickets: 54.1% female Controls: 47% female |
|
|
|
|
|
Hindu/Muslim |
|
|
|
|
Reference; Country |
Population Description |
Intervention; Duration |
Bone Health Outcomes |
Results |
|
Dawodu et al., 2005 |
Children with rickets and historical controls |
NA |
iPTH (rickets group only) |
25OHD, median (IQR) (nmol/L): Rickets: 8.0 (3.8–15.3) Controls: 43.8 (25–64.3), p = 0.001 |
|
United Arab Emirates |
Rickets: 13.5 mo Controls: 13.0 mo |
|
|
|
|
|
|
PTH showed a trend toward negative correlation with 25OHD (data NR) |
||
|
|
n = 38 (+ 50 controls) |
|
|
|
|
|
|
|
|
Ca, median (IQR) (mmol/L): Rickets: 2.22 (1.88–2.35) Controls: 2.4 (2.25–2.5), p = 0.001 |
|
|
Rickets: 50% female Controls: 40% female |
|
|
|
|
|
Arab |
|
|
|
|
Graff et al., 2004 |
Children with rickets and controls (unrelated) |
Cases: 1,000 mg Ca/d (no vit D supplement) Treatment duration: 6 mo Follow-up: 12 mo |
Rickets |
25OHD, mean (SD) (nmol/L): Significantly lower in children with rickets Rickets: 37.5 (13.5) Controls: 72.5 (11.5), p < 0.001 |
|
Nigeria |
|
|
||
|
|
Rickets: 46 (22) mo Controls: 47 (22) mo |
|
|
|
|
|
|
|
|
Ca, mean (SD) (mmol/L): Rickets: 2.13 (0.2) Controls: 2.4 (0.1), p < 0.001 |
|
|
n = 15 (+ 15 controls) |
|
|
|
|
|
60% female |
|
|
|
|
|
Rickets: 7 Muslim and 8 Christian Controls: 4 Muslim and 11 Christian |
|
|
|
|
Majid Molla et al., 2000 |
Children with rickets and controls |
NA |
Rickets |
25OHD, mean (SD) (nmol/L): Significantly lower in children with rickets Rickets: 26.5 (15.5) Controls: 83.5 (74.75), p < 0.0001 |
|
|
Rickets: 14.5 (5.2) mo (range 9 mo–8 y) Controls: 15.2 (6.3) mo |
|
|
|
|
Kuwait |
|
|
|
|
|
|
|
|
|
Ca, mean (SD) (mmol/L): Rickets: 2.24 (0.28) Controls: 2.45 (0.15), p < 0.000 |
|
|
n = 103 (+ 102 controls) |
|
|
|
|
|
96.1% from mothers with hijab use |
|
|
|
|
Oginni et al., 1996 |
Children with active rickets and healthy controls |
NA |
Rickets |
25OHD, mean (SD) (range) (nmol/L): Significantly lower in rickets group Rickets: 36 (28), range 7–147 Controls: 69 (22), range 32–140, p < 0.0002 |
|
Nigeria |
Children with rickets age range: 1–5 y |
|
|
|
|
|
n = 26 (+ 90 controls) |
|
|
|
|
|
|
|
|
Ca (albumin-corrected), mean (SD) (mmol/L): Rickets: 2.06 (0.23) Controls: 2.35 (0.14), p < 0.001 |
|
|
Rickets: 50% female Controls: 61% female |
|
|
|
|
|
Nigerian |
|
|
|
|
Thacher et al., 2000 |
Active rickets and controls |
NA |
Rickets |
25OHD median (25th and 75th percentile) (nmol/L): Rickets: 32 (22, 40); < 30: 37% Controls: 50 (42, 62), p < 0.0001 |
|
|
Rickets: median (25th and 75th percentile) age: 46 (34–63) mo Controls: 42 (25–70) mo |
|
|
|
|
Nigeria |
|
|
||
|
|
n = 123 (+ 123 controls) |
|
|
|
|
|
|
|
|
Ca, mean (SD) (mmol/L): Rickets: 1.93 (0.22) Controls: 2.24 (0.15), p < 0.0001 |
|
|
49.6% female |
|
|
|
|
|
Christian/Islam: Rickets: 82/41 Controls: 57/66 |
|
|
|
|
Reference; Country |
Population Description |
Intervention; Duration |
Bone Health Outcomes |
Results |
|
Thacher, 1997 |
Children with active rickets (median duration of 14 mo) and healthy controls with normal weight |
NA |
Rickets |
25(OH)D Rickets: levels > LLN in 16/28 (57%); 2/28(7%) had values < 12.5 nmol/L Controls: ND |
|
Nigeria |
|
|
||
|
|
Rickets: 3.16 (1.53) y Controls 3.14 (1.51) y |
|
|
|
|
|
|
|
Ca, mean (SD) (mmol/L): Rickets: 2.09 (0.30) Controls: 2.08 (0.31), NS 55% of rickets and 51% of controls were hypocalcemic (< 2.1) |
|
|
|
n = 37 (+ 37 controls) |
|
|
|
|
|
47% female |
|
|
|
|
|
All Nigerian |
|
|
|
|
NOTE: h = hours; IG = intervention group; IM = intramuscular; iPTH = intact parathyroid hormone; IQR = interquartile range; IU = International Units; LLN = lower limit of normal reference range; mo = month(s); NA = not applicable; ND = not determined; NR = not reported; NS = not significant; PTH = parathyroid hormone; SD = standard deviation; vit = vitamin; wk = week(s); y = year(s). aThis table has been truncated for the purposes of this chapter, but it can be found in its entirety in Appendix C. SOURCE: Modified from Cranney et al. (2007). |
||||
and Skillman, 1971). The increased intestinal calcium absorption causes a net positive calcium balance in the mother early in pregnancy (Heaney and Skillman, 1971). However, in the third trimester, the rapid maternal-fetal calcium transfer results in a maternal calcium balance that is zero or perhaps slightly negative by the end of pregnancy.
There is controversy about the mobilization of calcium from maternal bone during pregnancy and its contribution to fetal calcium needs. A possible loss of BMC has been seen longitudinally using the modern technique of dual-energy X-ray absorptiometry (DXA), but measurements were done 1 to 18 months prior to pregnancy and 1 to 6 weeks postpartum (i.e., not during pregnancy) making it uncertain whether the measured calcium loss had truly occurred during pregnancy (Kovacs and Kronenberg, 1997; Kovacs and Fuleihan Gel, 2006). Further, the effect of pregnancy on bone mineral content may depend on the site examined, with decreases reported for trabecular bone (Black et al., 2000; Naylor et al., 2000; More et al., 2001; Kaur et al., 2003; Ulrich et al., 2003; Akesson et al., 2004; Pearson et al., 2004), but not cortical bone (Naylor et al., 2000; Pearson et al., 2004). Two studies (Kaur et al., 2003; Olausson et al., 2008) used contemporaneous non-pregnant and non-lactating age-matched controls to compare, to the extent feasible, the effects of pregnancy and age on BMD. Kaur et al. (2003) found no significant difference in BMD before and after pregnancy. Olausson et al. (2008) found a significant 1 to 4 percent decrease in whole-body, spine, and total hip BMC before and 2 weeks after pregnancy, whereas controls had an increase in whole-body BMC and a smaller (0.5 to 1 percent) decrease in BMD at the spine and hip. These skeletal changes were unrelated to calcium intake in either group. Collectively, the evidence tends to suggest that mineral mobilization is variable during pregnancy and may contribute, to some extent, to fetal calcium needs.
Relatively few studies have examined the effect of calcium supplementation on either fetal or maternal outcomes. In a placebo-controlled double-blind randomized trial conducted in the United States, Koo et al. (1999) demonstrated that calcium supplementation during pregnancy may benefit the offspring’s bone health, but only in those infants whose mothers had very low calcium intake (600 mg/day), based on a post-hoc subgroup analysis. In contrast to this possible benefit to the offspring, calcium supplementation during pregnancy of Gambian women with low calcium intakes resulted surprisingly in greater decreases in BMC and BMD and related biochemical evidence, consistent with higher bone mineral mobilization during lactation (Jarjou et al., 2010).
Maternal serum calcium levels fall during pregnancy (Pedersen et al., 1984) as a consequence of plasma volume expansion and reduced albumin concentration; lower calcium levels do not imply calcium deficiency. The
ionized calcium (i.e., the physiologically important fraction of calcium) and the albumin-corrected serum calcium levels do not change during pregnancy (Seely et al., 1997). Pregnant women consuming “moderate” calcium (800 to 1,000 mg/day) (Gertner et al., 1986; Allen et al., 1991) to “high” calcium (1,950 mg/day) (Cross et al., 1995) are often hypercalciuric as a result of increased intestinal calcium absorption (i.e., absorptive hypercalciuria); as such, pregnancy itself is a risk factor for kidney stones. Urinary calcium excretion increases as early as the 12th week of gestation and averages 300 ± 61 mg/24 hours in the third trimester with hypercalciuric levels not uncommon (Pedersen et al., 1984; Gertner et al., 1986; Allen et al., 1991; Cross et al., 1995; Seely et al., 1997). While urinary calcium excretion goes up in normal pregnancy, it decreases in women who are developing preeclampsia. The risk of preeclampsia can be reduced with supplemental calcium when the dietary calcium intake is very low; however, there appears to be no effect when dietary calcium intake is adequate (Hofmeyr et al., 2006; Villar et al., 2006; Hiller et al., 2007; Kumar et al., 2009).
In the adolescent, whose skeleton is still growing, pregnancy could theoretically reduce peak bone mass and increase the long-term risk of osteoporosis. Most cross–sectional studies that have compared the BMD in teens early postpartum with that in never-pregnant teens have suggested that there is no reason to be concerned about BMD or bone mass after adolescent pregnancy (Kovacs and Kronenberg, 1997). A few smaller observational studies have reported that lower adolescent age at first pregnancy is associated with lower BMD in the adult (Sowers et al., 1985, 1992; Fox et al., 1993). In contrast, an analysis of NHANES III data on BMD by DXA for 819 women ages 20 to 25 years found that women pregnant as adolescents had the same BMD as women pregnant as adults and as nulliparous women (Chantry et al., 2004). This study’s population is diverse and representative of the general U.S. population and thus reassures that teen pregnancy does not reduce BMD in most women. An additional study (O’Brien et al., 2003) found that fractional calcium absorption doubles during adolescent pregnancy (as it does in adults) and during the first 2 months postpartum. Mean BMD of previously pregnant—but not lactating—adolescents was above the expected BMD for age in this study, also suggesting that no loss of BMD had occurred during pregnancy. These data indicate that adolescent women meet the calcium demands of pregnancy by increasing intestinal calcium absorption while preserving maternal bone mass.
Pregnancy: Vitamin D
Maternal outcomes Total calcitriol levels double early in pregnancy and remain at this increased level until delivery (Bikle et al., 1984; Cross et al., 1995; Ardawi et al., 1997; O’Brien et al., 2006; Papapetrou, 2010).
This is related to a concomitant increase in plasma vitamin D binding protein (DBP) (Bikle et al., 1984; Ardawi et al., 1997). Free calcitriol levels do not increase until the third trimester (Bikle et al., 1984; Specker, 2004; Kovacs, 2008). The main source of calcitriol is from the maternal renal 1α-hydroxylase, with little contribution from the placenta even though it expresses 1α-hydroxylase, based on the case report of a pregnant anephric woman whose low levels of calcitriol increased less than 15 percent by the beginning of the third trimester (Turner et al., 1988). Despite the increased synthesis of calcitriol during pregnancy and the passage of 25OHD across the placenta to the fetus, maternal serum 25OHD levels are relatively unaffected by pregnancy (Hillman et al., 1978; Brooke et al., 1980; Cross et al., 1995; Ardawi et al., 1997; Morley et al., 2006; Papapetrou, 2010), although one report noted a significant decline by the third trimester in Saudi women (Ardawi et al., 1997). Even when baseline serum 25OHD level was in the severely deficient range (mean 20.1 ± 1.9 nmol/L), the serum levels did not change significantly by the end of pregnancy (Brooke et al., 1980).
The increase in maternal intestinal calcium absorption has been positively associated with the increase in maternal serum calcitriol levels in observational studies in humans (Cross et al., 1995; Ritchie et al., 1998). Certain results from studies in animal models are relevant to understanding the changes in vitamin D physiology that occur during human pregnancy. Intestinal calcium absorption is markedly up-regulated in pregnant vitamin D–deficient rats and in mice lacking the VDR (Vdr-null mice) to the same high rate achieved in pregnant vitamin D–replete rats and wild-type mice, respectively (Halloran and DeLuca, 1980a; Brommage et al., 1990; Fudge and Kovacs, 2010). This suggests that factors other than vitamin D (e.g., estrogen, placental lactogen, and prolactin) stimulate intestinal calcium absorption during pregnancy.
Very few clinical trials of vitamin D supplementation during pregnancy have been conducted. The work of Wagner et al. (2010a, b), reported currently in abstract form, has focused on high doses of vitamin D (4,000 versus 2,000 and 400 IU/day) in intervention trials in which the focus was on non-skeletal outcomes. A final report from these studies is expected soon. To date, the available intervention studies have shown little effect of vitamin D supplementation on maternal, fetal, or neonatal outcomes, although it would be expected that higher serum 25OHD levels in the newborn should protect against neonatal hypocalcemia (Specker, 2004; Kovacs, 2008). In a study of Asian women with initially low 25OHD levels (mean of 20 nmol/L) at baseline, daily supplementation with 1,000 IU of vitamin D per day did not affect cord blood calcium level or the newborns’ crown–heel length, forearm length, triceps skinfold thickness, or head circumference, but it did reduce the fontanelle area by 32.7 percent (Brooke et al.,
1980). The achieved serum 25OHD level in the vitamin D–supplemented group was 168 nmol/L compared with 10 nmol/L in the control group, raising the question as to whether the actual supplemented dose was considerably higher than the intended dose of 1,000 IU/day. In another trial, 1,000 IU of vitamin D per day was administered during the last trimester of pregnancy, compared with controls with no supplementation (Mallet et al., 1986). Supplementation resulted in higher maternal and cord blood 25OHD levels but had no effect on maternal, cord blood, or neonatal calcium levels or anthropometric parameters in the infants. In a study of vitamin D–deficient Asian women given a single dose of 800,000 IU of vitamin D in the third trimester, cord blood calcium level increased slightly, but there was no other benefit compared with women who received either no supplement or a daily dose of 1,200 IU of vitamin D (Marya et al., 1981, 1988). One small randomized but not blinded intervention trial found that maternal supplementation with 800 IU of vitamin D per day increased both maternal serum and cord blood 25OHD levels significantly, but did not affect gestational age at delivery, compared with unsupplemented controls (Yu et al., 2009). Observational studies have reported an uneventful clinical course of pregnancy in women with abnormalities of the VDR (vitamin D–dependent rickets type I [VDDR I] or VDDR II) when normo-calcemia is maintained (Malloy et al., 1997; St-Arnaud et al., 1997).
Fetal outcomes Animal models (e.g., mice, rats, guinea pigs, and sheep) have contributed to elucidating aspects of the physiology of fetal vitamin D nutriture that cannot be studied during human pregnancy. Studies in genetically altered animal models have provided information about the requirements for vitamin D and VDR signaling during pregnancy. For this reason, reference to such studies is included extensively in this component of the literature review.
There is evidence that 25OHD crosses the placenta relatively freely based on animal studies (Haddad et al., 1971; Noff and Edelstein, 1978) and studies of human perfused placenta (Ron et al., 1984). In contrast, calcitriol transfers across the human perfused placenta (Ron et al., 1984), but not the rat placenta (Noff and Edelstein, 1978). Overall, however, the net transfer from the human mother to fetus appears to be low. By term, cord blood 25OHD levels are typically 75 to 90 percent of maternal 25OHD levels (Seino et al., 1982; Kovacs, 2008), whereas cord blood calcitriol levels are low compared to maternal levels. As already highlighted in previous discussions regarding calcium, fetal serum calcium, ionized calcium, and phosphorus levels are raised above the maternal values, whereas PTH and calcitriol levels are lower. The higher calcium and phosphorus levels in the fetus suppress the 1α-hydroxylase in the placenta and fetal kidneys, and likely explain the low circulating calcitriol levels in normal fetuses.
Despite widespread expression of the VDR in the early embryo and
later in many different fetal tissues, evidence suggests that vitamin D, calcitriol, and VDR are not required for skeletal development or mineralization prior to birth, as demonstrated in experimental animal studies and human observations.
Experimental animal studies have examined vitamin D deficiency as well as the genetic absence of the VDR (Vdr-null mice). In Vdr-null fetuses, the rate of placental calcium transfer rates and the expression of the calcium transient receptor potential cation channel, vanilloid family member 6 (TRPV6), increase compared with normal littermates (Kovacs, 2005). Further, in multiple animal models fetuses and neonates have been shown to have normal calcium homeostasis—i.e., normal blood calcium, phosphorus, PTH, and skeletal mineral content—under conditions of severe vitamin D deficiency as shown in: rats (Halloran and DeLuca, 1979, 1980b, 1981; Halloran et al., 1979; Miller et al., 1983); pigs with a null mutation of the 1α-hydroxylase (Lachenmaier-Currle and Harmeyer, 1989); 1α-hydroxylase-null mice (Dardenne et al., 2001; Panda et al., 2001); and Vdr-null mice (Li et al., 1997, 1998; Kovacs et al., 2005; Fudge and Kovacs, 2010). In contrast to the fetus, the mothers in these models exhibit severe hypocalcemia, hypophosphatemia, and osteomalacia.
Further, serum calcium levels and skeletal mineral content remain normal for the first 2 to 3 weeks after birth in vitamin D–deficient rats and Vdr-null mice (Kovacs et al., 2005). After weaning, the deficient and Vdr-null animals develop progressive hypocalcemia, hypophosphatemia, and histomorphometric evidence of rickets, not seen in normal or heterozygous littermates. This situation parallels the maturation of calcium absorption in the intestine, which changes from a non-saturable, passive process in the newborn to an active, saturable, calcitriol-dependent process in the rat (Ghishan et al., 1980, 1984; Halloran and DeLuca, 1980c). It is also consistent with observational evidence from human studies, as discussed below. It should be noted that the guinea pig stands in contrast to other animal models. Vitamin D deficiency in pregnant guinea pigs reduces fetal whole-body BMC, but not BMD (Rummens et al., 2002; Finch et al., 2010). It also appears to reduce guinea pig weight at birth (Rummens et al., 2002; Finch et al., 2010).
The information gleaned from these studies highlights the importance of calcitriol in the regulation of intestinal calcium absorption and the facilitation of skeletal mineralization in the weaned young, adolescent, and adult, but not in the fetus or early neonate. Collectively, the physiological data from several different animal models indicate that fetal calcium homeostasis and skeletal development/mineralization are regulated independently of vitamin D, calcitriol and its receptor. Heterozygous and null fetuses of Vdr-null mothers were, however, smaller and weighed less despite
maintaining normal blood calcium levels and normal mineral content for their proportionately smaller skeletons (Kovacs et al., 2005).
Evidence from humans is mixed on whether the movement of calcium into the fetal body requires calcitriol (Specker, 2004). Both RCTs and observational evidence suggest that calcium transfer and fetal skeletal outcomes are not affected by vitamin D deficiency (Kovacs, 2008). Brooke et al. (1980) reported on an RCT of 126 women in which babies born of placebo-treated mothers had a mean serum 25OHD level of 10 nmol/L and there were no radiographic signs of rickets. Delvin et al. (1986), reporting on an RCT, found that maternal vitamin D supplementation had no effect on cord blood calcium level but resulted in higher 25OHD levels in both the maternal and cord blood. An observational study found no relationship between maternal 25OHD level and whole-body BMC and BMD and a positive relationship of gestational age and birth weight (Akcakus et al., 2006). Another observational study (Congdon et al., 1983) reported that maternal vitamin D supplementation did not affect neonatal BMC for offspring from Asian women with very low serum 25OHD levels.
In human babies lacking the 1α-hydroxylase (VDDR I) or lacking the VDR (VDDR II or hereditary vitamin D–resistant rickets) normal skeletons and blood calcium at birth have been reported (Silver et al., 1985; Takeda et al., 1997; Teotia and Teotia, 1997; Kitanaka et al., 1998; Bouillon et al., 2006). Regarding rickets, observational studies of babies born of severely vitamin D–deficient mothers generally show normal skeletal mineral content with no radiological evidence of rickets at birth (Maxwell and Miles, 1925), followed by the development of hypocalcemia or rickets only in postnatal weeks to months (Pereira and Zucker, 1986; Campbell and Fleischman, 1988; Specker, 1994; Beck-Nielsen et al., 2009). Although some isolated reports have indicated the presence of congenital rickets at birth, the diagnosis was actually made within the first or second week (Begum et al., 1968; Ford et al., 1973; Moncrieff and Fadahunsi, 1974; Sann et al., 1976; Park et al., 1987; Teotia et al., 1995). Radiographic findings have reported rickets present at day 15 but not day 2 (Sann et al., 1976). In many cases, the cause was not isolated vitamin D deficiency, but malnutrition, malabsorption (e.g., celiac disease, pancreatic insufficiency), or very low maternal intakes of both calcium and vitamin D (Begum et al., 1968; Teotia et al., 1995; Innes et al., 2002). In a study in China, neonatal rickets was not found, even though 57 percent of the infants had low cord blood 25OHD levels (Specker et al., 1992).
Overall, data are not consistent regarding skeletal development, in that several observational studies have found an adverse effect of low maternal vitamin D on fetal skeletal outcomes. An ecological study reported a positive association of imputed UVB exposure during the last trimester with some neonatal bone outcomes (Sayers and Tobias, 2009). Another
study in Korean infants born in winter reported seasonal low neonatal total BMC and maternal 25OHD levels (Namgung et al., 1998). Lower levels of maternal and neonatal serum 25OHD were found for infants with craniotabes (softening of the skull bones along suture lines) compared with those without (Reif et al., 1988). Another study reported only a small non-significant reduced knee–heel length at birth in neonates whose mothers had a serum 25OHD level below 28 nmol/L (Morley et al., 2006). Recently, Mahon et al. (2010) identified an inverse relationship of femur metaphyseal cross–sectional area and splaying index with maternal 25OHD levels at 34 weeks, using high-resolution three-dimensional ultrasound at the 19th and 34th weeks of gestation. Viljakainen et al. (2010), based on a study of 124 mothers and their infants, reported impaired fetal neonatal tibia BMC and cross–sectional area, but not BMD, when maternal 25OHD levels were below the median of 42.6 nmol/L. It is noted that Mahon et al. (2010) concluded that the higher cross–sectional area was evidence of prenatal rachitic deformity, while Viljakainen et al. (2010) considered the higher cross–sectional area to predict higher bone mass in childhood. It is unclear whether the investigators in these various studies examined multiple skeletal measurements in multiple long bones, and these differences may explain some of the differences in the reports.
Regarding so-called developmental programming, recent associational studies have suggested possible adverse programming (including skeletal and selected immunological outcomes) in offspring of mothers with low maternal serum 25OHD levels (Arden et al., 2002; Cooper et al., 2005; Javaid et al., 2006; Miyake et al., 2009; Nwaru et al., 2010) as well as high maternal serum 25OHD levels (Gale et al., 2008). However, a recent observational study reported no association of maternal 25OHD levels with autoimmunity or type 1 diabetes (Marjamaki et al., 2010). Skeletal parameters at birth and nine months were normal but BMC determined later in childhood were reported to be higher in offspring of women with higher serum 25OHD levels during pregnancy compared with those with the lowest serum 25OHD levels (Javaid et al., 2006). The interpretation of these associational studies may be confounded by factors that are associated with maternal serum 25OHD level during pregnancy and affect fetal growth, such as increased maternal weight, lower socioeconomic status, and poorer nutrition. These factors may also be conferred on the offspring during childhood development, complicating the ability to establish a causal relationship.
Overall, the human and experimental animal data indicate that the development and mineralization of the fetal skeleton, as well as fetal blood calcium and phosphorus levels, are generally normal despite extremes of severe vitamin D deficiency, absence of calcitriol, and absence of the VDR. In contrast, the data confirm that vitamin D deficiency that is present at
birth and left uncorrected will more readily lead to neonatal hypocalcemia and the postnatal development of rickets.
Lactation: Calcium Key physiological changes in the female adolescent or adult occur to meet the calcium demands of lactation that are higher than those in pregnancy, but the adaptations differ from those that occur during pregnancy (Kovacs and Kronenberg, 1997, 2008; Kalkwarf, 1999; Prentice, 2003). Maternal bone resorption is markedly up-regulated (Specker et al., 1994; Kalkwarf et al., 1997), and it appears that most of the calcium present in milk derives from the maternal skeleton. This bone resorption is driven by low estradiol and high plasma PTH-related protein (PTHrP) levels (and possibly other factors), which act through osteoblasts to up-regulate osteoclast number and activity. Maternal BMD can decline 10 to 45 percent during 2 to 6 months of exclusive breastfeeding, but it normally returns to baseline over the succeeding 6 to 12 months post-weaning (Kalkwarf, 1999).
The effect of dietary intake of calcium on the skeletal resorption that occurs during lactation has been examined through randomized trials and in observational studies comparing North American and Gambian women. The consistent finding is that calcium intakes ranging from very low (< 500 mg/day) to supplemented well above normal (1.0 to 2.5 g/day) have no effect on the degree of skeletal demineralization that occurs during lactation, but calcium supplementation does increase urinary calcium excretion (Cross et al., 1995; Fairweather-Tait et al., 1995; Prentice et al., 1995; Kalkwarf et al., 1997; Laskey et al., 1998; Polatti et al., 1999).
The effect of calcium intake on skeletal recovery after weaning has not been rigorously studied. In one RCT that enrolled 95 lactating women prior to weaning, use of a 1 g/day calcium supplement resulted in a 5.9 percent increase in lumbar spine BMD compared with a 4.4 percent increase in women who took a placebo, as well as a 2.5 percent increase in non-lactating women compared with a 1.6 percent increase in women who took a placebo (Kalkwarf et al., 1997). These studies suggest that a higher calcium intake during post-weaning recovery might be beneficial for ensuring restoration of skeletal mineral content; conversely, a low calcium intake during post-weaning might be expected to impair skeletal recovery. However, skeletal recovery was complete in Gambian women with habitually very low calcium intakes. Moreover, the large associational studies mentioned above found no effect (and some found a protective effect) of a history of lactation or the number of months that a mother recalled breastfeeding her child on BMD, osteoporosis, or fracture risk later in life (Sowers, 1996; Kovacs and Kronenberg, 1997). Thus, in the long term, a history of lactation does not increase the risk of low BMD or osteoporosis.
The efficiency of intestinal calcium absorption, which is up-regulated
during pregnancy, decreases to the non-pregnant level in the puerperium, and remains at that level during lactation (Kent et al., 1991; Specker et al., 1994; O’Brien et al., 2006), then increases slightly during post-weaning compared with the level in non-pregnant or lactating women (Kalkwarf et al., 1996). Urinary calcium excretion also decreases (Allen et al., 1991; O’Brien et al., 2006) and may reach the lower end of the normal range, especially in women with low calcium intakes (Specker et al., 1994). This effect presumably is due to the influence of PTHrP, which stimulates renal calcium reabsorption.
Breast milk calcium content is homeostatically regulated and unaffected by maternal calcium intake. The evidence includes randomized trials in which supplemental calcium from 1 g/day (Kalkwarf et al., 1997) to 1.5 g/day in Gambian women whose habitual calcium intake was low (Jarjou et al., 2006) showed no effect on breast milk calcium content. These results are consistent with the notion that the calcium content of milk derives from resorption of the maternal skeleton and local regulation within mammary tissue. At least one study has confirmed that the breast milk output predicts the decline in maternal BMD during lactation, whereas calcium intake, breast milk calcium concentration, and VDR genotype have no effect (Laskey et al., 1998).
In lactating women, the albumin-corrected serum calcium as well as the ionized calcium levels are normal or slightly increased (Hillman et al., 1981; Specker et al., 1991). The mean ionized calcium level of exclusively lactating women is higher than that of normal controls (Dobnig et al., 1995; Kovacs and Chik, 1995). Also, mothers nursing twins have significantly higher total calcium levels compared with mothers nursing singletons (Greer et al., 1984).
These physiological responses appear to be similar for lactating adolescents. In fact, the largest and most reassuring data set from NHANES III (described previously), which obtained BMD using the DXA method in 819 women ages 20 to 25 years (Chantry et al., 2004) indicates that young women who had breast-fed as adolescents have higher BMD than those who had not breast-fed, even after controlling for obstetrical variables. This indicates that the normal loss of BMD during lactation and recovery afterward occur in adolescent women and may even lead to a higher BMD post-weaning.
Lactation: Vitamin D Breast milk is not normally a significant source of vitamin D for the infant. Because vitamin D (calciferol) is usually present in the circulation only for short intervals after meals, typically very little passes into breast milk. As discussed below, preliminary data may suggest that levels of vitamin D and 25OHD in breast milk can be increased by high
levels of vitamin D supplementation. Neither 25OHD nor calcitriol passes readily into breast milk.
With respect to the effects of vitamin D supplementation on serum levels of 25OHD in the infant, several studies have examined supplementation of infants with 300 or 400 IU of vitamin D per day, which raised levels above 75 nmol/L (Hollis and Wagner, 2004; Basile et al., 2006; Wagner et al., 2006); however, administering supplements of 300 to 2,000 IU/day to the lactating mother did not increase serum levels of the infant (Greer et al., 1982; Rothberg et al., 1982; Ala-Houhala, 1985; Ala-Houhala et al., 1988; Greer and Marshall, 1989; Hollis and Wagner, 2004). However, very high doses of vitamin D (4,000 to 6,400 IU/day) given to the mother have been reported to raise infant serum 25OHD levels (Hollis and Wagner, 2004; Wagner et al., 2006). As described by the authors, the work was a pilot study and involved 19 subjects. Specifically, when 4,000 IU of vitamin D per day was given to the mothers, the mean serum 25OHD level of the infants exceeded 75 nmol/L; with a dose of 6,400 IU/day, the serum 25OHD level of all infants exceeded this value. However, the functional impact of raising infants’ serum 25OHD levels above 75 nmol/L by increasing maternal dietary intake to such high levels is not clear, and the small sample size of this pilot study (n = 19) precluded conclusions about safety. One RCT found no benefit in raising infants’ serum 25OHD level above 50 nmol/L relative to measures of weight, length, and skeletal mineral content (Chan et al., 1982). Other work with the administration of high dosages of vitamin D to the mother has not specifically reported any functional health outcome to the breast-fed infant other than increased serum 25OHD levels; the breast milk calcium content is unaffected (Hollis and Wagner, 2004; Wagner et al., 2006). The administration of 400 IU/day to the infant remains the American Academy of Pediatrics’ recommendation (Wagner and Greer, 2008).
Serum 25OHD levels do not appear to change significantly during lactation compared with non-lactating states, although this has been assessed in only two small studies (Kent et al., 1990; Sowers et al., 1998). Because 25OHD does not pass readily into milk, it is not lost to the mother via this route. One study (Cross et al., 1995) reported an increase in maternal serum 25OHD level post-weaning, and although calcitriol levels increased in two studies (Cross et al., 1995; Kalkwarf et al., 1997), they did not in another (Specker et al., 1991). Studies have generally shown that providing vitamin D to lactating mothers increased their serum 25OHD levels, but otherwise had no significant effect on maternal outcome parameters (Cancela et al., 1986; Okonofua et al., 1987; Takeuchi et al., 1989; Kent et al., 1990; Alfaham et al., 1995; Sowers et al., 1998) and in clinical trials (Rothberg et al., 1982; Ala-Houhala, 1985; Ala-Houhala et al., 1988; Kalkwarf et al., 1996; Hollis and Wagner, 2004; Basile et al., 2006; Wagner et al., 2006; Saadi et al., 2007).
An observational study in Gambian women consuming a low-calcium diet reported no relationship between maternal 25OHD levels and breast milk calcium (Prentice et al., 1997). However, many studies measured no outcome other than the achieved serum 25OHD level in mothers and neonates and were not powered to examine outcomes such as hypocalcemia or clinical rickets (Rothberg et al., 1982; Ala-Houhala, 1985; Hollis and Wagner, 2004; Basile et al., 2006; Wagner et al., 2006).
Maternal skeleton recovers BMC after lactation ceases, but no RCTs have tested whether vitamin D sufficiency affects the speed and net recovery of maternal skeletal mineral content after weaning. An observational study in Saudi women found no relationship of serum 25OHD level with BMD at the lumbar spine, femoral neck, Ward’s triangle, or trochanter, as well as no difference in BMD at these sites in women with or without severe hypovitaminosis D (Ghannam et al., 1999). None of the intervention studies that examined the use of vitamin D supplementation during lactation enrolled sufficient adolescent women to permit conclusions to be drawn about the effect of the intervention.
As noted above, animal models are of interest; in the case of vitamin D, rodent models have predominated. Unlike the situation in humans, calcitriol levels in lactating rodents remain elevated, but increase further in response to a low-calcium diet or larger litter size (Lobaugh et al., 1990, 1992). This may indicate a compensatory mechanism that increases intestinal calcium absorption even further when extra demands are placed on the mother during lactation. However, studies in vitamin D–deficient rats and Vdr-null mice have indicated that sufficiency of vitamin D, or responsiveness to calcitriol is not required for lactation. Vitamin D–deficient rats and Vdr-null mice lactated normally and resorbed the expected proportion of bone (Halloran and DeLuca, 1980b; Miller et al., 1982; Fudge and Kovacs, 2010), although one study in vitamin D–deficient rats found that more skeletal mineral content was lost than normal (Marie et al., 1986). Intestinal calcium absorption was twice the control level in lactating vitamin D–deficient rats, confirming that vitamin D is not required for the intestinal adaptation to take place (Halloran and DeLuca, 1980a; Boass et al., 1981).
In rodents, the skeleton is substantially resorbed during lactation, and this is followed in the post-lactation period by an interval of up-regulated bone formation, which effectively restores BMD to a normal level within 10 to 14 days. Two studies of vitamin D–deficient rats reported at least partial recovery of skeletal mineral content after lactation, with the final value exceeding the pre-pregnancy value in one study (Halloran and DeLuca, 1980b; Miller et al., 1982). Likewise, in Vdr-null mice, BMC after weaning also exceeded the pre-pregnancy level (Fudge et al., 2006). Thus, these animal studies suggest that calcitriol may not be required for the skeleton to recover its normal mineral content after lactation is completed.
In both Vdr-null and 1α-hydroxylase-null mice, the provision of a high-calcium, high-phosphorus, lactose-enriched diet, initiated in the neonates prior to weaning, prevented the development of rickets in the adult (Li et al., 1998; Amling et al., 1999; Van Cromphaut et al., 2001; Hoenderop et al., 2002; Dardenne et al., 2003; Rowling et al., 2007). Similar outcomes have been reported for children with VDDR-I or VDDRI-II in which rickets is mitigated with high levels of oral calcium or intermittent intravenous infusions of calcium (Balsan et al., 1986; Hochberg et al., 1992; Kitanaka et al., 1998). These results indicate that the main role of calcitriol is to stimulate active intestinal calcium absorption rather than to directly affect skeletal development. Moreover, it suggests that the role of calcitriol can be bypassed if the calcium content of the experimental diet is suitably manipulated.
Other Measures of Interest Related to Bone Health: PTH
PTH is potentially of interest as an indicator of bone health because vitamin D intake can lower serum PTH levels (Malabanan et al., 1998) and because elevated serum PTH levels have been recognized as a risk factor for osteoporosis (Hodsman et al., 2002). The role of PTH in the calcium–vitamin D homeostatic system is highlighted in Chapter 2. A critical question is what levels of PTH are harmful to bone, as only a small amount of PTH is needed to maintain a normal level of serum 25OHD.
Measures that have been explored are the levels of serum 25OHD at which PTH levels rise as well as the level of serum 25OHD at which PTH levels no longer decline (Aloia et al., 2006a; Durazo-Arvizu et al., 2010). However, because serum PTH levels increase with age, it is not clear what level of PTH should be regarded as normal (Dawson-Hughes et al., 1997a; Vieth et al., 2003) or whether the relationship is meaningful for all age groups (Abrams et al., 2005). These studies have led some to suggest that a serum 25OHD level of 75 nmol/L is consistent with the PTH plateau point (Malabanan et al., 1998) and hence demarcates sufficiency and insufficiency for vitamin D. However, a review of the literature does not show widespread agreement on a plateau consistent with a serum 25OHD level of 75 nmol/L. In most cases, serum PTH level reaches a plateau at different levels of serum 25OHD varying between 37.5 and 125.0 nmol/L. Box 4-7 summarizes the study outcomes.
Race/ethnicity may be a factor in determining the relationship between serum 25OHD and PTH levels, although the measures used have focused on calcitriol rather than serum 25OHD concentrations. African American and dark-skinned populations have lower serum 25OHD and calcitriol levels compared with white populations (Bell, 1995, 1997). A study of more than 500 healthy women ages 20 to 80 years found that PTH
|
BOX 4-7 Studies Demonstrating PTH Plateaus at Various Serum 25OHD Levels Serum 25OHD < 30 nmol/L:
Serum 25OHD < 50 nmol/L:
Serum 25OHD < 75 nmol/L:
Serum 25OHD ~ 88 nmol/L:
Serum 25OHD 100–125 nmol/L:
No plateau:
No relationship:
|
and calcitriol levels were higher in black than in white women and that the black women had lower bone turnover rates compared with white women (Aloia et al., 1996b). Some evidence, however, suggests that PTH levels are similar in both populations (Benjamin et al., 2009).
As reviewed by Prentice et al. (2008), an inverse relationship between PTH and serum 25OHD concentrations has been reported in many cross–sectional and intervention studies in elderly people (Krall et al., 1989; Ooms et al., 1995a; Chapuy et al., 1997; Bates et al., 2003), post menopausal women (Krall et al., 1989; Lappe et al., 2006), and young persons (Guillemant et al., 1999). Some studies suggest that the plasma PTH concentration reaches a plateau as the 25OHD concentration increases
(Chapuy et al., 1997; Lappe et al., 2006), whereas others describe an exponential inverse relationship (linear when the data are expressed in logarithms) throughout the physiological range of 25OHD concentrations (Bates et al., 2003; Vieth et al., 2003). The reasons for these discrepancies are unclear, but they could reflect differences among the populations studied and statistical methods used (Prentice, 2008).
Further, the plasma PTH concentration varies widely within and among individuals at any given concentration of 25OHD (Chapuy et al., 1997; Bates et al., 2003), because the plasma PTH concentration depends upon many factors other than vitamin D, such as stage of life, ethnic background, intakes of dietary calcium (Steingrimsdottir et al., 2005) and phosphorus, time of day, kidney function (Ooms et al., 1995a), physical activity level, and drug use (Slovik et al., 1981; van der Wiel et al., 1991; Vieth et al., 2003; Fraser et al., 2004; Patel et al., 2007; Prentice, 2008). In addition, the choice of assay method is important because an assay could detect both PTH fragments and intact molecules (van der Wiel et al., 1991).
Most of the studies supporting the use of serum PTH level as either a biomarker of exposure or a biomarker of biological effect have been conducted among older white persons living in Europe and the United States. However, the available studies in other age groups and in people from different geographic locations and ethnic backgrounds do not provide evidence that PTH measures can be universally applied relative to information about vitamin D intakes and effects. Studies in Africa and China, for example, have reported that plasma PTH measures are elevated in populations with low calcium intake, even when vitamin D nutriture is good, and the inverse correlations between plasma PTH measures and bone health outcomes such as BMD and fracture risk observed in Western countries are not found (Yan et al., 2003; Aspray et al., 2005). Also, PTH measures increase during puberty (Abrams et al., 2005; Tylavsky et al., 2005), a period of skeletal growth. Therefore, although the potential for PTH as a useful indicator of bone health is acknowledged, it is not a useful indicator for DRI development at this point in time.
Integration of Evidence for the Potential Indicator of Bone Health
To be useful for judging bone health outcomes as potential indicators for DRI development, the available evidence must be considered in the context of its relevance to bone accretion, bone maintenance, and bone loss. The committee therefore arranged the data consistent with these physiological states. Although the AHRQ analyses were useful overall for this purpose, the committee recognized that there were useful studies published after the completion of the AHRQ-Tufts as well as several relevant studies that did not meet the inclusion criteria stipulated by the
AHRQ analyses. These are included and identified in the discussions below. The following sections integrate data on bone accretion, maintenance, and loss and refer to the DRI life stage groups as appropriate. Initially, the utility of serum 25OHD level for the purposes of DRI development is discussed, as is the relationship between calcium absorption and serum 25OHD concentrations.
Utility of serum 25OHD level for examining bone health outcomes Although serum 25OHD is indicative of vitamin D exposure (see Chapter 3), the seemingly logical next step of using serum 25OHD level to explore the levels at which vitamin D effects a health outcome requires caution. There are a number of studies of good quality that report serum 25OHD concentrations in relation to health outcomes such as fracture incidence—and which have been described in the AHRQ analyses—but such associations are not necessarily causal or predictive, and not all of the variables associated with serum 25OHD levels are reported. In short, these associations are not yet an adequate basis for validating serum 25OHD concentrations as a “biomarker of effect” (see Chapter 1) for either an intermediate health endpoint (e.g., blood pressure) or disease (e.g., rickets or osteoporosis).
Others have also concluded that the usefulness of serum 25OHD level as an indicator of functional outcomes has not been demonstrated in many cases, with the possible exception of elderly people (Brannon et al., 2008). Further, Brannon et al. (2008) pointed out that the value of the measure appears to be most useful at the extremes of the range for detecting deficiency and toxicity, but may be less useful in the middle range and subject to confounders. Additionally, it has not been ruled out that vitamin D may act to produce health outcomes in a manner that is separate from circulating 25OHD levels and thereby function in a pathway different from that known for 25OHD. Currently there is no evidence confirming pathways not involving 25OHD, although their existence is plausible.
Nonetheless, serum 25OHD concentration is a useful measure for several reasons, not the least of which is that 25OHD has a long half-life in the circulation and its concentration is not under tight homeostatic control. It generally demonstrates a direct relationship with “exposure” or “supply” (i.e., dietary intake and cutaneous synthesis), although, as discussed in Chapter 3, the relationship is known to vary with factors ranging from body adiposity to aging and is also known to be curvilinear, with decreased response as intakes increase. Despite these caveats, serum 25OHD concentration is a useful biomarker of the supply of vitamin D available to target tissues in most situations (Prentice et al., 2008). It therefore is relevant as a stand-in for overall vitamin D nutriture, although distinguishing between
concentrations due to intake and those due to sun exposure is not possible for most studies.
The utility of serum 25OHD level as a biomarker of effect is less certain. Prentice et al. (2008) pointed out that the adequacy of the vitamin D supply in meeting functional requirements depends upon many factors, including the uptake of 25OHD by target cells, the rate of conversion of calcitriol and its delivery to target tissues, the expression and affinity of the VDR in target tissues, the responsiveness of cells to the activated VDR, and the efficiency of induced metabolic pathways.
Nonetheless, despite these uncertainties, serum 25OHD levels can be regarded as a useful tool in considering vitamin D requirements; in fact, such measures are virtually the only tool available at this time. As pointed out by AHRQ-Tufts, when a non-validated intermediate outcome must be considered, the implicit assumption is that it would have the properties of a validated surrogate outcome, and this assumption should be made explicit and the uncertainties identified. This is a reasonable approach and allows the appropriate inclusion of consideration of serum 25OHD concentrations for the purposes of specifying the potential indicator of bone health.
Relationship between calcium absorption and serum 25OHD level Ensuring desirable rates of calcium uptake from the intestinal lumen into the body—calcium absorption—is an important aspect of bone health. Because vitamin D is instrumental in calcium absorption, the relationship between vitamin D and calcium absorption is relevant to an indicator for bone health. The literature in this area focuses on fractional calcium absorption (i.e., fraction of a given dose of calcium that is absorbed) and its association with serum 25OHD level.
Although calcitriol has been shown to stimulate intestinal calcium absorption directly and calcitriol levels correlate with absorption, the understanding of the current relationship between 25OHD level and calcium absorption requires examination. Widely quoted as evidence of the threshold for maximal calcium absorption at serum 25OHD levels above 75 nmol/L is an analysis of results from three separate studies (Barger-Lux and Heaney, 2002; Bischoff et al., 2003; Heaney et al., 2003) as put forward by Heaney (2005). Less widely understood is the nature of the evidence from each of these studies and, thus, the limitations of this graphic analysis. In only one of these studies (Barger-Lux and Heaney, 2002) was calcium absorption directly measured using a single calcium isotope method; the difference between the lower (approximately 75 nmol/L) and higher (approximately 125 nmol/L) serum 25OHD levels was non-significant. Although the single-isotope method is considered less accurate than the dual-isotope method for measuring calcium absorption, this method is viewed as appropriate. The two values from the Barger-Lux and Heaney
(2002) study are the most reliable of the values in this analysis. Two additional values taken from Heaney et al. (2003) in this graphic analysis (at approximately 50 and 85 nmol/L) are not direct measures of calcium absorption, but instead are indirect pharmacokinetic measures based on the plasma calcium response to a 500 mg oral calcium load (Heaney et al., 2003). Thus, the committee found these values limited in their usefulness in this analysis. The remaining 25OHD level of a calcium absorption of 0.15 at serum 25OHD 29 nmol/L was taken from Bischoff et al. (2003). It does not represent either a direct or indirect measurement of calcium absorption, but was derived from measured urinary calcium excretion using subjects that did not reduce serum PTH while on calcium supplements (Heaney, 2005; personal communication, R. P. Heaney, Creighton University, Omaha, NE, August 25, 2009). This approach is not generally acceptable, and the committee could not consider the value to be valid. In conclusion, the portion of this analysis showing a rise in calcium absorption with an increase in 25OHD level from approximately 28 nmol/L to 80 or 90 nmol/L is unreliable, because the two values showing this rise either are not based on directly measured calcium absorption or are based on an unreliable method for estimating calcium absorption as discussed by Aloia et al. (2010) and as described below. The remaining two values, although reliable, are insufficient to determine the relationship of 25OHD level to calcium absorption, if any exists.
The gold standard for assessing fractional calcium absorption is to administer two calcium isotopes (one orally, one intravenously) under conditions in which blood and/or urine can be collected and assayed for both isotopes. Alternatively, calcium absorption can be assessed using a single isotope test, although results may be less precise. As discussed below, the data from studies published after the Heaney (2005) paper either do not show increased calcium absorption with higher levels of 25OHD or show only a very slight increase in calcium absorption as serum 25OHD level rises.
With respect to children, Abrams et al. (2009) performed dual-label calcium absorption studies in 251 children ranging from 4.9 to 16.7 years of age and found no effect of higher serum 25OHD level on fractional calcium absorption. In fact, children with 25OHD levels of 28 to 50 nmol/L had higher fractional calcium absorption than did children with 25OHD levels of 50 to 80 or greater than 80 nmol/L. Data from a 2008 study in girls (Weaver et al., 2008) indicated that serum 25OHD level did not predict net calcium absorption and retention. A study conducted in Nigeria (Thacher et al., 2009) demonstrated that in children with rickets, increases in serum 25OHD level did not coincide with increased fractional calcium absorption.
With respect to adults, there are a number of single-isotope studies of
interest. Need et al. (2008) studied fractional calcium absorption in 319 men (66 ± 10 years) with serum 25OHD levels less than 40 nmol/L. Fractional calcium absorption was 0.36 in men with the lowest quartile serum 25OHD levels (< 10 nmol/L) and rose significantly to 0.56 in the second quartile (11 to 20 nmol/L). No further change in fractional calcium absorption occurred with 25OHD levels of 21 to 30 or 31 to 40 nmol/L (Need et al., 2008). Kinyamu et al. (1998) performed a cross–sectional study of 376 healthy women (71 ± 4 years) and compared calcium absorption in those who took vitamin D supplements with that in non-supplemented women. Serum 25OHD level was significantly higher in women who took vitamin D (87.9 ± 28.2 nmol/L vs. 73.6 ± 23.0 nmol/L), whereas fractional calcium absorption did not differ between the two groups (Kinyamu et al., 1998). In addition, Devine et al. (2002) used a single isotope of calcium in a study of 120 older women and plotted a linear relationship between intestinal calcium absorption and serum 25OHD level. Intestinal calcium absorption rose from 35 percent at a mean serum 25OHD level of 15 nmol/L to 50 percent at 150 nmol/L. However, there were few data points at any serum 25OHD level, and an alternative fit to the data suggested an increase to 50 nmol/L and a plateau thereafter.
Hansen et al. (2008) studied 18 postmenopausal women before and after 15 days of supplementation with 50,000 IU of vitamin D2 daily. Serum 25OHD level rose markedly from 55 ± 10 nmol/L to 160 ± 53 nmol/L (p < 0.001), while fractional calcium absorption changed only modestly from 24 ± 7 percent at baseline to 27 ± 6 percent after vitamin D repletion (p < 0.04), indicating that the large rise in serum 25OHD levels was statistically significant, as was the small rise in intestinal calcium absorption. The 3 percent absolute increase in fractional calcium absorption was considered by the authors to be a minor increment given the large increase in serum 25OHD level (Hansen et al., 2008).
In a randomized controlled study, postmenopausal women with a mean baseline serum 25OHD level of 44 nmol/L receiving 1,000 mg of calcium citrate daily were randomized to daily placebo or 1,000 IU of vitamin D2 (Zhu et al., 2008a). Using a single-isotope method, this research group found a 36 nmol/L rise in serum 25OHD level and no increase in calcium absorption. This outcome is consistent with findings from their longer-term study (over 5 years), also demonstrating no rise in absorption (Zhu et al., 2008a). In both placebo and vitamin D groups, the calcium absorption decreased compared with baseline, most likely as a result of greater calcium intake (1 g calcium supplementation in both treatment arms). Also, Francis et al. (1996) found that 500 to 1,000 IU of vitamin D2 did not increase calcium absorption in elderly women. In a randomized double-blind controlled pilot trial in women (mean age = 57 years; dual-isotope method) with a baseline serum 25OHD level of 52 nmol/L, it was found that 400 IU
of vitamin D per day raised serum 25OHD level (by 14 nmol/L) and did not significantly increase calcium absorption compared with placebo.4
In a recent study, Aloia et al. (2010) performed a single-isotope assay of intestinal calcium absorption in 492 white and black women ages 20 to 80 years. They tested whether serum 25OHD or calcitriol level predicted the rate of intestinal calcium absorption in a multivariate model that included age, menopausal status, calcium intake, and other factors. The serum 25OHD levels ranged from 30 to 150 nmol/L, and were 51.62 ± 33.67 nmol/L overall or 32.87 ± 21.20 nmol/L in blacks and 67.73 ± 34.11 nmol/L in whites. Whereas calcitriol level was an important predictor of intestinal calcium absorption in the final model, 25OHD level had no effect. The authors concluded that serum 25OHD level is not an indicator of intestinal calcium absorption efficiency by itself, but 25OHD does interact at low levels with calcitriol to predict calcium absorption.
Overall, the data are mixed, but most studies show no increase in intestinal calcium absorption across a broad range of serum 25OHD levels. The single-isotope study by Need et al. (2008) indicates no increase in fractional calcium absorption above 20 nmol/L. The single-isotope studies by Heaney et al. (2003), Kinyamu et al. (1998), and Aloia et al. (2010) indicate no change in fractional calcium absorption across higher ranges of 25OHD levels—specifically, from 60 to 154 nmol/L in Heaney et al. (2003), from 50 to 116 nmol/L in Kinyamu et al. (1998), and from 30 to 150 nmol/L in Aloia et al. (2010). Others (Francis et al., 1996; Patel et al., 2001; Zhu et al., 2008a, b) demonstrate no effect on absorption of increasing the serum 25OHD concentrations by 14 to 36 nmol/L, whereas the Hansen et al. (2008) study indicates a 3 percent increase in absorption after raising the serum 25OHD level from 55 to 160 nmol/L in the short-term (15 days).
The data currently suggest that fractional calcium absorption reaches a maximum between 30 and 50 nmol/L in both children and adults. A value of 50 nmol/L allows for some uncertainty in the data and a buffer against seasonal and dietary variations in calciferol intake that, in turn, cause fluctuations in serum 25OHD levels.
Bone accretion Bone accretion resulting in bone growth and skeletal development occurs during the younger life stages. Measures of the amount of calcium needed to achieve normal bone accretion as well as the levels of vitamin D that support accretion are, therefore, relevant considerations. The topics of pregnancy and lactation among adolescent girls, who are still accruing bone tissue, are discussed in other sections below jointly with pregnancy and lactation among women.
Calcium retention levels Total body calcium at birth in healthy, full-term infants is approximately 30 g (Givens and Macy, 1933; Widdowson et al., 1951). Based on bone mineral accretion derived as a function of change in body weight, total body calcium increases to approximately 80 g by 1 year of age (Leitch and Aitken, 1959). This suggests an average accretion rate of approximately 140 mg calcium per day during the first year of life. This greatly exceeds the earlier accretion rate estimates, derived from cadaveric sources, of approximately 30 to 35 mg/day and 50 to 55 mg/day for infants through 4 months of age and 4 through 12 months of age, respectively (Fomon and Nelson, 1993; Koo and Tsang, 1997). Yet another mean accretion rate of approximately 80 mg/day during the first year of life has been derived using metacarpal morphometry data (Garn, 1972; Weaver, 1994). Resolution of these different values for usual accretion rate is not currently possible, but assessment of these data and the balance data suggests that a mean accretion rate of about 100 mg/day overall during the first year of life may serve as a reasonable approximation for primarily breast-fed infants (Abrams, 2010).
Information about bone accretion in young children is limited given the impracticalities associated with studies of young subjects. Lynch et al. (2007), using an isotope-based method, evaluated the relationship between calcium intake and balance in healthy children 1 to 4 years of age. They reported mean calcium retention of 161 mg/day with a mean calcium intake of 551 mg/day, reflecting a positive calcium balance. Linear and non-linear modeling indicated that calcium intakes of 470 mg/day yielded a calcium retention of 140 mg/day, consistent with the growth needs of this population (Lynch et al., 2007).
For slightly older children in the 7- to 8-year age range, the work by Abrams et al. (1999) has also demonstrated that the average calcium accretion rate is 140 mg/day5 calcium. A small increase is seen in late pre-puberty (Leitch and Aitken, 1959; Ellis et al., 1996), yielding a bone calcium accretion rate ranging from 140 to 160 mg/day across this age group, within which a small percentage will be pre-pubertal. Based on modeling, a curvilinear dose–response relationship between calcium intake and retention was made evident as shown in Figure 4-8.
A recent publication from Wu et al. (2010) that focused on Chinese American boys and girls 11 to 15 years of age reported calcium retention to be 1,100 mg/day in boys and 970 mg/day in girls, but these estimates were based on intakes to achieve maximal calcium retention as opposed to average calcium retention, the value needed to determine an EAR. A recent study of white children in Canada (Vatanparast et al., 2010) has provided bone calcium accretion levels for children and adolescents between the
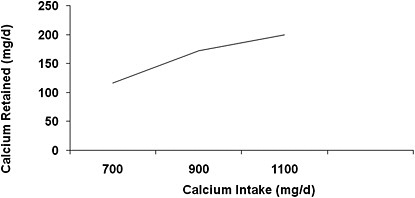
FIGURE 4-8 Dose–response relationship between calcium intake and retention.
SOURCES: Abrams et al. (1999); Ames et al. (1999).
ages of 9 and 18 years as shown in Table 4-14. The differences between girls and boys and between the 9- to 13-year and the 14- to 18-year age groups are small, but statistically significant. The data provide a basis for estimating intake levels needed for this age group relative to bone accretion.
Although it would be expected that bone maintenance is characteristic of young adults overall, there is some evidence of a small accretion of bone mass for persons in their 20s. The magnitude of this reported accretion varies. Specifically, Recker et al. (1992) followed 156 college-age women for 5 years and reported an increase of 12.4 percent per decade (about 1.24 percent per year) in whole-body BMC, but there were smaller increases in clinically relevant sites such as the forearm (4.8 percent per decade or 0.48 percent per year) and the lumbar spine (5.9 percent per decade or 0.59 percent per year). Further, the rate of increase declined each year for this group. The variance was also large in this study, which may be due to the method selected to assess BMC. Barger-Lux et al. (2005) more recently reported an accretion rate of 0.28 percent per year for women in the 20-
TABLE 4-14 Mean Bone Calcium Accretion for Three Age Groupings of Girls and Boys
|
Age (years) |
Mean Bone Calcium Accretion (mg/day) |
|
|
Girls |
Boys |
|
|
9–13 |
151 |
141 |
|
14–18 |
92 |
210 |
|
9–18 |
121 |
175 |
|
SOURCE: Vatanparast et al. (2010). |
||
to 30-year age range. This lower reported accretion rate is equivalent to a calcium accretion rate of only 6 mg/day. In addition to reporting only very small bone accretion for ages 19 through 30 years, Barger-Lux et al. (2005) also noted the possibility that there was no further effect on bone accretion above calcium intake levels of approximately 800 mg/day.
In short, bone accretion may continue during this early stage of adulthood, but at very low, almost indiscernible, levels. Interpretation of the data is further complicated by evidence from the Canadian Multicentre Osteoporosis Study (Berger et al., 2010), which demonstrates that attainment of peak bone mass depends upon which site is measured; peak bone mass is achieved by age 18 at some sites, but by age 25 or so at others. This newer population-based study is much larger than earlier studies, for example, Recker et al. (1992), and relies on the newer technique of DXA to estimate BMC. Tuck and Datta (2007) reported that maximal bone mass is attained in the second decade of life followed by a period of consolidation lasting 5 years, such that maximal levels are achieved in the early to mid 20s. Interestingly, peak trabecular bone mass is achieved earlier, at 15 to 18 years of age, is maintained for several years, and then begins to decline in young adulthood (Riggs et al., 2008).
Bone mineral content/bone mineral density: Calcium Measures of BMC and BMD in addition to calcium retention levels are also of interest as a measure of bone accretion. In a cross–sectional evaluation in 136 boys and men and 130 girls and women, including children beginning at the age of 4 years as well as adults through the age of 27 years, BMD of total body, lumbar spine, and femoral neck increased significantly with age until 17.5 years in boys and 15.8 years in girls (Lu et al., 1994). However, care must be taken in interpreting calcium intakes—specifically, calcium supplementation that results in total intakes above 1,500 mg/day for these groups—relative to BMC or BMD measures. Studies have suggested that increasing intakes of calcium in girls above their habitual intake of about 900 mg/day is associated with positive effects on bone mineral accretion and, in turn, BMD (Johnston et al., 1992; Lloyd et al., 1993; Chan et al., 1995). However, there is evidence that the bone mass gained through calcium or milk supplementation during childhood and adolescence is not retained post-intervention, suggesting that there is no benefit to intakes above that needed to ensure normal bone accretion (Fehily et al., 1992; Lee et al., 1996; Slemenda et al., 1997). A study conducted by Matkovic et al. (2004) evaluated BMD measures among female white adolescents 15 to 18 years of age in the United States, and reported that there was a positive influence of calcium supplementation and dairy products on BMD of the hip and forearm. The background level of calcium intake was approximately 833 mg/day, whereas the supplemented subjects had total calcium intakes of 1,586 mg/day. The Matkovic et al. (2004) study, however, did not follow
the subjects after the intervention ceased in order to determine whether the bone mass was retained. Overall, it would appear that levels of calcium intake consistent with levels established as supportive of bone accretion are associated with a normal, healthy increase in BMD. However, calcium intake levels above those consistent with established bone accretion rates appear to offer no meaningful benefit.
Bone mineral content/bone mineral density: Vitamin D Regarding vitamin D nutriture and very young children, virtually no data are available to link vitamin D intake or serum 25OHD level to bone accretion measures. However, for older children and adolescents, as described above, there was fair evidence from the AHRQ-Ottawa analyses of an association between 25OHD levels and baseline BMD and change in BMD or BMC indexes based on observational data. However, the results from the RCTs, as described above, did not confirm a consistent benefit on BMD or BMC across skeletal sites and age groups. Reasons for these differences may be due to the difficulty in controlling confounding variables for bone mass in observational studies.
Rickets Although consideration of rickets provides only a starting point for considering nutrient reference values, AHRQ-Ottawa, as described above, analyzed serum 25OHD concentrations in the context of the onset of rickets in children up to 5 years of age. It identified serum concentrations below 27.5 nmol/L as consistently associated with rickets. However, many of the relevant studies were from developing countries where dietary calcium intake is low; therefore, for these studies the onset of rickets was associated with higher levels of serum 25OHD, likely due to low calcium intakes. Specker et al. (1992) concluded that serum 25OHD concentrations of below 27 to 30 nmol/L place the infant at an increased risk for developing rickets, although they indicated that the measure is not diagnostic of the disease. It is worth noting that there is very limited evidence of rickets due to calcium deficiency in the face of vitamin D sufficiency (Abrams, 2002). The minimum calcium intake needed to prevent calcium-deficiency rickets has not been precisely identified, and the available studies (all outside North America) reflect varying levels at which calcium-deficiency rickets occurred. Levels of intake between 200 and 300 mg of calcium per day in infants and small children have been associated with risk for rickets in these cases (Abrams, 2002).
Calcium absorption and serum 25OHD As described above, life stages that experience bone accretion demonstrate a maximal calcium absorption associated with serum 25OHD levels of at least 30 nmol/L and closer to 40 to 50 nmol/L. Fractional calcium absorption does not appear to increase with serum 25OHD concentrations above 50 nmol/L. In addition, rickets in populations that are not calcium deficient does not occur until serum 25OHD levels drop below 30 nmol/L.
Summary of evidence for bone accretion In summary, average calcium retention (100 to 140 mg/day) during periods of bone accretion provide critical evidence to support the development of DRIs for calcium for these life stages using the factorial method as outlined in the 1997 DRI report (IOM, 1997), based on the average calcium retention, the specific age period, fractional calcium absorption rate, urinary calcium losses, and other small calcium losses. Data of good quality have been made available in the past 10 to 15 years for ages 1 through 18 for average bone mineral calcium accretion or retention; these can be used to determine the EAR and Recommended Dietary Allowance (RDA) for calcium for these age groups. BMC is of less utility for developing the DRIs for calcium, as noted above, but intakes of calcium that support average calcium accretion are also associated with normal healthy BMC/BMD.
Neither rickets nor calcium absorption is informative for establishing DRIs for calcium. During bone accretion, low serum 25OHD levels (< 30 nmol/L) are associated with increased risk of rickets when calcium intakes are not limiting. Further, fractional calcium absorption may be impaired at low serum 25OHD levels (< 30 nmol/L) and does not appear to be enhanced further above serum 25OHD above 50 nmol/L. Although the AHRQ-Ottawa report found fair evidence of an association between serum 25OHD levels and BMC/BMD based on observational data, results from the RCTs did not confirm a consistent benefit on BMC/BMD across skeletal sites and age groups.
Bone maintenance Whereas bone accretion ceases in early adulthood, bone continues to be remodeled throughout life. The goal—bone maintenance—is to provide adequate levels of calcium and vitamin D to support the process and maintain healthy bone and bone density. In turn, maintaining neutral calcium balance is the measure of interest—positive balance no longer occurs and negative calcium balance is to be avoided. In addition to highlighting the five key indicators relevant to bone maintenance, this section addresses pregnancy and lactation within the context of relevant indicators for DRI development.
Neutral calcium balance An important body of evidence is contributed by a recent comprehensive analysis of metabolic studies, as reported by Hunt and Johnson (2007). Their work not only offers solutions for some of the confounding associated with the interpretation of data from calcium balance studies, as discussed in Chapter 2, but also it provides new information on the levels of calcium associated with neutral calcium balance.
Participants in the Hunt and Johnson (2007) study included 73 women 20 to 75 years of age (average 47 years) and 82 men 19 to 64 years of age (average 28 years). The analysis included 19 feeding studies conducted at one site in a metabolic unit under carefully controlled conditions. Balance
data from the final 6 to 12 days of each dietary period were analyzed. For these studies, only healthy individuals participated, calcium intakes below and near the presumed required amounts were included, and adequate dietary adaptation was ensured by examining only dietary periods greater than or equal to 18 days. The statistical model used by Hunt and Johnson (2007) predicted neutral calcium balance at calcium intakes of 741 mg/day for healthy adults, regardless of age or gender. The upper limit of the 95 percent prediction interval around this estimate was 1,035 mg/day. Given the subjects, the outcomes are most readily applicable for adults up to the age of 50 years. These authors concluded that their data indicated tight control of calcium homeostasis in the range of typical calcium intakes and far above the point at which calcium balance is neutral (i.e., 741 mg/day). Moreover, they indicated that calcium balance is highly resistant to changes in calcium intake across a broad range of intakes—specifically, 414 to 1,740 mg/day, the approximate 25th and 99th percentiles from their studies.
Bone mineral density: Calcium In the case of female subjects, there are observational studies relating calcium intake to bone mass in premenopausal women, but virtually all are confounded by the absence of data on vitamin D (either intake or serum 25OHD concentrations) and factors such as physical activity and hormonal status. In addition, there are only two randomized trials of calcium supplementation and bone mass in women (and none in men) from the fourth to the sixth decade of life, despite the relative importance of this period for the maintenance of skeletal health. Thus, overall, little information specifically for BMD and calcium is available, and there is no evidence that levels above that needed for neutral calcium balance are beneficial. Needless to say there are no fracture studies, in part because of the relative rarity of osteoporotic fractures in this age group. However, BMD is considered predictive of future fracture risk.
One recent observational study of 300 premenopausal Greek women demonstrated that those who had calcium intakes above 800 mg per day and were physically active had higher ultrasound bone mass measurements than those with lower calcium intakes, regardless of physical activity level (Dionyssiotis et al., 2010). Furthermore, a 10-year observational study of 133 premenopausal Finnish women demonstrated that those with high calcium intake had less trochanteric BMC loss than those with lower intake (Uusi-Rasi et al., 2008). A recent observational study from Bischoff-Ferrari et al. (2009b) examined NHANES data and calcium intake against the incidence of hip BMD and serum 25OHD level among individuals without previous fractures across a wide age range. These authors found that among premenopausal women, a higher calcium intake was associated with greater BMD only for those women with a serum 25OHD level below 50 nmol/L. No such association was found for men. The methodologies do not indicate whether the authors applied the prescribed weighting factors
for NHANES data, which if not carried out could significantly impact the nature of the results.
Other observational data provide only marginal evidence to suggest that calcium intakes can have an impact on bone mass in men. One observational study of nearly 2,400 young Swedish men (mean age 18.4 years) suggested that physical activity level but not calcium intake was related to calcaneal BMD (Pettersson et al., 2010). Similarly, in a study of 131 men ages 20 to 75 years, calcium intake had no relationship to lumbar or femoral BMD at any age (Atalar et al., 2009). In the Amsterdam Growth and Health Longitudinal Study of 225 men 27 to 36 years of age during a 10-year period, calcium intake was not related to lumbar BMD. In contrast, in a study of 300 Greek men ages 18 to 30 years, only calcium intakes below 400 mg per day were associated with the lower BMD (Kyriazopoulous et al., 2006).
As mentioned, randomized trial data are few and underpowered. In one very small (n = 37) randomized trial of women 30 to 42 years of age, those who increased their dietary calcium intake by an average of 600 mg/day for 3 years exhibited no vertebral bone loss compared with the women with no calcium supplementation, who lost an average of 1 percent of their spine BMD per year (Baran et al., 1990). In another small randomized study of 300 women between 45 and 55 years of age who were considered “perimenopausal,” Elders et al. (1991) demonstrated that supplemental calcium at 1,000 mg/day over 2 years prevented a relatively small degree of bone loss in the spine compared with placebo-treated controls.
Bone mineral density: Vitamin D Regarding vitamin D and BMD measures, the AHRQ analyses incorporated largely studies that administered vitamin D in combination with calcium. Further, regarding the relationship between serum 25OHD levels and BMD measures for persons likely to be experiencing bone maintenance, very few studies for persons between the ages of 18 and 20 years were located. Regarding the intake of vitamin D with and without calcium supplementation, again most studies focused on postmenopausal women. In any case, bone density is known to vary among adults with age, gender, and race/ethnicity (Looker et al., 2009).
For studies of vitamin D nutriture and BMD, observational data are available. For example, Bischoff-Ferrari et al. (2009b) examined a cohort of men and women from NHANES III with average age of 47 years (20 to 69 years) and found that for both genders, there was a stepwise increase in BMD for higher serum 25OHD concentrations, even among individuals less than 50 years of age. The analysis is reported on the basis of cutoff point, and overall distributions were not provided; further it is not clear that the NHANES III sampling weights were applied. Van Dijk et al. (2009) studied vitamin D intake and BMD in 320 Dutch men and women at 36 years of age and found that vitamin D intake was positively associated with BMD
at all sites in men but not in women. AHRQ-Tufts reported inconsistent outcomes for the measures of BMD relative to serum 25OHD. In any case, observational data are best used when causality has been demonstrated by RCTs, which does not appear to be the case for BMD and serum 25OHD.
One recent RCT that focused on vitamin D measures included persons between the ages of 18 and 64 years, the period at which bone maintenance is paramount. Andersen et al. (2008) analyzed 89 women and 83 men separately; subjects were Pakistani immigrants living in Copenhagen, Denmark. The men and women were assigned to receive either a daily dose of 400 or 800 IU of vitamin D3 or placebo for 1 year. For women, the mean baseline dietary calcium intake was 495 mg/day, and mean serum 25OHD concentration was 12 nmol/L. For men, the mean baseline dietary calcium intake was 548 mg/day, and the mean serum 25OHD concentration was 21 nmol/L. At the end of the study, there was no significant difference in lumbar spine BMD changes regardless of the dose in both women or men.
Not unexpectedly, osteoporotic fractures are not a factor during the younger years of adulthood, a life stage not characterized by bone loss. In young adult women, stress fractures and overuse injuries in Navy recruits were examined in relation to calcium and vitamin D intake (Lappe et al., 2008). Supplementation with these two nutrients (2,000 mg of calcium per day and 800 IU of vitamin D per day) reduced the incidence of stress fractures. However, the generalizability of this study to the normal population is questionable.
Osteomalacia Recent data on osteomalacia are illuminating. A study conducted by Priemel et al. (2010) provides useful information on serum 25OHD levels and osteomalacia. Postmortem bone biopsies and measurement of serum 25OHD levels were performed in 675 individuals between 20 and 100 years of age. Subjects had been residing in Germany and died for reasons not related to cancer, metabolic disorders, or bone diseases. The mean age of the persons biopsied was 58.7 years for the 401 men, and 68.3 years for the 274 women. The authors noted that unlike PTH or calcium, serum 25OHD level has been found to be stable in various experiments for at least 10 days postmortem; one question is the extent to which serum 25OHD levels at one point in time (death) correlate with levels during adulthood. This is the largest study to date examining vitamin D (in the form of serum 25OHD) and undermineralization of bone as reflected by pathological accumulation of osteoid.
The Priemel et al. (2010) group defined a mineralization defect as a value of greater than or equal to 2 percent for the ratio of osteoid volume (i.e., bone matrix that is not mineralized) to total bone volume, referred to as OV/BV. The authors pointed out that, based on their findings, no subject experienced the defect at serum 25OHD levels of 75 nmol/L. That is, 100 percent of the population could be considered “covered” by a se-
rum 25OHD concentration of 75 nmol/L. However, this conclusion from Priemel et al. (2010) over-states the levels of 25OHD in serum consistent with population coverage akin to an RDA. The question for DRI development is not whether a maximal level provides benefit, but at what level can the vast majority of the population (97.5 percent) expect benefit.
The committee, therefore, examined the data provided in Panel D of Figure 4 (osteoid volume versus 25OHD scatterplot) from Priemel et al. (2010) in detail. Determination of the number of cases with serum 25OHD levels above 50 nmol/L and above 40 nmol/L was of interest. The number of data points above 50 nmol/L was counted by inspection of the data. At a serum 25OHD level of 50 nmol/L, there were seven data points reflecting persons who failed to achieve the prescribed bone mineralization (OV/BV > 2 percent). This suggested that a serum 25OHD level of 50 nmol/L met the needs of 99 percent of the persons in the study (that is, only 7 of 675 surpassed the measure). In fact, the analysis suggested that 97.5 percent of the population met the measure at a serum 25OHD level of approximately 45 nmol/L; however, as it could not be precisely calculated from the graphic, 50 nmol/L was selected to err on the side of caution. Thus, more than 97.5 percent of the cohort was protected from the defect (OV/BV of ≥ 2 percent) at a serum 25OHD concentration of 50 nmol/L. Further, it is noteworthy that a majority of subjects for whom serum 25OHD levels were below 40 nmol/L actually achieved adequate bone mineralization (OV/BV < 2 percent) as measured by this study. In fact, even at levels lower than 25 nmol/L more than half of the subjects were below the threshold defect measure. Premortem calcium intakes were not available, and this remains a limitation of this study. It is apparent that calcium intake is an important variable in bone mineralization. Calcium intake in children can prevent rickets even in the face of low serum 25OHD levels or in the genetic conditions of absent calcitriol (VDDR I) and absent VDR (VDDR II). From this unique data set of Priemel et al. (2010) it is likely that higher calcium intake in adults can have a positive impact on the skeleton even in the face of lower vitamin D levels. In this regard, the observational data from Bischoff-Ferrari et al. (2009b) using NHANES II, is also noted. In short, the indication is that higher calcium intakes can compensate for lower intestinal calcium absorption as a result of low serum 25OHD levels. Conversely, higher serum 25OHD levels cannot compensate for inadequate calcium intake.
Earlier observational studies from the UK (Leeds, Cardiff) and the United States (New York) histologically examined the hips of first-time hip fracture patients and found that 30 to 40 percent had proven osteomalacia in the fractured hip (Jenkins et al., 1973; Aaron et al., 1974; Sokoloff, 1978; Doppelt, 1984). Additional studies have found serum 25OHD levels to be significantly lower, PTH levels higher, and biochemical or histo-
logical evidence of osteomalacia more likely in patients with hip fracture than those without hip fracture (Hoikka et al., 1982; Lips et al., 1982; von Knorring et al., 1982; Wilton et al., 1987; Diamond et al., 1998; LeBoff et al., 1999). Osteomalacia was also seen on bone biopsy in about 4 to 5 percent of general medical and geriatric patients who had not suffered a fracture (Anderson et al., 1966; Stacey and Daly, 1989). Of 111 women with postmenopausal vertebral compression fractures attributed to osteoporosis, 8 percent had evidence of osteomalacia (Avioli, 1978). Overall, these data suggest that the contribution of osteomalacia to fragility may be more significant than previously realized: 30 to 40 percent of hip fractures may be due to frank osteomalacia not osteoporosis; the remaining 60 to 70 percent of hip fractures may represent a spectrum that includes earlier stages of osteomalacia/demineralization due to inadequate calcium/vitamin D as well as osteoporosis. These data may also explain why vitamin D supplementation was found to effectively prevent hip fractures in an elderly population (Chapuy et al., 1992): it could be healing various degrees of underlying osteomalacia in the hip.
Calcium absorption and serum 25OHD As described earlier, studies of serum 25OHD concentrations and calcium absorption in adults (mostly in postmenopausal women and older men) have suggested that adequate calcium absorption occurs in the range of 30 to 50 nmol/L serum 25OHD for most persons. Fractional calcium absorption generally does not appear to increase with serum 25OHD concentration levels above 50 nmol/L. In addition, osteomalacia as explored in one study is not found to be meaningfully present until levels of serum 25OHD are at least below 30 nmol/L.
POTENTIAL INDICATORS FOR PREGNANCY: CALCIUM For the majority of women, pregnancy comes at a period of life when the mother’s body is normally experiencing bone maintenance. Key physiological changes during pregnancy, mediated by hormonal action, assure delivery of adequate calcium to meet the needs of the fetus, as discussed earlier (e.g., Kovacs and Kronenberg, 1997; Prentice, 2003; and Kovacs, 2008). These key changes also affect the utility of the bone health indicators detailed above for assessing dietary calcium needs. Potential indicators for calcium requirements during pregnancy are discussed below.
-
Calcium absorption Absorption efficiency doubles during pregnancy in adults (Heaney and Skillman, 1971; Kent et al., 1991) and adolescents (O’Brien et al., 2003). Calcium absorption is, thus, informative in the DRI development for pregnancy.
-
Calcium balance Pregnant women are in positive calcium balance early in pregnancy as indicated by the measures of hypercalciuria and direct measurement (Heaney and Skillman, 1971). However,
-
the utility of calcium balance in DRI development in pregnancy is complex, because the positive calcium balance achieved early in pregnancy is reduced to a neutral calcium balance or a slightly negative calcium balance by term.
-
Maternal BMD/fetal BMC/maternal fracture risk Neither AHRQ-Ottawa nor AHRQ-Tufts addressed calcium and bone health in pregnancy. Bone turnover is modestly increased from as early as the first trimester, and the analysis concludes there is inconsistent evidence that BMD may decrease between prepartum and postpartum measurements, as discussed above.
Olausson et al. (2008) reported 1 to 4 percent decreases in whole-body, spine, and total hip BMC and BMD from before pregnancy to 2 weeks postpartum compared with a nonpregnant, non-lactating group, but calcium intake was not related to this skeletal change. Thus, it is conceivable that some calcium provided to the fetus derives from the maternal skeleton during pregnancy. Calcium supplementation among Gambian women with low calcium intakes (355 mg/day) during pregnancy resulted in significantly lower maternal hip BMC and BMD and greater loss of bone mineral in the lumbar spine and distal radius compared with that found in the placebo group (Jarjou et al., 2010). The rate of increase in whole-body BMC is also slower in the breast-fed offspring of calcium-supplemented women during the first year (Jarjou et al., 2006). These two RCTs suggest no benefit to the fetus and possibly an adverse effect on the mother and infant, at least in the short term, of calcium supplementation during pregnancy. Further, the majority of epidemiological and prospective studies report that parity is associated with a neutral or even a protective effect relative to maternal BMD or fracture risk later in life (Sowers, 1996; Kovacs and Kronenberg, 1997; O’Brien et al., 2003; Chantry et al., 2004).
Thus, additional calcium intake during pregnancy does not appear necessary for maternal or fetal bone health. Similarly, pregnant adolescents, who are in an active period of bone accretion, do not have impaired BMD or increased fracture risk as reported in observational and large cohort studies (Sowers et al., 1985, 1992; Fox et al., 1993; Sowers, 1996; Kovacs and Kronenberg, 1997; Chantry et al., 2004). Thus, maternal and fetal BMD/BMC and maternal fracture risk have utility as an indicator for DRI development for pregnant adults and adolescents.
-
Hypercalciuria Most pregnant women are hypercalciuric with typical intakes of calcium (Gertner et al., 1986; Dahlman et al., 1994; Cross et al., 1995; Seely et al., 1997). This suggests that increased intakes of calcium could aggravate hypercalciuria as well as the
-
inherent risk of kidney stones associated with pregnancy. Thus, hypercalciuria may be of some utility in DRI development, in that it indicates that dietary intake of calcium is more than adequate.
In sum, although no studies have directly explored levels of calcium intake sufficient for pregnant women, indirect measures suggest that the maternal calcium requirement is not increased over the non-pregnant state because of the physiological changes in calcium absorption and possibly, to some extent, bone turnover during pregnancy. The majority of epidemiological and long-term prospective studies that have examined the effect of parity on BMD, risk of osteoporosis, and incidence of fracture have found that parity is associated with a neutral or even a protective effect relative to these outcomes (Sowers, 1996; Kovacs and Kronenberg, 1997). In short, pregnancy does not impair long-term BMD or skeletal health of the mother.
POTENTIAL INDICATORS FOR PREGNANCY: VITAMIN D Key physiologic changes that occur in pregnancy to assure delivery of adequate calcium to meet fetal needs are relevant for DRI development. Potential indicators for vitamin D requirements during pregnancy are described below.
-
Calcium absorption Although the efficiency of calcium absorption doubles in pregnancy, evidence from studies in the Vdr-null mouse shows that this up-regulation occurs independently of vitamin D or calcitriol (Van Cromphaut et al., 2001; Fudge and Kovacs, 2010). Mechanistic evidence is not available from humans; indeed, if such data were available they would still be difficult to interpret because of the known concomitant physiological adaptations. Thus, this measure is not useful for an integrated bone health indicator for vitamin D in pregnancy.
-
Maternal, fetal, and childhood BMC/BMD Regarding biological plausibility, fetal calcium homeostasis, skeletal development, and bone mineralization appear independent of vitamin D, the VDR, and calcitriol, based on animal models, and human genetic mutations, as discussed above. Regarding AHRQ-Ottawa, this analysis identified three cohort studies and found insufficient evidence on the association of serum 25OHD levels with maternal BMD during pregnancy. No additional studies were identified addressing vitamin D and maternal BMD. One RCT (Delvin et al., 1986) found no effect of vitamin D supplementation on fetal calcium homeostasis. One observational study (Akcakus et al., 2006) reported no relationship between maternal 25OHD level and fetal BMC or BMD. A number of observational studies found normal fetal skeletal devel-
-
opment and mineral content (Maxwell and Miles, 1925; Congdon et al., 1983) and no radiological evidence of rickets at birth (Pereira and Zucker, 1986; Campbell and Fleischman, 1988; Specker et al., 1992; Specker, 1994; Beck-Nielsen et al., 2009) in severe vitamin D deficiency, or even in the absence of 1α-hydroxylase or the VDR (Silver et al., 1985; Takeda et al., 1997; Teotia and Teotia, 1997; Kitanaka et al., 1998; Bouillon et al., 2006). In contrast, four associational studies reported lower maternal serum 25OHD levels associated with craniotabes (Reif et al., 1988), lower tibia BMC and cross–sectional area, maternal serum 25OHD level below 42.6 nmol/L (Viljakainen et al., 2010), and higher fetal femur metaphyseal cross–sectional area and splaying (Mahon et al., 2010).
Regarding the developmental programming of later skeletal health in older offspring, one observational study, using 33 percent of the initial infants in a cohort, reported an association of lower whole-body and lumbar spine BMC and areal BMD at age 9 years in children whose mothers had low serum 25OHD levels late in gestation, even though no skeletal parameters differed at birth or nine months of age (Javaid et al., 2006). In offspring of mothers whose serum 25OHD levels late in gestation were less than 27.5 nmol/L or between 27.5 and 50.0 nmol/L, whole-body BMC was reduced compared with those whose mothers had serum 25OHD levels above 50.0 nmol/L. The definition of developmental programming as an indicator per se is questionable; in any case, the evidence for developmental programming of offspring skeletal health outcomes is insufficient to permit the committee to draw any conclusions, but it may be considered within the larger context of fetal skeletal BMD.
Although the congruence of the limited RCT data and majority of the observational data in humans suggests that fetal skeletal outcomes are not adversely affected by maternal vitamin D intake or serum 25OHD concentrations, fetal BMD and related skeletal outcomes may still be of some utility for DRI development. Little evidence could be identified for maternal BMD, making it unclear as to this measure’s utility for DRI development.
-
Neonatal rickets The AHRQ-Ottawa report included neonatal rickets infants 0 to 6 months of age and young children 1 to 6 years of age and found fair evidence for an association between low serum 25OHD levels and rickets identified as early as 2 months, but inconsistent evidence about the threshold level of 25OHD in serum above which rickets does not occur. AHRQ-Tufts identified no additional studies. Generally, the available observational studies do not report the development of vitamin D–deficiency rickets
-
until weeks or months after birth (Begum et al., 1968; Ford et al., 1973; Moncrieff and Fadahunsi, 1974; Sann et al., 1976; Pereira and Zucker, 1986; Park et al., 1987; Campbell and Fleischman, 1988; Specker, 1994; Teotia et al., 1995; Beck-Nielsen et al., 2009). Thus, neonatal rickets is of limited utility in the development of DRIs for pregnancy.
-
Maternal and cord blood 25OHD levels Regarding pregnancy outcomes, maternal and cord blood 25OHD levels may be of interest. AHRQ-Ottawa reported inconsistent evidence on changes in serum 25OHD levels during pregnancy, with two studies reporting no change and one study reporting a decline. In a few other studies, maternal serum 25OHD levels have responded to supplemental vitamin D (Marya et al., 1981, 1988; Mallet et al., 1986; Yu et al., 2009). In observational studies, babies born of vitamin D–deficient mothers have the lowest serum 25OHD levels and are at higher risk for complications sooner after birth than are babies born of vitamin D–replete mothers. Maternal serum 25OHD levels were stable and largely unaffected by pregnancy (Hillman et al., 1978; Brooke et al., 1980; Ardawi et al., 1997; Morley et al., 2006), even when the baseline serum 25OHD level was very low (20.1 ± 1.9 nmol/L) (Brooke et al., 1980).
Overall, fetal BMC and related skeletal outcomes are informative for DRI development for pregnancy.
POTENTIAL INDICATORS FOR LACTATION: CALCIUM The key physiological changes to meet the calcium demands of lactation occur through increased bone resorption, and most of the calcium in human milk comes from the maternal skeleton (Kalkwarf, 1999; Prentice, 2003; Kovacs, 2005; Kovacs and Kronenberg, 2008). Thus, lactation is a period of transient bone mineral loss and not, per se, a period of bone maintenance, although BMD is restored post-weaning (Kalkwarf, 1999). However, lactation is included in the category of bone maintenance in order to discuss pregnancy and lactation contiguously, and because bone mineral is restored in the immediate period post-lactation. Potential indicators related to calcium requirements during lactation are outlined below.
-
Maternal BMD The need to provide calcium to the infant—a need that is two to three times greater than the daily amount needed for fetal development during pregnancy—is met by the maternal adaptation of increased bone resorption (Specker et al., 1994; Kalkwarf et al., 1997), resulting in a 5 to 10 percent decline in BMD during the first 6 months of exclusive breastfeeding
-
(Kalkwarf et al., 1997). Neither of the AHRQ analyses addressed calcium and BMD during lactation. Both RCTs and observational studies indicate that increased dietary calcium intake does not suppress maternal bone resorption during lactation (Cross et al., 1995; Fairweather-Tait et al., 1995; Prentice et al., 1995; Kalkwarf et al., 1997; Laskey et al., 1998; Polatti et al., 1999) nor does it alter the calcium content of human milk (Kalkwarf et al., 1997; Jarjou et al., 2006). Further, the calcium content of human milk does not predict maternal BMD decline, but breast milk volume does (Laskey et al., 1998), although milk calcium content is known to vary within and between feeds, complicating interpretation. During the post-lactation period (6 to 12 months), maternal bone mineral is deposited; in turn, maternal BMD is restored to pre-lactation levels without any consistent evidence of a need for higher calcium intake compared with non-pregnant women (Sowers, 1996; Kovacs and Kronenberg, 1997; Kalkwarf, 1999). Two RCTs found no effect of calcium supplementation post-weaning (Cross et al., 1995; Prentice et al., 1995), although one RCT found a slightly greater (1.5 percent) increase in BMD in calcium-supplemented women post-weaning (Kalkwarf et al., 1997). Adolescents, like adults, resorb bone during lactation and recover fully afterward, with no evidence that lactation impairs achievement of peak bone mass (Chantry et al., 2004). Maternal BMD is therefore informative for DRI development.
-
Calcium balance Although calcium balance is negative during lactation owing to the enhanced bone resorption discussed above, mothers are restored to a positive balance and net accretion of bone mineral immediately upon cessation of lactation, followed by BMD restoration. Notably, urinary calcium excretion decreases during lactation. Thus, during lactation, higher calcium intakes will be less well tolerated and may not be needed, because higher calcium intake does not suppress bone loss. Calcium balance in lactation can be informative for DRI development.
Overall, available evidence indicates that the maternal calcium requirement is not increased during lactation, and it may also not be increased during the post-weaning interval in which the skeleton recovers to its pre-pregnancy baseline BMC.
POTENTIAL INDICATORS FOR LACTATION: VITAMIN D As noted above, lactation is a period of transient bone loss, but it is discussed here in order to consider pregnancy and lactation contiguously and because BMD is restored in
the post-lactation period. Potential indicators for vitamin D requirements during lactation are discussed below.
-
Maternal BMD AHRQ-Ottawa found good evidence from one cohort study that there is no association between serum 25OHD level and maternal BMD during lactation. No studies have examined what level of maternal vitamin D intake is required for the maternal skeleton to recover lost mineral content after lactation, although one observational study (Ghannam et al., 1999) in Saudi women found no relationship between maternal serum 25OHD levels (including levels consistent with hypovitaminosis D) and lumbar or femoral neck BMD. There is no evidence that lactating adolescents require any more vitamin D or higher serum 25OHD levels than non-lactating adolescents. Thus, maternal BMD is of limited use in DRI development for lactation.
-
Maternal and infant serum 25OHD levels Regarding lactation, maternal and infant serum 25OHD levels are of limited use given the present lack of consistent data. AHRQ-Tufts identified only one RCT, which it graded C (i.e., the report from Wagner et al., 2006), that found no effect of maternal supplemental vitamin D (6,400 IU) during lactation on infants’ weight or length. Eight other RCTs (Rothberg et al., 1982; Ala-Houhala, 1985; Ala-Houhala et al., 1988; Kalkwarf et al., 1996; Hollis and Wagner, 2004; Basile et al., 2006; Wagner et al., 2006; Saadi et al., 2007) suggest that maternal vitamin D supplementation increases maternal serum 25OHD levels but does not affect neonatal serum 25OHD levels unless the maternal intake of vitamin D is extremely high, in the range of 4,000 to 6,400 IU/day (Hollis and Wagner, 2004; Wagner et al., 2006). With respect to observational studies, maternal serum 25OHD levels are not affected by lactation (Kent et al., 1990; Sowers et al., 1998), although one study found an increase post-weaning (Cross et al., 1997). Observational studies (Cancela et al., 1986; Okonofua et al., 1987; Takeuchi et al., 1989; Kent et al., 1990; Alfaham et al. 1995; Sowers et al., 1998) also show little impact of maternal serum 25OHD levels. Thus, maternal and fetal serum 25OHD concentrations have limited utility for DRI development.
Summary of evidence for bone maintenance During bone maintenance, calcium intakes that maintain a neutral calcium balance have been recently elucidated in an important 2007 study (Hunt and Johnson, 2007) and are informative for the development of an EAR as well as an RDA. The relationship of calcium intake to BMD is more difficult to discern given the limited, and often contradictory observational data and relatively few and
small RCTs. There is little evidence that levels of calcium intake above that needed for neutral calcium balance are consistent with an improvement in BMD. Of note, the pregnancy-induced increase in fractional calcium absorption allows the needs of pregnancy to be met without an increase in calcium intake above normal requirements. Although it does result in bone resorption, lactation does not increase the risk of reduced BMD or osteoporosis.
Osteomalacia, as explored in one recent study, is not found to be meaningfully present until serum 25OHD levels are at or below at least 30 nmol/L and is rarely present when serum 25OHD levels are above 50 nmol/L, suggesting the possibility of a population distribution. Further, fractional calcium absorption is not additionally enhanced when serum 25OHD levels are above 50 nmol/L. Both osteomalacia and fractional calcium absorption are, thus, informative for the development of DRIs for vitamin D in periods of bone maintenance.
Finally, calcium and vitamin D requirements are not increased during pregnancy or lactation. Nor does vitamin D supplementation alter the development of the fetal, infant, or maternal skeletal health outcomes.
Bone loss A sustained bone loss is associated with the normal aging process and with menopause, as discussed in Chapter 2. The older adult loses bone at an estimated 1 percent per year (Sowers et al., 2010), although the rate of loss varies. The loss is abrupt for women at menopause and is quite rapid until approximately the sixth or seventh year after the onset of menopause. For men, bone loss begins later in life and generally declines steadily over time. Although neutral calcium balance is desired, the realities focus on reducing bone loss and mitigating the degree of negative calcium balance to the extent possible.
Calcium balance Bone loss is reflected by negative calcium balance, and ideally the degree of negative calcium balance would be reduced to the extent possible. Therefore, a reasonable starting point for considering the nutrient intake levels that may be relevant during the life stages associated with bone loss is information on calcium balance. However, relatively few data are available. The study conducted by Hunt and Johnson (2007), described previously, included a few older men up to the age of 64 years and some older women up to the age of 75 years. Specifically, information provided by the study authors6 indicated that there were 2 men and 34 women between 51 and 70 years of age and 4 women more than 70 years of age. The Hunt and Johnson (2007) analysis suggested that, overall, per-
sons of any age in the study achieved neutral calcium balance at calcium intakes of 741 mg/day.
Although these data may be relevant for the younger aging male, the Hunt and Johnson (2007) analysis may not be adequate for considering specific issues of bone loss due to aging among men; there were only two men in the age range of 51 to 70 years and no men over the age of 70 years in the analysis. Further, it is uncertain what proportion of women in the Hunt and Johnson (2007) study were menopausal, although approximately half were over the age of 50 years.
Heaney et al. (1977), in examining 130 Catholic nuns as part of a longitudinal study, reported that neutral calcium balance during the perimenopausal state for these women (between the ages of 35 and 50 years) was achieved at 1,240 mg/day. This intake is notably higher than that reported by Hunt and Johnson (2007). In a second study of the same group of women (n = 168), Heaney et al. (1978) reported that perimenopausal and estrogen-treated women reached neutral calcium balance with calcium intakes of 990 mg/day, whereas untreated postmenopausal women required 1,504 mg of calcium per day for neutral calcium balance. This suggests, in contrast to the findings of Hunt and Johnson (2007), that menopausal state may be relevant to considerations of calcium requirements. In any case, because the indicator of interest is bone health, other measures, such as bone density and fracture risk are also considered.
Bone mineral density and fracture risk: Calcium Fracture risk occurs in the later years of life and can be useful as an indicator of bone health, but fractures are less common in persons less than 70 years of age. Therefore, as an indicator, it is not particularly revealing as far as the effects of nutrient intake in slowing the bone loss of early menopause, when many women are in their 50s. It is also of questionable relevance to men less than 70 years of age who generally have yet to experience the full impact of bone loss due to aging. However, BMD measures are predictive of future fractures and can serve as a relevant indicator to ensure bone health to the extent possible during the onset of menopause and during the early aging process.
Regarding BMD measures and calcium intake among younger menopausal women, the AHRQ analyses are not specifically helpful in that the analyses used primarily studies that supplemented participants with both vitamin D and calcium, and neither AHRQ analysis addressed calcium alone relative to bone health. One report reviewed by AHRQ, which used a combination of calcium and vitamin D supplements, should be noted, especially given the large size of the cohort. The study (Jackson et al., 2006), stemming from the WHI, randomly assigned more than 36,000 post-menopausal women between the ages of 50 and 79 years (mean = 62 years) to a placebo or 1,000 mg of calcium with a supplement of 400 IU of vitamin D3. Fractures were ascertained during a period of about 7 years, and
BMD was measured for some of the subjects. On average, the background intake of these women provided a relatively high intake of calcium (average 1,150 mg/day), compared with that typically reported for the general population. With the addition of the supplement given as part of the study protocol, calcium intakes approached 2,150 mg/day. Overall, following the intervention, the authors found a small, but significant, improvement in hip BMD; however, the study did not demonstrate a reduction in hip fracture. This appears to be consistent with the understanding that fracture risk is less prevalent under the age of 70 years, particularly among persons 50 to 60 years of age. On the basis of age stratification, women 50 to 59 years of age showed a hazard ratio for hip fracture of 2.17, whereas the HR for women 60 to 69 years of age was 0.74. It is notable that the vitamin D supplementation was relatively low, thereby enhancing the ability to consider the effects of calcium per se. Under these conditions, there is the suggestion that calcium intakes of 2,150 mg/day increased BMD slightly compared with intakes of 1,150 mg/day (placebo with background diet). However, the calcium–vitamin D treatment was associated with an increased risk of kidney stones.
Several studies (Table 4-15) are noted in the context of examining the effect of calcium on BMD at times when menopause occurs or is on-going. As shown in the table, the data suggest mixed results. None measured the nature of the dose–response relationship. Some indicate benefit at lower levels of calcium intake, whereas others show no effect at higher levels of intake. The benefits vary by bone site, but not consistently; and lifestyle factors, such as exercise, appear to be related to outcome. However, the meta-analysis of Shea et al. (2002), which examined calcium supplementation with minimal vitamin D intake, suggested a relatively small, but consistent, effect of calcium supplementation on BMD in postmenopausal women, many of whom were less than 70 years of age. The authors reported that the inference that calcium increases bone density for this group was strengthened by the consistency of the findings across four sites of measurement, but pointed out that loss to follow-up and unexplained heterogeneity confounded the conclusions. In a study of free-living menopausal women that measured total body calcium (by neutral activation analysis), a retardation of bone loss in the femoral neck in early menopause was reported with a calcium intake of 1,700 mg/day (Aloia et al., 1994). However, the study protocol combined the calcium supplementation with 400 IU of vitamin D per day. In contrast, in some studies focused on reducing bone loss in menopausal women using various treatments including increased calcium intake, it was found that the retardation of bone loss with calcium intake was not equivalent to that associated with hormone replacement therapy, but also that it appeared to have minimal effect on retarding that compo-
TABLE 4-15 Intervention Studies of Interest: Calcium Supplementation (without Vitamin D) and Bone Mineral Density Among Menopausal Women < 71 Years of Age
nent of bone loss that was due to estrogen withdrawal (Riis et al., 1987; Dawson-Hughes et al., 1990).
Although the meta-analysis of Tang et al. (2007) concluded that in addition to fracture risk reduction, calcium supplementation was associated with a larger reduction in the rate of bone loss when the supplemented dose was 1,200 mg/day, the analysis included both men and women, many of whom were over the age of 70 years. Further, the authors noted that the regimen was most effective for persons who were quite elderly, lived in institutions, had low body weight, and had low calcium intakes at the time of the study. Such persons are likely different from the younger menopausal women undergoing the rapid bone loss associated with the early stages of menopause.
Taken as a whole, the evidence suggests some benefit for BMD/bone loss related to calcium intake, but the minimum level of intake that is effective is difficult to ascertain, because dose–response relationships were not examined and there were many confounding variables. Most studies added a large supplemental dose to existing background calcium intakes of approximately 700 to 800 mg/day. Therefore, the benefit has been studied at calcium intakes ranging from about 750 mg/day to 1,700 to 1,800 mg/day.
Bone loss becomes more characteristic of both genders as age increases, and the risk of osteoporotic fracture becomes more common, along with decreased bone density. Although most evidence for fractures focuses on women, fracture rate for men has also been studied and is of concern. Overall, the question is whether and at what levels calcium intake can mitigate or reduce fracture risk in older persons.
Relative to calcium intake alone, the meta-analysis offered by Tang et al. (2007) and discussed previously, provides some information. While all subjects were over 50 years of age, many were in the age range of 70 years and above. The results suggested benefit for BMD and fracture risk reduction relative to calcium in combination with vitamin D or calcium alone. However, the number of calcium-alone studies was small, and the vitamin D status of those in the trials was not always evident. The authors’ conclusion that a calcium intake of 1,200 mg/day was effective in demonstrating this benefit must be considered in light of the fact that most studies did not provide supplementation at lower levels, such as 1,000 mg/day.
Many of the same studies that were relevant at the time of the 1997 DRI review (IOM, 1997) remain relevant today, such as Chevalley et al. (1994) and Recker et al. (1996). The available studies in 1997 suggested that there was a favorable effect of calcium on reduction in fracture rate, but there were insufficient data to allow estimation of the magnitude of the impact of calcium intake on fracture rates. The Bischoff-Ferrari et al. (2007) meta-analysis of RCTs with calcium basically came to similar conclusions. In that paper, a summary of prospective cohort studies of calcium alone suggested
TABLE 4-16 Intervention Studies of Interest: Calcium Supplementation (without Vitamin D) and Fracture Risk and/or BMD in Persons > 70 Years of Age
no effect on non-vertebral fracture risk. However, in a pooled meta-analysis of five RCTs of calcium alone, the authors found that risk reduction was 8 percent (HR = 0.92 [95% CI: 0.81-1.05]) for non-vertebral fractures. This is consistent with the committee’s conclusion that calcium supplementation alone has a modest benefit for skeletal health, both in terms of increased
BMD and a suggestion of non-vertebral fracture risk reduction. Peacock et al. (2000) more recently reported no effect of calcium compared with placebo relative to hip BMD (see Table 4-16).
In summary, considering calcium alone, intakes at or above 1,200 mg/day, whether with supplements or diet, are not associated with a reduced fracture risk, although calcium supplementation can prevent bone loss from both the hip and spine in both young and older postmenopausal women. In contrast, there is evidence from several meta-analyses to suggest that sufficient calcium (≥ 1,200 mg/day) with vitamin D supplementation (800 IU/day) reduces fracture risk, particularly hip, in those over age 70 years and those institutionalized (Tang et al., 2007; Avenell et al., 2009b).
Bone mineral density and fracture risk: Vitamin D The vast majority of the studies that consider bone health and the issues of bone loss, BMD, and fracture risk contain protocols that administered a combination of vitamin D with calcium. These are well described in the AHRQ analyses, which focused on postmenopausal women and older men. AHRQ-Tufts concluded that there is good evidence that vitamin D3 plus calcium supplementation resulted in small increases in BMD of the spine, total body, femoral neck, and total hip. Based on included trials, it was less certain whether vitamin D3 supplementation alone has a significant effect on BMD. Two of the three relevant new RCTs identified by AHRQ-Tufts showed a significant increase in hip or total BMD in postmenopausal women, supplemented with vitamin D3 or vitamin D2 (300 or 1,000 IU/day, respectively) plus calcium (1,200 mg/day), compared with placebo. Only one of these three trials did not combine calcium supplementation with vitamin D supplementation. AHRQ-Ottawa concluded that supplementation with vitamin D (most studies used vitamin D3) plus calcium was effective in reducing fractures in institutionalized older populations, although the benefit in community-dwelling individuals was inconsistent. AHRQ-Tufts did not identify any new RCTs examining the combined effect of vitamin D plus calcium supplementation on fractures in postmenopausal women and older men. For vitamin D alone, the evidence was specified as inconsistent for a relationship with reduction in fracture risk. Three new RCTs identified by AHRQ-Tufts (Bunout et al., 2006; Burleigh et al., 2007; Lyons et al., 2007) did not show significant effects of either vitamin D2 or vitamin D3 (daily doses ranged from 400 to 822 IU) in reducing the risk of total fractures.
Avenell et al. (2009b) performed a meta-analysis comparing the effects of vitamin D alone with those of vitamin D plus calcium relative to fracture risk. In nine trials encompassing nearly 25,000 participants, vitamin D supplementation alone had no effect on risk reduction for hip, vertebral, or any fracture. In contrast, calcium plus vitamin D (typical intake range of 400 to 800 IU/day, but up to a high of 2,286 IU/day, as well as bolus doses
on a weekly basis) suggested a 16 percent risk reduction for hip fractures, particularly among institutionalized elders.
The meta-analysis conducted by Tang et al. (2007) did not consider the effect of vitamin D independently, but is nonetheless of interest. These authors analyzed 17 trials that used calcium or calcium in combination with vitamin D supplementation and reported fracture as an outcome, concluding that a supplementation of 800 IU of vitamin D per day or greater in combination with a calcium intake of at least 1,200 mg per day is more effective for fracture risk reduction than supplementation with less than 800 IU of vitamin D per day with the same level of calcium supplementation.
Another meta-analysis with fewer studies (Bischoff-Ferrari et al., 2009c) examined the prevention of non-vertebral fractures with vitamin D supplementation alone. These authors concluded that non-vertebral fracture rate is reduced with vitamin D supplementation in a dose-dependent manner. The analysis, however, has some limitations. First, it did not take into account baseline vitamin D intake, which could have been as high as 250 to 300 IU/day, as was noted in a cohort study of older women (Jackson et al., 2006). Second, their approach to defining a dose–response relationship included a sensitivity analysis, based on analysis of a subgroup of women identified as having been the most compliant in taking their supplement. Finally, the regression line that produced a 75 nmol/L threshold serum 25OHD level at which fractures were prevented used an x-axis with irregularly spaced intervals of serum 25OHD level from 50 to 80 nmol/L. With this confounding as a limitation on the utility of the data, the Bischoff-Ferrari et al. (2009c) analysis may support the possibility that vitamin D intakes of approximately 400 IU/day provide some level of benefit relative to fracture risk reduction.
Two recent RCTs are now available that were not considered in the AHRQ analyses. Sanders et al. (2010) treated nearly 2,300 women 70 years of age or older with either placebo or 500,000 IU of vitamin D once yearly for 3 years. The mean serum 25OHD level in the treated group at baseline was 49 nmol/L and rose at 1 month to 120 nmol/L. Remarkably, the risk of any fracture was 25 percent higher in the treated group than in the placebo group, primarily during the first 3 months of treatment. Salovaara et al. (2010) performed a recent 3-year randomized trial of 3,432 free-living Finnish postmenopausal women ages 65 to 71 years, testing the effects of 1,000 mg of calcium per day plus 800 IU of vitamin D per day on incident fractures. Baseline average calcium intake was the same for treatment and control groups, approximately 950 mg/day likewise, serum 25OHD levels were 50 nmol/L for each. After 3 years, the serum 25OHD level in the treated group was 75 nmol/L compared with 55 nmol/L in controls. There was no statistically significant effect of the combination of calcium and vitamin D on incident fractures at any site, although as with other studies,
there was a trend in overall fracture risk reduction for the treated group (adjusted HR = 0.83; 95% CI: 0.61–1.12).
Osteomalacia The data from Priemel et al. (2010) as examined by the committee have been discussed above in the section on bone maintenance. Given that this study included persons from 20 to 100 years of age, with a majority between 60 and 100 years of age, the information from the study is relevant to considerations of bone loss. As determined by the committee, nearly all persons were free of the measure of osteomalacia used in the study when serum 25OHD levels were above 50 nmol/L; a significant increase in the number of people displaying the mineralization defect was not observed until the serum 25OHD level had decreased below 30 nmol/L. A number of subjects continued to achieve adequate bone mineralization even at very low levels of 25OHD.
Calcium absorption and serum 25OHD level As described above, studies of serum 25OHD concentrations and calcium absorption in adults (most studies used postmenopausal women and older men) have suggested that ample calcium absorption occurs in the serum 25OHD concentration range of 30 to 50 nmol/L for most persons. Fractional calcium absorption generally does not appear to increase with serum 25OHD concentration above 50 nmol/L. In addition, osteomalacia as explored in one study, is not found to be meaningfully present until serum 25OHD levels are at least below 30 nmol/L 25OHD.
Integration of evidence for bone accretion, maintenance, and loss
Calcium The indicator of bone health for calcium depends on the stage of bone health: accretion, maintenance, or loss. For the accretion stage, average bone calcium accretion/retention is informative when combined with a factorial approach (IOM, 1997) to develop an EAR and calculate an RDA. During bone maintenance, neutral calcium balance maintains bone health. For the bone loss stage, integrating BMD with neutral calcium balance may provide additional information for women in the early menopausal period, as discussed above. For younger men entering the same life stage, neutral calcium balance maintains bone health. In later menopause and with aging, fracture risk integrated with the limited information on BMD is informative. Of special note is the pregnancy-induced increase in fractional calcium absorption that precludes an increased calcium requirement during pregnancy. The period of transient but notable bone mineral loss during lactation is not affected by calcium intake and is remedied within a short period post-lactation without increased calcium intake.
Vitamin D Specifying the indicator for vitamin D and bone health across the key stages of bone accretion, bone maintenance, and bone loss presents a challenge because of the limitations of the data and the desirable features of an indicator of effect. Serum 25OHD concentrations are
often reported for a range of outcomes of interest, making this indicator of “exposure” useful, even though it is not a validated intermediate indicator of effect. Potentially further complicating the specification of an indicator is the public health interest in developing a reference value that addresses bone health beyond the impact of classic vitamin D deficiency, such as rickets. Of note is that existing evidence does not suggest a unique role for vitamin D during pregnancy or lactation beyond that which it plays during non-pregnant and non-lactating states.
As the committee considered the limitations and variability of the evidence across the stages of bone accretion, bone maintenance, and bone loss, a strong congruence of several indicators of bone health—no one of which was sufficiently informative to serve as a basis for a reference value—emerged in relation to serum 25OHD levels and, thus, vitamin D exposure. Integrating these indicators—BMC/BMD, fractional calcium absorption, rickets, osteomalacia, and fracture risk—revealed, as can be seen in the conceptual model in Figure 4-9, an increase in risk of rickets or osteomalacia, impaired fractional calcium absorption, and fractures in older persons when serum 25OHD levels were low, and no apparent benefit for these
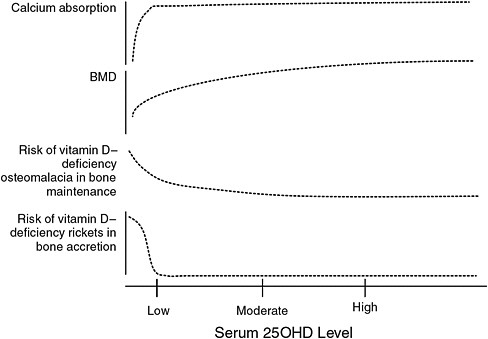
FIGURE 4-9 Conceptualization of integrated bone health outcomes and vitamin D exposure.
measures when serum 25OHD levels were higher. At moderate levels of serum 25OHD, risk was variable, depending on the specific measure. Collectively, however, the integration of these indicators, if used for DRI development, would support the development of an EAR within this moderate range in which risk for one or more of these bone health indicators may be increased in approximately 50 percent of the healthy population, but reduced in the remaining 50 percent of the population. Illustrated, then, in the companion Figure 4-10 is the consistency of this integrated conceptual model with the classical requirement distribution, or, more specifically, with a marker of exposure. As this is a conceptual model, specific values are not assigned in this figure for “low,” “moderate,” and “high.”
CONSIDERATIONS RELATED TO AFRICAN AMERICAN ANCESTRY
As a result of their greater skin pigmentation, African Americans as well as other dark-skinned groups have lower serum 25OHD concentrations throughout life—as discussed in the section below. However, despite lower serum 25OHD concentrations, African Americans have a superior “calcium economy” compared with whites in North America and have less risk for osteoporosis and fracture (Cohn et al., 1977; Anderson and Pollitzer, 1994; Bell et al., 1995; Aloia et al., 1996b, 1999, 2000; Finkelstein et al., 2002; Barrett-Connor et al., 2005; Cauley et al., 2005a; Tracy et al., 2006). Racial/ethnic differences have been sought to explain the paradox
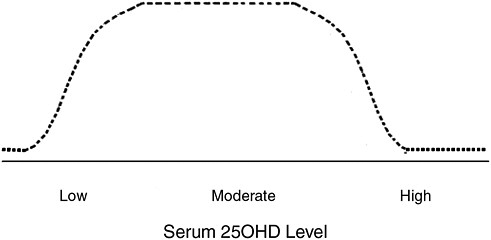
FIGURE 4-10 Theoretical distribution of serum 25OHD level in healthy populations based on integrated bone health outcomes.
of a decreased incidence of osteoporosis in the presence of lower serum 25OHD levels (Aloia, 2008).
Initially, there is an important caution in considering available data. For many comparative studies, the derivation of the assignment of “race” is not clear. Detailed ancestry is not included in most studies, and socio-economic characteristics of the ethnic groups are not described. Usually, no genetic data are collected. When the approach has been to consider social and behavioral variables in relation to a single ethnic group, there have been studies suggesting that there is considerable variability in the black ethnic group (Melton et al., 2002; Nelson et al., 2004; Thandrayen et al., 2009). For instance, spinal BMD is lower in recent Sudanese immigrants than in African Americans or whites (Gong et al., 2006). Thus, our interpretation of studies considering bone health in Americans of African heritage must be approached with caution. Moreover, the search for genomic explanations for bone mass variability has thus far not been rewarding (Fleet et al., 1995; Harris et al., 1997; Zmuda et al., 1997, 1999, 2003; Koller et al., 2000; Nelson et al., 2000; Peacock et al., 2002; Gong and Haynatzki, 2003; Edderkaoui et al., 2007; Shaffer et al., 2007; Wang et al., 2007; Engelman et al., 2008; Foroud et al., 2008; Eisman, 2010).
In any case, numerous studies have demonstrated that bone mass is higher in African Americans throughout the life cycle (Cohn et al., 1977; Li et al., 1989; Luckey et al., 1989; Bell et al., 1991; Gilsanz et al., 1991;
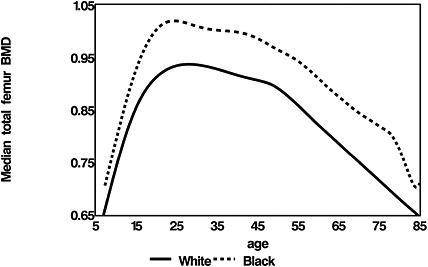
FIGURE 4-11 Bone density of the femur in the black and white population.
SOURCE: Aloia, 2008. Reprinted with permission from the American Journal of Clinical Nutrition (2008; volume 88: 545S-550S), American Society for Nutrition.
Kleerekoper et al., 1994; Nelson et al., 1995, 1997; Aloia et al., 1996a, 1997). The evidence is illustrated in Figure 4-11, using data from one study (Kalkwarf et al., 2007). The advantage in bone mass is associated with one-half the prevalence of osteoporosis and one-half the fracture risk of whites (Barrett-Connor et al., 2005). Longitudinal BMD studies demonstrate that this skeletal advantage for African Americans is present before 6 years of age and increases during adolescence, a stage when the skeleton accrues 50 percent of its peak bone mass (Li et al., 1989; Gilsanz et al., 1991; Cromer et al., 2004; Kalkwarf et al., 2007). The skeletal advantage developed during adolescence is maintained throughout adult life, with African Americans having the same pattern of bone loss as whites in each life stage but at a slower rate (Meier et al., 1992; Bryant et al., 2003; Cauley et al., 2005b; Looker et al., 2009).
However, the Study of Osteoporotic Fractures has also demonstrated that for any given bone density value the risk for fracture is less in African Americans, indicating that bone mass is not the only protective factor against fracture (Cauley et al., 2005a). Other possible factors are lower bone turnover, the micro-architecture of bone, bone geometry, body composition, and heredity (Weinstein and Bell, 1988; Schnitzler et al., 1990; Faulkner et al., 1993; Cummings et al., 1994; Han et al., 1996; Wang et al., 1997; Nelson et al., 2000; Gundberg et al., 2002; Hanlon et al., 2002; Faulkner et al., 2005; Schnitzler and Mesquita, 2006; Travison et al., 2008). Bone biopsies in African Americans show an advantageous architecture with more osteocytes and a lower bone formation rate (Parfitt et al., 1997; Parisien et al., 1997; Qiu et al., 2006).
African American girls have higher calcium absorption efficiency, presumably because of their higher calcitriol levels, and lower urinary calcium excretion compared with white girls (Abrams et al., 1995; Bryant et al., 2003; Harkness and Cromer, 2005; Braun et al., 2007; Weaver et al., 2008) (Figure 4-12). There is no threshold for calcium retention at calcium intakes up to 2,000 mg/day, leading to the conclusion that calcium requirements should be the same in the two races.
African American adults retain superior renal calcium conservation and generally have higher serum PTH and calcitriol levels and lower urinary calcium excretion (Bell et al., 1985; Meier et al., 1991; Dawson-Hughes et al., 1993; Kleerekoper et al., 1994; Harris et al., 2000; Aloia et al., 2006a, b; Cosman et al., 2007). Skeletal resistance to PTH is also present in adult African Americans, demonstrated by lower bone turnover despite elevated PTH levels and by resistance of bone resorption to PTH infusion (Aloia et al., 1996a; Cosman et al., 1997; Han et al., 1997, 1999).
Older African Americans—similar to older persons in other population groups in the United States and Canada—develop secondary hyperparathyroidism and accelerated bone turnover and bone loss, but it is
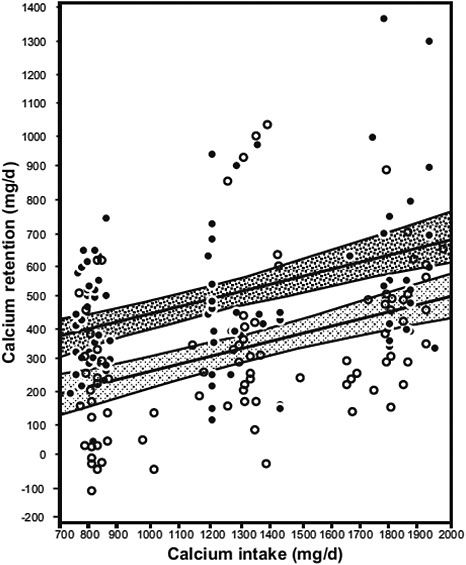
FIGURE 4-12 Mean calcium retention and 95% CIs for regression lines across different calcium intakes, by race. The darker shading represents African American girls (![]() , 84 observations in 55 girls), and the lighter shading represents white girls (
, 84 observations in 55 girls), and the lighter shading represents white girls (![]() , 98 observations in 66 girls).
, 98 observations in 66 girls).
SOURCE: Braun et al., 2007. Reprinted with permission from the American Journal of Clinical Nutrition (2007, volume 85, pages 1657-63), American Society for Nutrition.
unknown if this is attenuated by increasing calcium or vitamin D intake (S. S. Harris et al., 2001; Cauley et al., 2005b; Tracy et al., 2005). There is limited information on the effect of calcium and vitamin D supplements on bone mass or fracture in older subjects, because African Americans have usually not been included in clinical trials in meaningful numbers. A 3-year randomized, double-blind, placebo-controlled vitamin D3 intervention in postmenopausal black women showed no difference in rate of bone loss between treatment and control groups (Aloia et al., 2005). There was also no relationship between serum 25OHD and rates of bone loss. The WHI did include African American subjects, who took part in a calcium plus vitamin D trial. Hip fracture risk was not reduced by the intervention (Jackson et al., 2006). Changes in bone density in this trial were adjusted for race, but separate analyses by race for the positive outcome on BMD of the hip were not provided. However, a more recent meeting presentation using data from the WHI Observational Study (Cauley et al., 2009) has revealed the concerning finding that fracture risk was directly related to serum 25OHD level in the African American subgroup.
Thus, although the available, emerging evidence would suggest that there is perhaps a lower requirement for calcium and vitamin D among African Americans relative to ensuring bone health, at least compared with whites, there is a notable lack of high-quality and convincing evidence to act on this possibility or to set different requirements for persons of African American ancestry. See Chapter 6 for discussions related to race/ethnicity and estimation of the Tolerable Upper Intake Levels (ULs) for vitamin D.
SELECTION OF INDICATORS
As described in Chapter 1, following the examination of the relevance and quality of the data for the potential indicators of interest, the next step in the DRI development process is to select the indicator or indicators to be used for estimating average requirements or EARs, in this case for calcium and vitamin D. Overall, the selection of indicators is evidence-based; indicators for levels of dietary adequacy are selected based on the strength and quality of the evidence and their demonstrated public health significance, taking into consideration sources of uncertainty in the evidence.
The indicator of bone health is selected as to form the basis of the DRIs for calcium and vitamin D for all life stage groups. With the exception of measures related to bone health, the potential indicators examined are currently not associated with evidence that could be judged either compelling or sufficient in terms of cause and effect, nor informative regarding dose–response relationships for the purposes of determining nutrient requirements. Cancer/neoplasms, cardiovascular disease and hypertension, diabetes and metabolic syndrome, falls and physical performance, im-
mune functioning and autoimmune disorder, infections, neuropsychological functioning, and preeclampsia could not be causally linked reliably or consistently with relevant outcomes as a function of calcium or vitamin D intake. Although the conclusions at this time do not preclude the possibility that future studies may specify the existence of such relationships, they are currently best described as hypotheses of emerging interest, and the conflicting nature of the available evidence means that it cannot be used to establish a positive impact on health outcomes with any level of confidence.
REFERENCES
Aaron, J. E., J. C. Gallagher, J. Anderson, L. Stasiak, E. B. Longton, B. E. Nordin and M. Nicholson. 1974. Frequency of osteomalacia and osteoporosis in fractures of the proximal femur. Lancet 1(7851): 229-33.
Abbasi, A. A., J. K. Chemplavil, S. Farah, B. F. Muller and A. R. Arnstein. 1979. Hypercalcemia in active pulmonary tuberculosis. Annals of Internal Medicine 90(3): 324-8.
Abrahams, B. S. and D. H. Geschwind. 2008. Advances in autism genetics: on the threshold of a new neurobiology. National Review of Genetics 9(5): 341-55.
Abrams, S. A., K. O. O’Brien, L. K. Liang and J. E. Stuff. 1995. Differences in calcium absorption and kinetics between black and white girls aged 5-16 years. Journal of Bone and Mineral Research 10(5): 829-33.
Abrams, S. A., K. C. Copeland, S. K. Gunn, J. E. Stuff, L. L. Clarke and K. J. Ellis. 1999. Calcium absorption and kinetics are similar in 7- and 8-year-old Mexican-American and Caucasian girls despite hormonal differences. Journal of Nutrition 129(3): 666-71.
Abrams, S. A. 2002. Nutritional rickets: an old disease returns. Nutrition Reviews 60(4): 111-5.
Abrams, S. A., I. J. Griffin, K. M. Hawthorne, S. K. Gunn, C. M. Gundberg and T. O. Carpenter. 2005. Relationships among vitamin D levels, parathyroid hormone, and calcium absorption in young adolescents. Journal of Clinical Endocrinology and Metabolism 90(10): 5576-81.
Abrams, S. A., P. D. Hicks and K. M. Hawthorne. 2009. Higher serum 25-hydroxyvitamin D levels in school-age children are inconsistently associated with increased calcium absorption. Journal of Clinical Endocrinology and Metabolism 94(7): 2421-7.
Abrams, S. A. 2010. Calcium absorption in infants and small children: methods of determination and recent findings. Nutrients 2(4): 474-80.
Adams, J. S., R. L. Modlin, M. M. Diz and P. F. Barnes. 1989. Potentiation of the macrophage 25-hydroxyvitamin D-1-hydroxylation reaction by human tuberculous pleural effusion fluid. Journal of Clinical Endocrinology and Metabolism 69(2): 457-60.
Ahonen, M. H., L. Tenkanen, L. Teppo, M. Hakama and P. Tuohimaa. 2000. Prostate cancer risk and prediagnostic serum 25-hydroxyvitamin D levels (Finland). Cancer Causes and Control 11(9): 847-52.
AHRQ. 2007. Methods reference guide for effectiveness and comparative effectiveness reviews, Version 1.0. Rockville, MD: Agency for Healthcare Research and Quality.
Aihara, K., H. Azuma, M. Akaike, Y. Ikeda, M. Yamashita, T. Sudo, H. Hayashi, Y. Yamada, F. Endoh, M. Fujimura, T. Yoshida, H. Yamaguchi, S. Hashizume, M. Kato, K. Yoshimura, Y. Yamamoto, S. Kato and T. Matsumoto. 2004. Disruption of nuclear vitamin D receptor gene causes enhanced thrombogenicity in mice. Journal of Biological Chemistry 279(34): 35798-802.
Akcakus, M., E. Koklu, N. Budak, M. Kula, S. Kurtoglu and S. Koklu. 2006. The relationship between birthweight, 25-hydroxyvitamin D concentrations and bone mineral status in neonates. Annals of Tropical Paediatrics 26(4): 267-75.
Akesson, A., M. Vahter, M. Berglund, T. Eklof, K. Bremme and P. Bjellerup. 2004. Bone turnover from early pregnancy to postweaning. Acta Obstetrica et Gynecologica Scandinavica 83(11): 1049-55.
Ala-Houhala, M. 1985. 25-hydroxyvitamin D levels during breast-feeding with or without maternal or infantile supplementation of vitamin D. Journal of Pediatric Gastroenterology and Nutrition 4(2): 220-6.
Ala-Houhala, M., T. Koskinen, M. Koskinen and J. K. Visakorpi. 1988. Double blind study on the need for vitamin D supplementation in prepubertal children. Acta Paediatrica Scandinavica 77(1): 89-93.
Al-Delaimy, W. K., E. Rimm, W. C. Willett, M. J. Stampfer and F. B. Hu. 2003. A prospective study of calcium intake from diet and supplements and risk of ischemic heart disease among men. American Journal of Clinical Nutrition 77(4): 814-8.
Alexianu, M. E., E. Robbins, S. Carswell and S. H. Appel. 1998. 1Alpha, 25 dihydroxyvitamin D3-dependent up-regulation of calcium-binding proteins in motoneuron cells. Journal of Neuroscience Research 51(1): 58-66.
Alfaham, M., S. Woodhead, G. Pask and D. Davies. 1995. Vitamin D deficiency: a concern in pregnant Asian women. British Journal of Nutrition 73(6): 881-7.
Allen, J. C., R. P. Keller, P. Archer and M. C. Neville. 1991. Studies in human lactation: milk composition and daily secretion rates of macronutrients in the first year of lactation. American Journal of Clinical Nutrition 54(1): 69-80.
Al-oanzi, Z. H., S. P. Tuck, N. Raj, J. S. Harrop, G. D. Summers, D. B. Cook, R. M. Francis and H. K. Datta. 2006. Assessment of vitamin D status in male osteoporosis. Clinical Chemistry 52(2): 248-54.
Aloia, J. F., A. Vaswani, J. K. Yeh, P. L. Ross, E. Flaster and F. A. Dilmanian. 1994. Calcium supplementation with and without hormone replacement therapy to prevent postmenopausal bone loss. Annals of Internal Medicine 120(2): 97-103.
Aloia, J. F., A. Vaswani, R. Ma and E. Flaster. 1996a. Body composition in normal black women: the four-compartment model. Journal of Clinical Endocrinology and Metabolism 81(6): 2363-9.
Aloia, J. F., A. Vaswani, J. K. Yeh and E. Flaster. 1996b. Risk for osteoporosis in black women. Calcified Tissue International 59(6): 415-23.
Aloia, J. F., A. Vaswani, R. Ma and E. Flaster. 1997. Comparison of body composition in black and white premenopausal women. Journal of Laboratory and Clinical Medicine 129(3): 294-9.
Aloia, J. F., A. Vaswani, M. Mikhail and E. R. Flaster. 1999. Body composition by dual-energy X-ray absorptiometry in black compared with white women. Osteoporosis International 10(2): 114-9.
Aloia, J. F., A. Vaswani, M. Feuerman, M. Mikhail and R. Ma. 2000. Differences in skeletal and muscle mass with aging in black and white women. American Journal of Physiology, Endocrinology, and Metabolism 278(6): E1153-7.
Aloia, J. F., S. A. Talwar, S. Pollack and J. Yeh. 2005. A randomized controlled trial of vitamin D3 supplementation in African American women. Archives of Internal Medicine 165(14): 1618-23.
Aloia, J. F., M. Feuerman and J. K. Yeh. 2006a. Reference range for serum parathyroid hormone. Endocrinology Practice 12(2): 137-44.
Aloia, J. F., S. A. Talwar, S. Pollack, M. Feuerman and J. K. Yeh. 2006b. Optimal vitamin D status and serum parathyroid hormone concentrations in African American women. American Journal of Clinical Nutrition 84(3): 602-9.
Aloia, J. F. 2008. African Americans, 25-hydroxyvitamin D, and osteoporosis: a paradox. American Journal of Clinical Nutrition 88(2): 545S-50S.
Aloia, J. F., D. G. Chen, J. K. Yeh and H. Chen. 2010. Serum vitamin D metabolites and intestinal calcium absorption efficiency in women. American Journal of Clinical Nutrition 92(4): 835-40.
Ames, S. K., K. J. Ellis, S. K. Gunn, K. C. Copeland and S. A. Abrams. 1999. Vitamin D receptor gene Fok1 polymorphism predicts calcium absorption and bone mineral density in children. Journal of Bone and Mineral Research 14(5): 740-6.
Amling, M., M. Priemel, T. Holzmann, K. Chapin, J. M. Rueger, R. Baron and M. B. Demay. 1999. Rescue of the skeletal phenotype of vitamin D receptor-ablated mice in the setting of normal mineral ion homeostasis: formal histomorphometric and biomechanical analyses. Endocrinology 140(11): 4982-7.
Andersen, R., C. Molgaard, L. T. Skovgaard, C. Brot, K. D. Cashman, J. Jakobsen, C. Lamberg-Allardt and L. Ovesen. 2008. Effect of vitamin D supplementation on bone and vitamin D status among Pakistani immigrants in Denmark: a randomised double-blinded placebo-controlled intervention study. British Journal of Nutrition 100(1): 197-207.
Anderson, I., A. E. R. Campbell, A. Dunn and J. B. M. Rumciman. 1966. Osteomalacia in elderly women. Scottish Medical Journal 11: 429-35.
Anderson, J. J. and W. S. Pollitzer. 1994. Ethnic and genetic differences in susceptibility to osteoporotic fractures. Advances in Nutritional Research 9: 129-49.
Anderson, F. H., H. E. Smith, H. M. Raphael and et al. 2004. Effect of annual intramuscular vitamin D3 supplementation on fracture risk in 9440 community-living older people: the Wessex fracture prevention trial. [Abstract] ASBMR 26th Annual Meeting. Presentation #1220 10/5/2004.
Anderson, L. N., M. Cotterchio, R. Vieth and J. A. Knight. 2010. Vitamin D and calcium intakes and breast cancer risk in pre- and postmenopausal women. American Journal of Clinical Nutrition 91(6): 1699-707.
Annweiler, C., A. M. Schott, M. Montero-Odasso, G. Berrut, B. Fantino, F. R. Herrmann and O. Beauchet. 2010. Cross–sectional association between serum vitamin D concentration and walking speed measured at usual and fast pace among older women: The EPIDOS study. Journal of Bone and Mineral Research 25(8): 1858-66.
Apperley, F. 1941. The relation of solar radiation to cancer mortality in North America. Cancer Research 1: 191-5.
Ardawi, M. S., H. A. Nasrat and B. A. A. HS. 1997. Calcium-regulating hormones and parathyroid hormone-related peptide in normal human pregnancy and postpartum: a longitudinal study. European Journal of Endocrinology/European Federation of Endocrine Societies 137(4): 402-9.
Arden, N. K., P. Major, J. R. Poole, R. W. Keen, S. Vaja, R. Swaminathan, C. Cooper and T. D. Spector. 2002. Size at birth, adult intestinal calcium absorption and 1,25(OH)(2) vitamin D. Quarterly Journal of Medicine 95(1): 15-21.
Arnaud, S. B., G. B. Stickler and J. C. Haworth. 1976. Serum 25-hydroxyvitamin D in infantile rickets. Pediatrics 57(2): 221-5.
Aspray, T. J., L. Yan and A. Prentice. 2005. Parathyroid hormone and rates of bone formation are raised in perimenopausal rural Gambian women. Bone 36(4): 710-20.
Atalar, E., G. Aydin, I. Keles, E. Inal, G. Zog, A. Arslan and S. Orkun. 2009. Factors affecting bone mineral density in men. Rheumatology International 29(9): 1025-30.
August, P., B. Marcaccio, J. M. Gertner, M. L. Druzin, L. M. Resnick and J. H. Laragh. 1992. Abnormal 1,25-dihydroxyvitamin D metabolism in preeclampsia. American Journal of Obstetrics and Gynecology 166(4): 1295-9.
Avenell, A., J. A. Cook, G. S. MacLennan and G. C. McPherson. 2009a. Vitamin D supplementation and type 2 diabetes: a substudy of a randomised placebo-controlled trial in older people (RECORD trial, ISRCTN 51647438). Age and Ageing 38(5): 606-9.
Avenell, A., W. J. Gillespie, L. D. Gillespie and D. O’Connell. 2009b. Vitamin D and vitamin D analogues for preventing fractures associated with involutional and post-menopausal osteoporosis. Cochrane Database of Systematic Reviews(2): CD000227.
Avioli, L. V. 1978. What to do with “postmenopausal osteoporosis?”. American Journal of Medicine 65(6): 881-4.
Baas, D., K. Prufer, M. E. Ittel, S. Kuchler-Bopp, G. Labourdette, L. L. Sarlieve and P. Brachet. 2000. Rat oligodendrocytes express the vitamin D(3) receptor and respond to 1,25-dihydroxyvitamin D(3). Glia 31(1): 59-68.
Baeksgaard, L., K. P. Andersen and L. Hyldstrup. 1998. Calcium and vitamin D supplementation increases spinal BMD in healthy, postmenopausal women. Osteoporosis International 8(3): 255-60.
Baker, S. G. and B. S. Kramer. 2008. Randomized trials for the real world: making as few and as reasonable assumptions as possible. Statistical Methods in Medical Research 17(3): 243-52.
Bakhtiyarova, S., O. Lesnyak, N. Kyznesova, M. A. Blankenstein and P. Lips. 2006. Vitamin D status among patients with hip fracture and elderly control subjects in Yekaterinburg, Russia. Osteoporosis International 17(3): 441-6.
Balasubramanian, K., J. Rajeswari, Gulab, Y. C. Govil, A. K. Agarwal, A. Kumar and V. Bhatia. 2003. Varying role of vitamin D deficiency in the etiology of rickets in young children vs. adolescents in northern India. Journal of Tropical Pediatrics 49(4): 201-6.
Balsan, S., M. Garabedian, M. Larchet, A. M. Gorski, G. Cournot, C. Tau, A. Bourdeau, C. Silve and C. Ricour. 1986. Long-term nocturnal calcium infusions can cure rickets and promote normal mineralization in hereditary resistance to 1,25-dihydroxyvitamin D. Journal of Clinical Investigation 77(5): 1661-7.
Baran, D., A. Sorensen, J. Grimes, R. Lew, A. Karellas, B. Johnson and J. Roche. 1990. Dietary modification with dairy products for preventing vertebral bone loss in premenopausal women: a three-year prospective study. Journal of Clinical Endocrinology and Metabolism 70(1): 264-70.
Barger-Lux, M. J. and R. P. Heaney. 2002. Effects of above average summer sun exposure on serum 25-hydroxyvitamin D and calcium absorption. Journal of Clinical Endocrinology and Metabolism 87(11): 4952-6.
Barger-Lux, M. J., K. M. Davies and R. P. Heaney. 2005. Calcium supplementation does not augment bone gain in young women consuming diets moderately low in calcium. Journal of Nutrition 135(10): 2362-6.
Barrett-Connor, E., E. S. Siris, L. E. Wehren, P. D. Miller, T. A. Abbott, M. L. Berger, A. C. Santora and L. M. Sherwood. 2005. Osteoporosis and fracture risk in women of different ethnic groups. Journal of Bone and Mineral Research 20(2): 185-94.
Bartley, J. 2010. Vitamin D, innate immunity and upper respiratory tract infection. Journal of Laryngology and Otology 124(5): 465-9.
Basile, L. A., S. N. Taylor, C. L. Wagner, R. L. Horst and B. W. Hollis. 2006. The effect of high-dose vitamin D supplementation on serum vitamin D levels and milk calcium concentration in lactating women and their infants. Breastfeed Medicine 1(1): 27-35.
Bates, C. J., G. D. Carter, G. D. Mishra, D. O’Shea, J. Jones and A. Prentice. 2003. In a population study, can parathyroid hormone aid the definition of adequate vitamin D status? A study of people aged 65 years and over from the British National Diet and Nutrition Survey. Osteoporosis International 14(2): 152-9.
Becker, A., D. W. Eyles, J. J. McGrath and G. Grecksch. 2005. Transient prenatal vitamin D deficiency is associated with subtle alterations in learning and memory functions in adult rats. Behavioural Brain Research 161(2): 306-12.
Beck-Nielsen, S. S., T. K. Jensen, J. Gram, K. Brixen and B. Brock-Jacobsen. 2009. Nutritional rickets in Denmark: a retrospective review of children’s medical records from 1985 to 2005. European Journal of Pediatrics 168(8): 941-9.
Begum, R., M. L. Coutinho, T. L. Dormandy and S. Yudkin. 1968. Maternal malabsorption presenting as congenital rickets. Lancet 1(7551): 1048-52.
Bell, N. H., A. Greene, S. Epstein, M. J. Oexmann, S. Shaw and J. Shary. 1985. Evidence for alteration of the vitamin D-endocrine system in blacks. Journal of Clinical Investigation 76(2): 470-3.
Bell, N. H., J. Shary, J. Stevens, M. Garza, L. Gordon and J. Edwards. 1991. Demonstration that bone mass is greater in black than in white children. Journal of Bone and Mineral Research 6(7): 719-23.
Bell, N. H. 1995. 25-hydroxyvitamin D3 reverses alteration of the vitamin D-endocrine system in blacks. American Journal of Medicine 99(6): 597-9.
Bell, N. H., L. Gordon, J. Stevens and J. R. Shary. 1995. Demonstration that bone mineral density of the lumbar spine, trochanter, and femoral neck is higher in black than in white young men. Calcified Tissue International 56(1): 11-3.
Bell, N. H. 1997. Bone and mineral metabolism in African Americans. Trends in Endocrinology Metabolism 8(6): 240-5.
Benjamin, A., A. Moriakova, N. Akhter, D. Rao, H. Xie, S. Kukreja and E. Barengolts. 2009. Determinants of 25-hydroxyvitamin D levels in African-American and Caucasian male veterans. Osteoporosis International 20(10): 1795-803.
Ben-Zvi, I., C. Aranow, M. Mackay, A. Stanevsky, D. L. Kamen, L. M. Marinescu, C. E. Collins, G. S. Gilkeson, B. Diamond and J. A. Hardin. 2010. The impact of vitamin D on dendritic cell function in patients with systemic lupus erythematosus. PLoS ONE [Electronic Resource] 5(2): e9193.
Berger, C., D. Goltzman, L. Langsetmo, L. Joseph, N. Kreiger, A. Tenenhouse, K. S. Davison, R. G. Josse, J. C. Prior and D. A. Hanley. 2010. Peak bone mass from longitudinal data: implications for the prevalence, pathophysiology, and diagnosis of osteoporosis. Journal of Bone and Mineral Research 25(9): 1948-57.
Bertone-Johnson, E. R., W. Y. Chen, M. F. Holick, B. W. Hollis, G. A. Colditz, W. C. Willett and S. E. Hankinson. 2005. Plasma 25-hydroxyvitamin D and 1,25-dihydroxyvitamin D and risk of breast cancer. Cancer Epidemiology, Biomarkers & Prevention 14(8): 1991-7.
Bertone-Johnson, E. R. 2009. Vitamin D and breast cancer. Annals of Epidemiology 19(7): 462-7.
Berube, S., C. Diorio, W. Verhoek-Oftedahl and J. Brisson. 2004. Vitamin D, calcium, and mammographic breast densities. Cancer Epidemiology, Biomarkers & Prevention 13(9): 1466-72.
Bhimma, R., J. M. Pettifor, H. M. Coovadia, M. Moodley and M. Adhikari. 1995. Rickets in black children beyond infancy in Natal. South African Medical Journal 85(7): 668-72.
Bikle, D. D., E. Gee, B. Halloran and J. G. Haddad. 1984. Free 1,25-dihydroxyvitamin D levels in serum from normal subjects, pregnant subjects, and subjects with liver disease. Journal of Clinical Investigation 74(6): 1966-71.
Billaudel, B., L. Barakat and A. Faure-Dussert. 1998. Vitamin D3 deficiency and alterations of glucose metabolism in rat endocrine pancreas. Diabetes and Metabolism 24(4): 344-50.
Bischoff, H. A., H. B. Stahelin, W. Dick, R. Akos, M. Knecht, C. Salis, M. Nebiker, R. Theiler, M. Pfeifer, B. Begerow, R. A. Lew and M. Conzelmann. 2003. Effects of vitamin D and calcium supplementation on falls: a randomized controlled trial. Journal of Bone and Mineral Research 18(2): 343-51.
Bischoff-Ferrari, H. A., B. Dawson-Hughes, W. C. Willett, H. B. Staehelin, M. G. Bazemore, R. Y. Zee and J. B. Wong. 2004a. Effect of Vitamin D on falls: a meta-analysis. JAMA 291(16): 1999-2006.
Bischoff-Ferrari, H. A., T. Dietrich, E. J. Orav, F. B. Hu, Y. Zhang, E. W. Karlson and B. Dawson-Hughes. 2004b. Higher 25-hydroxyvitamin D concentrations are associated with better lower-extremity function in both active and inactive persons aged ≥60 y. American Journal of Clinical Nutrition 80(3): 752-8.
Bischoff-Ferrari, H. A., Y. Zhang, D. P. Kiel and D. T. Felson. 2005. Positive association between serum 25-hydroxyvitamin D level and bone density in osteoarthritis. Arthritis and Rheumatism 53(6): 821-6.
Bischoff-Ferrari, H. A., E. Giovannucci, W. C. Willett, T. Dietrich and B. Dawson-Hughes. 2006a. Estimation of optimal serum concentrations of 25-hydroxyvitamin D for multiple health outcomes. American Journal of Clinical Nutrition 84(1): 18-28.
Bischoff-Ferrari, H. A., E. J. Orav and B. Dawson-Hughes. 2006b. Effect of cholecalciferol plus calcium on falling in ambulatory older men and women: a 3-year randomized controlled trial. Archives of Internal Medicine 166(4): 424-30.
Bischoff-Ferrari, H. A., B. Dawson-Hughes, J. A. Baron, P. Burckhardt, R. Li, D. Spiegelman, B. Specker, J. E. Orav, J. B. Wong, H. B. Staehelin, E. O’Reilly, D. P. Kiel and W. C. Willett. 2007. Calcium intake and hip fracture risk in men and women: a meta-analysis of prospective cohort studies and randomized controlled trials. American Journal of Clinical Nutrition 86(6): 1780-90.
Bischoff-Ferrari, H. A., B. Dawson-Hughes, H. B. Staehelin, J. E. Orav, A. E. Stuck, R. Theiler, J. B. Wong, A. Egli, D. P. Kiel and J. Henschkowski. 2009a. Fall prevention with supplemental and active forms of vitamin D: a meta-analysis of randomised controlled trials. British Medical Journal 339: b3692.
Bischoff-Ferrari, H. A., D. P. Kiel, B. Dawson-Hughes, J. E. Orav, R. Li, D. Spiegelman, T. Dietrich and W. C. Willett. 2009b. Dietary calcium and serum 25-hydroxyvitamin D status in relation to BMD among U.S. adults. Journal of Bone and Mineral Research 24(5): 935-42.
Bischoff-Ferrari, H. A., W. C. Willett, J. B. Wong, A. E. Stuck, H. B. Staehelin, E. J. Orav, A. Thoma, D. P. Kiel and J. Henschkowski. 2009c. Prevention of nonvertebral fractures with oral vitamin D and dose dependency: a meta-analysis of randomized controlled trials. Archives of Internal Medicine 169(6): 551-61.
Bischoff-Ferrari, H. A., B. Dawson-Hughes, A. Platz, E. J. Orav, H. B. Stahelin, W. C. Willett, U. Can, A. Egli, N. J. Mueller, S. Looser, B. Bretscher, E. Minder, A. Vergopoulos and R. Theiler. 2010. Effect of high-dosage cholecalciferol and extended physiotherapy on complications after hip fracture: a randomized controlled trial. Archives of Internal Medicine 170(9): 813-20.
Black, A. J., J. Topping, B. Durham, R. G. Farquharson and W. D. Fraser. 2000. A detailed assessment of alterations in bone turnover, calcium homeostasis, and bone density in normal pregnancy. Journal of Bone and Mineral Research 15(3): 557-63.
Black, P. N. and S. Sharpe. 1997. Dietary fat and asthma: is there a connection? European Respiratory Journal 10(1): 6-12.
Boass, A., S. U. Toverud, J. W. Pike and M. R. Haussler. 1981. Calcium metabolism during lactation: enhanced intestinal calcium absorption in vitamin D-deprived, hypocalcemic rats. Endocrinology 109(3): 900-7.
Bodnar, L. M., H. N. Simhan, R. W. Powers, M. P. Frank, E. Cooperstein and J. M. Roberts. 2007. High prevalence of vitamin D insufficiency in black and white pregnant women residing in the northern United States and their neonates. Journal of Nutrition 137(2): 447-52.
Bodnar, L. M., M. A. Krohn and H. N. Simhan. 2009. Maternal vitamin D deficiency is associated with bacterial vaginosis in the first trimester of pregnancy. Journal of Nutrition 139(6): 1157-61.
Bodnar, L. M., J. M. Catov, J. M. Zmuda, M. E. Cooper, M. S. Parrott, J. M. Roberts, M. L. Marazita and H. N. Simhan. 2010. Maternal serum 25-hydroxyvitamin D concentrations are associated with small-for-gestational age births in white women. Journal of Nutrition 140(5): 999-1006.
Bolla, L. R., C. M. Filley and R. M. Palmer. 2000. Dementia DDx. Office diagnosis of the four major types of dementia. Geriatrics 55(1): 34-7, 41-2, 45-6.
Bolland, M. J., P. A. Barber, R. N. Doughty, B. Mason, A. Horne, R. Ames, G. D. Gamble, A. Grey and I. R. Reid. 2008. Vascular events in healthy older women receiving calcium supplementation: randomised controlled trial. British Medical Journal 336(7638): 262-6.
Bolland, M. J., A. Avenell, J. A. Baron, A. Grey, G. S. MacLennan, G. D. Gamble and I. R. Reid. 2010a. Effect of calcium supplements on risk of myocardial infarction and cardiovascular events: meta-analysis. British Medical Journal 341: 3691-9.
Bolland, M. J., C. J. Bacon, A. M. Horne, B. H. Mason, R. W. Ames, T. K. Wang, A. B. Grey, G. D. Gamble and I. R. Reid. 2010b. Vitamin D insufficiency and health outcomes over 5 y in older women. American Journal of Clinical Nutrition 91(1): 82-9.
Bolton-Smith, C., M. E. McMurdo, C. R. Paterson, P. A. Mole, J. M. Harvey, S. T. Fenton, C. J. Prynne, G. D. Mishra and M. J. Shearer. 2007. Two-year randomized controlled trial of vitamin K1 (phylloquinone) and vitamin D3 plus calcium on the bone health of older women. Journal of Bone and Mineral Research 22(4): 509-19.
Boonen, S., X. G. Cheng, J. Nijs, P. H. Nicholson, G. Verbeke, E. Lesaffre, J. Aerssens and J. Dequeker. 1997. Factors associated with cortical and trabecular bone loss as quantified by peripheral computed tomography (pQCT) at the ultradistal radius in aging women. Calcified Tissue International 60(2): 164-70.
Boonen, S., S. Mohan, J. Dequeker, J. Aerssens, D. Vanderschueren, G. Verbeke, P. Broos, R. Bouillon and D. J. Baylink. 1999. Down-regulation of the serum stimulatory components of the insulin-like growth factor (IGF) system (IGF-I, IGF-II, IGF binding protein [BP]-3, and IGFBP-5) in age-related (type II) femoral neck osteoporosis. Journal of Bone and Mineral Research 14(12): 2150-8.
Boscoe, F. P. and M. J. Schymura. 2006. Solar ultraviolet-B exposure and cancer incidence and mortality in the United States, 1993-2002. BMC Cancer 6: 264.
Bougle, D., J. P. Sabatier, F. Bureau, D. Laroche, J. Brouard, B. Guillois and J. F. Duhamel. 1998. Relationship between bone mineralization and aluminium in the healthy infant. European Journal of Clinical Nutrition 52(6): 431-5.
Bouillon, R., A. Verstuyf, C. Mathieu, S. Van Cromphaut, R. Masuyama, P. Dehaes and G. Carmeliet. 2006. Vitamin D resistance. Best Practice Research Clinical Endocrinology Metabolism 20(4): 627-45.
Bouillon, R., G. Carmeliet, L. Verlinden, E. van Etten, A. Verstuyf, H. F. Luderer, L. Lieben, C. Mathieu and M. Demay. 2008. Vitamin D and human health: lessons from vitamin D receptor null mice. Endocrine Reviews 29(6): 726-76.
Bourlon, P. M., A. Faure-Dussert and B. Billaudel. 1999. The de novo synthesis of numerous proteins is decreased during vitamin D3 deficiency and is gradually restored by 1, 25-dihydroxyvitamin D3 repletion in the islets of langerhans of rats. Journal of Endocrinology 162(1): 101-9.
Boxer, R. S., D. A. Dauser, S. J. Walsh, W. D. Hager and A. M. Kenny. 2008. The association between vitamin D and inflammation with the 6-minute walk and frailty in patients with heart failure. Journal of the American Geriatrics Society 56(3): 454-61.
Brannon, P. M., E. A. Yetley, R. L. Bailey and M. F. Picciano. 2008. Vitamin D and health in the 21st century: an update. Proceedings of a conference held September 2007 in Bethesda, Maryland, USA. American Journal of Clinical Nutrition 88(2): 483S-592S.
Braun, M., C. Palacios, K. Wigertz, L. A. Jackman, R. J. Bryant, L. D. McCabe, B. R. Martin, G. P. McCabe, M. Peacock and C. M. Weaver. 2007. Racial differences in skeletal calcium retention in adolescent girls with varied controlled calcium intakes. American Journal of Clinical Nutrition 85(6): 1657-63.
Brazier, M., F. Grados, S. Kamel, M. Mathieu, A. Morel, M. Maamer, J. L. Sebert and P. Fardellone. 2005. Clinical and laboratory safety of one year’s use of a combination calcium + vitamin D tablet in ambulatory elderly women with vitamin D insufficiency: results of a multicenter, randomized, double-blind, placebo-controlled study. Clinical Therapeutics 27(12): 1885-93.
Brehm, J. M., J. C. Celedon, M. E. Soto-Quiros, L. Avila, G. M. Hunninghake, E. Forno, D. Laskey, J. S. Sylvia, B. W. Hollis, S. T. Weiss and A. A. Litonjua. 2009. Serum vitamin D levels and markers of severity of childhood asthma in Costa Rica. American Journal of Respiratory and Critical Care Medicine 179(9): 765-71.
Brewer, L. D., N. M. Porter, D. S. Kerr, P. W. Landfield and O. Thibault. 2006. Chronic 1alpha,25-(OH)2 vitamin D3 treatment reduces Ca2+-mediated hippocampal biomarkers of aging. Cell Calcium 40(3): 277-86.
Brisson, J., S. Berube, C. Diorio, M. Sinotte, M. Pollak and B. Masse. 2007. Synchronized seasonal variations of mammographic breast density and plasma 25-hydroxyvitamin D. Cancer Epidemiology, Biomarkers & Prevention 16(5): 929-33.
Britton, J., I. Pavord, K. Richards, A. Wisniewski, A. Knox, S. Lewis, A. Tattersfield and S. Weiss. 1994a. Dietary magnesium, lung function, wheezing, and airway hyperreactivity in a random adult population sample. Lancet 344(8919): 357-62.
Britton, J., I. Pavord, K. Richards, A. Knox, A. Wisniewski, S. Weiss and A. Tattersfield. 1994b. Dietary sodium intake and the risk of airway hyperreactivity in a random adult population. Thorax 49(9): 875-80.
Broe, K. E., T. C. Chen, J. Weinberg, H. A. Bischoff-Ferrari, M. F. Holick and D. P. Kiel. 2007. A higher dose of vitamin D reduces the risk of falls in nursing home residents: a randomized, multiple-dose study. Journal of the American Geriatrics Society 55(2): 234-9.
Brommage, R., D. C. Baxter and L. W. Gierke. 1990. Vitamin D-independent intestinal calcium and phosphorus absorption during reproduction. American Journal of Physiology 259(4 Pt 1): G631-8.
Brooke, O. G., I. R. Brown, C. D. Bone, N. D. Carter, H. J. Cleeve, J. D. Maxwell, V. P. Robinson and S. M. Winder. 1980. Vitamin D supplements in pregnant Asian women: effects on calcium status and fetal growth. British Medical Journal 280(6216): 751-4.
Brown, J., J. I. Bianco, J. J. McGrath and D. W. Eyles. 2003. 1,25-dihydroxyvitamin D3 induces nerve growth factor, promotes neurite outgrowth and inhibits mitosis in embryonic rat hippocampal neurons. Neuroscience Letters 343(2): 139-43.
Brunvand, L., S. S. Shah, S. Bergstrom and E. Haug. 1998. Vitamin D deficiency in pregnancy is not associated with obstructed labor. A study among Pakistani women in Karachi. Acta Obstetricia et Gynecologica Scandinavica 77(3): 303-6.
Bryant, R. J., M. E. Wastney, B. R. Martin, O. Wood, G. P. McCabe, M. Morshidi, D. L. Smith, M. Peacock and C. M. Weaver. 2003. Racial differences in bone turnover and calcium metabolism in adolescent females. Journal of Clinical Endocrinology and Metabolism 88(3): 1043-7.
Buell, J. S. and B. Dawson-Hughes. 2008. Vitamin D and neurocognitive dysfunction: preventing “D”ecline? Molecular Aspects of Medicine 29(6): 415-22.
Buell, J. S., B. Dawson-Hughes, T. M. Scott, D. E. Weiner, G. E. Dallal, W. Q. Qui, P. Bergethon, I. H. Rosenberg, M. F. Folstein, S. Patz, R. A. Bhadelia and K. L. Tucker. 2010. 25-hydroxyvitamin D, dementia, and cerebrovascular pathology in elders receiving home services. Neurology 74(1): 18-26.
Bunout, D., G. Barrera, L. Leiva, V. Gattas, M. P. de la Maza, M. Avendano and S. Hirsch. 2006. Effects of vitamin D supplementation and exercise training on physical performance in Chilean vitamin D deficient elderly subjects. Experimental Gerontology 41(8): 746-52.
Burleigh, E., J. McColl and J. Potter. 2007. Does vitamin D stop inpatients falling? A randomised controlled trial. Age and Ageing 36(5): 507-13.
Burney, P. 1987. A diet rich in sodium may potentiate asthma. Epidemiologic evidence for a new hypothesis. Chest 91(Suppl 6): 143S-8S.
Cade, C. and A. W. Norman. 1986. Vitamin D3 improves impaired glucose tolerance and insulin secretion in the vitamin D-deficient rat in vivo. Endocrinology 119(1): 84-90.
Cadranel, J. L., M. Garabedian, B. Milleron, H. Guillozzo, D. Valeyre, F. Paillard, G. Akoun and A. J. Hance. 1994. Vitamin D metabolism by alveolar immune cells in tuberculosis: correlation with calcium metabolism and clinical manifestations. European Respiratory Journal 7(6): 1103-10.
Camargo, C. A., Jr., S. L. Rifas-Shiman, A. A. Litonjua, J. W. Rich-Edwards, S. T. Weiss, D. R. Gold, K. Kleinman and M. W. Gillman. 2007. Maternal intake of vitamin D during pregnancy and risk of recurrent wheeze in children at 3 y of age. American Journal of Clinical Nutrition 85(3): 788-95.
Campbell, D. E. and A. R. Fleischman. 1988. Rickets of prematurity: controversies in causation and prevention. Clinics in Perinatology 15(4): 879-90.
Cancela, L., N. Le Boulch and L. Miravet. 1986. Relationship between the vitamin D content of maternal milk and the vitamin D status of nursing women and breast-fed infants. Journal of Endocrinology 110(1): 43-50.
Cannell, J. J., R. Vieth, J. C. Umhau, M. F. Holick, W. B. Grant, S. Madronich, C. F. Garland and E. Giovannucci. 2006. Epidemic influenza and vitamin D. Epidemiology and Infection 134(6): 1129-40.
Cantorna, M. T., C. E. Hayes and H. F. DeLuca. 1996. 1,25-dihydroxyvitamin D3 reversibly blocks the progression of relapsing encephalomyelitis, a model of multiple sclerosis. Proceedings of the National Academy of Sciences of the United States of America 93(15): 7861-4.
Cantorna, M. T., C. E. Hayes and H. F. DeLuca. 1998. 1,25-dihydroxycholecalciferol inhibits the progression of arthritis in murine models of human arthritis. Journal of Nutrition 128(1): 68-72.
Cantorna, M. T. and B. D. Mahon. 2005. D-hormone and the immune system. Journal of Rheumatology (Suppl 76): 11-20.
Canzoniero, L. M. and B. J. Snider. 2005. Calcium in Alzheimer’s disease pathogenesis: too much, too little or in the wrong place? Journal of Alzheimers Disease 8(2): 147-54; discussion 209-15.
Cauley, J. A., L. Y. Lui, K. E. Ensrud, J. M. Zmuda, K. L. Stone, M. C. Hochberg and S. R. Cummings. 2005a. Bone mineral density and the risk of incident nonspinal fractures in black and white women. JAMA 293(17): 2102-8.
Cauley, J. A., L. Y. Lui, K. L. Stone, T. A. Hillier, J. M. Zmuda, M. Hochberg, T. J. Beck and K. E. Ensrud. 2005b. Longitudinal study of changes in hip bone mineral density in Caucasian and African-American women. Journal of the American Geriatrics Society 53(2): 183-9.
Cauley, J. A., A. Z. Lacroix, L. Wu, M. Horwitz, M. E. Danielson, D. C. Bauer, J. S. Lee, R. D. Jackson, J. A. Robbins, C. Wu, F. Z. Stanczyk, M. S. LeBoff, J. Wactawski-Wende, G. Sarto, J. Ockene and S. R. Cummings. 2008. Serum 25-hydroxyvitamin D concentrations and risk for hip fractures. Annals of Internal Medicine 149(4): 242-50.
Cauley, J., et al. 2009. Serum 25 hydroxyvitamin (OH)D and fracture risk in multi-ethnic women: the Women’s Health Initiative (WHI). Presented at ASBMR 31st Annual Meeting. Denver, CO.
Cauley, J. A., N. Parimi, K. E. Ensrud, D. C. Bauer, P. M. Cawthon, S. R. Cummings, A. R. Hoffman, J. M. Shikany, E. Barrett-Connor and E. Orwoll. 2010. Serum 25 hydroxyvitamin D and the risk of hip and non-spine fractures in older men. Journal of Bone and Mineral Research 25(3): 545.
Ceglia, L. 2008. Vitamin D and skeletal muscle tissue and function. Molecular Aspects of Medicine 29(6): 407-14.
Cesur, Y., H. Caksen, A. Gundem, E. Kirimi and D. Odabas. 2003. Comparison of low and high dose of vitamin D treatment in nutritional vitamin D deficiency rickets. Journal of Pediatric Endocrinology and Metabolism 16(8): 1105-9.
Chan, G. M., C. C. Roberts, D. Folland and R. Jackson. 1982. Growth and bone mineralization of normal breast-fed infants and the effects of lactation on maternal bone mineral status. American Journal of Clinical Nutrition 36(3): 438-43.
Chan, G. M., K. Hoffman and M. McMurry. 1995. Effects of dairy products on bone and body composition in pubertal girls. Journal of Pediatrics 126(4): 551-6.
Chan, T. Y., P. Poon, J. Pang, R. Swaminathan, C. H. Chan, M. Nisar, C. S. Williams and P. D. Davies. 1994. A study of calcium and vitamin D metabolism in Chinese patients with pulmonary tuberculosis. Journal of Tropical Medicine and Hygiene 97(1): 26-30.
Chantry, C. J., P. Auinger and R. S. Byrd. 2004. Lactation among adolescent mothers and subsequent bone mineral density. Archives of Pediatrics and Adolescent Medicine 158(7): 650-6.
Chapuy, M. C., M. E. Arlot, F. Duboeuf, J. Brun, B. Crouzet, S. Arnaud, P. D. Delmas and P. J. Meunier. 1992. Vitamin D3 and calcium to prevent hip fractures in the elderly women. New England Journal of Medicine 327(23): 1637-42.
Chapuy, M. C., P. Preziosi, M. Maamer, S. Arnaud, P. Galan, S. Hercberg and P. J. Meunier. 1997. Prevalence of vitamin D insufficiency in an adult normal population. Osteoporosis International 7(5): 439-43.
Chapuy, M. C., R. Pamphile, E. Paris, C. Kempf, M. Schlichting, S. Arnaud, P. Garnero and P. J. Meunier. 2002. Combined calcium and vitamin D3 supplementation in elderly women: confirmation of reversal of secondary hyperparathyroidism and hip fracture risk: the Decalyos II study. Osteoporosis International 13(3): 257-64.
Chen, P., P. Hu, D. Xie, Y. Qin, F. Wang and H. Wang. 2010. Meta-analysis of vitamin D, calcium and the prevention of breast cancer. Breast Cancer Research and Treatment 121(2): 469-77.
Cheng, S., A. Lyytikainen, H. Kroger, C. Lamberg-Allardt, M. Alen, A. Koistinen, Q. J. Wang, M. Suuriniemi, H. Suominen, A. Mahonen, P. H. Nicholson, K. K. Ivaska, R. Korpela, C. Ohlsson, K. H. Vaananen and F. Tylavsky. 2005. Effects of calcium, dairy product, and vitamin D supplementation on bone mass accrual and body composition in 10-12-y-old girls: a 2-y randomized trial. American Journal of Clinical Nutrition 82(5): 1115-26; quiz 1147-8.
Chertow, B. S., W. I. Sivitz, N. G. Baranetsky, S. A. Clark, A. Waite and H. F. Deluca. 1983. Cellular mechanisms of insulin release: the effects of vitamin D deficiency and repletion on rat insulin secretion. Endocrinology 113(4): 1511-8.
Chevalley, T., R. Rizzoli, V. Nydegger, D. Slosman, C. H. Rapin, J. P. Michel, H. Vasey and J. P. Bonjour. 1994. Effects of calcium supplements on femoral bone mineral density and vertebral fracture rate in vitamin-D-replete elderly patients. Osteoporosis International 4(5): 245-52.
Chlebowski, R. T., K. C. Johnson, C. Kooperberg, M. Pettinger, J. Wactawski-Wende, T. Rohan, J. Rossouw, D. Lane, M. J. O’Sullivan, S. Yasmeen, R. A. Hiatt, J. M. Shikany, M. Vitolins, J. Khandekar and F. A. Hubbell. 2008. Calcium plus vitamin D supplementation and the risk of breast cancer. Journal of the National Cancer Institute 100(22): 1581-91.
Chonchol, M., M. Cigolini and G. Targher. 2008. Association between 25-hydroxyvitamin D deficiency and cardiovascular disease in type 2 diabetic patients with mild kidney dysfunction. Nephrology, Dialysis, Transplantation 23(1): 269-74.
Chung M., E. M. Balk, M. Brendel, S. Ip, J. Lau, J. Lee, A. Lichtenstein, K. Patel, G. Raman, A. Tatsioni, T. Terasawa and T. A. Trikalinos. 2009. Vitamin D and calcium: a systematic review of health outcomes. Evidence Report No. 183. (Prepared by the Tufts Evidence-based Practice Center under Contract No. HHSA 290-2007-10055-I.) AHRQ Publication No. 09-E015. Rockville, MD: Agency for Healthcare Research and Quality.
Cigolini, M., M. P. Iagulli, V. Miconi, M. Galiotto, S. Lombardi and G. Targher. 2006. Serum 25-hydroxyvitamin D3 concentrations and prevalence of cardiovascular disease among type 2 diabetic patients. Diabetes Care 29(3): 722-4.
Clark, S. A., W. E. Stumpf and M. Sar. 1981. Effect of 1,25 dihydroxyvitamin D3 on insulin secretion. Diabetes 30(5): 382-6.
Cohn, S. H., C. Abesamis, S. Yasumura, J. F. Aloia, I. Zanzi and K. J. Ellis. 1977. Comparative skeletal mass and radial bone mineral content in black and white women. Metabolism 26(2): 171-8.
Congdon, P., A. Horsman, P. A. Kirby, J. Dibble and T. Bashir. 1983. Mineral content of the forearms of babies born to Asian and white mothers. British Medical Journal (Clinical Research Edition) 286(6373): 1233-5.
Cooper, C., M. McLaren, P. J. Wood, L. Coulton and J. A. Kanis. 1989. Indices of calcium metabolism in women with hip fractures. Bone and Mineral 5(2): 193-200.
Cooper, L., P. B. Clifton-Bligh, M. L. Nery, G. Figtree, S. Twigg, E. Hibbert and B. G. Robinson. 2003. Vitamin D supplementation and bone mineral density in early postmenopausal women. American Journal of Clinical Nutrition 77(5): 1324-9.
Cooper, C., K. Javaid, S. Westlake, N. Harvey and E. Dennison. 2005. Developmental origins of osteoporotic fracture: the role of maternal vitamin D insufficiency. Journal of Nutrition 135(11): 2728S-34S.
Cosman, F., D. C. Morgan, J. W. Nieves, V. Shen, M. M. Luckey, D. W. Dempster, R. Lindsay and M. Parisien. 1997. Resistance to bone resorbing effects of PTH in black women. Journal of Bone and Mineral Research 12(6): 958-66.
Cosman, F., J. Nieves, D. Dempster and R. Lindsay. 2007. Vitamin D economy in blacks. Journal of Bone and Mineral Research 22 (Suppl 2): V34-8.
Costenbader, K. H., D. Feskanich, M. Holmes, E. W. Karlson and E. Benito-Garcia. 2008. Vitamin D intake and risks of systemic lupus erythematosus and rheumatoid arthritis in women. Annals of the Rheumatic Diseases 67(4): 530-5.
Cranney A., T. Horsley, S. O’Donnell, H. A. Weiler, L. Puil, D. S. Ooi, S. A. Atkinson, L. M. Ward, D. Moher, D. A. Hanley, M. Fang, F. Yazdi, C. Garritty, M. Sampson, N. Barrowman, A. Tsertsvadze and V. Mamaladze. 2007. Effectiveness and safety of vitamin D in relation to bone health. Evidence Report/Technology Assessment No. 158. (Prepared by the University of Ottawa Evidence-based Practice Center (UO-EPC) under Contract No. 290-02-0021.) AHRQ Publication No. 07-E013. Rockville, MD: Agency for Healthcare Research and Quality.
Cromer, B. A., L. Binkovitz, J. Ziegler, R. Harvey and S. M. Debanne. 2004. Reference values for bone mineral density in 12- to 18-year-old girls categorized by weight, race, and age. Pediatric Radiology 34(10): 787-92.
Cross, N. A., L. S. Hillman, S. H. Allen, G. F. Krause and N. E. Vieira. 1995. Calcium homeostasis and bone metabolism during pregnancy, lactation, and postweaning: a longitudinal study. American Journal of Clinical Nutrition 61(3): 514-23.
Cross, H. S., M. Peterlik, G. S. Reddy and I. Schuster. 1997. Vitamin D metabolism in human colon adenocarcinoma-derived Caco-2 cells: expression of 25-hydroxyvitamin D3-1alpha-hydroxylase activity and regulation of side-chain metabolism. Journal of Steroid Biochemistry and Molecular Biology 62(1): 21-8.
Croswell, J. M. and B. S. Kramer. 2009. Clinical trial design and evidence-based outcomes in the study of liver diseases. Journal of Hepatology 50(4): 817-26.
Cummings, S. R., J. A. Cauley, L. Palermo, P. D. Ross, R. D. Wasnich, D. Black and K. G. Faulkner. 1994. Racial differences in hip axis lengths might explain racial differences in rates of hip fracture. Study of Osteoporotic Fractures Research Group. Osteoporosis International 4(4): 226-9.
Cummings, S. R., W. S. Browner, D. Bauer, K. Stone, K. Ensrud, S. Jamal and B. Ettinger. 1998. Endogenous hormones and the risk of hip and vertebral fractures among older women. Study of Osteoporotic Fractures Research Group. New England Journal of Medicine 339(11): 733-8.
Dahlman, T., H. E. Sjoberg and E. Bucht. 1994. Calcium homeostasis in normal pregnancy and puerperium. A longitudinal study. Acta Obstetrica et Gynecologica Scandinavica 73(5): 393-8.
Dardenne, O., J. Prud’homme, A. Arabian, F. H. Glorieux and R. St-Arnaud. 2001. Targeted inactivation of the 25-hydroxyvitamin D(3)-1(alpha)-hydroxylase gene (CYP27B1) creates an animal model of pseudovitamin D-deficiency rickets. Endocrinology 142(7): 3135-41.
Dardenne, O., J. Prudhomme, S. A. Hacking, F. H. Glorieux and R. St-Arnaud. 2003. Rescue of the pseudo-vitamin D deficiency rickets phenotype of CYP27B1-deficient mice by treatment with 1,25-dihydroxyvitamin D3: biochemical, histomorphometric, and biomechanical analyses. Journal of Bone and Mineral Research 18(4): 637-43.
Davis, C. D. 2008. Vitamin D and cancer: current dilemmas and future research needs. American Journal of Clinical Nutrition 88(2): 565S-9.
Dawodu, A., M. Agarwal, M. Sankarankutty, D. Hardy, J. Kochiyil and P. Badrinath. 2005. Higher prevalence of vitamin D deficiency in mothers of rachitic than nonrachitic children. Journal of Pediatrics 147(1): 109-11.
Dawson-Hughes, B., G. E. Dallal, E. A. Krall, L. Sadowski, N. Sahyoun and S. Tannenbaum. 1990. A controlled trial of the effect of calcium supplementation on bone density in postmenopausal women. New England Journal of Medicine 323(13): 878-83.
Dawson-Hughes, B., G. E. Dallal, E. A. Krall, S. Harris, L. J. Sokoll and G. Falconer. 1991. Effect of vitamin D supplementation on wintertime and overall bone loss in healthy postmenopausal women. Annals of Internal Medicine 115(7): 505-12.
Dawson-Hughes, B., S. Harris, C. Kramich, G. Dallal and H. M. Rasmussen. 1993. Calcium retention and hormone levels in black and white women on high- and low-calcium diets. Journal of Bone and Mineral Research 8(7): 779-87.
Dawson-Hughes, B., S. S. Harris, E. A. Krall, G. E. Dallal, G. Falconer and C. L. Green. 1995. Rates of bone loss in postmenopausal women randomly assigned to one of two dosages of vitamin D. American Journal of Clinical Nutrition 61(5): 1140-5.
Dawson-Hughes, B., S. S. Harris and G. E. Dallal. 1997a. Plasma calcidiol, season, and serum parathyroid hormone concentrations in healthy elderly men and women. American Journal of Clinical Nutrition 65(1): 67-71.
Dawson-Hughes, B., S. S. Harris, E. A. Krall and G. E. Dallal. 1997b. Effect of calcium and vitamin D supplementation on bone density in men and women 65 years of age or older. New England Journal of Medicine 337(10): 670-6.
de Abreu, D. A., E. Nivet, N. Baril, M. Khrestchatisky, F. Roman and F. Feron. 2010. Developmental vitamin D deficiency alters learning in C57Bl/6J mice. Behavioural Brain Research 208(2): 603-8.
de Viragh, P. A., K. G. Haglid and M. R. Celio. 1989. Parvalbumin increases in the caudate putamen of rats with vitamin D hypervitaminosis. Proceedings of the National Academy of Sciences of the United States of America 86(10): 3887-90.
Deeb, K. K., D. L. Trump and C. S. Johnson. 2007. Vitamin D signalling pathways in cancer: potential for anticancer therapeutics. Nature Reviews Cancer 7(9): 684-700.
del Puente, A., A. Esposito, S. Savastano, A. Carpinelli, L. Postiglione and P. Oriente. 2002. Dietary calcium intake and serum vitamin D are major determinants of bone mass variations in women. A longitudinal study. Aging Clinical Experimental Research 14(5): 382-8.
Delvin, E. E., B. L. Salle, F. H. Glorieux, P. Adeleine and L. S. David. 1986. Vitamin D supplementation during pregnancy: effect on neonatal calcium homeostasis. Journal of Pediatrics 109(2): 328-34.
Dennison, E., R. Eastell, C. H. Fall, S. Kellingray, P. J. Wood and C. Cooper. 1999. Determinants of bone loss in elderly men and women: a prospective population-based study. Osteoporosis International 10(5): 384-91.
Deth, R., C. Muratore, J. Benzecry, V. A. Power-Charnitsky and M. Waly. 2008. How environmental and genetic factors combine to cause autism: a redox/methylation hypothesis. Neurotoxicology 29(1): 190-201.
Devereux, G., G. McNeill, G. Newman, S. Turner, L. Craig, S. Martindale, P. Helms and A. Seaton. 2007. Early childhood wheezing symptoms in relation to plasma selenium in pregnant mothers and neonates. Clinical and Experimental Allergy 37(7): 1000-8.
Devine, A., S. G. Wilson, I. M. Dick and R. L. Prince. 2002. Effects of vitamin D metabolites on intestinal calcium absorption and bone turnover in elderly women. American Journal of Clinical Nutrition 75(2): 283-8.
Dhesi, J. K., S. H. Jackson, L. M. Bearne, C. Moniz, M. V. Hurley, C. G. Swift and T. J. Allain. 2004. Vitamin D supplementation improves neuromuscular function in older people who fall. Age and Ageing 33(6): 589-95.
Diamond, T., P. Smerdely, N. Kormas, R. Sekel, T. Vu and P. Day. 1998. Hip fracture in elderly men: the importance of subclinical vitamin D deficiency and hypogonadism. Medical Journal of Australia 169(3): 138-41.
Diaz, V. A., A. G. Mainous, 3rd, P. J. Carek, A. M. Wessell and C. J. Everett. 2009. The association of vitamin D deficiency and insufficiency with diabetic nephropathy: implications for health disparities. Journal of the American Board of Family Medicine 22(5): 521-7.
Dickinson, J. L., D. I. Perera, A. F. van der Mei, A. L. Ponsonby, A. M. Polanowski, R. J. Thomson, B. V. Taylor, J. D. McKay, J. Stankovich and T. Dwyer. 2009. Past environmental sun exposure and risk of multiple sclerosis: a role for the Cdx-2 vitamin D receptor variant in this interaction. Multiple Sclerosis 15(5): 563-70.
Dietel, M. 2010. Hormone replacement therapy (HRT), breast cancer and tumor pathology. Maturitas 65(3): 183-9.
Dionyssiotis, Y., I. Paspati, G. Trovas, A. Galanos and G. P. Lyritis. 2010. Association of physical exercise and calcium intake with bone mass measured by quantitative ultrasound. BMC Women’s Health 10: 12.
Dobnig, H., F. Kainer, V. Stepan, R. Winter, R. Lipp, M. Schaffer, A. Kahr, S. Nocnik, G. Patterer and G. Leb. 1995. Elevated parathyroid hormone-related peptide levels after human gestation: relationship to changes in bone and mineral metabolism. Journal of Clinical Endocrinology and Metabolism 80(12): 3699-707.
Dobnig, H., S. Pilz, H. Scharnagl, W. Renner, U. Seelhorst, B. Wellnitz, J. Kinkeldei, B. O. Boehm, G. Weihrauch and W. Maerz. 2008. Independent association of low serum 25-hydroxyvitamin d and 1,25-dihydroxyvitamin d levels with all-cause and cardiovascular mortality. Archives of Internal Medicine 168(12): 1340-9.
Doppelt, S. H. 1984. Vitamin D, rickets, and osteomalacia. Orthopedic Clinics of North America 15(4): 671-86.
Durazo-Arvizu, R. A., B. Dawson-Hughes, C. T. Sempos, E. A. Yetley, A. C. Looker, G. Cao, S. S. Harris, V. L. Burt, A. L. Carriquiry and M. F. Picciano. 2010. Three-phase model harmonizes estimates of the maximal suppression of parathyroid hormone by 25-hydroxyvitamin D in persons 65 years of age and older. Journal of Nutrition 140(3): 595-9.
Dwyer, T., I. van der Mei, A. L. Ponsonby, B. V. Taylor, J. Stankovich, J. D. McKay, R. J. Thomson, A. M. Polanowski and J. L. Dickinson. 2008. Melanocortin 1 receptor genotype, past environmental sun exposure, and risk of multiple sclerosis. Neurology 71(8): 583-9.
Edderkaoui, B., D. J. Baylink, W. G. Beamer, J. E. Wergedal, R. Porte, A. Chaudhuri and S. Mohan. 2007. Identification of mouse Duffy antigen receptor for chemokines (Darc) as a BMD QTL gene. Genome Research 17(5): 577-85.
Eisman, J. 2010. Is the genomics glass half empty or almost completely empty? International Bone & Mineral Society BoneKEy 27-31.
Elders, P. J., J. C. Netelenbos, P. Lips, F. C. van Ginkel, E. Khoe, O. R. Leeuwenkamp, W. H. Hackeng and P. F. van der Stelt. 1991. Calcium supplementation reduces vertebral bone loss in perimenopausal women: a controlled trial in 248 women between 46 and 55 years of age. Journal of Clinical Endocrinology and Metabolism 73(3): 533-40.
El-Hajj Fuleihan, G., M. Nabulsi, H. Tamim, J. Maalouf, M. Salamoun, H. Khalife, M. Choucair, A. Arabi and R. Vieth. 2006. Effect of vitamin D replacement on musculoskeletal parameters in school children: a randomized controlled trial. Journal of Clinical Endocrinology and Metabolism 91(2): 405-12.
Ellis, K. J., R. J. Shypailo, A. Hergenroeder, M. Perez and S. Abrams. 1996. Total body calcium and bone mineral content: comparison of dual-energy X-ray absorptiometry with neutron activation analysis. Journal of Bone and Mineral Research 11(6): 843-8.
Elzouki, A. Y., T. Markestad, M. Elgarrah, N. Elhoni and L. Aksnes. 1989. Serum concentrations of vitamin D metabolites in rachitic Libyan children. Journal of Pediatric Gastroenterology and Nutrition 9(4): 507-12.
Engelman, C. D., T. E. Fingerlin, C. D. Langefeld, P. J. Hicks, S. S. Rich, L. E. Wagenknecht, D. W. Bowden and J. M. Norris. 2008. Genetic and environmental determinants of 25-hydroxyvitamin D and 1,25-dihydroxyvitamin D levels in Hispanic and African Americans. Journal of Clinical Endocrinology and Metabolism 93(9): 3381-8.
Ensrud, K. E., B. C. Taylor, M. L. Paudel, J. A. Cauley, P. M. Cawthon, S. R. Cummings, H. A. Fink, E. Barrett-Connor, J. M. Zmuda, J. M. Shikany and E. S. Orwoll. 2009. Serum 25-hydroxyvitamin D levels and rate of hip bone loss in older men. Journal of Clinical Endocrinology and Metabolism 94(8): 2773-80.
Erem, C., R. Tanakol, F. Alagol, B. Omer and O. Cetin. 2002. Relationship of bone turnover parameters, endogenous hormones and vit D deficiency to hip fracture in elderly postmenopausal women. International Journal of Clinical Practice 56(5): 333-7.
Eskandari, F., P. E. Martinez, S. Torvik, T. M. Phillips, E. M. Sternberg, S. Mistry, D. Ronsaville, R. Wesley, C. Toomey, N. G. Sebring, J. C. Reynolds, M. R. Blackman, K. A. Calis, P. W. Gold and G. Cizza. 2007. Low bone mass in premenopausal women with depression. Archives of Internal Medicine 167(21): 2329-36.
Evans, K. N., L. Nguyen, J. Chan, B. A. Innes, J. N. Bulmer, M. D. Kilby and M. Hewison. 2006. Effects of 25-hydroxyvitamin D3 and 1,25-dihydroxyvitamin D3 on cytokine production by human decidual cells. Biology of Reproduction 75(6): 816-22.
Evers, I. M., H. W. de Valk and G. H. Visser. 2004. Risk of complications of pregnancy in women with type 1 diabetes: nationwide prospective study in the Netherlands. BMJ 328(7445): 915.
Fairweather-Tait, S., A. Prentice, K. G. Heumann, L. M. Jarjou, D. M. Stirling, S. G. Wharf and J. R. Turnlund. 1995. Effect of calcium supplements and stage of lactation on the calcium absorption efficiency of lactating women accustomed to low calcium intakes. American Journal of Clinical Nutrition 62(6): 1188-92.
Farrant, H. J., G. V. Krishnaveni, J. C. Hill, B. J. Boucher, D. J. Fisher, K. Noonan, C. Osmond, S. R. Veena and C. H. Fall. 2009. Vitamin D insufficiency is common in Indian mothers but is not associated with gestational diabetes or variation in newborn size. European Journal of Clinical Nutrition 63(5): 646-52.
Faulkner, K. G., S. R. Cummings, D. Black, L. Palermo, C. C. Gluer and H. K. Genant. 1993. Simple measurement of femoral geometry predicts hip fracture: the study of osteoporotic fractures. Journal of Bone and Mineral Research 8(10): 1211-7.
Faulkner, K. A., J. A. Cauley, J. M. Zmuda, D. P. Landsittel, M. C. Nevitt, A. B. Newman, S. A. Studenski and M. S. Redfern. 2005. Ethnic differences in the frequency and circumstances of falling in older community-dwelling women. Journal of the American Geriatrics Society 53(10): 1774-9.
Faupel-Badger, J. M., L. Diaw, D. Albanes, J. Virtamo, K. Woodson and J. A. Tangrea. 2007. Lack of association between serum levels of 25-hydroxyvitamin D and the subsequent risk of prostate cancer in Finnish men. Cancer Epidemiology, Biomarkers & Prevention 16(12): 2784-6.
Faure, A., B. C. Sutter and B. Billaudel. 1991. Is 1,25-dihydroxyvitamin D3 the specific vitamin D3 metabolite active on insulin release and calcium handling by islets from vitamin D3-deprived rats? Diabete Metabolism 17(2): 271-8.
Fehily, A. M., R. J. Coles, W. D. Evans and P. C. Elwood. 1992. Factors affecting bone density in young adults. American Journal of Clinical Nutrition 56(3): 579-86.
Fentiman, I. S. 2002. 20. Oral contraceptives, hormone replacement therapy and breast cancer. International Journal of Clinical Practice 56(10): 755-9.
Fernell, E. and C. Gillberg. 2010. Autism spectrum disorder diagnoses in Stockholm pre-schoolers. Research in Developmental Disabilities 31(3): 680-5.
Feron, F., T. H. Burne, J. Brown, E. Smith, J. J. McGrath, A. Mackay-Sim and D. W. Eyles. 2005. Developmental vitamin D3 deficiency alters the adult rat brain. Brain Research Bulletin 65(2): 141-8.
Finch, S. L., F. Rauch and H. A. Weiler. 2010. Postnatal vitamin D supplementation following maternal dietary vitamin D deficiency does not affect bone mass in weanling guinea pigs. Journal of Nutrition 140(9): 1574-81.
Finkelstein, J. S., M. L. Lee, M. Sowers, B. Ettinger, R. M. Neer, J. L. Kelsey, J. A. Cauley, M. H. Huang and G. A. Greendale. 2002. Ethnic variation in bone density in premenopausal and early perimenopausal women: effects of anthropometric and lifestyle factors. Journal of Clinical Endocrinology and Metabolism 87(7): 3057-67.
Fleet, J. C., S. S. Harris, R. J. Wood and B. Dawson-Hughes. 1995. The BsmI vitamin D receptor restriction fragment length polymorphism (BB) predicts low bone density in premenopausal black and white women. Journal of Bone and Mineral Research 10(6): 985-90.
Flicker, L., R. J. MacInnis, M. S. Stein, S. C. Scherer, K. E. Mead, C. A. Nowson, J. Thomas, C. Lowndes, J. L. Hopper and J. D. Wark. 2005. Should older people in residential care receive vitamin D to prevent falls? Results of a randomized trial. Journal of the American Geriatrics Society 53(11): 1881-8.
Fomon, S. J. and S. E. Nelson. 1993. Calcium, phosphorus, magnesium, and sulfur. In Nutrition of Normal Infants, edited by S. J. Fomon. St. Louis: Mosby-Year Book, Inc. Pp. 192-216.
Ford, J. A., D. C. Davidson, W. B. McIntosh, W. M. Fyfe and M. G. Dunnigan. 1973. Neonatal rickets in Asian immigrant population. British Medical Journal 3(5873): 211-2.
Forman, J. P., E. Giovannucci, M. D. Holmes, H. A. Bischoff-Ferrari, S. S. Tworoger, W. C. Willett and G. C. Curhan. 2007. Plasma 25-hydroxyvitamin D levels and risk of incident hypertension. Hypertension 49(5): 1063-9.
Foroud, T., S. Ichikawa, D. Koller, D. Lai, L. Curry, X. Xuei, H. J. Edenberg, S. Hui, M. Peacock and M. J. Econs. 2008. Association studies of ALOX5 and bone mineral density in healthy adults. Osteoporosis International 19(5): 637-43.
Fox, K. M., J. Magaziner, R. Sherwin, J. C. Scott, C. C. Plato, M. Nevitt and S. Cummings. 1993. Reproductive correlates of bone mass in elderly women. Study of Osteoporotic Fractures Research Group. Journal of Bone and Mineral Research 8(8): 901-8.
Francis, R. M., I. T. Boyle, C. Moniz, A. M. Sutcliffe, B. S. Davis, G. H. Beastall, R. A. Cowan and N. Downes. 1996. A comparison of the effects of alfacalcidol treatment and vitamin D2 supplementation on calcium absorption in elderly women with vertebral fractures. Osteoporosis International 6(4): 284-90.
Frankel, B. J., J. Sehlin and I. B. Taljedal. 1985. Vitamin D3 stimulates calcium-45 uptake by isolated mouse islets in vitro. Acta Physiologica Scandinavica 123(1): 61-6.
Fraser, W. D., A. M. Ahmad and J. P. Vora. 2004. The physiology of the circadian rhythm of parathyroid hormone and its potential as a treatment for osteoporosis. Current Opinion in Nephrology and Hypertension 13(4): 437-44.
Freedman, D. M., A. C. Looker, S. C. Chang and B. I. Graubard. 2007. Prospective study of serum vitamin D and cancer mortality in the United States. Journal of the National Cancer Institute 99(21): 1594-602.
Freedman, D. M., S. C. Chang, R. T. Falk, M. P. Purdue, W. Y. Huang, C. A. McCarty, B. W. Hollis, B. I. Graubard, C. D. Berg and R. G. Ziegler. 2008. Serum levels of vitamin D metabolites and breast cancer risk in the prostate, lung, colorectal, and ovarian cancer screening trial. Cancer Epidemiology, Biomarkers & Prevention 17(4): 889-94.
Frolich, A., M. Rudnicki, T. Storm, N. Rasmussen and L. Hegedus. 1992. Impaired 1,25-dihydroxyvitamin D production in pregnancy-induced hypertension. European Journal of Obstetrics, Gynecology, and Reproductive Biology 47(1): 25-9.
Fudge, N. J., J. P. Woodrow and C. S. Kovacs. 2006. Pregnancy rescues low bone mass and normalizes intestinal calcium absorption in Vdr null mice. Journal of Bone and Mineral Research 21(S1): S52.
Fudge, N. J. and C. S. Kovacs. 2010. Pregnancy up-regulates intestinal calcium absorption and skeletal mineralization independently of the vitamin D receptor. Endocrinology 151(3): 886-95.
Gale, C. R., S. M. Robinson, N. C. Harvey, M. K. Javaid, B. Jiang, C. N. Martyn, K. M. Godfrey and C. Cooper. 2008. Maternal vitamin D status during pregnancy and child outcomes. European Journal of Clinical Nutrition 62(1): 68-77.
Garabedian, M., M. Vainsel, E. Mallet, H. Guillozo, M. Toppet, R. Grimberg, T. M. Nguyen and S. Balsan. 1983. Circulating vitamin D metabolite concentrations in children with nutritional rickets. Journal of Pediatrics 103(3): 381-6.
Garcion, E., S. Nataf, A. Berod, F. Darcy and P. Brachet. 1997. 1,25-dihydroxyvitamin D3 inhibits the expression of inducible nitric oxide synthase in rat central nervous system during experimental allergic encephalomyelitis. Brain Research. Molecular Brain Research 45(2): 255-67.
Garn, S. M. 1972. The course of bone gain and the phases of bone loss. Orthopedic Clinics of North America 3(3): 503-20.
Gerdhem, P., K. A. Ringsberg, K. J. Obrant and K. Akesson. 2005. Association between 25-hydroxy vitamin D levels, physical activity, muscle strength and fractures in the prospective population-based OPRA Study of Elderly Women. Osteoporosis International 16(11): 1425-31.
Gertner, J. M., D. R. Coustan, A. S. Kliger, L. E. Mallette, N. Ravin and A. E. Broadus. 1986. Pregnancy as state of physiologic absorptive hypercalciuria. American Journal of Medicine 81(3): 451-6.
Ghannam, N. N., M. M. Hammami, S. M. Bakheet and B. A. Khan. 1999. Bone mineral density of the spine and femur in healthy Saudi females: relation to vitamin D status, pregnancy, and lactation. Calcified Tissue International 65(1): 23-8.
Ghishan, F. K., J. T. Jenkins and M. K. Younoszai. 1980. Maturation of calcium transport in the rat small and large intestine. Journal of Nutrition 110(8): 1622-8.
Ghishan, F. K., P. Parker, S. Nichols and A. Hoyumpa. 1984. Kinetics of intestinal calcium transport during maturation in rats. Pediatric Research 18(3): 235-9.
Gibney, K. B., L. MacGregor, K. Leder, J. Torresi, C. Marshall, P. R. Ebeling and B. A. Biggs. 2008. Vitamin D deficiency is associated with tuberculosis and latent tuberculosis infection in immigrants from sub-Saharan Africa. Clinical Infectious Diseases 46(3): 443-6.
Gilsanz, V., T. F. Roe, S. Mora, G. Costin and W. G. Goodman. 1991. Changes in vertebral bone density in black girls and white girls during childhood and puberty. New England Journal of Medicine 325(23): 1597-600.
Giovannucci, E., E. B. Rimm, A. Wolk, A. Ascherio, M. J. Stampfer, G. A. Colditz and W. C. Willett. 1998. Calcium and fructose intake in relation to risk of prostate cancer. Cancer Research 58(3): 442-7.
Giovannucci, E., Y. Liu, E. B. Rimm, B. W. Hollis, C. S. Fuchs, M. J. Stampfer and W. C. Willett. 2006. Prospective study of predictors of vitamin D status and cancer incidence and mortality in men. Journal of the National Cancer Institute 98(7): 451-9.
Giovannucci, E., Y. Liu, B. W. Hollis and E. B. Rimm. 2008. 25-hydroxyvitamin D and risk of myocardial infarction in men: a prospective study. Archives of Internal Medicine 168(11): 1174-80.
Giulietti, A., C. Gysemans, K. Stoffels, E. van Etten, B. Decallonne, L. Overbergh, R. Bouillon and C. Mathieu. 2004. Vitamin D deficiency in early life accelerates Type 1 diabetes in non-obese diabetic mice. Diabetologia 47(3): 451-62.
Givens, M. H. and I. G. Macy. 1933. The chemical composition of the human fetus. Journal of Biological Chemistry 102(1): 7-17.
Gloth, F. M., 3rd, W. Alam and B. Hollis. 1999. Vitamin D vs broad spectrum phototherapy in the treatment of seasonal affective disorder. Journal of Nutrition, Health, and Aging 3(1): 5-7.
Gong, G. and G. Haynatzki. 2003. Association between bone mineral density and candidate genes in different ethnic populations and its implications. Calcified Tissue International 72(2): 113-23.
Gong, G., G. Haynatzki, V. Haynatzka, S. Kosoko-Lasaki, R. Howell, Y. X. Fu, J. C. Gallagher and M. R. Wilson. 2006. Bone mineral density of recent African immigrants in the United States. Journal of the National Medical Association 98(5): 746-52.
Gordis, L.2009. Epidemiology, 4th Edition. Philadelphia, PA: Saunders Elsevier.
Graafmans, W. C., M. E. Ooms, H. M. Hofstee, P. D. Bezemer, L. M. Bouter and P. Lips. 1996. Falls in the elderly: a prospective study of risk factors and risk profiles. American Journal of Epidemiology 143(11): 1129-36.
Grados, F., M. Brazier, S. Kamel, S. Duver, N. Heurtebize, M. Maamer, M. Mathieu, M. Garabedian, J. L. Sebert and P. Fardellone. 2003a. Effects on bone mineral density of calcium and vitamin D supplementation in elderly women with vitamin D deficiency. Joint, Bone, Spine: Revue du Rhumatisme 70(3): 203-8.
Grados, F., M. Brazier, S. Kamel, M. Mathieu, N. Hurtebize, M. Maamer, M. Garabedian, J. L. Sebert and P. Fardellone. 2003b. Prediction of bone mass density variation by bone remodeling markers in postmenopausal women with vitamin D insufficiency treated with calcium and vitamin D supplementation. Journal of Clinical Endocrinology and Metabolism 88(11): 5175-9.
Graff, M., T. D. Thacher, P. R. Fischer, D. Stadler, S. D. Pam, J. M. Pettifor, C. O. Isichei and S. A. Abrams. 2004. Calcium absorption in Nigerian children with rickets. American Journal of Clinical Nutrition 80(5): 1415-21.
Grant, A. M., A. Avenell, M. K. Campbell, A. M. McDonald, G. S. MacLennan, G. C. McPherson, F. H. Anderson, C. Cooper, R. M. Francis, C. Donaldson, W. J. Gillespie, C. M. Robinson, D. J. Torgerson and W. A. Wallace. 2005. Oral vitamin D3 and calcium for secondary prevention of low-trauma fractures in elderly people (Randomised Evaluation of Calcium Or vitamin D, RECORD): a randomised placebo-controlled trial. Lancet 365(9471): 1621-8.
Greer, F. R., J. E. Searcy, R. S. Levin, J. J. Steichen, P. S. Steichen-Asche and R. C. Tsang. 1982. Bone mineral content and serum 25-hydroxyvitamin D concentrations in breast-fed infants with and without supplemental vitamin D: one-year follow-up. Journal of Pediatrics 100(6): 919-22.
Greer, F. R., J. Lane and M. Ho. 1984. Elevated serum parathyroid hormone, calcitonin, and 1,25-dihydroxyvitamin D in lactating women nursing twins. American Journal of Clinical Nutrition 40(3): 562-8.
Greer, F. R. and S. Marshall. 1989. Bone mineral content, serum vitamin D metabolite concentrations, and ultraviolet B light exposure in infants fed human milk with and without vitamin D2 supplements. Journal of Pediatrics 114(2): 204-12.
Grossman, H., C. Bergmann and S. Parker. 2006. Dementia: a brief review. Mount Sinai Journal of Medicine 73(7): 985-92.
Guillemant, J., P. Taupin, H. T. Le, N. Taright, A. Allemandou, G. Peres and S. Guillemant. 1999. Vitamin D status during puberty in French healthy male adolescents. Osteoporosis International 10(3): 222-5.
Gundberg, C. M., A. C. Looker, S. D. Nieman and M. S. Calvo. 2002. Patterns of osteocalcin and bone specific alkaline phosphatase by age, gender, and race or ethnicity. Bone 31(6): 703-8.
Gysemans, C., E. van Etten, L. Overbergh, A. Giulietti, G. Eelen, M. Waer, A. Verstuyf, R. Bouillon and C. Mathieu. 2008. Unaltered diabetes presentation in NOD mice lacking the vitamin D receptor. Diabetes 57(1): 269-75.
Haddad, J. G., Jr., V. Boisseau and L. V. Avioli. 1971. Placental transfer of vitamin D3 and 25-hydroxycholecalciferol in the rat. Journal of Laboratory and Clinical Medicine 77(6): 908-15.
Halloran, B. P., E. N. Barthell and H. F. DeLuca. 1979. Vitamin D metabolism during pregnancy and lactation in the rat. Proceedings of the National Academy of Sciences of the United States of America 76(11): 5549-53.
Halloran, B. P. and H. F. DeLuca. 1979. Vitamin D deficiency and reproduction in rats. Science 204(4388): 73-4.
Halloran, B. P. and H. F. DeLuca. 1980a. Calcium transport in small intestine during pregnancy and lactation. American Journal of Physiology 239(1): E64-8.
Halloran, B. P. and H. F. DeLuca. 1980b. Skeletal changes during pregnancy and lactation: the role of vitamin D. Endocrinology 107(6): 1923-9.
Halloran, B. P. and H. F. DeLuca. 1980c. Calcium transport in small intestine during early development: role of vitamin D. American Journal of Physiology 239(6): G473-9.
Halloran, B. P. and H. F. De Luca. 1981. Effect of vitamin D deficiency on skeletal development during early growth in the rat. Archives of Biochemistry and Biophysics 209(1): 7-14.
Han, Z. H., S. Palnitkar, D. S. Rao, D. Nelson and A. M. Parfitt. 1996. Effect of ethnicity and age or menopause on the structure and geometry of iliac bone. Journal of Bone and Mineral Research 11(12): 1967-75.
Han, Z. H., S. Palnitkar, D. S. Rao, D. Nelson and A. M. Parfitt. 1997. Effects of ethnicity and age or menopause on the remodeling and turnover of iliac bone: implications for mechanisms of bone loss. Journal of Bone and Mineral Research 12(4): 498-508.
Hanahan, D. and R. A. Weinberg. 2000. The hallmarks of cancer. Cell 100(1): 57-70.
Hanlon, J. T., L. R. Landerman, G. G. Fillenbaum and S. Studenski. 2002. Falls in African American and white community-dwelling elderly residents. Journals of Gerontology. Series A, Biological Sciences and Medical Sciences 57(7): M473-8.
Hansen, K. E., A. N. Jones, M. J. Lindstrom, L. A. Davis, J. A. Engelke and M. M. Shafer. 2008. Vitamin D insufficiency: disease or no disease? Journal of Bone and Mineral Research 23(7): 1052-60.
Harkness, L. and B. Cromer. 2005. Low levels of 25-hydroxy vitamin D are associated with elevated parathyroid hormone in healthy adolescent females. Osteoporosis International 16(1): 109-13.
Harms, L. R., D. W. Eyles, J. J. McGrath, A. Mackay-Sim and T. H. Burne. 2008. Developmental vitamin D deficiency alters adult behaviour in 129/SvJ and C57BL/6J mice. Behavioural Brain Research 187(2): 343-50.
Harris, D. M. and V. L. Go. 2004. Vitamin D and colon carcinogenesis. Journal of Nutrition 134(12 Suppl): 3463S-71S.
Harris, R. P., M. Helfand, S. H. Woolf, K. N. Lohr, C. D. Mulrow, S. M. Teutsch and D. Atkins. 2001. Current methods of the US Preventive Services Task Force: a review of the process. American Journal of Preventive Medicine 20(3 Suppl): 21-35.
Harris, S. and B. Dawson-Hughes. 1993. Seasonal mood changes in 250 normal women. Psychiatry Research 49(1): 77-87.
Harris, S. S., T. R. Eccleshall, C. Gross, B. Dawson-Hughes and D. Feldman. 1997. The vitamin D receptor start codon polymorphism (FokI) and bone mineral density in premenopausal American black and white women. Journal of Bone and Mineral Research 12(7): 1043-8.
Harris, S. S., E. Soteriades, J. A. Coolidge, S. Mudgal and B. Dawson-Hughes. 2000. Vitamin D insufficiency and hyperparathyroidism in a low income, multiracial, elderly population. Journal of Clinical Endocrinology and Metabolism 85(11): 4125-30.
Harris, S. S., E. Soteriades and B. Dawson-Hughes. 2001. Secondary hyperparathyroidism and bone turnover in elderly blacks and whites. Journal of Clinical Endocrinology and Metabolism 86(8): 3801-4.
Harwood, R. H., O. Sahota, K. Gaynor, T. Masud and D. J. Hosking. 2004. A randomised, controlled comparison of different calcium and vitamin D supplementation regimens in elderly women after hip fracture: The Nottingham Neck of Femur (NONOF) Study. Age and Ageing 33(1): 45-51.
Hatton, D. C., H. Xue, J. A. DeMerritt and D. A. McCarron. 1994. 1,25(OH)2 vitamin D3-induced alterations in vascular reactivity in the spontaneously hypertensive rat. American Journal of the Medical Sciences 307 (Suppl 1): S154-8.
Haugen, M., A. L. Brantsaeter, L. Trogstad, J. Alexander, C. Roth, P. Magnus and H. M. Meltzer. 2009. Vitamin D supplementation and reduced risk of preeclampsia in nulliparous women. Epidemiology 20(5): 720-6.
Hawa, M. I., M. G. Valorani, L. R. Buckley, P. E. Beales, A. Afeltra, F. Cacciapaglia, R. D. Leslie and P. Pozzilli. 2004. Lack of effect of vitamin D administration during pregnancy and early life on diabetes incidence in the non-obese diabetic mouse. Hormone and Metabolic Research 36(9): 620-4.
Hayes, D. P. 2009. Influenza pandemics, solar activity cycles, and vitamin D. Medical Hypotheses 74(5): 831-4.
Heaney, R. P. and T. G. Skillman. 1971. Calcium metabolism in normal human pregnancy. Journal of Clinical Endocrinology and Metabolism 33(4): 661-70.
Heaney, R. P., R. R. Recker and P. D. Saville. 1977. Calcium balance and calcium requirements in middle-aged women. American Journal of Clinical Nutrition 30(10): 1603-11.
Heaney, R. P., R. R. Recker and P. D. Saville. 1978. Menopausal changes in calcium balance performance. Journal of Laboratory and Clinical Medicine 92(6): 953-63.
Heaney, R. P., M. S. Dowell, C. A. Hale and A. Bendich. 2003. Calcium absorption varies within the reference range for serum 25-hydroxyvitamin D. Journal of the American College of Nutrition 22(2): 142-6.
Heaney, R. P. 2005. The vitamin D requirement in health and disease. Journal of Steroid Biochemistry and Molecular Biology 97(1-2): 13-9.
Herndon, A. C., C. DiGuiseppi, S. L. Johnson, J. Leiferman and A. Reynolds. 2009. Does nutritional intake differ between children with autism spectrum disorders and children with typical development? Journal of Autism and Developmental Disorders 39(2): 212-22.
Herran, A., J. A. Amado, M. T. Garcia-Unzueta, J. L. Vazquez-Barquero, L. Perera and J. Gonzalez-Macias. 2000. Increased bone remodeling in first-episode major depressive disorder. Psychosomatic Medicine 62(6): 779-82.
Hiller, J. E., C. A. Crowther, V. A. Moore, K. Willson and J. S. Robinson. 2007. Calcium supplementation in pregnancy and its impact on blood pressure in children and women: follow up of a randomised controlled trial. Australian and New Zealand Journal of Obstetrics and Gynaecology 47(2): 115-21.
Hillman, L. S., E. Slatopolsky and J. G. Haddad. 1978. Perinatal vitamin D metabolism. IV. Maternal and cord serum 24,25-dihydroxyvitamin D concentrations. Journal of Clinical Endocrinology and Metabolism 47(5): 1073-7.
Hillman, L., S. Sateesha, M. Haussler, W. Wiest, E. Slatopolsky and J. Haddad. 1981. Control of mineral homeostasis during lactation: interrelationships of 25-hydroxyvitamin D, 24,25-dihydroxyvitamin D, 1,25-dihydroxyvitamin D, parathyroid hormone, calcitonin, prolactin, and estradiol. American Journal of Obstetrics and Gynecology 139(4): 471-6.
Hochberg, Z., D. Tiosano and L. Even. 1992. Calcium therapy for calcitriol-resistant rickets. Journal of Pediatrics 121(5 Pt 1): 803-8.
Hodsman, A. B., D. A. Hanley, P. H. Watson and L. J. Fraher. 2002. Parathyroid hormone. In Principles of Bone Biology, edited by J. P. Bilezikian, L. G. Raisz and G. A. Rodan. New York: Academic Press. Pp. 1305-24.
Hoenderop, J. G., O. Dardenne, M. Van Abel, A. W. Van Der Kemp, C. H. Van Os, R. St-Arnaud and R. J. Bindels. 2002. Modulation of renal Ca2+ transport protein genes by dietary Ca2+ and 1,25-dihydroxyvitamin D3 in 25-hydroxyvitamin D3-1alpha-hydroxylase knockout mice. FASEB Journal 16(11): 1398-406.
Hofmeyr, G. J., A. N. Atallah and L. Duley. 2006. Calcium supplementation during pregnancy for preventing hypertensive disorders and related problems. Cochrane Database System Review 3: CD001059.
Hofmeyr, G. J., L. Duley and A. Atallah. 2007. Dietary calcium supplementation for prevention of pre-eclampsia and related problems: a systematic review and commentary. British Journal of Obstetrics and Gynaecology 114(8): 933-43.
Hoikka, V., E. M. Alhava, K. Savolainen and M. Parviainen. 1982. Osteomalacia in fractures of the proximal femur. Acta Orthopaedica Scandinavica 53(2): 255-60.
Holick, M. F., E. S. Siris, N. Binkley, M. K. Beard, A. Khan, J. T. Katzer, R. A. Petruschke, E. Chen and A. E. de Papp. 2005. Prevalence of vitamin D inadequacy among postmenopausal North American women receiving osteoporosis therapy. Journal of Clinical Endocrinology and Metabolism 90(6): 3215-24.
Hollis, B. W. and C. L. Wagner. 2004. Vitamin D requirements during lactation: high-dose maternal supplementation as therapy to prevent hypovitaminosis D for both the mother and the nursing infant. American Journal of Clinical Nutrition 80(Suppl 6): 1752S-8S.
Holt, P. R., N. Arber, B. Halmos, K. Forde, H. Kissileff, K. A. McGlynn, S. F. Moss, N. Kurihara, K. Fan, K. Yang and M. Lipkin. 2002. Colonic epithelial cell proliferation decreases with increasing levels of serum 25-hydroxy vitamin D. Cancer Epidemiology, Biomarkers & Prevention 11(1): 113-9.
Hoogendijk, W. J., P. Lips, M. G. Dik, D. J. Deeg, A. T. Beekman and B. W. Penninx. 2008. Depression is associated with decreased 25-hydroxyvitamin D and increased parathyroid hormone levels in older adults. Archives of General Psychiatry 65(5): 508-12.
Hsia, J., G. Heiss, H. Ren, M. Allison, N. C. Dolan, P. Greenland, S. R. Heckbert, K. C. Johnson, J. E. Manson, S. Sidney and M. Trevisan. 2007. Calcium/vitamin D supplementation and cardiovascular events. Circulation 115(7): 846-54.
Huisman, A. M., K. P. White, A. Algra, M. Harth, R. Vieth, J. W. Jacobs, J. W. Bijlsma and D. A. Bell. 2001. Vitamin D levels in women with systemic lupus erythematosus and fibromyalgia. Journal of Rheumatology 28(11): 2535-9.
Humble, M. B., S. Gustafsson and S. Bejerot. 2010. Low serum levels of 25-hydroxyvitamin D (25-OHD) among psychiatric out-patients in Sweden: relations with season, age, ethnic origin and psychiatric diagnosis. Journal of Steroid Biochemistry and Molecular Biology 121(1-2): 467-70.
Huncharek, M., J. Muscat and B. Kupelnick. 2008. Dairy products, dietary calcium and vitamin D intake as risk factors for prostate cancer: a meta-analysis of 26,769 cases from 45 observational studies. Nutrition and Cancer 60(4): 421-41.
Hunt, C. D. and L. K. Johnson. 2007. Calcium requirements: new estimations for men and women by cross–sectional statistical analyses of calcium balance data from metabolic studies. American Journal of Clinical Nutrition 86(4): 1054-63.
Hunter, D., P. Major, N. Arden, R. Swaminathan, T. Andrew, A. J. MacGregor, R. Keen, H. Snieder and T. D. Spector. 2000. A randomized controlled trial of vitamin D supplementation on preventing postmenopausal bone loss and modifying bone metabolism using identical twin pairs. Journal of Bone and Mineral Research 15(11): 2276-83.
Hypponen, E., U. Sovio, M. Wjst, S. Patel, J. Pekkanen, A. L. Hartikainen and M. R. Jarvelinb. 2004. Infant vitamin d supplementation and allergic conditions in adulthood: northern Finland birth cohort 1966. Annals of the New York Academy of Sciences 1037: 84-95.
Hypponen, E., A. L. Hartikainen, U. Sovio, M. R. Jarvelin and A. Pouta. 2007. Does vitamin D supplementation in infancy reduce the risk of pre-eclampsia? European Journal of Clinical Nutrition 61(9): 1136-9.
IARC (International Agency for Research on Cancer). 1992. Monographs on the Evaluation of Carcinogenic Risks to Humans, Volume 55, Solar and Ultraviolet Radiation. Lyon: World Health Organization.
IARC (International Agency for Research on Cancer). 2008. Vitamin D and Cancer. IARC Working Group Reports, Volume 5. Lyon: World Health Organization.
Innes, A. M., M. M. Seshia, C. Prasad, S. Al Saif, F. R. Friesen, A. E. Chudley, M. Reed, L. A. Dilling, J. C. Haworth and C. R. Greenberg. 2002. Congenital rickets caused by maternal vitamin D deficiency. Paediatric Child Health 7(7): 455-8.
Inui, N., A. Murayama, S. Sasaki, T. Suda, K. Chida, S. Kato and H. Nakamura. 2001. Correlation between 25-hydroxyvitamin D3 1 alpha-hydroxylase gene expression in alveolar macrophages and the activity of sarcoidosis. American Journal of Medicine 110(9): 687-93.
IOM. 1997. Dietary Reference Intakes for Calcium, Phosphorus, Magnesium, Vitamin D, and Fluoride. Washington, DC, National Academy Press.
Isaia, G., R. Giorgino and S. Adami. 2001. High prevalence of hypovitaminosis D in female type 2 diabetic population. Diabetes Care 24(8): 1496.
Israni, N., R. Goswami, A. Kumar and R. Rani. 2009. Interaction of vitamin D receptor with HLA DRB1 0301 in type 1 diabetes patients from North India. PLoS One 4(12): e8023.
Ito, M., H. Koyama, A. Ohshige, T. Maeda, T. Yoshimura and H. Okamura. 1994. Prevention of preeclampsia with calcium supplementation and vitamin D3 in an antenatal protocol. International Journal of Gynaecology and Obstetrics 47(2): 115-20.
Jackson, R. D., A. Z. LaCroix, M. Gass, R. B. Wallace, J. Robbins, C. E. Lewis, T. Bassford, S. A. Beresford, H. R. Black, P. Blanchette, D. E. Bonds, R. L. Brunner, R. G. Brzyski, B. Caan, J. A. Cauley, R. T. Chlebowski, S. R. Cummings, I. Granek, J. Hays, G. Heiss, S. L. Hendrix, B. V. Howard, J. Hsia, F. A. Hubbell, K. C. Johnson, H. Judd, J. M. Kotchen, L. H. Kuller, R. D. Langer, N. L. Lasser, M. C. Limacher, S. Ludlam, J. E. Manson, K. L. Margolis, J. McGowan, J. K. Ockene, M. J. O’Sullivan, L. Phillips, R. L. Prentice, G. E. Sarto, M. L. Stefanick, L. Van Horn, J. Wactawski-Wende, E. Whitlock, G. L. Anderson, A. R. Assaf and D. Barad. 2006. Calcium plus vitamin D supplementation and the risk of fractures. New England Journal of Medicine 354(7): 669-83.
Jadad, A. R., R. A. Moore, D. Carroll, C. Jenkinson, D. J. M. Reynolds, D. J. Gavaghan and H. J. McQuay. 1996. Assessing the quality of reports of randomized clinical trials: is blinding necessary? Controlled Clinical Trials 17(1): 1-12.
Jahnsen, J., J. A. Falch, P. Mowinckel and E. Aadland. 2002. Vitamin D status, parathyroid hormone and bone mineral density in patients with inflammatory bowel disease. Scandinavian Journal of Gastroenterology 37(2): 192-9.
Jarjou, L. M., A. Prentice, Y. Sawo, M. A. Laskey, J. Bennett, G. R. Goldberg and T. J. Cole. 2006. Randomized, placebo-controlled, calcium supplementation study in pregnant Gambian women: effects on breast-milk calcium concentrations and infant birth weight, growth, and bone mineral accretion in the first year of life. American Journal of Clinical Nutrition 83(3): 657-66.
Jarjou, L. M., M. A. Laskey, Y. Sawo, G. R. Goldberg, T. J. Cole and A. Prentice. 2010. Effect of calcium supplementation in pregnancy on maternal bone outcomes in women with a low calcium intake. American Journal of Clinical Nutrition 92(2): 450-7.
Javaid, M. K., S. R. Crozier, N. C. Harvey, C. R. Gale, E. M. Dennison, B. J. Boucher, N. K. Arden, K. M. Godfrey and C. Cooper. 2006. Maternal vitamin D status during pregnancy and childhood bone mass at age 9 years: a longitudinal study. Lancet 367(9504): 36-43.
Jenab, M., H. B. Bueno-de-Mesquita, P. Ferrari, F. J. van Duijnhoven, T. Norat, T. Pischon, E. H. Jansen, N. Slimani, G. Byrnes, S. Rinaldi, A. Tjonneland, A. Olsen, K. Overvad, M. C. Boutron-Ruault, F. Clavel-Chapelon, S. Morois, R. Kaaks, J. Linseisen, H. Boeing, M. M. Bergmann, A. Trichopoulou, G. Misirli, D. Trichopoulos, F. Berrino, P. Vineis, S. Panico, D. Palli, R. Tumino, M. M. Ros, C. H. van Gils, P. H. Peeters, M. Brustad, E. Lund, M. J. Tormo, E. Ardanaz, L. Rodriguez, M. J. Sanchez, M. Dorronsoro, C. A. Gonzalez, G. Hallmans, R. Palmqvist, A. Roddam, T. J. Key, K. T. Khaw, P. Autier, P. Hainaut and E. Riboli. 2010. Association between pre-diagnostic circulating vitamin D concentration and risk of colorectal cancer in European populations: a nested case–control study. BMJ 340: b5500.
Jenkins, D. H., J. G. Roberts, D. Webster and E. O. Williams. 1973. Osteomalacia in elderly patients with fracture of the femoral neck. A clinico-pathological study. Journal of Bone and Joint Surgery. British Volume 55(3): 575-80.
Jensen, C., L. Holloway, G. Block, G. Spiller, G. Gildengorin, E. Gunderson, G. Butterfield and R. Marcus. 2002. Long-term effects of nutrient intervention on markers of bone remodeling and calciotropic hormones in late-postmenopausal women. American Journal of Clinical Nutrition 75(6): 1114-20.
Johnston, C. C., Jr., J. Z. Miller, C. W. Slemenda, T. K. Reister, S. Hui, J. C. Christian and M. Peacock. 1992. Calcium supplementation and increases in bone mineral density in children. New England Journal of Medicine 327(2): 82-7.
Jorde, R., M. Sneve, Y. Figenschau, J. Svartberg and K. Waterloo. 2008. Effects of vitamin D supplementation on symptoms of depression in overweight and obese subjects: randomized double blind trial. Journal of Internal Medicine 264(6): 599-609.
Jorde, R., M. Sneve, P. Torjesen and Y. Figenschau. 2010. No improvement in cardiovascular risk factors in overweight and obese subjects after supplementation with vitamin D3 for 1 year. Journal of Internal Medicine 267(5): 462-72.
Kalkwarf, H. J., B. L. Specker, J. E. Heubi, N. E. Vieira and A. L. Yergey. 1996. Intestinal calcium absorption of women during lactation and after weaning. American Journal of Clinical Nutrition 63(4): 526-31.
Kalkwarf, H. J., B. L. Specker, D. C. Bianchi, J. Ranz and M. Ho. 1997. The effect of calcium supplementation on bone density during lactation and after weaning. New England Journal of Medicine 337(8): 523-8.
Kalkwarf, H. J. 1999. Hormonal and dietary regulation of changes in bone density during lactation and after weaning in women. Journal of Mammary Gland Biology and Neoplasia 4(3): 319-29.
Kalkwarf, H. J., B. S. Zemel, V. Gilsanz, J. M. Lappe, M. Horlick, S. Oberfield, S. Mahboubi, B. Fan, M. M. Frederick, K. Winer and J. A. Shepherd. 2007. The bone mineral density in childhood study: bone mineral content and density according to age, sex, and race. Journal of Clinical Endocrinology and Metabolism 92(6): 2087-99.
Kamen, D. L., G. S. Cooper, H. Bouali, S. R. Shaftman, B. W. Hollis and G. S. Gilkeson. 2006. Vitamin D deficiency in systemic lupus erythematosus. Autoimmune Reviews 5(2): 114-7.
Karakelides, H., J. L. Geller, A. L. Schroeter, H. Chen, P. S. Behn, J. S. Adams, M. Hewison and R. A. Wermers. 2006. Vitamin D-mediated hypercalcemia in slack skin disease: evidence for involvement of extrarenal 25-hydroxyvitamin D 1alpha-hydroxylase. Journal of Bone and Mineral Research 21(9): 1496-9.
Kaur, M., D. Pearson, I. Godber, N. Lawson, P. Baker and D. Hosking. 2003. Longitudinal changes in bone mineral density during normal pregnancy. Bone 32(4): 449-54.
Kent, G. N., R. I. Price, D. H. Gutteridge, M. Smith, J. R. Allen, C. I. Bhagat, M. P. Barnes, C. J. Hickling, R. W. Retallack, S. G. Wilson and et al. 1990. Human lactation: forearm trabecular bone loss, increased bone turnover, and renal conservation of calcium and inorganic phosphate with recovery of bone mass following weaning. Journal of Bone and Mineral Research 5(4): 361-9.
Kent, G. N., R. I. Price, D. H. Gutteridge, K. J. Rosman, M. Smith, J. R. Allen, C. J. Hickling and S. L. Blakeman. 1991. The efficiency of intestinal calcium absorption is increased in late pregnancy but not in established lactation. Calcified Tissue International 48(4): 293-5.
Kinyamu, H. K., J. C. Gallagher, K. A. Rafferty and K. E. Balhorn. 1998. Dietary calcium and vitamin D intake in elderly women: effect on serum parathyroid hormone and vitamin D metabolites. American Journal of Clinical Nutrition 67(2): 342-8.
Kitanaka, S., K. Takeyama, A. Murayama, T. Sato, K. Okumura, M. Nogami, Y. Hasegawa, H. Niimi, J. Yanagisawa, T. Tanaka and S. Kato. 1998. Inactivating mutations in the 25-hydroxyvitamin D3 1alpha-hydroxylase gene in patients with pseudovitamin D-deficiency rickets. New England Journal of Medicine 338(10): 653-61.
Kivineva, M., M. Blauer, H. Syvala, T. Tammela and P. Tuohimaa. 1998. Localization of 1,25-dihydroxyvitamin D3 receptor (VDR) expression in human prostate. Journal of Steroid Biochemistry and Molecular Biology 66(3): 121-7.
Kleerekoper, M., D. A. Nelson, E. L. Peterson, M. J. Flynn, A. S. Pawluszka, G. Jacobsen and P. Wilson. 1994. Reference data for bone mass, calciotropic hormones, and biochemical markers of bone remodeling in older (55-75) postmenopausal white and black women. Journal of Bone and Mineral Research 9(8): 1267-76.
Ko, P., R. Burkert, J. McGrath and D. Eyles. 2004. Maternal vitamin D3 deprivation and the regulation of apoptosis and cell cycle during rat brain development. Brain Research. Developmental Brain Research 153(1): 61-8.
Koeffler, H. P., H. Reichel, J. E. Bishop and A. W. Norman. 1985. gamma-Interferon stimulates production of 1,25-dihydroxyvitamin D3 by normal human macrophages. Biochemical and Biophysical Research Communications 127(2): 596-603.
Koller, D. L., M. J. Econs, P. A. Morin, J. C. Christian, S. L. Hui, P. Parry, M. E. Curran, L. A. Rodriguez, P. M. Conneally, G. Joslyn, M. Peacock, C. C. Johnston and T. Foroud. 2000. Genome screen for QTLs contributing to normal variation in bone mineral density and osteoporosis. Journal of Clinical Endocrinology and Metabolism 85(9): 3116-20.
Komulainen, M. H., H. Kroger, M. T. Tuppurainen, A. M. Heikkinen, E. Alhava, R. Honkanen and S. Saarikoski. 1998. HRT and vit D in prevention of non-vertebral fractures in postmenopausal women; a 5 year randomized trial. Maturitas 31(1): 45-54.
Koo, W. and R. Tsang. 1997. Calcium, magnesium, phosphorus, and vitamin D. In Nutrition During Infancy, 2nd Edition, edited by Cincinnati: Digital Education. Pp. 175-89.
Koo, W. W., J. C. Walters, J. Esterlitz, R. J. Levine, A. J. Bush and B. Sibai. 1999. Maternal calcium supplementation and fetal bone mineralization. Obstetrics and Gynecology 94(4): 577-82.
Kovacs, C. S. and C. L. Chik. 1995. Hyperprolactinemia caused by lactation and pituitary adenomas is associated with altered serum calcium, phosphate, parathyroid hormone (PTH), and PTH-related peptide levels. Journal of Clinical Endocrinology and Metabolism 80(10): 3036-42.
Kovacs, C. S. and H. M. Kronenberg. 1997. Maternal-fetal calcium and bone metabolism during pregnancy, puerperium, and lactation. Endocrine Reviews 18(6): 832-72.
Kovacs, C. S. 2005. Calcium and bone metabolism during pregnancy and lactation. Journal of Mammary Gland Biology and Neoplasia 10(2): 105-18.
Kovacs, C. S., M. L. Woodland, N. J. Fudge and J. K. Friel. 2005. The vitamin D receptor is not required for fetal mineral homeostasis or for the regulation of placental calcium transfer in mice. American Journal of Physiology Endocrinology Metabolism 289(1): E133-44.
Kovacs, C. S. and H. Fuleihan Gel. 2006. Calcium and bone disorders during pregnancy and lactation. Endocrinology and Metabolism Clinics of North America 35(1): 21-51, v.
Kovacs, C. S. 2008. Vitamin D in pregnancy and lactation: maternal, fetal, and neonatal outcomes from human and animal studies. American Journal of Clinical Nutrition 88(2): 520S-8S.
Kovacs, C. S. and H. M. Kronenberg. 2008. Pregnancy and lactation. In Primer on the Metabolic Bone Diseases and Disorders of Mineral Metabolism, 7th Edition, edited by C. J. Rosen. Washington, DC: ASBMR Press. Pp. 90-5.
Kovalenko, P. L., Z. Zhang, M. Cui, S. K. Clinton and J. C. Fleet. 2010. 1,25 dihydroxyvitamin D-mediated orchestration of anticancer, transcript-level effects in the immortalized, non-transformed prostate epithelial cell line, RWPE1. BMC Genomics 11: 26.
Krall, E. A., N. Sahyoun, S. Tannenbaum, G. E. Dallal and B. Dawson-Hughes. 1989. Effect of vitamin D intake on seasonal variations in parathyroid hormone secretion in postmenopausal women. New England Journal of Medicine 321(26): 1777-83.
Krause, R., M. Buhring, W. Hopfenmuller, M. F. Holick and A. M. Sharma. 1998. Ultraviolet B and blood pressure. Lancet 352(9129): 709-10.
Krishnan, A. V., R. Shinghal, N. Raghavachari, J. D. Brooks, D. M. Peehl and D. Feldman. 2004. Analysis of vitamin D-regulated gene expression in LNCaP human prostate cancer cells using cDNA microarrays. Prostate 59(3): 243-51.
Kumar, A., S. G. Devi, S. Batra, C. Singh and D. K. Shukla. 2009. Calcium supplementation for the prevention of pre-eclampsia. International Journal of Gynaecology and Obstetrics 104(1): 32-6.
Kyriazopoulos, P., G. Trovas, J. Charopoulos, E. Antonogiannakis, A. Galanos and G. Lyritis. 2006. Lifestyle factors and forearm bone density in young Greek men. Clinical Endocrinology 65(2): 234-8.
Lachenmaier-Currle, U. and J. Harmeyer. 1989. Placental transport of calcium and phosphorus in pigs. Journal of Perinatal Medicine 17(2): 127-36.
Lacroix, A. Z., J. Kotchen, G. Anderson, R. Brzyski, J. A. Cauley, S. R. Cummings, M. Gass, K. C. Johnson, M. Ko, J. Larson, J. E. Manson, M. L. Stefanick and J. Wactawski-Wende. 2009. Calcium plus vitamin D supplementation and mortality in postmenopausal women: the Women’s Health Initiative Calcium-Vitamin D Randomized Controlled Trial. Journals of Gerontology. Series A, Biological Sciences and Medical Sciences 64(5): 559-67.
Lalau, J. D., I. Jans, N. el Esper, R. Bouillon and A. Fournier. 1993. Calcium metabolism, plasma parathyroid hormone, and calcitriol in transient hypertension of pregnancy. American Journal of Hypertension 6(6 Pt 1): 522-7.
Landin-Wilhelmsen, K., L. Wilhelmsen and B. A. Bengtsson. 1999. Postmenopausal osteoporosis is more related to hormonal aberrations than to lifestyle factors. Clinical Endocrinology 51(4): 387-94.
Lansdowne, A. T. and S. C. Provost. 1998. Vitamin D3 enhances mood in healthy subjects during winter. Psychopharmacology 135(4): 319-23.
Lappe, J. M., K. M. Davies, D. Travers-Gustafson and R. P. Heaney. 2006. Vitamin D status in a rural postmenopausal female population. Journal of the American College of Nutrition 25(5): 395-402.
Lappe, J. M., D. Travers-Gustafson, K. M. Davies, R. R. Recker and R. P. Heaney. 2007. Vitamin D and calcium supplementation reduces cancer risk: results of a randomized trial. American Journal of Clinical Nutrition 85(6): 1586-91.
Lappe, J., D. Cullen, G. Haynatzki, R. Recker, R. Ahlf and K. Thompson. 2008. Calcium and vitamin d supplementation decreases incidence of stress fractures in female navy recruits. Journal of Bone and Mineral Research 23(5): 741-9.
Larsen, E. R., L. Mosekilde and A. Foldspang. 2004. Vitamin D and calcium supplementation prevents osteoporotic fractures in elderly community dwelling residents: a pragmatic population-based 3-year intervention study. Journal of Bone and Mineral Research 19(3): 370-8.
Larsen, E. R., L. Mosekilde and A. Foldspang. 2005. Vitamin D and calcium supplementation prevents severe falls in elderly community-dwelling women: a pragmatic population-based 3-year intervention study. Aging Clinical Experimental Research 17(2): 125-32.
Laskey, M. A., A. Prentice, L. A. Hanratty, L. M. Jarjou, B. Dibba, S. R. Beavan and T. J. Cole. 1998. Bone changes after 3 mo of lactation: influence of calcium intake, breast-milk output, and vitamin D-receptor genotype. American Journal of Clinical Nutrition 67(4): 685-92.
Latham, N. K., C. S. Anderson, A. Lee, D. A. Bennett, A. Moseley and I. D. Cameron. 2003. A randomized, controlled trial of quadriceps resistance exercise and vitamin D in frail older people: the Frailty Interventions Trial in Elderly Subjects (FITNESS). Journal of the American Geriatrics Society 51(3): 291-9.
Lau, E. M., J. Woo, R. Swaminathan, D. MacDonald and S. P. Donnan. 1989. Plasma 25-hydroxyvitamin D concentration in patients with hip fracture in Hong Kong. Gerontology 35(4): 198-204.
Law, M., H. Withers, J. Morris and F. Anderson. 2006. Vitamin D supplementation and the prevention of fractures and falls: results of a randomised trial in elderly people in residential accommodation. Age and Ageing 35(5): 482-6.
LeBoff, M. S., L. Kohlmeier, S. Hurwitz, J. Franklin, J. Wright and J. Glowacki. 1999. Occult vitamin D deficiency in postmenopausal US women with acute hip fracture. JAMA 281(16): 1505-11.
Lee, D. M., A. Tajar, A. Ulubaev, N. Pendleton, T. W. O’Neill, D. B. O’Connor, G. Bartfai, S. Boonen, R. Bouillon, F. F. Casanueva, J. D. Finn, G. Forti, A. Giwercman, T. S. Han, I. T. Huhtaniemi, K. Kula, M. E. J. Lean, M. Punab, A. J. Silman, D. Vanderschueren, F. C. W. Wu and Emas study group. 2009. Association between 25-hydroxyvitamin D levels and cognitive performance in middle-aged and older European men. Journal of Neurology, Neurosurgery and Psychiatry 80(7): 722-9.
Lee, L., S. A. Kang, H. O. Lee, B. H. Lee, J. S. Park, J. H. Kim, I. K. Jung, Y. J. Park and J. E. Lee. 2001. Relationships between dietary intake and cognitive function level in Korean elderly people. Public Health 115(2): 133-8.
Lee, W. T., S. S. Leung, D. M. Leung and J. C. Cheng. 1996. A follow-up study on the effects of calcium-supplement withdrawal and puberty on bone acquisition of children. American Journal of Clinical Nutrition 64(1): 71-7.
Leffelaar, E. R., T. G. Vrijkotte and M. van Eijsden. 2010. Maternal early pregnancy vitamin D status in relation to fetal and neonatal growth: results of the multi-ethnic Amsterdam Born Children and their Development cohort. British Journal of Nutrition 104(1): 108-17.
Lehtonen-Veromaa, M. K., T. T. Mottonen, I. O. Nuotio, K. M. Irjala, A. E. Leino and J. S. Viikari. 2002. Vitamin D and attainment of peak bone mass among peripubertal Finnish girls: a 3-y prospective study. American Journal of Clinical Nutrition 76(6): 1446-53.
Leitch, I. and F. C. Aitken. 1959. The estimation of calcium requirement: a re-examination. Nutrition Abstracts and Reviews. Series A: Human and Experimental 29(2): 393-411.
Lemire, J. M., A. Ince and M. Takashima. 1992. 1,25-dihydroxyvitamin D3 attenuates the expression of experimental murine lupus of MRL/l mice. Autoimmunity 12(2): 143-8.
Levis, S., A. Gomez, C. Jimenez, L. Veras, F. Ma, S. Lai, B. Hollis and B. A. Roos. 2005. Vitamin D deficiency and seasonal variation in an adult South Florida population. Journal of Clinical Endocrinology and Metabolism 90(3): 1557-62.
Li, J. Y., B. L. Specker, M. L. Ho and R. C. Tsang. 1989. Bone mineral content in black and white children 1 to 6 years of age. Early appearance of race and sex differences. American Journal of Diseases of Children 143(11): 1346-9.
Li, Y. C., A. E. Pirro, M. Amling, G. Delling, R. Baron, R. Bronson and M. B. Demay. 1997. Targeted ablation of the vitamin D receptor: an animal model of vitamin D-dependent rickets type II with alopecia. Proceedings of the National Academy of Sciences of the United States of America 94(18): 9831-5.
Li, Y. C., M. Amling, A. E. Pirro, M. Priemel, J. Meuse, R. Baron, G. Delling and M. B. Demay. 1998. Normalization of mineral ion homeostasis by dietary means prevents hyperparathyroidism, rickets, and osteomalacia, but not alopecia in vitamin D receptor-ablated mice. Endocrinology 139(10): 4391-6.
Li, Y. C., G. Qiao, M. Uskokovic, W. Xiang, W. Zheng and J. Kong. 2004. Vitamin D: a negative endocrine regulator of the renin-angiotensin system and blood pressure. Journal of Steroid Biochemistry and Molecular Biology 89-90(1-5): 387-92.
Linday, L. A., R. D. Shindledecker, J. N. Dolitsky, T. C. Chen and M. F. Holick. 2008. Plasma 25-hydroxyvitamin D levels in young children undergoing placement of tympanostomy tubes. Annals of Otology, Rhinology and Laryngology 117(10): 740-4.
Li-Ng, M., J. F. Aloia, S. Pollack, B. A. Cunha, M. Mikhail, J. Yeh and N. Berbari. 2009. A randomized controlled trial of vitamin D3 supplementation for the prevention of symptomatic upper respiratory tract infections. Epidemiology and Infection 137(10): 1396-404.
Lips, P., J. C. Netelenbos, M. J. Jongen, F. C. van Ginkel, A. L. Althuis, C. L. van Schaik, W. J. van der Vijgh, J. P. Vermeiden and C. van der Meer. 1982. Histomorphometric profile and vitamin D status in patients with femoral neck fracture. Metabolic Bone Disease and Related Research 4(2): 85-93.
Lips, P., W. H. Hackeng, M. J. Jongen, F. C. van Ginkel and J. C. Netelenbos. 1983. Seasonal variation in serum concentrations of parathyroid hormone in elderly people. Journal of Clinical Endocrinology and Metabolism 57(1): 204-6.
Lips, P., F. C. van Ginkel, M. J. Jongen, F. Rubertus, W. J. van der Vijgh and J. C. Netelenbos. 1987. Determinants of vitamin D status in patients with hip fracture and in elderly control subjects. American Journal of Clinical Nutrition 46(6): 1005-10.
Lips, P., W. C. Graafmans, M. E. Ooms, P. D. Bezemer and L. M. Bouter. 1996. Vitamin D supplementation and fracture incidence in elderly persons. A randomized, placebo-controlled clinical trial. Annals of Internal Medicine 124(4): 400-6.
Litonjua, A. A. and S. T. Weiss. 2007. Is vitamin D deficiency to blame for the asthma epidemic? Journal of Allergy and Clinical Immunology 120(5): 1031-5.
Liu, P. T., S. Stenger, H. Li, L. Wenzel, B. H. Tan, S. R. Krutzik, M. T. Ochoa, J. Schauber, K. Wu, C. Meinken, D. L. Kamen, M. Wagner, R. Bals, A. Steinmeyer, U. Zugel, R. L. Gallo, D. Eisenberg, M. Hewison, B. W. Hollis, J. S. Adams, B. R. Bloom and R. L. Modlin. 2006. Toll-like receptor triggering of a vitamin D-mediated human antimicrobial response. Science 311(5768): 1770-3.
Liu, S., Y. Song, E. S. Ford, J. E. Manson, J. E. Buring and P. M. Ridker. 2005. Dietary calcium, vitamin D, and the prevalence of metabolic syndrome in middle-aged and older U.S. women. Diabetes Care 28(12): 2926-32.
Llewellyn, D. J., K. M. Langa and I. A. Lang. 2009. Serum 25-hydroxyvitamin D concentration and cognitive impairment. Journal of Geriatric Psychiatry and Neurology 22(3): 188-95.
Lloyd, T., M. B. Andon, N. Rollings, J. K. Martel, R. Landis, L. M. Demers, D. F. Eggli, K. Kieselhorst and H. E. Kulin. 1993. Calcium supplementation and bone mineral density in adolescent girls. Journal of the American Medical Association 270: 841-4.
Lobaugh, B., A. Boass, G. E. Lester and S. U. Toverud. 1990. Regulation of serum 1,25-dihydroxyvitamin D3 in lactating rats. American Journal of Physiology 259(5 Pt 1): E665-71.
Lobaugh, B., A. Boass, S. C. Garner and S. U. Toverud. 1992. Intensity of lactation modulates renal 1 alpha-hydroxylase and serum 1,25(OH)2D in rats. American Journal of Physiology 262(6 Pt 1): E840-4.
Looker, A. C. and M. E. Mussolino. 2008. Serum 25-hydroxyvitamin D and hip fracture risk in older U.S. white adults. Journal of Bone and Mineral Research 23(1): 143-50.
Looker, A. C., L. J. Melton, 3rd, T. Harris, L. Borrud, J. Shepherd and J. McGowan. 2009. Age, gender, and race/ethnic differences in total body and subregional bone density. Osteoporosis International 20(7): 1141-9.
Lu, P. W., J. N. Briody, G. D. Ogle, K. Morley, I. R. Humphries, J. Allen, R. Howman-Giles, D. Sillence and C. T. Cowell. 1994. Bone mineral density of total body, spine, and femoral neck in children and young adults: A cross–sectional and longitudinal study. Journal of Bone and Mineral Research 9(9): 1451-8.
Luckey, M. M., D. E. Meier, J. P. Mandeli, M. C. DaCosta, M. L. Hubbard and S. J. Goldsmith. 1989. Radial and vertebral bone density in white and black women: evidence for racial differences in premenopausal bone homeostasis. Journal of Clinical Endocrinology and Metabolism 69(4): 762-70.
Lund, B., O. H. Sorensen and A. B. Christensen. 1975. 25-hydroxycholecaliferol and fractures of the proximal. Lancet 2(7929): 300-2.
Lynch, M. F., I. J. Griffin, K. M. Hawthorne, Z. Chen, M. Hamzo and S. A. Abrams. 2007. Calcium balance in 1-4-y-old children. American Journal of Clinical Nutrition 85(3): 750-4.
Lyons, R. A., A. Johansen, S. Brophy, R. G. Newcombe, C. J. Phillips, B. Lervy, R. Evans, K. Wareham and M. D. Stone. 2007. Preventing fractures among older people living in institutional care: a pragmatic randomised double blind placebo controlled trial of vitamin D supplementation. Osteoporosis International 18(6): 811-8.
Mahon, P., N. Harvey, S. Crozier, H. Inskip, S. Robinson, N. Arden, R. Swaminathan, C. Cooper and K. Godfrey. 2010. Low maternal vitamin D status and fetal bone development: cohort study. Journal of Bone and Mineral Research 25(1): 14-9.
Majid Molla, A., M. H. Badawi, S. al-Yaish, P. Sharma, R. S. el-Salam and A. M. Molla. 2000. Risk factors for nutritional rickets among children in Kuwait. Pediatrics International 42(3): 280-4.
Major, G. C., F. Alarie, J. Dore, S. Phouttama and A. Tremblay. 2007. Supplementation with calcium + vitamin D enhances the beneficial effect of weight loss on plasma lipid and lipoprotein concentrations. American Journal of Clinical Nutrition 85(1): 54-9.
Malabanan, A., I. E. Veronikis and M. F. Holick. 1998. Redefining vitamin D insufficiency. Lancet 351(9105): 805-6.
Mallet, E., B. Gugi, P. Brunelle, A. Henocq, J. P. Basuyau and H. Lemeur. 1986. Vitamin D supplementation in pregnancy: a controlled trial of two methods. Obstetrics and Gynecology 68(3): 300-4.
Malloy, P. J., T. R. Eccleshall, C. Gross, L. Van Maldergem, R. Bouillon and D. Feldman. 1997. Hereditary vitamin D resistant rickets caused by a novel mutation in the vitamin D receptor that results in decreased affinity for hormone and cellular hyporesponsiveness. Journal of Clinical Investigation 99(2): 297-304.
Manson, J. E., M. A. Allison, J. J. Carr, R. D. Langer, B. B. Cochrane, S. L. Hendrix, J. Hsia, J. R. Hunt, C. E. Lewis, K. L. Margolis, J. G. Robinson, R. J. Rodabough and A. M. Thomas. 2010. Calcium/vitamin D supplementation and coronary artery calcification in the Women’s Health Initiative. Menopause 17(4): 683-91.
Margolis, K. L., R. M. Ray, L. Van Horn, J. E. Manson, M. A. Allison, H. R. Black, S. A. Beresford, S. A. Connelly, J. D. Curb, R. H. Grimm, Jr., T. A. Kotchen, L. H. Kuller, S. Wassertheil-Smoller, C. A. Thomson and J. C. Torner. 2008. Effect of calcium and vitamin D supplementation on blood pressure: the Women’s Health Initiative Randomized Trial. Hypertension 52(5): 847-55.
Marie, P. J., L. Cancela, N. Le Boulch and L. Miravet. 1986. Bone changes due to pregnancy and lactation: influence of vitamin D status. American Journal of Physiology 251(4 Pt 1): E400-6.
Marjamaki, L., S. Niinisto, M. G. Kenward, L. Uusitalo, U. Uusitalo, M. L. Ovaskainen, C. Kronberg-Kippila, O. Simell, R. Veijola, J. Ilonen, M. Knip and S. M. Virtanen. 2010. Maternal intake of vitamin D during pregnancy and risk of advanced beta cell autoimmunity and type 1 diabetes in offspring. Diabetologia 53(8): 1599-607.
Markestad, T., S. Halvorsen, K. S. Halvorsen, L. Aksnes and D. Aarskog. 1984. Plasma concentrations of vitamin D metabolites before and during treatment of vitamin D deficiency rickets in children. Acta Paediatrica Scandinavica 73(2): 225-31.
Marniemi, J., E. Alanen, O. Impivaara, R. Seppanen, P. Hakala, T. Rajala and T. Ronnemaa. 2005. Dietary and serum vitamins and minerals as predictors of myocardial infarction and stroke in elderly subjects. Nutrition, Metabolism, and Cardiovascular Diseases 15(3): 188-97.
Martineau, A. R., F. U. Honecker, R. J. Wilkinson and C. J. Griffiths. 2007a. Vitamin D in the treatment of pulmonary tuberculosis. Journal of Steroid Biochemistry and Molecular Biology 103(3-5): 793-8.
Martineau, A. R., R. J. Wilkinson, K. A. Wilkinson, S. M. Newton, B. Kampmann, B. M. Hall, G. E. Packe, R. N. Davidson, S. M. Eldridge, Z. J. Maunsell, S. J. Rainbow, J. L. Berry and C. J. Griffiths. 2007b. A single dose of vitamin D enhances immunity to mycobacteria. American Journal of Respiratory and Critical Care Medicine 176(2): 208-13.
Maruotti, N. and F. P. Cantatore. 2010. Vitamin D and the immune system. Journal of Rheumatology 37(3): 491-5.
Marwaha, R. K., N. Tandon, D. R. Reddy, R. Aggarwal, R. Singh, R. C. Sawhney, B. Saluja, M. A. Ganie and S. Singh. 2005. Vitamin D and bone mineral density status of healthy schoolchildren in northern India. American Journal of Clinical Nutrition 82(2): 477-82.
Marya, R. K., S. Rathee, V. Lata and S. Mudgil. 1981. Effects of vitamin D supplementation in pregnancy. Gynecologic and Obstetric Investigation 12(3): 155-61.
Marya, R. K., S. Rathee and M. Manrow. 1987. Effect of calcium and vitamin D supplementation on toxaemia of pregnancy. Gynecologic and Obstetric Investigation 24(1): 38-42.
Marya, R. K., S. Rathee, V. Dua and K. Sangwan. 1988. Effect of vitamin D supplementation during pregnancy on foetal growth. Indian Journal of Medical Research 88: 488-92.
Matkovic, V., J. D. Landoll, N. E. Badenhop-Stevens, E. Y. Ha, Z. Crncevic-Orlic, B. Li and P. Goel. 2004. Nutrition influences skeletal development from childhood to adulthood: a study of hip, spine, and forearm in adolescent females. Journal of Nutrition 134(3): 701S-5S.
Matthews, D., E. Laporta, G. M. Zinser, C. J. Narvaez and J. Welsh. 2010. Genomic vitamin D signaling in breast cancer: Insights from animal models and human cells. Journal of Steroid Biochemistry and Molecular Biology 121(1-2): 362-7.
Mattila, C., P. Knekt, S. Mannisto, H. Rissanen, M. A. Laaksonen, J. Montonen and A. Reunanen. 2007. Serum 25-hydroxyvitamin D concentration and subsequent risk of type 2 diabetes. Diabetes Care 30(10): 2569-70.
Mattson, M. P. 2007. Calcium and neurodegeneration. Aging Cell 6(3): 337-50.
Maxwell, J. D., L. Ang, O. G. Brooke and I. R. Brown. 1981. Vitamin D supplements enhance weight gain and nutritional status in pregnant Asians. British Journal of Obstetrics and Gynaecology 88(10): 987-91.
Maxwell, J. P. and L. M. Miles. 1925. Osteomalacia in China. Proceedings of the Royal Society of Medicine 18: 48-66.
McCann, J. C. and B. N. Ames. 2008. Is there convincing biological or behavioral evidence linking vitamin D deficiency to brain dysfunction? FASEB Journal 22(4): 982-1001.
McCarthy, D., P. Duggan, M. O’Brien, M. Kiely, J. McCarthy, F. Shanahan and K. D. Cashman. 2005. Seasonality of vitamin D status and bone turnover in patients with Crohn’s disease. Alimentary Pharmacology and Therapeutics 21(9): 1073-83.
McCullough, M. L., C. Rodriguez, W. R. Diver, H. S. Feigelson, V. L. Stevens, M. J. Thun and E. E. Calle. 2005. Dairy, calcium, and vitamin D intake and postmenopausal breast cancer risk in the Cancer Prevention Study II Nutrition Cohort. Cancer Epidemiology, Biomarkers & Prevention 14(12): 2898-904.
McGill, A. T., J. M. Stewart, F. E. Lithander, C. M. Strik and S. D. Poppitt. 2008. Relationships of low serum vitamin D3 with anthropometry and markers of the metabolic syndrome and diabetes in overweight and obesity. Nutrition Journal 7: 4.
McGrath, J. J., F. P. Feron, T. H. Burne, A. Mackay-Sim and D. W. Eyles. 2004. Vitamin D3-implications for brain development. Journal of Steroid Biochemistry and Molecular Biology 89-90(1-5): 557-60.
McGrath, J., R. Scragg, D. Chant, D. Eyles, T. Burne and D. Obradovic. 2007. No association between serum 25-hydroxyvitamin D3 level and performance on psychometric tests in NHANES III. Neuroepidemiology 29(1-2): 49-54.
McKay, J. D., M. L. McCullough, R. G. Ziegler, P. Kraft, B. S. Saltzman, E. Riboli, A. Barricarte, C. D. Berg, G. Bergland, S. Bingham, M. Brustad, H. B. Bueno-de-Mesquita, L. Burdette, J. Buring, E. E. Calle, S. J. Chanock, F. Clavel-Chapelon, D. G. Cox, L. Dossus, H. S. Feigelson, C. A. Haiman, S. E. Hankinson, R. N. Hoover, D. J. Hunter, A. Husing, R. Kaaks, L. N. Kolonel, L. Le Marchand, J. Linseisen, C. A. McCarty, K. Overvad, S. Panico, M. P. Purdue, D. O. Stram, V. L. Stevens, D. Trichopoulos, W. C. Willett, J. Yuenger and M. J. Thun. 2009. Vitamin D receptor polymorphisms and breast cancer risk: results from the National Cancer Institute Breast and Prostate Cancer Cohort Consortium. Cancer Epidemiology, Biomarkers & Prevention 18(1): 297-305.
Meehan, T. F. and H. F. DeLuca. 2002. The vitamin D receptor is necessary for 1alpha,25-dihydroxyvitamin D(3) to suppress experimental autoimmune encephalomyelitis in mice. Archives of Biochemistry and Biophysics 408(2): 200-4.
Meier, C., H. W. Woitge, K. Witte, B. Lemmer and M. J. Seibel. 2004. Supplementation with oral vitamin D3 and calcium during winter prevents seasonal bone loss: a randomized controlled open-label prospective trial. Journal of Bone and Mineral Research 19(8): 1221-30.
Meier, D. E., M. M. Luckey, S. Wallenstein, T. L. Clemens, E. S. Orwoll and C. I. Waslien. 1991. Calcium, vitamin D, and parathyroid hormone status in young white and black women: association with racial differences in bone mass. Journal of Clinical Endocrinology and Metabolism 72(3): 703-10.
Meier, D. E., M. M. Luckey, S. Wallenstein, R. H. Lapinski and B. Catherwood. 1992. Racial differences in pre- and postmenopausal bone homeostasis: association with bone density. Journal of Bone and Mineral Research 7(10): 1181-9.
Melamed, M. L., P. Muntner, E. D. Michos, J. Uribarri, C. Weber, J. Sharma and P. Raggi. 2008. Serum 25-hydroxyvitamin D levels and the prevalence of peripheral arterial disease: results from NHANES 2001 to 2004. Arteriosclerosis, Thrombosis, and Vascular Biology 28(6): 1179-85.
Melhus, H., G. Snellman, R. Gedeborg, L. Byberg, L. Berglund, H. Mallmin, P. Hellman, R. Blomhoff, E. Hagstrom, J. Arnlov and K. Michaelsson. 2010. Plasma 25-hydroxyvitamin D levels and fracture risk in a community-based cohort of elderly men in Sweden. Journal of Clinical Endocrinology and Metabolism 95(6): 2637-45.
Melin, A., J. Wilske, H. Ringertz and M. Saaf. 2001. Seasonal variations in serum levels of 25-hydroxyvitamin D and parathyroid hormone but no detectable change in femoral neck bone density in an older population with regular outdoor exposure. Journal of the American Geriatrics Society 49(9): 1190-6.
Melton, I. L., M. A. Marquez, S. J. Achenbach, A. Tefferi, M. K. O’Connor, W. M. O’Fallon and B. L. Riggs. 2002. Variations in bone density among persons of African heritage. Osteoporosis International 13(7): 551-9.
Merewood, A., S. D. Mehta, T. C. Chen, H. Bauchner and M. F. Holick. 2009. Association between vitamin D deficiency and primary cesarean section. Journal of Clinical Endocrinology and Metabolism 94(3): 940-5.
Merlino, L. A., J. Curtis, T. R. Mikuls, J. R. Cerhan, L. A. Criswell and K. G. Saag. 2004. Vitamin D intake is inversely associated with rheumatoid arthritis: results from the Iowa Women’s Health Study. Arthritis & Rheumatism 50(1): 72-7.
Michelson, D., C. Stratakis, L. Hill, J. Reynolds, E. Galliven, G. Chrousos and P. Gold. 1996. Bone mineral density in women with depression. New England Journal of Medicine 335(16): 1176-81.
Miller, S. C., B. P. Halloran, H. F. DeLuca and W. S. Jee. 1982. Role of vitamin D in maternal skeletal changes during pregnancy and lactation: a histomorphometric study. Calcified Tissue International 34(3): 245-52.
Miller, S. C., B. P. Halloran, H. F. DeLuca and W. S. Jee. 1983. Studies on the role of vitamin D in early skeletal development, mineralization, and growth in rats. Calcified Tissue International 35(4-5): 455-60.
Minasyan, A., T. Keisala, Y. R. Lou, A. V. Kalueff and P. Tuohimaa. 2007. Neophobia, sensory and cognitive functions, and hedonic responses in vitamin D receptor mutant mice. Journal of Steroid Biochemistry and Molecular Biology 104(3-5): 274-80.
Miyake, Y., S. Sasaki, K. Tanaka and Y. Hirota. 2009. Dairy food, calcium, and vitamin D intake in pregnancy and wheeze and eczema in infants. European Respiratory Journal 35(6): 1128-34.
Mohr, S. B., C. F. Garland, E. D. Gorham and F. C. Garland. 2008. The association between ultraviolet B irradiance, vitamin D status and incidence rates of type 1 diabetes in 51 regions worldwide. Diabetologia 51(8): 1391-8.
Moncrieff, M. and T. O. Fadahunsi. 1974. Congenital rickets due to maternal vitamin D deficiency. Archives of Disease in Childhood 49(10): 810-1.
Monkawa, T., T. Yoshida, M. Hayashi and T. Saruta. 2000. Identification of 25-hydroxyvitamin D3 1alpha-hydroxylase gene expression in macrophages. Kidney International 58(2): 559-68.
Moore, T. B., H. P. Koeffler, J. M. Yamashiro and R. K. Wada. 1996. Vitamin D3 analogs inhibit growth and induce differentiation in LA-N-5 human neuroblastoma cells. Clinical and Experimental Metastasis 14(3): 239-45.
More, C., P. Bettembuk, H. P. Bhattoa and A. Balogh. 2001. The effects of pregnancy and lactation on bone mineral density. Osteoporosis International 12(9): 732-7.
Morley, R., J. B. Carlin, J. A. Pasco and J. D. Wark. 2006. Maternal 25-hydroxyvitamin D and parathyroid hormone concentrations and offspring birth size. Journal of Clinical Endocrinology and Metabolism 91(3): 906-12.
Moschonis, G. and Y. Manios. 2006. Skeletal site-dependent response of bone mineral density and quantitative ultrasound parameters following a 12-month dietary intervention using dairy products fortified with calcium and vitamin D: the Postmenopausal Health Study. British Journal of Nutrition 96(6): 1140-8.
Muller, K., N. J. Kriegbaum, B. Baslund, O. H. Sorensen, M. Thymann and K. Bentzen. 1995. Vitamin D3 metabolism in patients with rheumatic diseases: low serum levels of 25-hydroxyvitamin D3 in patients with systemic lupus erythematosus. Clinical Rheumatology 14(4): 397-400.
Munger, K. L., L. I. Levin, B. W. Hollis, N. S. Howard and A. Ascherio. 2006. Serum 25-hydroxyvitamin D levels and risk of multiple sclerosis. Journal of the American Medical Association 296(23): 2832-8.
Nagpal, J., J. N. Pande and A. Bhartia. 2009. A double-blind, randomized, placebo-controlled trial of the short-term effect of vitamin D3 supplementation on insulin sensitivity in apparently healthy, middle-aged, centrally obese men. Diabetic Medicine 26(1): 19-27.
Namgung, R., R. C. Tsang, C. Lee, D. G. Han, M. L. Ho and R. I. Sierra. 1998. Low total body bone mineral content and high bone resorption in Korean winter-born versus summer-born newborn infants. Journal of Pediatrics 132(3 Pt 1): 421-5.
Narod, S. A. 2006. Modifiers of risk of hereditary breast cancer. Oncogene 25(43): 5832-6.
Naveilhan, P., I. Neveu, D. Wion and P. Brachet. 1996. 1,25-dihydroxyvitamin D3, an inducer of glial cell line-derived neurotrophic factor. Neuroreport 7(13): 2171-5.
Naylor, K. E., P. Iqbal, C. Fledelius, R. B. Fraser and R. Eastell. 2000. The effect of pregnancy on bone density and bone turnover. Journal of Bone and Mineral Research 15(1): 129-37.
Need, A. G. and P. J. Phillips. 1979. Pulmonary tuberculosis and hypercalcaemia. Annals of Internal Medicine 91(4): 652-3.
Need, A. G., P. D. O’Loughlin, H. A. Morris, P. S. Coates, M. Horowitz and B. E. Nordin. 2008. Vitamin D metabolites and calcium absorption in severe vitamin D deficiency. Journal of Bone and Mineral Research 23(11): 1859-63.
Nelson, D. A., G. Jacobsen, D. A. Barondess and A. M. Parfitt. 1995. Ethnic differences in regional bone density, hip axis length, and lifestyle variables among healthy black and white men. Journal of Bone and Mineral Research 10(5): 782-7.
Nelson, D. A., P. M. Simpson, C. C. Johnson, D. A. Barondess and M. Kleerekoper. 1997. The accumulation of whole body skeletal mass in third- and fourth-grade children: effects of age, gender, ethnicity, and body composition. Bone 20(1): 73-8.
Nelson, D. A., D. A. Barondess, S. L. Hendrix and T. J. Beck. 2000. Cross–sectional geometry, bone strength, and bone mass in the proximal femur in black and white postmenopausal women. Journal of Bone and Mineral Research 15(10): 1992-7.
Nelson, D. A., J. M. Pettifor, D. A. Barondess, D. D. Cody, K. Uusi-Rasi and T. J. Beck. 2004. Comparison of cross–sectional geometry of the proximal femur in white and black women from Detroit and Johannesburg. Journal of Bone and Mineral Research 19(4): 560-5.
Newmark, H. L., K. Yang, N. Kurihara, K. Fan, L. H. Augenlicht and M. Lipkin. 2009. Western-style diet-induced colonic tumors and their modulation by calcium and vitamin D in C57Bl/6 mice: a preclinical model for human sporadic colon cancer. Carcinogenesis 30(1): 88-92.
Nnoaham, K. E. and A. Clarke. 2008. Low serum vitamin D levels and tuberculosis: a systematic review and meta-analysis. International Journal of Epidemiology 37(1): 113-9.
Noff, D. and S. Edelstein. 1978. Vitamin D and its hydroxylated metabolites in the rat. Placental and lacteal transport, subsequent metabolic pathways and tissue distribution. Hormone Research 9(5): 292-300.
Norman, A. W., J. B. Frankel, A. M. Heldt and G. M. Grodsky. 1980. Vitamin D deficiency inhibits pancreatic secretion of insulin. Science 209(4458): 823-5.
Nwaru, B. I., S. Ahonen, M. Kaila, M. Erkkola, A. M. Haapala, C. Kronberg-Kippila, R. Veijola, J. Ilonen, O. Simell, M. Knip and S. M. Virtanen. 2010. Maternal diet during pregnancy and allergic sensitization in the offspring by 5 yrs of age: a prospective cohort study. Pediatric Allergy and Immunology 21(1 Pt 1): 29-37.
Obradovic, D., H. Gronemeyer, B. Lutz and T. Rein. 2006. Cross-talk of vitamin D and glucocorticoids in hippocampal cells. Journal of Neurochemistry 96(2): 500-9.
O’Brien, K. O., M. S. Nathanson, J. Mancini and F. R. Witter. 2003. Calcium absorption is significantly higher in adolescents during pregnancy than in the early postpartum period. American Journal of Clinical Nutrition 78(6): 1188-93.
O’Brien, K. O., C. M. Donangelo, C. L. Zapata, S. A. Abrams, E. M. Spencer and J. C. King. 2006. Bone calcium turnover during pregnancy and lactation in women with low calcium diets is associated with calcium intake and circulating insulin-like growth factor 1 concentrations. American Journal of Clinical Nutrition 83(2): 317-23.
Oginni, L. M., M. Worsfold, O. A. Oyelami, C. A. Sharp, D. E. Powell and M. W. Davie. 1996. Etiology of rickets in Nigerian children. Journal of Pediatrics 128(5 Pt 1): 692-4.
Okonofua, F., R. K. Menon, S. Houlder, M. Thomas, D. Robinson, S. O’Brien and P. Dandona. 1986. Parathyroid hormone and neonatal calcium homeostasis: evidence for secondary hyperparathyroidism in the Asian neonate. Metabolism 35(9): 803-6.
Okonofua, F., R. K. Menon, S. Houlder, M. Thomas, D. Robinson, S. O’Brien and P. Dandona. 1987. Calcium, vitamin D and parathyroid hormone relationships in pregnant Caucasian and Asian women and their neonates. Annals of Clinical Biochemistry 24(Pt 1): 22-8.
Olausson, H., M. A. Laskey, G. R. Goldberg and A. Prentice. 2008. Changes in bone mineral status and bone size during pregnancy and the influences of body weight and calcium intake. American Journal of Clinical Nutrition 88(4): 1032-9.
Ooms, M. E., P. Lips, J. C. Roos, W. J. van der Vijgh, C. Popp-Snijders, P. D. Bezemer and L. M. Bouter. 1995a. Vitamin D status and sex hormone binding globulin: determinants of bone turnover and bone mineral density in elderly women. Journal of Bone and Mineral Research 10(8): 1177-84.
Ooms, M. E., J. C. Roos, P. D. Bezemer, W. J. van der Vijgh, L. M. Bouter and P. Lips. 1995b. Prevention of bone loss by vitamin D supplementation in elderly women: a randomized double-blind trial. Journal of Clinical Endocrinology and Metabolism 80(4): 1052-8.
Pan, A., L. Lu, O. H. Franco, Z. Yu, H. Li and X. Lin. 2009. Association between depressive symptoms and 25-hydroxyvitamin D in middle-aged and elderly Chinese. Journal of Affective Disorders 118(1-3): 240-3.
Panda, D. K., D. Miao, M. L. Tremblay, J. Sirois, R. Farookhi, G. N. Hendy and D. Goltzman. 2001. Targeted ablation of the 25-hydroxyvitamin D 1alpha-hydroxylase enzyme: evidence for skeletal, reproductive, and immune dysfunction. Proceedings of the National Academy of Sciences of the United States of America 98(13): 7498-503.
Papapetrou, P. D. 2010. The interrelationship of serum 1,25-dihydroxyvitamin D, 25-hydroxyvitamin D and 24,25-dihydroxyvitamin D in pregnancy at term: a meta-analysis. Hormones (Athens) 9(2): 136-44.
Pappa, H. M., C. M. Gordon, T. M. Saslowsky, A. Zholudev, B. Horr, M. C. Shih and R. J. Grand. 2006. Vitamin D status in children and young adults with inflammatory bowel disease. Pediatrics 118(5): 1950-61.
Parfitt, A. M., Z. H. Han, S. Palnitkar, D. S. Rao, M. S. Shih and D. Nelson. 1997. Effects of ethnicity and age or menopause on osteoblast function, bone mineralization, and osteoid accumulation in iliac bone. Journal of Bone and Mineral Research 12(11): 1864-73.
Parisien, M., F. Cosman, D. Morgan, M. Schnitzer, X. Liang, J. Nieves, L. Forese, M. Luckey, D. Meier, V. Shen, R. Lindsay and D. W. Dempster. 1997. Histomorphometric assessment of bone mass, structure, and remodeling: a comparison between healthy black and white premenopausal women. Journal of Bone and Mineral Research 12(6): 948-57.
Park, M. J., R. Namgung, D. H. Kim and R. C. Tsang. 1998. Bone mineral content is not reduced despite low vitamin D status in breast milk-fed infants versus cow’s milk based formula-fed infants. Journal of Pediatrics 132(4): 641-5.
Park, W., H. Paust, H. J. Kaufmann and G. Offermann. 1987. Osteomalacia of the mother—rickets of the newborn. European Journal of Pediatrics 146(3): 292-3.
Park, Y., M. F. Leitzmann, A. F. Subar, A. Hollenbeck and A. Schatzkin. 2009. Dairy food, calcium, and risk of cancer in the NIH-AARP Diet and Health Study. Archives of Internal Medicine 169(4): 391-401.
Parsa, P. and B. Parsa. 2009. Effects of reproductive factors on risk of breast cancer: a literature review. Asian Pacific Journal of Cancer Prevention 10(4): 545-50.
Partridge, J. M., S. J. Weatherby, J. A. Woolmore, D. J. Highland, A. A. Fryer, C. L. Mann, M. D. Boggild, W. E. Ollier, R. C. Strange and C. P. Hawkins. 2004. Susceptibility and outcome in MS: associations with polymorphisms in pigmentation-related genes. Neurology 62(12): 2323-5.
Patel, R., D. Collins, S. Bullock, R. Swaminathan, G. M. Blake and I. Fogelman. 2001. The effect of season and vitamin D supplementation on bone mineral density in healthy women: a double-masked crossover study. Osteoporosis International 12(4): 319-25.
Patel, S., S. Hyer and J. Barron. 2007. Glomerular filtration rate is a major determinant of the relationship between 25-hydroxyvitamin D and parathyroid hormone. Calcified Tissue International 80(4): 221-6.
Peacock, M., G. Liu, M. Carey, R. McClintock, W. Ambrosius, S. Hui and C. C. Johnston. 2000. Effect of calcium or 25OH vitamin D3 dietary supplementation on bone loss at the hip in men and women over the age of 60. Journal of Clinical Endocrinology and Metabolism 85(9): 3011-9.
Peacock, M., C. H. Turner, M. J. Econs and T. Foroud. 2002. Genetics of osteoporosis. Endocrine Reviews 23(3): 303-26.
Pearson, D., M. Kaur, P. San, N. Lawson, P. Baker and D. Hosking. 2004. Recovery of pregnancy mediated bone loss during lactation. Bone 34(3): 570-8.
Pedersen, E. B., P. Johannesen, S. Kristensen, A. B. Rasmussen, K. Emmertsen, J. Moller, J. G. Lauritsen and M. Wohlert. 1984. Calcium, parathyroid hormone and calcitonin in normal pregnancy and preeclampsia. Gynecologic and Obstetric Investigation 18(3): 156-64.
Peehl, D. M., R. Shinghal, L. Nonn, E. Seto, A. V. Krishnan, J. D. Brooks and D. Feldman. 2004. Molecular activity of 1,25-dihydroxyvitamin D3 in primary cultures of human prostatic epithelial cells revealed by cDNA microarray analysis. Journal of Steroid Biochemistry and Molecular Biology 92(3): 131-41.
Pereira, G. R. and A. H. Zucker. 1986. Nutritional deficiencies in the neonate. Clinics in Perinatology 13(1): 175-89.
Pettersson, U., M. Nilsson, V. Sundh, D. Mellstrom and M. Lorentzon. 2010. Physical activity is the strongest predictor of calcaneal peak bone mass in young Swedish men. Osteoporosis International 21(3): 447-55.
Peyrin-Biroulet, L., A. Oussalah and M. A. Bigard. 2009. Crohn’s disease: the hot hypothesis. Medical Hypotheses 73(1): 94-6.
Pfeifer, M., B. Begerow, H. W. Minne, C. Abrams, D. Nachtigall and C. Hansen. 2000. Effects of a short-term vitamin D and calcium supplementation on body sway and secondary hyperparathyroidism in elderly women. Journal of Bone and Mineral Research 15(6): 1113-8.
Pfeifer, M., B. Begerow, H. W. Minne, D. Nachtigall and C. Hansen. 2001. Effects of a short-term vitamin D(3) and calcium supplementation on blood pressure and parathyroid hormone levels in elderly women. Journal of Clinical Endocrinology and Metabolism 86(4): 1633-7.
Pfeifer, M., B. Begerow, H. W. Minne, K. Suppan, A. Fahrleitner-Pammer and H. Dobnig. 2009. Effects of a long-term vitamin D and calcium supplementation on falls and parameters of muscle function in community-dwelling older individuals. Osteoporosis International 20(2): 315-22.
Pilz, S., H. Dobnig, B. Winklhofer-Roob, G. Riedmuller, J. E. Fischer, U. Seelhorst, B. Wellnitz, B. O. Boehm and W. Marz. 2008. Low serum levels of 25-hydroxyvitamin D predict fatal cancer in patients referred to coronary angiography. Cancer Epidemiology, Biomarkers & Prevention 17(5): 1228-33.
Pittas, A. G., B. Dawson-Hughes, T. Li, R. M. Van Dam, W. C. Willett, J. E. Manson and F. B. Hu. 2006. Vitamin D and calcium intake in relation to type 2 diabetes in women. Diabetes Care 29(3): 650-6.
Pittas, A. G., S. S. Harris, P. C. Stark and B. Dawson-Hughes. 2007a. The effects of calcium and vitamin D supplementation on blood glucose and markers of inflammation in non-diabetic adults. Diabetes Care 30(4): 980-6.
Pittas, A. G., J. Lau, F. B. Hu and B. Dawson-Hughes. 2007b. The role of vitamin D and calcium in type 2 diabetes. A systematic review and meta-analysis. Journal of Clinical Endocrinology and Metabolism 92(6): 2017-29.
Polatti, F., E. Capuzzo, F. Viazzo, R. Colleoni and C. Klersy. 1999. Bone mineral changes during and after lactation. Obstetrics and Gynecology 94(1): 52-6.
Poole, K. E., N. Loveridge, P. J. Barker, D. J. Halsall, C. Rose, J. Reeve and E. A. Warburton. 2006. Reduced vitamin D in acute stroke. Stroke 37(1): 243-5.
Poon, A. H., C. Laprise, M. Lemire, A. Montpetit, D. Sinnett, E. Schurr and T. J. Hudson. 2004. Association of vitamin D receptor genetic variants with susceptibility to asthma and atopy. American Journal of Respiratory and Critical Care Medicine 170(9): 967-73.
Porthouse, J., S. Cockayne, C. King, L. Saxon, E. Steele, T. Aspray, M. Baverstock, Y. Birks, J. Dumville, R. Francis, C. Iglesias, S. Puffer, A. Sutcliffe, I. Watt and D. J. Torgerson. 2005. Randomised controlled trial of calcium and supplementation with cholecalciferol (vitamin D3) for prevention of fractures in primary care. British Medical Journal 330(7498): 1003.
Prentice, A., L. M. Jarjou, T. J. Cole, D. M. Stirling, B. Dibba and S. Fairweather-Tait. 1995. Calcium requirements of lactating Gambian mothers: effects of a calcium supplement on breast-milk calcium concentration, maternal bone mineral content, and urinary calcium excretion. American Journal of Clinical Nutrition 62(1): 58-67.
Prentice, A., L. Yan, L. M. Jarjou, B. Dibba, M. A. Laskey, D. M. Stirling and S. Fairweather-Tait. 1997. Vitamin D status does not influence the breast-milk calcium concentration of lactating mothers accustomed to a low calcium intake. Acta Paediatrica 86(9): 1006-8.
Prentice, A. 2003. Micronutrients and the bone mineral content of the mother, fetus and newborn. Journal of Nutrition 133(5 Suppl 2): 1693S-9S.
Prentice, A. 2008. Vitamin D deficiency: a global perspective. Nutrition Reviews 66(10 Suppl 2): S153-64.
Prentice, A., G. R. Goldberg and I. Schoenmakers. 2008. Vitamin D across the lifecycle: physiology and biomarkers. American Journal of Clinical Nutrition 88(2): 500S-6S.
Priemel, M., C. von Domarus, T. O. Klatte, S. Kessler, J. Schlie, S. Meier, N. Proksch, F. Pastor, C. Netter, T. Streichert, K. Puschel and M. Amling. 2010. Bone mineralization defects and vitamin D deficiency: histomorphometric analysis of iliac crest bone biopsies and circulating 25-hydroxyvitamin D in 675 patients. Journal of Bone and Mineral Research 25(2): 305-12.
Prince, R., A. Devine, I. Dick, A. Criddle, D. Kerr, N. Kent, R. Price and A. Randell. 1995. The effects of calcium supplementation (milk powder or tablets) and exercise on bone density in postmenopausal women. Journal of Bone and Mineral Research 10(7): 1068-75.
Prince, R. L., A. Devine, S. S. Dhaliwal and I. M. Dick. 2006. Effects of calcium supplementation on clinical fracture and bone structure: results of a 5-year, double-blind, placebo-controlled trial in elderly women. Archives of Internal Medicine 166(8): 869-75.
Prince, R. L., N. Austin, A. Devine, I. M. Dick, D. Bruce and K. Zhu. 2008. Effects of ergocalciferol added to calcium on the risk of falls in elderly high-risk women. Archives of Internal Medicine 168(1): 103-8.
Prineas, J. W., A. S. Mason and R. A. Henson. 1965. Mypopathy in metabolic bone disease. British Medical Journal 1(5441): 1034-6.
Punnonen, R., J. Salmi, R. Tuimala, M. Jarvinen and P. Pystynen. 1986. Vitamin D deficiency in women with femoral neck fracture. Maturitas 8(4): 291-5.
Qiu, S., D. S. Rao, S. Palnitkar and A. M. Parfitt. 2006. Differences in osteocyte and lacunar density between black and white American women. Bone 38(1): 130-5.
Rajakumar, K., J. D. Fernstrom, J. E. Janosky and S. L. Greenspan. 2005. Vitamin D insufficiency in preadolescent African-American children. Clinical Pediatrics 44(8): 683-92.
Recker, R. R., K. M. Davies, S. M. Hinders, R. P. Heaney, M. R. Stegman and D. B. Kimmel. 1992. Bone gain in young adult women. Journal of the American Medical Association 268(17): 2403-8.
Recker, R. R., S. Hinders, K. M. Davies, R. P. Heaney, M. R. Stegman, J. M. Lappe and D. B. Kimmel. 1996. Correcting calcium nutritional deficiency prevents spine fractures in elderly women. Journal of Bone and Mineral Research 11(12): 1961-6.
Reichel, H., H. P. Koeffler and A. W. Norman. 1987. Synthesis in vitro of 1,25-dihydroxyvitamin D3 and 24,25-dihydroxyvitamin D3 by interferon-gamma-stimulated normal human bone marrow and alveolar macrophages. Journal of Biological Chemistry 262(23): 10931-7.
Reid, I. R., R. W. Ames, M. C. Evans, G. D. Gamble and S. J. Sharpe. 1993. Effect of calcium supplementation on bone loss in postmenopausal women. New England Journal of Medicine 328(7): 460-4.
Reid, I. R., R. Ames, B. Mason, H. E. Reid, C. J. Bacon, M. J. Bolland, G. D. Gamble, A. Grey and A. Horne. 2008. Randomized controlled trial of calcium supplementation in healthy, nonosteoporotic, older men. Archives of Internal Medicine 168(20): 2276-82.
Reif, S., Y. Katzir, Z. Eisenberg and Y. Weisman. 1988. Serum 25-hydroxyvitamin D levels in congenital craniotabes. Acta Paediatrica Scandinavica 77(1): 167-8.
Rhodes, S. G., L. A. Terry, J. Hope, R. G. Hewinson and H. M. Vordermeier. 2003. 1,25-dihydroxyvitamin D3 and development of tuberculosis in cattle. Clinical and Diagnostic Laboratory Immunology 10(6): 1129-35.
Riggs, B. L., W. M. O’Fallon, J. Muhs, M. K. O’Connor, R. Kumar and L. J. Melton, 3rd. 1998. Long-term effects of calcium supplementation on serum parathyroid hormone level, bone turnover, and bone loss in elderly women. Journal of Bone and Mineral Research 13(2): 168-74.
Riggs, B. L., L. J. Melton, R. A. Robb, J. J. Camp, E. J. Atkinson, L. McDaniel, S. Amin, P. A. Rouleau and S. Khosla. 2008. A population-based assessment of rates of bone loss at multiple skeletal sites: evidence for substantial trabecular bone loss in young adult women and men. Journal of Bone and Mineral Research 23(2): 205-14.
Riis, B., K. Thomsen and C. Christiansen. 1987. Does calcium supplementation prevent postmenopausal bone loss? A double-blind, controlled clinical study. New England Journal of Medicine 316(4): 173-7.
Ritchie, L. D., E. B. Fung, B. P. Halloran, J. R. Turnlund, M. D. Van Loan, C. E. Cann and J. C. King. 1998. A longitudinal study of calcium homeostasis during human pregnancy and lactation and after resumption of menses. American Journal of Clinical Nutrition 67(4): 693-701.
Rohan, T. E., A. Negassa, R. T. Chlebowski, C. D. Ceria-Ulep, B. B. Cochrane, D. S. Lane, M. Ginsberg, S. Wassertheil-Smoller and D. L. Page. 2009. A randomized controlled trial of calcium plus vitamin D supplementation and risk of benign proliferative breast disease. Breast Cancer Research and Treatment 116(2): 339-50.
Ron, M., M. Levitz, J. Chuba and J. Dancis. 1984. Transfer of 25-hydroxyvitamin D3 and 1,25-dihydroxyvitamin D3 across the perfused human placenta. American Journal of Obstetrics and Gynecology 148(4): 370-4.
Rosen, C. J., A. Morrison, H. Zhou, D. Storm, S. J. Hunter, K. Musgrave, T. Chen, W. Wei and M. F. Holick. 1994. Elderly women in northern New England exhibit seasonal changes in bone mineral density and calciotropic hormones. Bone and Mineral 25(2): 83-92.
Rossi, M., J. K. McLaughlin, P. Lagiou, C. Bosetti, R. Talamini, L. Lipworth, A. Giacosa, M. Montella, S. Franceschi, E. Negri and C. La Vecchia. 2009. Vitamin D intake and breast cancer risk: a case–control study in Italy. Annals of Oncology 20(2): 374-8.
Rothberg, A. D., J. M. Pettifor, D. F. Cohen, E. W. Sonnendecker and F. P. Ross. 1982. Maternal-infant vitamin D relationships during breast-feeding. Journal of Pediatrics 101(4): 500-3.
Rowling, M. J., C. Gliniak, J. Welsh and J. C. Fleet. 2007. High dietary vitamin D prevents hypocalcemia and osteomalacia in CYP27B1 knockout mice. Journal of Nutrition 137(12): 2608-15.
Rucker, D., J. A. Allan, G. H. Fick and D. A. Hanley. 2002. Vitamin D insufficiency in a population of healthy western Canadians. Canadian Medical Association Journal 166(12): 1517-24.
Ruiz-Irastorza, G., M. V. Egurbide, N. Olivares, A. Martinez-Berriotxoa and C. Aguirre. 2008. Vitamin D deficiency in systemic lupus erythematosus: prevalence, predictors and clinical consequences. Rheumatology 47(6): 920-3.
Rummens, K., R. van Bree, E. Van Herck, Z. Zaman, R. Bouillon, F. A. Van Assche and J. Verhaeghe. 2002. Vitamin D deficiency in guinea pigs: exacerbation of bone phenotype during pregnancy and disturbed fetal mineralization, with recovery by 1,25(OH)2D3 infusion or dietary calcium-phosphate supplementation. Calcified Tissue International 71(4): 364-75.
Russell, R., M. Chung, E. M. Balk, S. Atkinson, E. L. Giovannucci, S. Ip, A. H. Lichtenstein, S. T. Mayne, G. Raman, A. C. Ross, T. A. Trikalinos, K. P. West, Jr. and J. Lau. 2009. Opportunities and challenges in conducting systematic reviews to support the development of nutrient reference values: vitamin A as an example. American Journal of Clinical Nutrition 89(3): 728-33.
Saadi, H. F., A. Dawodu, B. O. Afandi, R. Zayed, S. Benedict and N. Nagelkerke. 2007. Efficacy of daily and monthly high-dose calciferol in vitamin D-deficient nulliparous and lactating women. American Journal of Clinical Nutrition 85(6): 1565-71.
Salovaara, K., M. Tuppurainen, M. Karkkainen, T. Rikkonen, L. Sandini, J. Sirola, R. Honkanen, E. Alhava and H. Kroger. 2010. Effect of vitamin D(3) and calcium on fracture risk in 65- to 71-year-old women: a population-based 3-year randomized, controlled trial—the OSTPRE-FPS. Journal of Bone and Mineral Research 25(7): 1487-95.
Sanchez, B., E. Lopez-Martin, C. Segura, J. L. Labandeira-Garcia and R. Perez-Fernandez. 2002. 1,25-dihydroxyvitamin D(3) increases striatal GDNF mRNA and protein expression in adult rats. Brain Research. Molecular Brain Research 108(1-2): 143-6.
Sanders, K. M., A. L. Stuart, E. J. Williamson, J. A. Simpson, M. A. Kotowicz, D. Young and G. C. Nicholson. 2010. Annual high-dose oral vitamin D and falls and fractures in older women: a randomized controlled trial. Journal of the American Medical Association 303(18): 1815-22.
Sann, L., L. David, A. Thomas, A. Frederich, M. C. Chapuy and R. Francois. 1976. Congenital hyperparathyroidism and vitamin D deficiency secondary to maternal hypoparathyroidism. Acta Paediatrica Scandinavica 65(3): 381-5.
Sarkis, K. S., M. B. Salvador, M. M. Pinheiro, R. G. Silva, C. A. Zerbini and L. A. Martini. 2009. Association between osteoporosis and rheumatoid arthritis in women: a cross–sectional study. Sao Paulo Medical Journal 127(4): 216-22.
Sayers, A. and J. H. Tobias. 2009. Estimated maternal ultraviolet B exposure levels in pregnancy influence skeletal development of the child. Journal of Clinical Endocrinology and Metabolism 94(3): 765-71.
Schaafsma, A., J. J. van Doormaal, F. A. Muskiet, G. J. Hofstede, I. Pakan and E. van der Veer. 2002. Positive effects of a chicken eggshell powder-enriched vitamin-mineral supplement on femoral neck bone mineral density in healthy late post-menopausal Dutch women. British Journal of Nutrition 87(3): 267-75.
Schauber, J., R. A. Dorschner, K. Yamasaki, B. Brouha and R. L. Gallo. 2006. Control of the innate epithelial antimicrobial response is cell-type specific and dependent on relevant microenvironmental stimuli. Immunology 118(4): 509-19.
Schleithoff, S. S., A. Zittermann, G. Tenderich, H. K. Berthold, P. Stehle and R. Koerfer. 2006. Vitamin D supplementation improves cytokine profiles in patients with congestive heart failure: a double-blind, randomized, placebo-controlled trial. American Journal of Clinical Nutrition 83(4): 754-9.
Schneider, B., B. Weber, A. Frensch, J. Stein and J. Fritz. 2000. Vitamin D in schizophrenia, major depression and alcoholism. Journal of Neural Transmission 107(7): 839-42.
Schnitzler, C. M., J. M. Pettifor, J. M. Mesquita, M. D. Bird, E. Schnaid and A. E. Smyth. 1990. Histomorphometry of iliac crest bone in 346 normal black and white South African adults. Bone and Mineral 10(3): 183-99.
Schnitzler, C. M. and J. M. Mesquita. 2006. Cortical bone histomorphometry of the iliac crest in normal black and white South African adults. Calcified Tissue International 79(6): 373-82.
Scholl, T. O. and X. Chen. 2009. Vitamin D intake during pregnancy: association with maternal characteristics and infant birth weight. Early Human Development 85(4): 231-4.
Schwartz, G. G. and B. S. Hulka. 1990. Is vitamin D deficiency a risk factor for prostate cancer? (Hypothesis). Anticancer Research 10(5A): 1307-11.
Scragg, R., R. Jackson, I. M. Holdaway, T. Lim and R. Beaglehole. 1990. Myocardial infarction is inversely associated with plasma 25-hydroxyvitamin D3 levels: a community-based study. International Journal of Epidemiology 19(3): 559-63.
Scragg, R., I. Holdaway, V. Singh, P. Metcalf, J. Baker and E. Dryson. 1995. Serum 25-hydroxyvitamin D3 levels decreased in impaired glucose tolerance and diabetes mellitus. Diabetes Research and Clinical Practice 27(3): 181-8.
Seely, E. W., R. J. Wood, E. M. Brown and S. W. Graves. 1992. Lower serum ionized calcium and abnormal calciotropic hormone levels in preeclampsia. Journal of Clinical Endocrinology and Metabolism 74(6): 1436-40.
Seely, E. W., E. M. Brown, D. M. DeMaggio, D. K. Weldon and S. W. Graves. 1997. A prospective study of calciotropic hormones in pregnancy and post partum: reciprocal changes in serum intact parathyroid hormone and 1,25-dihydroxyvitamin D. American Journal of Obstetrics and Gynecology 176(1 Pt 1): 214-7.
Seino, Y., M. Ishida, K. Yamaoka, T. Ishii, T. Hiejima, C. Ikehara, Y. Tanaka, S. Matsuda, T. Shimotsuji, H. Yabuuchi, S. Morimoto and T. Onishi. 1982. Serum calcium regulating hormones in the perinatal period. Calcified Tissue International 34(2): 131-5.
Selvaraj, P., M. Vidyarani, K. Alagarasu, S. Prabhu Anand and P. R. Narayanan. 2008. Regulatory role of promoter and 3’ UTR variants of vitamin D receptor gene on cytokine response in pulmonary tuberculosis. Journal of Clinical Immunology 28(4): 306-13.
Sergeev, I. N. and W. B. Rhoten. 1995. 1,25-dihydroxyvitamin D3 evokes oscillations of intracellular calcium in a pancreatic beta-cell line. Endocrinology 136(7): 2852-61.
Shaffer, J. R., C. M. Kammerer, D. Reich, G. McDonald, N. Patterson, B. Goodpaster, D. C. Bauer, J. Li, A. B. Newman, J. A. Cauley, T. B. Harris, F. Tylavsky, R. E. Ferrell and J. M. Zmuda. 2007. Genetic markers for ancestry are correlated with body composition traits in older African Americans. Osteoporosis International 18(6): 733-41.
Sharma, O. P., J. Lamon and D. Winsor. 1972. Hypercalcemia and tuberculosis. Journal of the American Medical Association 222(5): 582.
Sharma, S. C. 1981. Serum calcium in pulmonary tuberculosis. Postgraduate Medical Journal 57(673): 694-6.
Shea, B., G. Wells, A. Cranney, N. Zytaruk, V. Robinson, L. Griffith, Z. Ortiz, J. Peterson, J. Adachi, P. Tugwell and G. Guyatt. 2002. Meta-analyses of therapies for postmenopausal osteoporosis. VII. Meta-analysis of calcium supplementation for the prevention of post-menopausal osteoporosis. Endocrine Reviews 23(4): 552-9.
Shea, M. K., S. L. Booth, J. M. Massaro, P. F. Jacques, R. B. D’Agostino, Sr., B. Dawson-Hughes, J. M. Ordovas, C. J. O’Donnell, S. Kathiresan, J. F. Keaney, Jr., R. S. Vasan and E. J. Benjamin. 2008. Vitamin K and vitamin D status: associations with inflammatory markers in the Framingham Offspring Study. American Journal of Epidemiology 167(3): 313-20.
Shin, M. H., M. D. Holmes, S. E. Hankinson, K. Wu, G. A. Colditz and W. C. Willett. 2002. Intake of dairy products, calcium, and vitamin D and risk of breast cancer. Journal of the National Cancer Institute 94(17): 1301-11.
Silver, J., H. Landau, I. Bab, Y. Shvil, M. M. Friedlaender, D. Rubinger and M. M. Popovtzer. 1985. Vitamin D-dependent rickets types I and II. Diagnosis and response to therapy. Israel Journal of Medical Sciences 21(1): 53-6.
Simmons, J. D., C. Mullighan, K. I. Welsh and D. P. Jewell. 2000. Vitamin D receptor gene polymorphism: association with Crohn’s disease susceptibility. Gut 47(2): 211-4.
Sita-Lumsden, A., G. Lapthorn, R. Swaminathan and H. J. Milburn. 2007. Reactivation of tuberculosis and vitamin D deficiency: the contribution of diet and exposure to sunlight. Thorax 62(11): 1003-7.
Skaria, J., B. C. Katiyar, T. P. Srivastava and B. Dube. 1975. Myopathy and neuropathy associated with osteomalacia. Acta Neurologica Scandinavica 51(1): 37-58.
Slack, J. H., L. Hang, J. Barkley, R. J. Fulton, L. D’Hoostelaere, A. Robinson and F. J. Dixon. 1984. Isotypes of spontaneous and mitogen-induced autoantibodies in SLE-prone mice. Journal of Immunology 132(3): 1271-5.
Slemenda, C. W., M. Peacock, S. Hui, L. Zhou and C. C. Johnston. 1997. Reduced rates of skeletal remodeling are associated with increased bone mineral density during the development of peak skeletal mass. Journal of Bone and Mineral Research 12(4): 676-82.
Slinin, Y., M. L. Paudel, B. C. Taylor, H. A. Fink, A. Ishani, M. T. Canales, K. Yaffe, E. Barrett-Connor, E. S. Orwoll, J. M. Shikany, E. S. Leblanc, J. A. Cauley and K. E. Ensrud. 2010. 25-hydroxyvitamin D levels and cognitive performance and decline in elderly men. Neurology 74(1): 33-41.
Sloka, J. S., W. E. Pryse-Phillips and M. Stefanelli. 2008. The relation of ultraviolet radiation and multiple sclerosis in Newfoundland. Canadian Journal of Neurological Sciences 35(1): 69-74.
Sloka, S., J. Stokes, E. Randell and L. A. Newhook. 2009. Seasonal variation of maternal serum vitamin D in Newfoundland and Labrador. Journal of Obstetrics and Gynaecology Canada 31(4): 313-21.
Sloka, S., M. Grant and L. A. Newhook. 2010. The geospatial relation between UV solar radiation and type 1 diabetes in Newfoundland. Acta Diabetologica 47(1): 73-8.
Slovik, D. M., J. S. Adams, R. M. Neer, M. F. Holick and J. T. Potts, Jr. 1981. Deficient production of 1,25-dihydroxyvitamin D in elderly osteoporotic patients. New England Journal of Medicine 305(7): 372-4.
Smith, H., F. Anderson, H. Raphael, P. Maslin, S. Crozier and C. Cooper. 2007. Effect of annual intramuscular vitamin D on fracture risk in elderly men and women—a population-based, randomized, double-blind, placebo-controlled trial. Rheumatology 46(12): 1852-7.
Smith, S. J., M. E. Hayes, P. L. Selby and E. B. Mawer. 1999. Autocrine control of vitamin D metabolism in synovial cells from arthritic patients. Annals of the Rheumatic Diseases 58(6): 372-8.
Smolders, J., P. Menheere, A. Kessels, J. Damoiseaux and R. Hupperts. 2008. Association of vitamin D metabolite levels with relapse rate and disability in multiple sclerosis. Multiple Sclerosis 14(9): 1220-4.
Smolders, J., J. Damoiseaux, P. Menheere, J. W. Tervaert and R. Hupperts. 2009. Association study on two vitamin D receptor gene polymorphisms and vitamin D metabolites in multiple sclerosis. Annals of the New York Academy of Sciences 1173: 515-20.
Snijder, M. B., N. M. van Schoor, S. M. Pluijm, R. M. van Dam, M. Visser and P. Lips. 2006. Vitamin D status in relation to one-year risk of recurrent falling in older men and women. Journal of Clinical Endocrinology and Metabolism 91(8): 2980-5.
Soilu-Hanninen, M., M. Laaksonen, I. Laitinen, J. P. Eralinna, E. M. Lilius and I. Mononen. 2008. A longitudinal study of serum 25-hydroxyvitamin D and intact parathyroid hormone levels indicate the importance of vitamin D and calcium homeostasis regulation in multiple sclerosis. Journal of Neurology, Neurosurgery and Psychiatry 79(2): 152-7.
Sokoloff, L. 1978. Occult osteomalacia in American (U.S.A.) patients with fracture of the hip. American Journal of Surgical Pathology 2(1): 21-30.
Song, Y. and J. C. Fleet. 2007. Intestinal resistance to 1,25 dihydroxyvitamin D in mice heterozygous for the vitamin D receptor knockout allele. Endocrinology 148(3): 1396-402.
Sowers, M., R. B. Wallace and J. H. Lemke. 1985. Correlates of forearm bone mass among women during maximal bone mineralization. Preventive Medicine 14(5): 585-96.
Sowers, M. R., M. K. Clark, B. Hollis, R. B. Wallace and M. Jannausch. 1992. Radial bone mineral density in pre- and perimenopausal women: a prospective study of rates and risk factors for loss. Journal of Bone and Mineral Research 7(6): 647-57.
Sowers, M. 1996. Pregnancy and lactation as risk factors for subsequent bone loss and osteoporosis. Journal of Bone and Mineral Research 11(8): 1052-60.
Sowers, M., D. Zhang, B. W. Hollis, B. Shapiro, C. A. Janney, M. Crutchfield, M. A. Schork, F. Stanczyk and J. Randolph. 1998. Role of calciotrophic hormones in calcium mobilization of lactation. American Journal of Clinical Nutrition 67(2): 284-91.
Sowers, M. R., H. Zheng, M. L. Jannausch, D. McConnell, B. Nan, S. Harlow and J. F. Randolph, Jr. 2010. Amount of bone loss in relation to time around the final menstrual period and follicle-stimulating hormone staging of the transmenopause. Journal of Clinical Endocrinology and Metabolism 95(5): 2155-62.
Specker, B. L., R. C. Tsang and M. L. Ho. 1991. Changes in calcium homeostasis over the first year postpartum: effect of lactation and weaning. Obstetrics and Gynecology 78(1): 56-62.
Specker, B. L., M. L. Ho, A. Oestreich, T. A. Yin, Q. M. Shui, X. C. Chen and R. C. Tsang. 1992. Prospective study of vitamin D supplementation and rickets in China. Journal of Pediatrics 120(5): 733-9.
Specker, B. L. 1994. Do North American women need supplemental vitamin D during pregnancy or lactation? American Journal of Clinical Nutrition 59(Suppl 2): 484S-90S; discussion 490S-1S.
Specker, B. L., N. E. Vieira, K. O. O’Brien, M. L. Ho, J. E. Heubi, S. A. Abrams and A. L. Yergey. 1994. Calcium kinetics in lactating women with low and high calcium intakes. American Journal of Clinical Nutrition 59(3): 593-9.
Specker, B. 2004. Vitamin D requirements during pregnancy. American Journal of Clinical Nutrition 80(Suppl 6): 1740S-7S.
Stacey, J. and C. Daly. 1989. Osteomalacia in the elderly: biochemical screening in general practice. Irish Medical Journal 82(2): 72-3.
St-Arnaud, R., S. Messerlian, J. M. Moir, J. L. Omdahl and F. H. Glorieux. 1997. The 25-hydroxyvitamin D 1-alpha-hydroxylase gene maps to the pseudovitamin D-deficiency rickets (PDDR) disease locus. Journal of Bone and Mineral Research 12(10): 1552-9.
Steingrimsdottir, L., O. Gunnarsson, O. S. Indridason, L. Franzson and G. Sigurdsson. 2005. Relationship between serum parathyroid hormone levels, vitamin D sufficiency, and calcium intake. Journal of the American Medical Association 294(18): 2336-41.
Stewart, J. W., D. L. Alekel, L. M. Ritland, M. Van Loan, E. Gertz and U. Genschel. 2009. Serum 25-hydroxyvitamin D is related to indicators of overall physical fitness in healthy postmenopausal women. Menopause 16(6): 1093-101.
Stio, M., B. Lunghi, T. Iantomasi, M. T. Vincenzini and C. Treves. 1993. Effect of vitamin D deficiency and 1,25-dihydroxyvitamin D3 on metabolism and D-glucose transport in rat cerebral cortex. Journal of Neuroscience Research 35(5): 559-66.
Stone, K., D. C. Bauer, D. M. Black, P. Sklarin, K. E. Ensrud and S. R. Cummings. 1998. Hormonal predictors of bone loss in elderly women: a prospective study. The Study of Osteoporotic Fractures Research Group. Journal of Bone and Mineral Research 13(7): 1167-74.
Storm, D., R. Eslin, E. S. Porter, K. Musgrave, D. Vereault, C. Patton, C. Kessenich, S. Mohan, T. Chen, M. F. Holick and C. J. Rosen. 1998. Calcium supplementation prevents seasonal bone loss and changes in biochemical markers of bone turnover in elderly New England women: a randomized placebo-controlled trial. Journal of Clinical Endocrinology and Metabolism 83(11): 3817-25.
Strachan, D. P., K. J. Powell, A. Thaker, F. J. Millard and J. D. Maxwell. 1995. Vegetarian diet as a risk factor for tuberculosis in immigrant south London Asians. Thorax 50(2): 175-80.
Swami, S., N. Raghavachari, U. R. Muller, Y. P. Bao and D. Feldman. 2003. Vitamin D growth inhibition of breast cancer cells: gene expression patterns assessed by cDNA microarray. Breast Cancer Research and Treatment 80(1): 49-62.
Szodoray, P., B. Nakken, J. Gaal, R. Jonsson, A. Szegedi, E. Zold, G. Szegedi, J. G. Brun, R. Gesztelyi, M. Zeher and E. Bodolay. 2008. The complex role of vitamin D in autoimmune diseases. Scandinavian Journal of Immunology 68(3): 261-9.
Takeda, E., H. Yamamoto, Y. Taketani and K. Miyamoto. 1997. Vitamin D-dependent rickets type I and type II. Acta Paediatrica Japonica 39(4): 508-13.
Takeuchi, A., T. Okano, N. Tsugawa, Y. Tasaka, T. Kobayashi, S. Kodama and T. Matsuo. 1989. Effects of ergocalciferol supplementation on the concentration of vitamin D and its metabolites in human milk. Journal of Nutrition 119(11): 1639-46.
Tang, B. M., G. D. Eslick, C. Nowson, C. Smith and A. Bensoussan. 2007. Use of calcium or calcium in combination with vitamin D supplementation to prevent fractures and bone loss in people aged 50 years and older: a meta-analysis. Lancet 370(9588): 657-66.
Taniura, H., M. Ito, N. Sanada, N. Kuramoto, Y. Ohno, N. Nakamichi and Y. Yoneda. 2006. Chronic vitamin D3 treatment protects against neurotoxicity by glutamate in association with upregulation of vitamin D receptor mRNA expression in cultured rat cortical neurons. Journal of Neuroscience Research 83(7): 1179-89.
Targher, G., L. Bertolini, R. Padovani, L. Zenari, L. Scala, M. Cigolini and G. Arcaro. 2006. Serum 25-hydroxyvitamin D3 concentrations and carotid artery intima-media thickness among type 2 diabetic patients. Clinical Endocrinology 65(5): 593-7.
Teotia, M., S. P. Teotia and M. Nath. 1995. Metabolic studies in congenital vitamin D deficiency rickets. Indian Journal of Pediatrics 62(1): 55-61.
Teotia, M. and S. P. Teotia. 1997. Nutritional and metabolic rickets. Indian Journal of Pediatrics 64(2): 153-7.
Tetlow, L. C. and D. E. Woolley. 1999. The effects of 1 alpha,25-dihydroxyvitamin D(3) on matrix metalloproteinase and prostaglandin E(2) production by cells of the rheumatoid lesion. Arthritis Research 1(1): 63-70.
Thacher, T. D. 1997. Rickets without vitamin D deficiency in Nigerian children. Ambulatory Child Health 3(1 Pt 1): 56-64.
Thacher, T. D., P. R. Fischer, J. M. Pettifor, J. O. Lawson, C. O. Isichei and G. M. Chan. 2000. Case–control study of factors associated with nutritional rickets in Nigerian children. Journal of Pediatrics 137(3): 367-73.
Thacher, T. D., M. O. Obadofin, K. O. O’Brien and S. A. Abrams. 2009. The effect of vitamin D2 and vitamin D3 on intestinal calcium absorption in Nigerian children with rickets. Journal of Clinical Endocrinology and Metabolism 94(9): 3314-21.
Thandrayen, K., S. A. Norris and J. M. Pettifor. 2009. Fracture rates in urban South African children of different ethnic origins: the Birth to Twenty cohort. Osteoporosis International 20(1): 47-52.
Thiebaud, D., P. Burckhardt, M. Costanza, D. Sloutskis, D. Gilliard, F. Quinodoz, A. F. Jacquet and B. Burnand. 1997. Importance of albumin, 25(OH)-vitamin D and IGFBP-3 as risk factors in elderly women and men with hip fracture. Osteoporosis International 7(5): 457-62.
Thorne, J. and M. J. Campbell. 2008. The vitamin D receptor in cancer. Proceedings of the Nutrition Society 67(2): 115-27.
Thys-Jacobs, S., P. Starkey, D. Bernstein and J. Tian. 1998. Calcium carbonate and the premenstrual syndrome: effects on premenstrual and menstrual symptoms. Premenstrual Syndrome Study Group. American Journal of Obstetrics and Gynecology 179(2): 444-52.
Timms, P. M., N. Mannan, G. A. Hitman, K. Noonan, P. G. Mills, D. Syndercombe-Court, E. Aganna, C. P. Price and B. J. Boucher. 2002. Circulating MMP9, vitamin D and variation in the TIMP-1 response with VDR genotype: mechanisms for inflammatory damage in chronic disorders? Quarterly Journal of Medicine 95(12): 787-96.
Toescu, E. C. and A. Verkhratsky. 2007. Role of calcium in normal aging and neurodegeneration. Aging Cell 6(3): 265.
Towler, D. 2009. Adverse health effects of excessive vitamin D and calcium intake: considerations relevant to cardiovascular disease and nephrocalcinosis. A white paper commissioned for the Committee to Review Dietary Reference Intakes for Vitamin D and Calcium. Washington, DC.
Tracy, J. K., W. A. Meyer, R. H. Flores, P. D. Wilson and M. C. Hochberg. 2005. Racial differences in rate of decline in bone mass in older men: the Baltimore men’s osteoporosis study. Journal of Bone and Mineral Research 20(7): 1228-34.
Tracy, J. K., W. A. Meyer, M. Grigoryan, B. Fan, R. H. Flores, H. K. Genant, C. Resnik and M. C. Hochberg. 2006. Racial differences in the prevalence of vertebral fractures in older men: the Baltimore Men’s Osteoporosis Study. Osteoporosis International 17(1): 99-104.
Travison, T. G., T. J. Beck, G. R. Esche, A. B. Araujo and J. B. McKinlay. 2008. Age trends in proximal femur geometry in men: variation by race and ethnicity. Osteoporosis International 19(3): 277-87.
Trivedi, D. P., R. Doll and K. T. Khaw. 2003. Effect of four monthly oral vitamin D3 (cholecalciferol) supplementation on fractures and mortality in men and women living in the community: randomised double blind controlled trial. British Medical Journal 326(7387): 469.
Trotter, M. and B. B. Hixon. 1974. Sequential changes in weight, density, and percentage ash weight of human skeletons from an early fetal period through old age. Anatomical Record 179(1): 1-18.
Tuck, S. P. and H. K. Datta. 2007. Osteoporosis in the aging male: treatment options. Clinical Intervention Aging 2(4): 521-36.
Turner, M., P. E. Barre, A. Benjamin, D. Goltzman and M. Gascon-Barre. 1988. Does the maternal kidney contribute to the increased circulating 1,25-dihydroxyvitamin D concentrations during pregnancy? Mineral and Electrolyte Metabolism 14(4): 246-52.
Tylavsky, F. A., K. A. Ryder, A. Lyytikainen and S. Cheng. 2005. Vitamin D, parathyroid hormone, and bone mass in adolescents. Journal of Nutrition 135(11): 2735S-8S.
Ulrich, U., P. B. Miller, D. R. Eyre, C. H. Chesnut, 3rd, H. Schlebusch and M. R. Soules. 2003. Bone remodeling and bone mineral density during pregnancy. Archives of Gynecology and Obstetrics 268(4): 309-16.
Underdahl, N. R. and G. A. Young. 1956. Effect of dietary intake of fat-soluble vitamins on intensity of experimental swine influenza virus infection in mice. Virology 2(3): 415-29.
Urashima, M., T. Segawa, M. Okazaki, M. Kurihara, Y. Wada and H. Ida. 2010. Randomized trial of vitamin D supplementation to prevent seasonal influenza A in schoolchildren. American Journal of Clinical Nutrition 91(5): 1255-60.
Uusi-Rasi, K., H. Sievanen, M. Pasanen, T. J. Beck and P. Kannus. 2008. Influence of calcium intake and physical activity on proximal femur bone mass and structure among pre- and postmenopausal women. A 10-year prospective study. Calcified Tissue International 82(3): 171-81.
Vaisberg, M. W., R. Kaneno, M. F. Franco and N. F. Mendes. 2000. Influence of cholecalciferol (vitamin D3) on the course of experimental systemic lupus erythematosus in F1 (NZBxW) mice. Journal of Clinical Laboratory Analysis 14(3): 91-6.
Van Cromphaut, S. J., M. Dewerchin, J. G. Hoenderop, I. Stockmans, E. Van Herck, S. Kato, R. J. Bindels, D. Collen, P. Carmeliet, R. Bouillon and G. Carmeliet. 2001. Duodenal calcium absorption in vitamin D receptor-knockout mice: functional and molecular aspects. Proceedings of the National Academy of Sciences of the United States of America 98(23): 13324-9.
van der Mei, I. A., A. L. Ponsonby, T. Dwyer, L. Blizzard, B. V. Taylor, T. Kilpatrick, H. Butzkueven and A. J. McMichael. 2007. Vitamin D levels in people with multiple sclerosis and community controls in Tasmania, Australia. Journal of Neurology 254(5): 581-90.
van der Wiel, H. E., P. Lips, J. Nauta, J. C. Netelenbos and G. J. Hazenberg. 1991. Biochemical parameters of bone turnover during ten days of bed rest and subsequent mobilization. Bone and Mineral 13(2): 123-9.
van Dijk, C. E., M. R. de Boer, L. L. Koppes, J. C. Roos, P. Lips and J. W. Twisk. 2009. Positive association between the course of vitamin D intake and bone mineral density at 36 years in men. Bone 44(3): 437-41.
van Schoor, N. M., M. Visser, S. M. Pluijm, N. Kuchuk, J. H. Smit and P. Lips. 2008. Vitamin D deficiency as a risk factor for osteoporotic fractures. Bone 42(2): 260-6.
Vatanparast, H., D. A. Bailey, A. D. Baxter-Jones and S. J. Whiting. 2010. Calcium requirements for bone growth in Canadian boys and girls during adolescence. British Journal of Nutrition: 1-6.
Velho, S., P. Marques-Vidal, F. Baptista and M. E. Camilo. 2008. Dietary intake adequacy and cognitive function in free-living active elderly: a cross–sectional and short-term prospective study. Clinical Nutrition 27(1): 77-86.
Velie, E. M., S. Nechuta and J. R. Osuch. 2005. Lifetime reproductive and anthropometric risk factors for breast cancer in postmenopausal women. Breast Disease 24: 17-35.
Vieth, R., Y. Ladak and P. G. Walfish. 2003. Age-related changes in the 25-hydroxyvitamin D versus parathyroid hormone relationship suggest a different reason why older adults require more vitamin D. Journal of Clinical Endocrinology and Metabolism 88(1): 185-91.
Vieth, R., S. Kimball, A. Hu and P. G. Walfish. 2004. Randomized comparison of the effects of the vitamin D3 adequate intake versus 100 mcg (4000 IU) per day on biochemical responses and the wellbeing of patients. Nutrition Journal 3: 8.
Viljakainen, H. T., E. Saarnio, T. Hytinantti, M. Miettinen, H. Surcel, O. Makitie, S. Andersson, K. Laitinen and C. Lamberg-Allardt. 2010. Maternal vitamin D status determines bone variables in the newborn. Journal of Clinical Endocrinology and Metabolism 95(4): 1749-57.
Villar, J., H. Abdel-Aleem, M. Merialdi, M. Mathai, M. M. Ali, N. Zavaleta, M. Purwar, J. Hofmeyr, T. N. Nguyen, L. Campodonico, S. Landoulsi, G. Carroli and M. Lindheimer. 2006. World Health Organization randomized trial of calcium supplementation among low calcium intake pregnant women. American Journal of Obstetrics and Gynecology 194(3): 639-49.
Villareal, D. T., R. Civitelli, A. Chines and L. V. Avioli. 1991. Subclinical vitamin D deficiency in postmenopausal women with low vertebral bone mass. Journal of Clinical Endocrinology and Metabolism 72(3): 628-34.
von Hurst, P. R., W. Stonehouse and J. Coad. 2010. Vitamin D supplementation reduces insulin resistance in South Asian women living in New Zealand who are insulin resistant and vitamin D deficient—a randomised, placebo-controlled trial. British Journal of Nutrition 103(4): 549-55.
von Knorring, J., P. Slatis, T. H. Weber and T. Helenius. 1982. Serum levels of 25-hydroxyvitamin D, 24,25-dihydroxyvitamin D and parathyroid hormone in patients with femoral neck fracture in southern Finland. Clinical Endocrinology 17(2): 189-94.
Wagner, C. L., T. C. Hulsey, D. Fanning, M. Ebeling and B. W. Hollis. 2006. High-dose vitamin D3 supplementation in a cohort of breastfeeding mothers and their infants: a 6-month follow-up pilot study. Breastfeeding Medicine 1(2): 59-70.
Wagner, C. L. and F. R. Greer. 2008. Prevention of rickets and vitamin D deficiency in infants, children, and adolescents. Pediatrics 122(5): 1142-52.
Wagner, C. L., D. Johnson, T. C. Hulsey, M. Ebeling, J. Shary, P. G. Smith, B. B. Bivens and B. W. Hollis. 2010a. Vitamin D Supplementation during Pregnancy Part 2 NICHD/CTSA Randomized Clinical Trial (RCT): Outcomes. PAS Abstract.
Wagner, C. L., D. Johnson, T. C. Hulsey, M. Ebeling, J. Shary, P. G. Smith, B. B. Bivens and B. W. Hollis. 2010b. Vitamin D Supplementation during Pregnancy Part 1 NICHD/CTSA Randomized Clinical Trial (RCT): Safety Consideration. PAS Abstract.
Wang, L., J. E. Manson, J. E. Buring, I. M. Lee and H. D. Sesso. 2008. Dietary intake of dairy products, calcium, and vitamin D and the risk of hypertension in middle-aged and older women. Hypertension 51(4): 1073-9.
Wang, L., J. E. Manson, Y. Song and H. D. Sesso. 2010. Systematic review: vitamin D and calcium supplementation in prevention of cardiovascular events. Annals of Internal Medicine 152(5): 315-23.
Wang, M. C., M. Aguirre, G. S. Bhudhikanok, C. G. Kendall, S. Kirsch, R. Marcus and L. K. Bachrach. 1997. Bone mass and hip axis length in healthy Asian, black, Hispanic, and white American youths. Journal of Bone and Mineral Research 12(11): 1922-35.
Wang, T. J., M. J. Pencina, S. L. Booth, P. F. Jacques, E. Ingelsson, K. Lanier, E. J. Benjamin, R. B. D’Agostino, M. Wolf and R. S. Vasan. 2008. Vitamin D deficiency and risk of cardiovascular disease. Circulation 117(4): 503-11.
Wang, X., C. M. Kammerer, V. W. Wheeler, A. L. Patrick, C. H. Bunker and J. M. Zmuda. 2007. Genetic and environmental determinants of volumetric and areal BMD in multi-generational families of African ancestry: the Tobago Family Health Study. Journal of Bone and Mineral Research 22(4): 527-36.
Washington, M. N. and N. L. Weigel. 2010. 1{alpha},25-dihydroxyvitamin D3 inhibits growth of VCaP prostate cancer cells despite inducing the growth-promoting TMPRSS2:ERG gene fusion. Endocrinology 151(4): 1409-17.
Waters, W. R., M. V. Palmer, B. J. Nonnecke, D. L. Whipple and R. L. Horst. 2004. Mycobacterium bovis infection of vitamin D-deficient NOS2-/- mice. Microbial Pathogenesis 36(1): 11-7.
Watson, K. E., M. L. Abrolat, L. L. Malone, J. M. Hoeg, T. Doherty, R. Detrano and L. L. Demer. 1997. Active serum vitamin D levels are inversely correlated with coronary calcification. Circulation 96(6): 1755-60.
WCRF (World Cancer Research Fund)/AICR (American Institute for Cancer Research). 2007. Food, Nutrition, Physical Activity, and the Prevention of Cancer: A Global Perspective. Washington, DC: AICR.
Weaver, C. M. 1994. Age related calcium requirements due to changes in absorption and utilization. Journal of Nutrition 124(Suppl 8): 1418S-25S.
Weaver, C. M., L. D. McCabe, G. P. McCabe, M. Braun, B. R. Martin, L. A. Dimeglio and M. Peacock. 2008. Vitamin D status and calcium metabolism in adolescent black and white girls on a range of controlled calcium intakes. Journal of Clinical Endocrinology and Metabolism 93(10): 3907-14.
Wei, M. Y., C. F. Garland, E. D. Gorham, S. B. Mohr and E. Giovannucci. 2008. Vitamin D and prevention of colorectal adenoma: a meta-analysis. Cancer Epidemiology, Biomarkers & Prevention 17(11): 2958-69.
Weingarten, M. A., A. Zalmanovici and J. Yaphe. 2008. Dietary calcium supplementation for preventing colorectal cancer and adenomatous polyps. Cochrane Database System Review (1): CD003548.
Weinstein, R. S. and N. H. Bell. 1988. Diminished rates of bone formation in normal black adults. New England Journal of Medicine 319(26): 1698-701.
Wejse, C., V. F. Gomes, P. Rabna, P. Gustafson, P. Aaby, I. M. Lisse, P. L. Andersen, H. Glerup and M. Sodemann. 2009. Vitamin D as supplementary treatment for tuberculosis: a double-blind, randomized, placebo-controlled trial.[see comment]. American Journal of Respiratory and Critical Care Medicine 179(9): 843-50.
Welsh, J. 2004. Vitamin D and breast cancer: insights from animal models. American Journal of Clinical Nutrition 80(Suppl 6): 1721S-4S.
Welsh, J. 2007. Vitamin D and prevention of breast cancer. Acta Pharmacologica Sinica 28(9): 1373-82.
Wicherts, I. S., N. M. van Schoor, A. J. Boeke, M. Visser, D. J. Deeg, J. Smit, D. L. Knol and P. Lips. 2007. Vitamin D status predicts physical performance and its decline in older persons. Journal of Clinical Endocrinology and Metabolism 92(6): 2058-65.
Widdowson, E. M., R. A. McCance and C. M. Spray. 1951. The chemical composition of the human body. Clinical Science 10: 113-25.
Wilkins, C. H., S. J. Birge, Y. I. Sheline and J. C. Morris. 2009. Vitamin D deficiency is associated with worse cognitive performance and lower bone density in older African Americans. Journal of the National Medical Association 101(4): 349-54.
Wilton, T., D. Hosking, E. Pawley, A. Stevens and L. Harvey. 1987. Osteomalacia and femoral neck fractures in the elderly patient. Journal of Bone and Joint Surgery. British Volume 69-B(3): 388-90.
Wjst, M. 2005. Variants in the vitamin D receptor gene and asthma. BMC Genetics 6: 2.
Wjst, M. and E. Hypponen. 2007. Vitamin D serum levels and allergic rhinitis. Allergy 62(9): 1085-6.
Wolfberg, A. J., A. Lee-Parritz, A. J. Peller and E. S. Lieberman. 2004. Association of rheumatologic disease with preeclampsia. Obstetrics and Gynecology 103(6): 1190-3.
Woo, J., E. Lau, R. Swaminathan, C. P. Pang and D. MacDonald. 1990. Biochemical predictors for osteoporotic fractures in elderly Chinese—a longitudinal study. Gerontology 36(1): 55-8.
Wu, L., B. R. Martin, M. M. Braun, M. E. Wastney, G. P. McCabe, L. D. McCabe, L. A. DiMeglio, M. Peacock and C. M. Weaver. 2010. Calcium requirements and metabolism in Chinese-American boys and girls. Journal of Bone and Mineral Research 25(8): 1842-9.
Xue, Y. and J. C. Fleet. 2009. Intestinal vitamin D receptor is required for normal calcium and bone metabolism in mice. Gastroenterology 136(4): 1317-27, e1-2.
Yan, J., J. Feng, N. Craddock, I. R. Jones, E. H. Cook, Jr., D. Goldman, L. L. Heston, J. Chen, P. Burkhart, W. Li, A. Shibayama and S. S. Sommer. 2005. Vitamin D receptor variants in 192 patients with schizophrenia and other psychiatric diseases. Neuroscience Letters 380(1-2): 37-41.
Yan, L., B. Zhou, X. Wang, S. D’Ath, A. Laidlaw, M. A. Laskey and A. Prentice. 2003. Older people in China and the United Kingdom differ in the relationships among parathyroid hormone, vitamin D, and bone mineral status. Bone 33(4): 620-7.
Yang, K., M. Lipkin, H. Newmark, B. Rigas, C. Daroqui, S. Maier and L. Augenlicht. 2007. Molecular targets of calcium and vitamin D in mouse genetic models of intestinal cancer. Nutrition Reviews 65(8 Pt 2): S134-7.
Yang, K., N. Kurihara, K. Fan, H. Newmark, B. Rigas, L. Bancroft, G. Corner, E. Livote, M. Lesser, W. Edelmann, A. Velcich, M. Lipkin and L. Augenlicht. 2008. Dietary induction of colonic tumors in a mouse model of sporadic colon cancer. Cancer Research 68(19): 7803-10.
Yang, Z., K. Wang, T. Li, W. Sun, Y. Li, Y. F. Chang, J. S. Dorman and R. E. LaPorte. 1998. Childhood diabetes in China. Enormous variation by place and ethnic group. Diabetes Care 21(4): 525-9.
Yesudian, P. D., J. L. Berry, S. Wiles, S. Hoyle, D. B. Young, A. K. Haylett, L. E. Rhodes and P. Davies. 2008. The effect of ultraviolet B-induced vitamin D levels on host resistance to Mycobacterium tuberculosis: a pilot study in immigrant Asian adults living in the United Kingdom. Photodermatology, Photoimmunology and Photomedicine 24(2): 97-8.
Yetley, E. A., D. Brule, M. C. Cheney, C. D. Davis, K. A. Esslinger, P. W. Fischer, K. E. Friedl, L. S. Greene-Finestone, P. M. Guenther, D. M. Klurfeld, M. R. L’Abbe, K. Y. McMurry, P. E. Starke-Reed and P. R. Trumbo. 2009. Dietary reference intakes for vitamin D: justification for a review of the 1997 values. American Journal of Clinical Nutrition 89(3): 719-27.
Yokomura, K., T. Suda, S. Sasaki, N. Inui, K. Chida and H. Nakamura. 2003. Increased expression of the 25-hydroxyvitamin D(3)-1alpha-hydroxylase gene in alveolar macrophages of patients with lung cancer. Journal of Clinical Endocrinology and Metabolism 88(12): 5704-9.
Yoshikawa, S., T. Nakamura, H. Tanabe and T. Imamura. 1979. Osteomalacic myopathy. Endocrinologia Japonica 26(Suppl): 65-72.
Young, G. A., Jr., N. R. Underdahl and L. E. Carpenter. 1949. Vitamin D intake and susceptibility of mice to experimental swine influenza virus infection. Proceedings of the Society for Experimental Biology and Medicine 72(3): 695-7.
Yu, C. K. H., L. Sykes, M. Sethi, T. G. Teoh and S. Robinson. 2009. Vitamin D deficiency and supplementation during pregnancy. Clinical Endocrinology 70(5): 685-90.
Zeghoud, F., C. Vervel, H. Guillozo, O. Walrant-Debray, H. Boutignon and M. Garabedian. 1997. Subclinical vitamin D deficiency in neonates: definition and response to vitamin D supplements. American Journal of Clinical Nutrition 65(3): 771-8.
Zhu, K., D. Bruce, N. Austin, A. Devine, P. R. Ebeling and R. L. Prince. 2008a. Randomized controlled trial of the effects of calcium with or without vitamin D on bone structure and bone-related chemistry in elderly women with vitamin D insufficiency. Journal of Bone and Mineral Research 23(8): 1343-8.
Zhu, K., A. Devine, I. M. Dick, S. G. Wilson and R. L. Prince. 2008b. Effects of calcium and vitamin D supplementation on hip bone mineral density and calcium-related analytes in elderly ambulatory Australian women: a five-year randomized controlled trial. Journal of Clinical Endocrinology and Metabolism 93(3): 743-9.
Zipitis, C. S. and A. K. Akobeng. 2008. Vitamin D supplementation in early childhood and risk of type 1 diabetes: a systematic review and meta-analysis. Archives of Disease in Childhood 93(6): 512-7.
Zittermann, A., S. S. Schleithoff, G. Tenderich, H. K. Berthold, R. Korfer and P. Stehle. 2003. Low vitamin D status: a contributing factor in the pathogenesis of congestive heart failure? Journal of the American College of Cardiology 41(1): 105-12.
Zittermann, A., S. S. Schleithoff and R. Koerfer. 2005. Putting cardiovascular disease and vitamin D insufficiency into perspective. British Journal of Nutrition 94(4): 483-92.
Zittermann, A., S. Frisch, H. K. Berthold, C. Gotting, J. Kuhn, K. Kleesiek, P. Stehle, H. Koertke and R. Koerfer. 2009. Vitamin D supplementation enhances the beneficial effects of weight loss on cardiovascular disease risk markers. American Journal of Clinical Nutrition 89(5): 1321-7.
Zmuda, J. M., J. A. Cauley, M. E. Danielson, R. L. Wolf and R. E. Ferrell. 1997. Vitamin D receptor gene polymorphisms, bone turnover, and rates of bone loss in older African-American women. Journal of Bone and Mineral Research 12(9): 1446-52.
Zmuda, J. M., J. A. Cauley, M. E. Danielson, T. M. Theobald and R. E. Ferrell. 1999. Vitamin D receptor translation initiation codon polymorphism and markers of osteoporotic risk in older African-American women. Osteoporosis International 9(3): 214-9.
Zmuda, J. M., J. A. Cauley, M. E. Danielson and R. E. Ferrell. 2003. Vitamin D receptor and aromatase gene interaction and bone mass in older African-American women. Metabolism 52(5): 521-3.


