
C
Methods and Results from the AHRQ-Ottawa Evidence-Based Report on Effectiveness and Safety of Vitamin D in Relation to Bone Health
The purpose of this systematic evidence-based review, referred to as AHRQ-Ottawa,1 requested by the Office of Dietary Supplements, National Institutes of Health and conducted by the University of Ottawa Evidence-based Practice Center (UO-EPC) was to review and synthesize the published literature on five key questions.
-
Are specific circulating concentrations of 25 hydroxyvitamin D (25[OH]D) associated with bone health outcomes in:
-
Children: rickets, bone mineral density (BMD), bone mineral content (BMC), fractures, or parathyroid hormone (PTH)?
-
Women of reproductive age (including pregnant and lactating women): BMD, calcaneal ultrasound, fractures, PTH?
-
Elderly men and postmenopausal women: BMD, fractures, falls?
-
-
Do food fortification, sun exposure, and/or vitamin D supplementation affect circulating concentrations of 25(OH)D?
-
What is the evidence regarding the effect of supplemental doses of vitamin D on bone mineral density and fracture or fall risk and does this vary with age groups, ethnicity, body mass index, or geography?
-
Is there a level of sunlight exposure that is sufficient to maintain adequate vitamin D levels but does not increase the risk of non-melanoma or melanoma skin cancer?
-
Does intake of vitamin D above current reference intakes lead to toxicities (e.g., hypercalcemia, hypercalciuria, and calcification of soft tissue or major organs)?
The review focused on electronic searches of the medical literature to identify publications addressing the aforementioned questions. Out of 9,150 citations, 112 RCTs, 19 prospective cohorts, 30 case–control studies, and 6 before-after studies were systematically reviewed, and each was rated on quality and used to assess the strength of evidence for each outcome.
The methods and results chapters of the AHRQ-Ottawa evidence review are reprinted below. The report in its entirety, including appendices and evidence tables, can be accessed and viewed at http://www.ahrq.gov/clinic/tp/vitadtp.htm#Report.
Chapter 2. Methods
Key Questions Addressed in This Report
The University of Ottawa EPC’s evidence report on Vitamin D is based on a systematic review of the scientific literature. A technical expert panel was recruited to help refine key questions and provide expertise to the review team during the review process. The finalized questions were:
-
Are specific circulating concentrations of 25(OH)D associated with the following health outcomes in:
-
Children: rickets, bone mineral density (BMD) or bone mineral content (BMC), fractures, parathyroid hormone (PTH)?
-
Women of reproductive age (includes pregnant and lactating women): BMD, calcaneal ultrasound, fractures, calcium absorption, PTH?
-
Elderly men and postmenopausal women: BMD, fractures, falls?
-
-
Does dietary intake (fortified foods and/or vitamin D supplementation) or sun exposure affect circulating concentrations of 25(OH)D?
-
Does this vary with different age groups, ethnicity, use of sunscreen, geography and/or body mass index (BMI)?
-
What are the effects of fortified foods on circulating 25(OH)D concentrations?
-
What is the effect of sun exposure and vitamin D supplementation on levels of serum 25(OH)D?
-
-
What is the evidence regarding the effect of supplemental doses of vitamin D on bone mineral density, fractures and fall risk in:
-
Women of reproductive age and postmenopausal women?
-
Elderly men?
-
Is there variation with baseline levels of 25(OH)D?
-
-
Is there a level of sunlight exposure (time of year, latitude, BMI, amount of skin exposed) that is sufficient to maintain adequate vitamin D levels, but does not increase the risk of melanoma or non-melanoma skin cancer?
-
Does intake of vitamin D above current reference intakes lead to toxicities (e.g., hypercalcemia, hypercalciuria, calcification of soft tissue or major organs, kidney stones)?
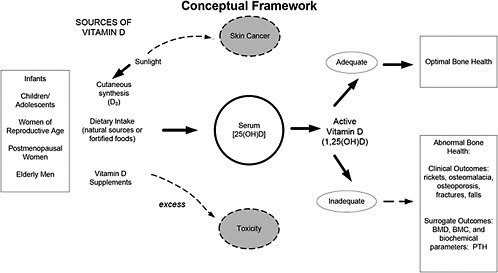
Figure 1. Conceptual Framework for Evaluation of the Effectiveness and Safety of Vitamin D in Relation to Bone Health. Serum 25(OH)D levels reflect cutaneous synthesis and dietary intake of vitamin D including fortified foods and supplements. For the purposes of this review, only outcomes related to bone health are considered although it is recognized that vitamin D has pleiotropic effects in the body. Outcomes assessed include fractures (related to osteoporosis or impaired mineralization), falls, and surrogate outcomes such as bone mineral density (e.g., areal or volumetric BMD), bone mineral content (BMC) and biochemical parameters such as parathyroid hormone (PTH). For women of reproductive age, calcaneal ultrasound and calcium absorption were also identified as outcomes. Note that serum 25(OH)D measurements vary depending on the particular assay used as well as the laboratory and/or operator, suggesting the need for standardization or method/laboratory-specific decision limits for vitamin D deficiency or insufficiency.
Study Identification
Search Strategy
An initial search for systematic reviews related to vitamin D was conducted, and the review team and Technical Expert Panel (TEP) identified reviews relevant to each of the five research questions. These aided in the development of the search strategy for primary studies. Conceptual analysis was undertaken by one information specialist, and translation of the concepts and the Boolean logic of their combinations were confirmed by a second information specialist. No language restrictions were applied. Using the Ovid interface, the following databases were searched: MEDLINE ® (1966 to June Week 3 2006); Embase (2002 to 2006 Week 25); CINAHL (1982 to June Week 4, 2006); AMED (1985 to June 2006); Biological Abstracts (1990 to February 2005); and The Cochrane Central Register of Controlled Trials (CENTRAL; 2nd Quarter 2006). The MEDLINE ® search strategy is in Appendix A*. Adjustments were made to the search when run in other databases to account for differences in indexing. All records were downloaded and imported into the Reference Manager software, and duplicate records were removed. This review underwent a formal update process following completion of a first draft report and prior to final submission with initial searches run in 2005. The dates of the initial search were as follows: MEDLINE ® (1966 to July Week 4 2005); Embase (2002 to 2005 Week 32); CINAHL (1982 to March Week 4, 2005); AMED (1985 to April 2005); Biological Abstracts (1990 to February 2005); and The Cochrane Central Register of Controlled Trials (CENTRAL; 1st Quarter 2005).
Eligibility Criteria
Published English-language studies, examining the safety and/or efficacy of vitamin D in humans, were eligible for inclusion, as follows:
-
The association between serum 25(OH)D concentrations and bone health outcomes was examined in the following populations: 1) children (0 to 18 years); 2) women of reproductive age (19 to 49 years) and; 3) elderly men (≥65 years) and postmenopausal women (50+ years). Bone health outcomes included: BMD, BMC, fractures, falls, performance measures related to falls (e.g., muscle strength or balance) (age group 3 only), calcium absorption (age group 2), calcaneal ultrasound (age group 2), PTH (age groups 1 and 2), rickets (age group 1). Study designs: RCTs, prospective cohorts, before-after and case-control studies.
-
The effect of vitamin D from dietary sources (including fortified foods and/or vitamin D2 or D3 supplementation) and sun exposure, on serum 25(OH)D concentrations was examined in the age groups listed above. Vitamin D2 and D3 were evaluated separately. Study designs: RCTs of dietary intake/supplementation/sun exposure interventions.
|
* |
Appendixes cited in this report are available at http://www.ahrq.gov/clinic/tp/vitadtp.htm. |
-
The effect of supplemental vitamin D2 or D3 alone or in combination with calcium on bone mineral density, fractures, and/or falls was examined in: 1) women of reproductive age (19 to 49 years); 2) postmenopausal women (≥ 50 years) and; 3) elderly men (≥ 65 years). Study designs: RCTs.
-
The relation between sun exposure, serum 25(OH)D concentrations and the risk of non-melanoma and/or melanoma skin cancer was evaluated. Study designs: existing systematic reviews.
-
The potential toxicity of supplemental vitamin D in doses above the adequate reference intakes (e.g., hypercalcemia, nephrolithiasis, soft tissue calcification) was examined in different age groups. Study designs: RCTs.
Systematic and narrative reviews were excluded for all questions except for question 4. However, recent reviews were hand searched for additional potential primary studies that may be pertinent to all questions. Randomized trials of other osteoporosis therapies that included calcium and vitamin D as a control arm were not included unless they also included a placebo or lower dose vitamin D arm that would allow a comparison. Studies evaluating the efficacy of vitamin D for the treatment of secondary causes of osteoporosis (e.g., glucocorticoid-induced osteoporosis, renal and liver disease) or for treatment of vitamin D-dependent rickets were also not considered, in an effort to minimize clinical heterogeneity and since non-dietary sources of treatment are often used as the primary tereatment for some of these conditions. We restricted our inclusion criteria to studies of vitamin D2 (ergocalciferol) or D3 (cholecalciferol). Studies that evaluated the efficacy of the vitamin D preparations calcitriol or alphacalcidol were not included since they are not considered nutritional supplements and have a different safety profile than native vitamin D.
Study Selection Process
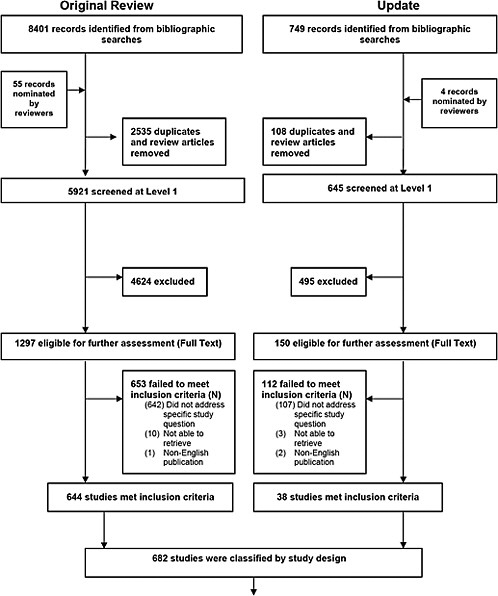
The results of the literature search were uploaded to the software program Trialstat SRS version 4.0 along with screening questions developed by the review team and any supplemental instructions (Appendix B*). Prior to the formal screening process, a calibration exercise was undertaken to pilot and refine the screening process. The results of the literature search were assessed using a three-step process. First, bibliographic records (i.e., title, authors, key words, abstract) were screened, using broad screening criteria, by one reviewer (Appendix B). All potentially relevant records, and those records that did not contain enough information to determine eligibility (e.g., no available abstract) were retained. The reasons for exclusion were noted using a modified QUOROM format (Figure 2).
Full text relevance screening was performed independently by two reviewers and discrepancies resolved by consensus or third party (Appendix B). Records were not masked given the equivocal evidence regarding the benefits of this practice.65 Reasons for exclusion were noted. Relevant studies were then evaluated to determine study design and categorized accordingly for inclusion by question. The level of evidence reviewed was limited to RCTs where feasible since systematic bias is minimized in RCTs compared with all other study designs
|
* |
Appendixes cited in this report are available at http://www.ahrq.gov/clinic/tp/vitadtp.htm. |
(e.g., cross-sectional, retrospective cohort). However, because of the paucity of RCT evidence addressing the association between circulating 25(OH)D concentrations and bone health outcomes, particularly in infants and young children, inclusion criteria were broadened to include single prospective cohorts, case-control, and before-after study designs for question one. Question four was restricted to existing systematic reviews to limit scope.
Data Abstraction
Following a calibration exercise, two reviewers independently abstracted relevant information from each included study using a data abstraction form developed a priori for this review (Appendix B*). One reviewer completed primary extraction, which was then verified by a second reviewer. Conflicts were discussed and resolved by consensus. Abstracted data included study characteristics, population characteristics, the type of 25(OH)D assay, source of vitamin (i.e., vitamin D2 or D3 supplements, including dosing regimen and route of administration; sun or UV exposure; dietary intake), use of supplemental calcium, and relevant outcomes such as fractures, BMD, falls and toxicity.
Data Assessment
Quality Assessment
As part of RCT quality assessment, the Jadad scale was used (Appendix B) and scored by an experienced reviewer (Appendixes D and E). This validated scale assesses the methods used to generate random assignments and double blinding, and also scores whether there is a description of dropouts and withdrawals by intervention group. 66 The scoring ranges from 1 to 5, with higher scores indicating higher quality. An a priori threshold scheme was used for sensitivity analysis: a Jadad total score of ≥ 3 was used to indicate studies of higher quality. In addition, allocation concealment was assessed as adequate (=1), inadequate (=2) or unclear (=3) (Appendix B).67
To assess the quality of the observational studies (prospective cohorts and casecontrols), we used a grading system adapted from Harris et al.68 Quality assessment of observational studies included variables such as representativeness of the study population, whether bias and confounding were controlled for in the study design and reported, and description of losses to followup.
An aggregate level of evidence (good, fair, inconsistent) was rated based on quantity, quality and consistency of results. As an example, for assessment of an association of circulating 25(OH)D concentrations with a bone health outcome, good evidence was defined as evidence for or against an association that was consistent across studies with at least one study graded as a higher quality study. Fair was defined by evidence sufficient to determine an association, but limited by consistency, quantity, or quality of studies (i.e., no studies graded as good).
|
* |
Appendixes cited in this report are available at http://www.ahrq.gov/clinic/tp/vitadtp.htm. |
Inconsistent evidence was defined by an inability to make a conclusion for or against an association in that studies had conflicting results.69
Qualitative Data Synthesis
Outcomes were summarized using a qualitative data synthesis for each study. A description of each study that included information pertaining to sample size and demographics, setting, funding source, 25(OH)D concentrations and assay used, intervention (form of vitamin D) and comparator characteristics, study quality, details of matching or methods of adjustment, and confounders (where applicable) were recorded and summarized in the text, and/or summary tables throughout the report. These methods were used to help generate hypotheses and to identify any heterogeneity of study populations or in the reporting of data within the published reports.
For the purpose of this review, we defined vitamin D deficiency as a serum 25(OH)D measurement below 30 nmol/L, recognizing that variable definitions have been used in the literature including values of 50 nmol/L to > 80 nmol/L (32 ng/dL), and that there is potentially large error or variability in measurement depending on the particular assay used. Similarly, vitamin D insufficiency may be defined using different values. A cutpoint of 30 nmol/L for vitamin D deficiency was used in this report to assist in classifying trials to report the results, and also when conducting subgroup analyses of trials that included vitamin D deficient populations. In reporting individual study results, the investigator-defined definitions of vitamin D deficiency or insufficiency were noted and reported. We did not attempt to calibrate different 25(OH)D assays. As outlined in the introduction, variability may exist even when laboratories are using the same technique.
Quantitative Synthesis
For outcomes where meta-analysis was deemed appropriate, we extracted quantitative data (e.g., number of subjects in each group, mean, standard deviation) from trials, using a standardized data extraction form that included intervention characteristics (coded for vitamin D source, type of vitamin D and unit of dosing) vitamin D intake and baseline and outcome variables for all followup intervals including unit of measurement and assay used for serum 25(OH)D measurement.
Where data were only available in graph form, we attempted to extract data for the report. If relevant data (e.g., standard deviation) were not reported adequately, we contacted authors to obtain the missing data. A list of additional data received by authors is in Appendix F*.
We calculated standard deviation from standard errors or 95 percent confidence intervals, and the absolute and percent change for continuous outcomes (e.g., serum 25(OH)D) from baseline and end of study data using standard formulae.
To avoid differences in the reporting of units for serum 25(OH)D concentrations (i.e., nmol/L, ng/mL, μg/dL, μg/L and ng/dL) all values were converted to nmol/L, the unit that was
|
* |
Appendixes cited in this report are available at http://www.ahrq.gov/clinic/tp/vitadtp.htm. |
used for data synthesis. The conversion formula is 1 ng/mL = 2.5 nmol/L. To limit the variable reporting in vitamin D dosing (e.g., nmol, IU, ug and mg), IU was chosen as the standard unit used for meta-analysis and all other units were converted using a standard formula. The conversion formula for micrograms is 1 ug = 40 IU.
Serum 25(OH)D outcomes included absolute change values (nmol/L). Fracture outcomes were classified as vertebral, non-vertebral, hip or total fractures. BMD outcomes included absolute values (e.g., areal BMD, g/cm2), mean percent change from baseline or the difference in the mean percent change from baseline for the treatment versus comparator groups.
Followup intervals were recorded for each trial. It is common for variation to exist between trials with regard to length of followup intervals. For the purpose of meta-analyses, the most distal followup and the change between the last followup and the baseline were applied.
Statistical Analyses
For the effect measures for continuous outcomes (e.g., serum 25(OH)D concentrations) the difference in means between different treatment groups was used for the meta-analyses. The ‘difference in means’ is a standard statistic that measures the absolute difference between the mean values in the two groups in a clinical trial. Absolute change in 25(OH)D concentrations was used for quantitative pooling of 25(OH)D. For the pooling of BMD results, the percent change in BMD from baseline in the treatment versus control or placebo was used as the unit of analysis since this is clinically relevant.
For continuous outcomes, the difference in means and standard deviations were calculated for each individual study. To avoid multiple comparison issues in studies with more than one treatment arm, a weighted average (e.g., 25(OH)D) of similar groups was calculated within the study. A weighted average method was used to calculate the 25(OH)D values for the combined treatment group and combined placebo group. The difference in means was then calculated using the weighted averages for the two combined groups. This estimate, with its standard deviation was then used for the meta-analyses. The number in each group was based on intention-to-treat data; however, when these data were not available, we used what was provided in the published report.
For dichotomous outcomes (e.g., fractures, falls), studies were grouped by method of administration and type of vitamin D as we anticipated different treatment effects with (1) oral versus injectable vitamin D, (2) type of vitamin D (D2 versus D3) and (3) if calcium was given as a co-intervention. We used these groupings to generate pooled estimates to minimize clinical heterogeneity. The intent-to-treat group or number enrolled at the time of study was used for analyses and when unavailable, we used the number provided in the report. Combined odds ratios were generated using the number of individuals who had an event (e.g., fall or fracture) and not the absolute number of events. This was determined to be a more conservative approach to quantify the effects. For the meta-analysis of fracture and fall outcomes, we pooled studies with different treatment durations and doses.
In all cases, meta-analyses were conducted using a weighted mean method. The fixed effect model was used initially to obtain combined estimates of weighted mean differences and their standard errors. When heterogeneity (p<0.10) was present between studies, the Dersimonian and Laird random-effects method was used to obtain combined estimates across the studies.70 The degree of statistical heterogeneity was evaluated for all analyses using the I2 statistic.71-73 An I2
of less than 25 percent is consistent with low heterogeneity, 25 to 50 percent moderate heterogeneity, and over 50 percent high heterogeneity.73 When significant heterogeneity was identified, then heterogeneity was explored through subgroup, sensitivity analyses and meta-regression analyses if appropriate. Sources of heterogeneity include methodologic as well as clinical heterogeneity. The interpretation of heterogeneity estimates requires caution especially when small numbers of trials were included.
Publication bias was explored through funnel plots by plotting the relative measures of effect (odds ratio) versus a measure of precision of the estimate such as a standard error or precision (1/standard error).72 Funnel plots are scatter plots in which the treatment effects estimated from individual studies, are plotted on the horizontal axis against a measure of study precision on the vertical axis. Asymmetry suggests the possibility of publication bias, although other potential causes of asymmetry exist. The degree of funnel plot asymmetry was measured by the intercept from regression of standard normal deviates against precision, with evidence of asymmetry based on p < 0.1.74-76
Throughout the report, vitamin D or 25(OH)D without a subscript represents either D2 or D3 or both isoforms. Wherever possible i.e., when reported in the particular study, the isoform is specified. All interventions are oral, unless it is specifically stated that injected vitamin D was used.
Chapter 3. Results
Results of the Literature Search
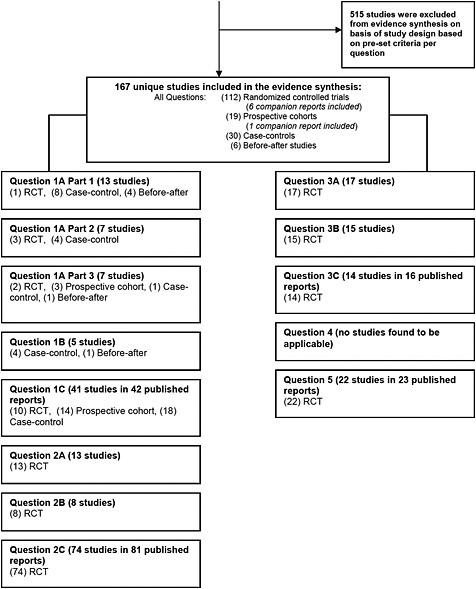
The results of the literature search for the original review and for the update are presented in Figure 2. For the updated review that incorporated the original search data, literature searching identified a total of 9150 potentially relevant bibliographic records. The reviewers nominated an additional 59 potentially relevant studies that were subjected to the same screening process as the other records; the majority of these (55) was nominated after the original search and were likely not detected by the original search due to their publication date. After 2,643 duplicate and review articles (systematic and narrative) were removed, 6,566 unique records remained eligible for broad relevance assessment. These reports were evaluated against the eligibility criteria and after the initial screening for relevance, 5,119 records were excluded. The remaining 1,447 reports were then retrieved and subjected to a more detailed relevance assessment using the full text; 765 of the 1,447 reports failed to meet the inclusion criteria as determined by consensus. (Appendix I*) Given the magnitude of the potentially relevant evidence, an additional eligibility criterion of level of evidence was then applied to the 682 remaining studies. The evidence base was limited to RCTs where possible. In total, 515 bibliographic records were excluded from the evidence synthesis as they were deemed to provide an inadequate level of evidence for their respective question.(Appendix J) Question one (the association of 25(OH) D and bone health outcomes) required that study designs other than RCTs be included (e.g., prospective cohort, case-control, and before-after studies). The reasons for exclusion for all other records are listed in the QUOROM flow chart in Figure 2. In total, 167 studies were deemed relevant and provided sufficient level of evidence for the systematic review. Our search strategy did not reveal pertinent reviews for question four. Since our search strategy may not have identified studies in the dermatology or photobiology literature that evaluated the effect of solar UV-B exposure in terms of a minimal erythemal dose and the risk of skin cancer, this was discussed with the Technical Expert Panel. It was decided that a separate search was not feasible for this report.
In total 167 studies (112 RCTs (106 unique trials, 6 companion reports), 19 prospective cohorts (18 unique studies, 1 companion report), 30 case-controls and 6 before-after studies) were included for evidence synthesis.
Study characteristics, interventions and results are presented in tables throughout the report. Where applicable, the order of discussion is the following order of study design: RCTs; clinical controlled trials; prospective cohorts; case-control studies; and before-after studies.
|
* |
Appendixes cited in this report are available at http://www.ahrq.gov/clinic/tp/vitadtp.htm. |
Question 1. Are There Specific Concentrations of Serum 25(OH)D That Are Associated With Bone Health Outcomes in Infants, Children, Women of Reproductive Age, Postmenopausal Women and Elderly Men?
1A. Infants and Children
Question 1A (Part 1). Are There Specific Concentrations of Serum 25(OH)D That Are Associated With Established Vitamin D Deficiency Rickets in Infants and Young Children?
Overview of Relevant Studies
For the purposes of this review, infancy is defined as term birth to 12 months, and young children from one to five years of age. Studies that enrolled older children were included if the majority of children were in the above age groups. For studies on established rickets in infants and young children, 13 studies met our inclusion criteria and assessed the association between serum 25(OH)D and rickets.77-89 Of the 13 studies, there was one RCT,77 four before-after studies78-81 and eight case-control studies.82-89 For the RCT, bone health outcomes included improvement in the signs and symptoms of rickets, and serum PTH levels.77 The twelve observational studies included rickets as the bone health outcome,78-84,84-89 and seven of the 12 studies included assessment of serum PTH,78,79,82,84,87,88 as summarized in Table 1. In all studies, children were diagnosed with rickets using clinical and radiological criteria. No studies included BMD, BMC, or fractures as outcomes.
Study characteristics including country and type of vitamin D assay are summarized in the Table 1. All studies except for one case-control study with nine participants82 were conducted outside of North America. The North American study was conducted at a northern latitude (Canada, U.S. Midwest). Each study examined serum 25(OH)D concentrations at diagnosis and some included followup measurements during treatment.78-81,86,87 Six studies used an RIA assay for serum 25(OH)D assays,77,83-86,89 six studies used a CPBA method,78-82,87 and one study used an HPLC technique.88 We report, in this section, baseline measurements at diagnosis or pre-treatment.
Population characteristics. Children with rickets ranged in age from as young as two months up to 14 years, with most children between 24 and 36 months. In the studies that reported ethnicity, virtually all children were non-white except for two subjects in the one North American study.82 The sample sizes ranged from nine82 to 123 participants,84 with an average of 41. In 12 of the 13 studies, gender was mixed.
Outcome characteristics. For all studies, the diagnosis of rickets was ascertained by radiographic and clinical evidence.77-87,89 Serum PTH was measured in seven studies using either RIA or chemiluminescent immunoassays.78,79,82,84,87-89 No study evaluated BMC, BMD or fractures.
Study quality. The study quality of the RCT,77 four before-after and eight case-control studies ranged from poor to fair with the RCT scoring 1/5 on the Jadad scale (in relation to randomization for treatment).
Qualitative synthesis of individual study results. Six studies reported a mean77,78,80,85 or median79,88 serum 25(OH)D concentration < 27.5 nmol/L associated with rickets. These studies included measurements by RIA,77,85 CPBA78-80 or HPLC.88 Five studies reported that children with rickets had a mean 25(OH)D concentration above 27.5 nmol/L (range of means 36 – 50 nmol/L),82,84,86,87,89 and the other two studies reported at least some children with serum levels above this value.81,83 While 25(OH)D assays differed across the studies, these results suggest that the serum 25(OH)D concentration associated with rickets may be much higher than previously thought. In one study, deficient dietary calcium was the etiology for rickets83 whereas in another study, a mean dietary calcium intake of < 300 mg/d did not alter the Odds Ratio (OR) for rickets.84 Given the uncertainty of the dietary calcium measurement, it remains unclear whether the specific concentration of serum 25(OH)D consistent with rickets is confounded by dietary calcium.
In the studies that reported serum PTH, values in children with rickets were elevated above the normal range.78,79,82,84,87,89 One study confirmed a negative relation of PTH with 25(OH)D concentrations (r = −0.70),82 when cases and controls were analyzed together.
The majority of studies included in this review were from developing countries where dietary calcium intake is low. Low dietary calcium can confound 25(OH)D status and is a major limitation of the studies since some cases of rickets may be attributable to a calcium deficiency. Another limitation is the paucity of studies in children with rickets in North America. The specific concentrations of serum 25(OH)D associated with rickets in North America is uncertain, given the lack of studies in populations with dietary calcium intake similar to North American diets, as well as the different methods used to determine 25(OH)D concentrations. A better understanding of the inter-relationship between 25(OH)D concentrations, calcium and rickets would improve the specific values of 25(OH)D to be used as a biomarker in the diagnosis and treatment of rickets. Only studies of established rickets were included, and other RCTs have evaluated specific 25(OH)D concentrations in relation to the development of rickets. In a rickets prevention study in China, Specker et al. found that 25(OH)D concentrations above 30 nmol/L appeared to prevent rickets in infants with or without vitamin D deficiency at birth.90
|
Summary. Circulating 25(OH)D levels associated with established rickets in infants and young children Quantity: Six studies (one RCT, three before-after and two case-control studies) reported mean or median 25(OH)D concentrations < 30 nmol/L in children with rickets whereas the other studies reported mean or median values above 30 nmol/L and up to 50 nmol/L. In seven of eight case-control studies, serum 25(OH)D values were lower in the children with rickets compared with controls. Quality: The study quality of the RCT, four before-after and eight case-control studies ranged from poor to fair (with the RCT scoring 1/5 on the Jadad scale). Consistency: There is fair evidence for an association between low serum 25(OH)D and established rickets, regardless of assay type (RIA, CPBA, HPLC). There is inconsistent evidence to determine if there is a threshold concentration of serum 25(OH)D above which rickets does not occur. |
Table 1. Serum 25(OH)D Levels in Established Rickets in Infants and Young Children
|
Author (year) Country Funding |
Population, N Gender Mean age (SD) Ethnicity |
Intervention Duration |
25(OH)D isoform Measured Assay |
Bone Health Outcomes |
Results at baseline or diagnosis Serum 25(OH)D (nmol/L) Serum PTH (pmol/L) Serum Ca (mmol/L) |
|
RCTs |
|||||
|
Cesur (2003)776} |
56 Infants with nutritional rickets |
IG1: vit D 150,000 IU IG2: vit D 300,000 IU IG3: vit D 600,000 IU (single dose ) |
25(OH)D3 |
Rickets PTH |
25(OH)D3 mean (SD) : Stage* 1: 15.8 (6.4) Stage II: 15.4 (4.8) Stage III: 14.7 (3.9) |
|
|
|
RIA |
|
||
|
Turkey |
36% female |
|
|
||
|
NR |
10.7 (6.1) mo (range 3- 36) |
2 mo |
|
|
PTH mean (SD): Stage I: 30 (84) Stage II: 34.1 (20) Stage III: 44.3 (25.8) |
|
|
NR |
|
|
|
|
|
|
|
|
|
|
Ca mean (SD) all patients 1.9 (0.33) |
|
Before-After Studies |
|||||
|
Bhimma (1993)80 |
23 Children with rickets: 9 vit D def rickets [25(OH)D < 25 nmol/L] 14 Ca def rickets 10 Phosphopenic rickets 4 Healing/healed rickets |
5,000-10,000 IU/d vit D3 (plus 500-1,000 mg Ca) |
25(OH)D^ |
Rickets |
25(OH)D mean (SD): vit D deficient rickets: 9.3 (8.8) Ca deficient rickets: 45.5 (10) |
|
|
|
CPBA |
|
||
|
|
12 mo |
|
|
||
|
South Africa |
|
|
|
PTH: ND |
|
|
NR |
|
|
|
Ca mean (SD) Vit D def rickets: 2.09 (0.27) Ca def rickets: 2.16 (0.28) |
|
|
Vit D def rickets: 56% female |
|
|
|||
|
|
NR (range 1-12 y) vit D def rickets (N = 9): 6.1 (4.2) y |
||||
|
|
NR |
|
|
|
|
|
Author (year) Country Funding |
Population, N Gender Mean age (SD) Ethnicity |
Intervention Duration |
25(OH)D isoform measured Assay |
Bone Health Outcomes |
Results at baseline or diagnosis Serum 25(OH)D (nmol/L) Serum PTH (pmol/L) Serum Ca (mmol/L) |
|
Elzouki (1989)81 |
22 Children < 2 y admitted for treatment of rickets |
1-3 h/d of sunshine followed by single IM injection of 600,000 IU vit D2 |
25(OH)D^ |
Rickets |
25(OH)D: At diagnosis, 50% of patients had 25(OH)D > 20 nmol/L. Range 4-65 (graph) |
|
|
|
CPBA |
|
||
|
Libya |
37.5% female |
|
|
||
|
Public/Private |
15 mo (range 3-24 mo) reported only for 16 Libyan children |
|
|
PTH: ND |
|
|
|
|
|
|
Ca: ND |
|
|
|
African black |
followup median 17 d |
|
|
|
|
Garabedian (1983)78 |
20 Infants and children with rickets 60 Controls |
IG1: 2,000 IU/d vit D2 IG2: 400 IU/kg vit D3 (single dose) |
25(OH)D^ |
Rickets PTH (RIA) |
25(OH)D mean (SD): all patients: 11.5 (8) |
|
|
|
CPBA |
|
PTH: 2-4 × ULN (N=8); values NR |
|
|
France/Belgium |
65% female |
|
|
|
|
|
|
Mean age NR Infants and young children (N = 15): range 4-26 mo; Older children (N = 5): range 4-12 y |
|
|
|
Ca mean (SD) All patients: 1.8 (0.27) |
|
NR |
6 mo |
|
|
|
|
|
|
80% Immigrants from North Africa, Black Africa, Turkey, Portugal, Pakistan |
|
|
|
|
|
Markestad (1984)79 |
17 Children with rickets |
1,700-4,000 IU vitamin D2/d (reduced to 500-1000 IU in 3 children at 2-4 wks) |
25(OH)D^ |
Rickets |
25(OH)D median (range): N =9 diagnosed in summer: 21 (4.1-30.6) N = 8 diagnosed in winter: 12.1 (3.8-19.4) |
|
|
NR |
CPBA |
|
||
|
Norway |
|
|
|
||
|
|
NR |
|
|
||
|
Public |
|
|
|
||
|
|
11 (64.7%) Immigrants from Pakistan, Cape Verde Islands, Turkey, Morocco, Sri Lanka, and West Africa; 6 (35.3%) Norwegians |
|
|
At baseline, evidence of stimulated PTH in 11/12 (serum PTH or urinary cAMP, values NR) |
|
|
|
10 wks |
|
|
||
|
|
|
|
|
Ca: ND |
|
Author (year) Country Funding |
Population, N Gender Mean age Ethnicity |
Matching Variables |
Duration |
25(OH)D Isoform Measured Assay |
Bone Health Outcomes |
Results at baseline or diagnosis Serum 25(OH)D (nmol/L) Serum PTH (pmol/L) Serum Ca (mmol/L) |
|
Case-control studies |
||||||
|
Arnaud (1976)82 |
9 Children with mild (n=3), moderate (n=5) and severe (n=1) rickets 9 Controls |
Age |
Vit D 5,000 IU/d |
25(OH)D^ |
Rickets PTH |
25(OH)D mean (SD) (range): Mild rickets: 45 (7.5) (range 40-52.5) Moderate: 30 (5) Severe: 20 (NR) Controls: 90 (30) |
|
|
|
CPBA |
||||
|
Canada/Midwest U.S. |
|
4 wks |
|
|||
|
Rickets: 22% female Controls: NR |
|
|
|
|||
|
Public |
|
|
|
|
Negative association between 25(OH)D and PTH (r=−0.70). |
|
|
|
Moderate rickets (N = 5) Mean age 1.69 (1.03) y Controls: 2.71 (1.7) y All rickets: age range 2 mo – 3.5 y |
|
|
|
||
|
|
|
|
|
Ca mean (SD): ND for mild, moderate, severe subgroups Stage II rickets: 2.4 (0.15) Age matched controls: 2.53 (0.1) |
||
|
|
7 Canadian (5 First Nations, 1 West Indian black, 1 Portuguese) and 2 American (mid NW U.S.) |
|
|
|
||
|
Balasubraman (2003)86 |
40 Children (N = 24) and adolescents (N = 19) with rickets/osteolmalacia 53 controls (34 children and 19 adolescents) |
NR |
Cases: 6,000 IU/d vit D or single dose of 600,000 IU |
25(OH)D^ |
Rickets |
25(OH)D mean (SD): Children rickets: 50 (38.9) controls: 61.3 (35.9), NS |
|
India |
|
RIA |
||||
|
NR |
|
3 mo |
|
Adolescents: rickets: 12.6 (7.1) all but one < LLN controls: 46.0 (45.4), p<0.001 |
||
|
|
Rickets: 54.1% female Controls: 47.0% female |
|
|
|
||
|
|
|
|
|
|
PTH: NR |
|
|
|
Children: Rickets: median age 33 mo (range 11 – 120) ; Control: median 27 mo (range 6 mo – 84 mo) |
|
|
|
|
|
|
|
|
|
|
Ca mean (SD) Children Rickets: 2.2 (0.3) Controls: 2.4 (0.3) NS |
||
|
|
Adolescents: Rickets: median 198 mo (range 168-240) Controls: median 156 (range 120-228) |
|
|
|
||
|
|
|
|
|
Adolescents Rickets: 2.1 (0.2) Controls: 2.3 (0.2), p=0.008 |
||
|
|
Hindu/Muslim |
|
|
|
|
|
|
Author (year) Country Funding |
Population, N Gender Mean age Ethnicity |
Matching variables |
Duration |
25(OH)D isoform measured Assay |
Bone Health Outcomes |
Results at baseline or diagnosis Serum 25(OH)D (nmol/L) Serum PTH (pmol/L) Serum Ca (mmol/L) |
|
Dawodu (2005)88 |
38 Children with rickets 50 Historical controls |
Community |
NA |
25(OH)D^ |
iPTH (rickets group only) |
25(OH)D median (IQR): Rickets: 8.0 (3.8, 15.3) Controls: 43.8 (25, 64.3), p = 0.001 |
|
United Arab Emirates Public |
|
|
NA |
HPLC |
|
|
|
Rickets: 50% female, Controls: 40% female |
|
|
|
|
||
|
|
|
|
|
|
PTH showed a trend toward negative correlation with 25(OH)D (data NR) |
|
|
|
Rickets: 13.5 mo Controls 13.0 mo |
|
|
|
|
|
|
Ca median (IQR) Rickets: 2.22 (1.88, 2.35) Controls: 2.4 (2.25, 2.5), p= 0.001 |
||||||
|
|
Arab |
|
|
|
|
|
|
Graff (2004)87 |
15 Children with rickets 15 Controls (unrelated) |
Age, sex |
Cases: 1,000 mg/d Ca (no vit D supplement) Treatment duration: 6 mo; Followup: 12 mo |
25(OH)D^ |
Rickets PTH (chemiluminescent immunometric assay) |
25(OH)D mean (SD): significantly lower in children with rickets Rickets: 37.5 (13.5) Controls: 72.5 (11.5), p<0.001 |
|
Nigeria |
|
|
CPBA (Nichols) |
|||
|
|
60% female |
|
||||
|
NR |
|
|
|
|
|
|
|
|
Rickets: 46 (22) mo Controls: 47 (22) mo |
|
|
|
|
|
|
|
|
|
|
PTH mean (SD) significantly higher in rickets group; rickets: 32 (33) controls: 4.0 (3.1), p=0.003 |
||
|
|
Rickets: 7 Muslim and 8 Christian Controls: 4 Muslim and 11 Christian |
|
|
|
|
|
|
|
|
|
|
|
|
Ca mean (SD) Rickets: 2.13 (0.2) Controls: 2.4 (0.1), p <0.001 |
|
Molla (2000)85 |
103 Children with rickets 102 Controls |
Age, sex Socio- ethnic characteristics |
NA |
25(OH)D^ |
Rickets |
25(OH)D mean (SD): significantly lower in children with rickets: Rickets: 26.5 (15.5) Controls: 83.5 (74.75), p<0.0001 |
|
Kuwait |
|
NA |
RIA |
|
||
|
|
NR |
|
|
|
||
|
NR |
|
|
|
|
|
|
|
|
Rickets: 14.5 (5.2) mo (range 9 mo - 8y) Controls: 15.2 (6.3) mo |
|
|
|
|
PTH: ND |
|
|
|
|
|
|
Ca, mean (SD) Rickets: 2.24 (0.28) Controls: 2.45 (0.15) p <0.0001 |
|
|
|
96.1% from mothers with Hijab use |
|
|
|
|
|
Author (year) Country Funding |
Population, N Gender Mean age Ethnicity |
Matching variables |
Duration |
25(OH)D isoform measured Assay |
Bone Health Outcomes |
Results at baseline or diagnosis Serum 25(OH)D (nmol/L) Serum PTH (pmol/L) Serum Ca (mmol/L) |
|
Oginni (1996) |
26 Children with active rickets, 90 healthy controls |
Age, community |
NA |
25(OH)D^ |
Rickets PTH (radioimmunometric assay) |
25(OH)D mean (SD) (range): significantly lower in rickets group Rickets: 36 (28), range 7-147 Controls: 69 (22), range 32-140, p<0.0002 |
|
Nigeria |
|
|
NA |
RIA |
||
|
|
Rickets: 50% female, Controls: 61% female |
|
|
|
||
|
Public |
|
|
|
|||
|
|
Mean age NR Children with rickets age range: 1-5 y |
|
|
|
|
PTH mean (SD): higher in rickets group; Rickets: 5.9 (6.9), range 0-33.6 Controls: 1.0 (1.2), range 0-4.1, p<0.001 |
|
|
Nigerian |
|
|
|
|
|
|
|
|
|
|
|
|
Ca (albumin corrected) mean (SD) Rickets: 2.06 (0.23) Controls: 2.35 (0.14), p<0.001 |
|
Thacher (2000)84 |
123 Active rickets 123 Controls |
Age, sex if < 5 y, weight |
NA |
25(OH)D^ |
Rickets |
25(OH)D median (25th and 75th percentile): Rickets: 32 (22, 40); < 30 nmol/L: 37% Controls: 50 (42, 62), p<0.0001 |
|
|
|
NA |
|
PTH (RIA) |
||
|
Nigeria |
49.6% female |
|
|
RIA |
|
|
|
Public |
Mean age NR Rickets: median (25th and 75th percentile) age: 46 (34,63) mo Controls: 42 (25-70) mo |
|
|
|
|
|
|
|
|
|
|
|
PTH median (25th and 75th percentile): Rickets: 20 (13, 31) Controls: 12 (11,16), p =0.0066 |
|
|
|
Christian/Islam: Rickets: 82/41 Controls: 57/66 |
|
|
|
|
Ca mean (SD) Rickets: 1.93 (0.22) Controls: 2.24 (0.15), p<0.0001 |
|
Author (year) Country Funding |
Population, N Gender mean Age (SD) Ethnicity |
Matching variables |
Intervention Duration |
25(OH)D isoform measured Assay |
Bone Health Outcomes |
Results at baseline or diagnosis Serum 25(OH)D (nmol/L) Serum PTH (pmol/L) Serum Ca (mmol/L) |
|
Thacher (1997)83 |
37 Healthy controls with normal weight 37 Children with active rickets (median duration of 14 mo) |
Age, sex |
NA |
25(OH)D^ |
Rickets |
25(OH)D Rickets: levels > LLN in 16/28 (57%); 2/28 (7%) had values < 12.5 nmol/L Controls: ND |
|
|
|
NA |
|
|
||
|
Nigeria |
|
|
RIA |
|
||
|
NR |
47% female |
|
|
|
|
PTH: ND |
|
|
Rickets: 3.16 (1.53) y Controls 3.14 (1.51) y |
|
|
|
|
Ca mean (SD) Rickets: 2.09 (0.30) Controls: 2.08 (0.31), NS 55% of rickets and 51% of controls were hypocalcemic (< 2.1) |
|
|
All Nigerian |
|
|
|
|
|
|
^ Vitamin D refers to both or one unspecified isoform; if the isoform was disclosed, it is specified as vitamin D2 or D3; * stage I rickets: early phase (serum calcium is low but serum phosphorus is normal); stage II: serum calcium normal due to compensatory hyperparathyroidism; stage III: both serum calcium and phosphorus are low ; Ca, calcium; CPBA, competitive protein binding assay; HPLC, high performance liquid chromatography; IQR, interquartile range; IU, international units; LLN, lower limit of normal reference range; mo, month(s); NA, not applicable: ND, not done; NR, not reported; PTH, parathyroid hormone; RIA, radioimmunoassay; ULN , upper limit of normal reference range; vit, vitamin; y, year |
||||||
Question 1A (Part 2). Are Specific Circulating Concentrations of 25 Hydroxyvitamin D [25(OH)D] Associated With Bone Health Outcomes in Infants?
Overview of Relevant Study Characteristics and Results
Infancy is defined by the Institute of Medicine as including two subcategories: birth to 6 months and 6 to 12 months.4 Seven studies included infants 12 months or younger and assessed the association between serum 25(OH)D and bone health outcomes.91-97 Of the studies, there were three RCTs, two in breast-fed infants92,93 and one in formula-fed infants,91 and four case-control studies.94-97
For the three RCTs, bone health outcomes included BMC92,93 and serum PTH levels91-93 (Table 2). No RCTs reported results of BMD or evaluated fracture incidence. Four observational studies reported BMC,95-97 BMD,96,97 fractures94 or PTH (Table 2).94-96
Study characteristics. Of the three RCTs, two were conducted in the U.S.92,93 Both of these trials randomized human milk-fed infants to receive vitamin D2 supplementation (400 IU/d) or placebo. One U.S. RCT was six months in duration,92 and the other was 26 weeks long at which time the placebo group were started on supplementation, and both groups were followed until 52 weeks.93 The RCT by Zeghoud et al. was three months in duration, and randomized infants to receive either 500 or 1000 IU/d D2.91 The 25(OH)D assays varied, with two studies using a CPBA method91,93 and one using HPLC.92
None of the four case-control studies were conducted in North America (Table 2). Outcomes were assessed at birth in three studies94,95,97 and at two to five months of age in the other.96 One study measured circulating 25(OH)D by CPBA,94 two studies used HPLC,95,96 and the fourth study97 did not report the method.
Population characteristics. For the three RCTs, the age at enrolment was within a few days of birth.91-93 The sample sizes ranged from 18 to 80 infants, without a predominance of male or female gender. In all three studies,91-93 participants had to be healthy and free of conditions known to affect calcium metabolism. Mean vitamin D and calcium intake were not reported in any of the studies, although maternal behavior related to breast feeding was reported in all studies. Baseline 25(OH)D concentrations are summarized in Table 2.
For the case-control studies, three studies evaluated infants at birth or within the first few days of birth,94,95,97 and one study evaluated infants at two to five months of age.96 The sample sizes ranged from 21 to 82 infants with sub-categorization as to ethnicity,94 term born,97 season of birth,95 or feeding type.96 In all case-control studies, participants had to be healthy and free of conditions known to affect calcium and bone metabolism. Data on dietary vitamin D or calcium intake plus exposure to sunshine were only relevant for the study that evaluated two to five month old infants,96 and these data were not reported.
Covariate/confounders. No relevant covariates or effect modifiers were controlled for in the RCTs. In one RCT, baseline 25(OH)D concentrations were used to divide the study cohort into three subcategories91 (Table 2). Seasonal effects were examined in one study.92 For case-control studies, matching on gestational age at birth and gender was not reported. Only one
study adjusted for weight when evaluating the relation between 25(OH)D and whole body BMC.95
Outcome characteristics. For the RCTs, BMC of the distal radius was measured by single photon absorptiometry,92,93 and PTH was measured using RIA.91-93
For the case-control studies, BMC (whole body or spine) and BMD were measured using dual-energy x-ray absorptiometry (DXA).95-97 PTH was measured using RIA techniques.94-96 Although all studies used RIA techniques to measure PTH, these may have varied in antibody specificity and measurement of PTH fragments.98
One case-control study reported fracture incidence94 although the methodology was not reported.
Study quality. For the RCTs, one trial each scored 1/5,91 3/593 and 4/592 on the Jadad scale. The four case-control studies were of fair quality.
Qualitative synthesis of individual study results. Of the two RCTs measuring BMC of the distal radius, one study showed transient elevation in BMC at 12 weeks of age in the supplemented group (with serum 25(OH)D concentrations of 95 nmol/L) compared to the placebo group (with 25(OH)D concentrations of 50 nmol/L).93 However, by 26 weeks there was no significant difference in BMC between the placebo and vitamin D2 supplemented infants who continued to have higher serum 25(OH)D levels. In a second trial by Greer,92 no difference in BMC was observed at 3 months in vitamin D2 supplemented or unsupplemented human milk-fed infants despite 25(OH)D concentrations of 97 nmol/L in the intervention group compared to 39 nmol/L in the control group. At six months, the control group had higher absolute BMC and was also noted to have higher levels of the (unsupplemented) D3 isoform. However, the change in BMC from 1.5 to 6 months was not significantly different in the two groups.
Two case-control studies measured BMC and BMD of the lumbar spine (L1-4).96,97 One study observed a negative correlation between 25(OH)D (levels ranging from 10 to 292 nmol/L) and spine BMC and BMD at birth but no relation was observed in regression analyses that included postnatal age and serum calcium.97 The other study96 did not find a difference in spine BMC at two to five months of age when a group of human milk-fed infants with an average 25(OH)D serum level of 40 nmol/L were compared with a group of formula-fed infants with an average 25(OH)D of 73 nmol/L. 8/18 infants in the human milk-fed group and 1/17 in the formula-fed group had a serum 25(OH)D level < 28 nmol/L; there was no correlation of BMC with serum 25(OH)D concentration. The one study that measured whole body BMC reported a positive relation between 25(OH)D and BMC.95 The values for 25(OH)D in this study were on average 27 nmol/L for winter born and 75 nmol/L for summer born who had eight percent higher whole body BMC at birth.
Overall, for BMC measurements reflecting mainly cortical bone, including whole body and radial assessments, two of three studies showed a positive association between 25(OH)D concentrations with BMC, one measuring whole body BMC and one showing a transient increase in distal radial BMC at 12 but not 26 weeks.93,95 Of the two studies examining predominantly trabecular bone (lumbar spine),96,97 one showed a negative correlation between 25(OH)D and BMC and BMD at birth that was not evident after using multiple regression;97 the other did not demonstrate any association.
Of the two RCTs reporting PTH levels, one study did not observe differences in PTH between vitamin D2 supplemented and non supplemented infants at 1.5 to six months of age.92 Both groups were characterized by mean serum 25(OH)D levels above 30 nmol/L (measured by
HPLC). At all timepoints, 25(OH)D values were higher in the supplemented group (range of means from 75.6 to 97.2 nmol/L compared to means of 39.4 to 58.8 nmol/L in the unsupplemented group). In the other RCT, PTH declined in all groups from birth to three months of age while 25(OH)D concentrations increased to at least 46 nmol/L (measured by CPBA).91 In that study, all neonates who had abnormally high PTH had serum 25(OH)D < 30 nmol/L. In a case-control study, serum PTH was not different among winter and summer born infants with mean serum 25(OH)D of 27 and 75 nmol/L respectively (measured by HPLC).95 Similarly, human milk-fed infants with a mean 25(OH)D concentration of 40 nmol/L did not have different serum PTH values than formula-fed infants with a mean 25(OH)D concentration of 73 nmol/L (measured by HPLC).96 Lastly, Asian infants had significantly higher PTH concentrations and lower 25(OH)D concentrations of 5 to 20 nmol/L (mean 6, SD 4) when compared to Caucasian infants characterized by serum 25(OH)D concentrations of 9 to 39 nmol/L (mean 15, SD 5) (measured by CPBA).94 Overall, these five studies suggest that PTH is inversely associated with serum 25(OH)D concentrations at lower 25(OH)D concentrations but there was inconsistent evidence for a threshold that may exist somewhere above 27 nmol/L (measured by CPBA). Variable evidence for a threshold may be in part due to the different assays used, both to measure serum PTH and serum 25(OH)D.
Of the studies examining a relation between 25(OH)D and bone health outcomes, most had small sample sizes and the baseline 25(OH)D was variable ranging from deficient values around the limitation of detection to values above 27 nmol/L. In studies with repeated measurements, the baseline 25(OH)D was not considered as an effect modifier in evaluating the relation between 25(OH)D and bone health outcomes. The three included RCTs used vitamin D2 supplementations and therefore conclusions cannot be drawn regarding supplementation with the D3 isoform. Lastly, a definitive conclusion as to whether a specific concentration of 25(OH)D is associated with an elevated PTH (secondary hyperparathyroidism) is not possible given the evidence put forth to date. Additional studies are required to define a threshold concentration of 25(OH)D below which serum PTH levels rise. This will require not only standardization of 25(OH)D assays but also PTH assays.98
|
Summary. Serum 25(OH)D levels and bone health outcomes in infants Quantity: Of the two RCTs examining BMC, one demonstrated no benefit of higher serum 25(OH)D on radial bone mass while the other showed a transient increase of BMC compared to the unsupplemented group at 12 weeks but not 26 weeks. Of the three case-control studies, whole body BMC was positively related to and lumbar spine negatively related to serum 25(OH)D concentrations. Based on two RCTs and three case-control studies, a rise in PTH was either not observed with 25(OH)D concentrations above 27-30 nmol/L or occurred at a lesser rate than at lower values, suggesting a threshold value may exist somewhere above 27 nmol/L. Quality: The three RCTs were of fair to high quality (two of the three RCTs had a Jadad score of ≥ 3/5) and the four case-control studies were of fair quality. Consistency: There is inconsistent evidence for an association between a specific concentration of serum 25(OH)D and the bone health outcome BMC in infants. Overall, there is fair evidence that PTH is inversely associated with serum 25(OH)D concentrations at lower 25(OH)D concentrations, but there was inconsistent evidence for a threshold that may exist somewhere above 27 nmol/L (measured by CPBA). |
Table 2. Serum 25(OH)D and Bone Health Outcomes in Infants
|
Author (year) Country Funding |
Population, N Gender Mean Age (SD) Ethnicity |
Intervention Duration |
Serum 25(OH)D Assay Time points |
Bone Health Outcomes |
Results |
Jadad Score |
|
RCTs |
||||||
|
Greer (1982)93 |
18 Healthy term infants exclusively breast-fed IG1 9; CG 9 |
IG1: vit D2 400 IU/d CG: placebo |
25(OH)D^ |
PTH (RIA) |
Serum 25(OH)D mean nmol/L Baseline: no significant difference between groups |
3 |
|
|
|
CPBA |
distal L radius BMC (SPA) |
|
|
|
|
U.S. |
|
|
12 wks: IG1:95* (graph) CG: 50 |
|
||
|
|
|
12 wks (double blind); (unblinded to investigator at 3 mo); supplements continued until weaned |
Measured at baseline, 12 and 26 wks |
|
||
|
Public |
At 9 mo, 6/13 and at 12 mo, 3/13 enrolled infants were still breastfeeding |
|
|
|||
|
|
|
|
Measured at 3, 6, 12, 26, 40 and 52 wks |
|
|
|
|
|
|
|
26 wks: IG1: 81.8 CG: 32.3 |
|
||
|
|
66% female |
|
|
|
|
|
|
|
|
|
|
PTH: no significant difference between groups (data NR) |
|
|
|
|
0 d (recruited at birth) |
|
|
|
|
|
|
|
|
At 6 mo, unblinded to mother, and placebo group began to received daily vit D2 400 IU/d |
|
|
|
|
|
|
17 Caucasian 1 Asian-Indian |
|
|
BMC mean (SEM) mg/cm 12 wks: IG1 79 (3); CG 64 (3), p < 0.003 26 wks: IG1 70 (6); CG 75 (5), NS 52 wks: IG1 108 (20); CG 120 (19) (CG receiving vit D for 6 mo) |
|
|
|
|
|
followed to 1 y |
|
|
|
|
|
Author (year) Country Funding |
Population, N Gender Mean Age (SD) Ethnicity |
Intervention Duration |
Serum 25(OH)D Assay Time points |
Bone Health Outcomes |
Results |
Jadad Score |
|
Greer (1989)92 |
46 Healthy term born infants born to mothers willing to breast-feed for 6 mo, 12 additional controls (formula fed infants) |
IG1: 400 IU/d D2 CG: placebo |
25(OH)D^ and each isoform measured |
PTH (RIA) |
Total serum 25(OH)D mean (SD) At birth: IG1: 59.7 (11.8) CG: 58.8 (19.1) |
4 |
|
|
|
distal L radius BMC (SPA) |
|
|||
|
|
|
HPLC |
|
|
||
|
USA |
6 mo, starting at birth |
|
|
|
|
|
|
|
|
Measured at birth, 1.5, 3 and 6 mo |
|
6 mo: IG1: 92.4 (29.7) CG: 58.8 (24.9), p < 0.01 |
|
|
|
Public |
|
|
|
Measured at 1.5, 3 and 6 mo |
|
|
|
|
46% female |
|
|
|
||
|
|
NR (range 37 to 40 wk gestation) |
|
|
|
PTH: no significant difference between groups |
|
|
|
|
|
|
|
BMC mean (SD) mg/cm: No significant difference between groups at 1.5 and 3 mo. At 6 mo, CG was significantly greater than IG1: IG1 89.5 (12.5) vs. CG 101.0 (17.9), p<0.05 However, change in mean BMC from 1.5 to 6 mo was not different between groups. |
|
|
|
All infants: Caucasian mothers; fathers: 1 black, 1 American Indian, others Caucasian |
|
|
|
|
|
Author (year) Country Funding |
Population, N Gender Mean Age (SD) Ethnicity |
Intervention Duration |
Serum 25(OH)D Assay Time points |
Bone Health Outcomes |
Results |
Jadad Score |
|
Zeghoud (1997)91 |
80 Healthy neonates, and their mothers; after initial measurements, infants were divided into 3 groups based on serum 25(OH)D (≤ or > 30 nmol/L) and PTH ≤ or > 60 ng/L) |
IG1: 500 IU IU/d D2 IG2: 1000 IU/d D2 Starting at 3-6 d after birth |
25(OH)D^ |
iPTH (RIA) |
Serum 25(OH)D mean (SD) Baseline total sample: 29.5 (13.8); (range 10-80) 51/80 (63.7%) 30 nmol/L |
1 |
|
|
CPBA |
Measured at 3-6 d, 1 mo, 3 mo |
|
|||
|
France |
|
|
||||
|
Measured at 3-6 d, 1 mo, 3 mo. |
||||||
|
NR |
|
|
|
Serum iPTH was negatively correlated wtih 25(OH)D (r = 0.45, p < 0.001) |
|
|
|
|
All infants fed formula with mean (SD) 426 (46) IU vitamin D3/L |
|
|
|
|
|
|
|
|
|
In neonates with 25(OH)D < 16 nmol/L, iPTH was significantly higher: mean (SD) 70 (30) pmol/L than those born with 25(OH)D > 30 nmol/L |
|
||
|
|
NR |
|
|
|
||
|
|
NR (range: 3 to 6 d) |
|
|
|
|
|
|
|
|
|
|
Infants with high iPTH (> 60 ng/L) were born to mothers with 25(OH)D <30 nmol/L. |
|
|
|
|
From birth to 3 mo, 28 (35%) excluded, some (< 10) due to digestive problems |
|
|
|
|
|
|
|
|
|
|
Mean baseline 25(OH)D by group**: Group 1 (N = 14): 25(OH)D ≤ 30 nmol/L and iPTH > 60 ng/L: 17.9 (7.8) Group 2 (N = 36): 25(OH)D ≤ 30 nmol/L and iPTH < 60 ng/L: 22.7 (6.5) Group 3 (N = 29) 25(OH)D > 30 nmol/L and iPTH < 60 ng/mL: 43.7 (10.6) |
|
|
|
|
European |
|
|
|
|
|
Author (year) Country Funding |
Population, N Gender Mean Age (SD) Ethnicity |
Intervention Duration |
Serum 25(OH)D Assay Time points |
Bone Health Outcomes |
Results |
Jadad Score |
|
Zeghoud (1997)91 |
|
|
|
|
At 1 mo, all 3 groups (pooled vit D doses): mean serum 25(OH)D was significantly increased and there was no significant difference between groups. Group 1: 53.1 (12) Group 2: 59.8 (17.7) Group 3: 59.2 (11.4) At 1 mo, iPTH decreased and there was no significant difference between groups (pooled doses). At 3 mo, mean 25(OH)D for total sample (pooled doses) was 69 nmol/L; highest value 92.5 nmol/L. |
|
|
|
|
|
|
|
IG1 (500 IU D2) For group 1, at 1mo (45.5 nmol/L) and 3 mo (56.1 nmol/L), serum 25(OH)D values were significantly lower than the other 2 groups receiving same dose, and lower than all groups receiving 1,000 IU/d. |
|
|
|
|
|
|
|
Serum iPTH remained elevated in 14.3% of infants in group 1 after 1 mo, and mean PTH was significantly higher than those of other grps at 1 and 3 mo. |
|
|
|
|
|
|
|
IG2 (1,000 IU D2) Serum iPTH was similar among the 3 groups receiving 1000 IU/d at 1 mo. PTH declined in all grps and did not change between 1 and 3 mo. Change in serum 25(OH)D (3 mo) was not significantly different between the 3 groups. |
|
|
Author (year) Country Funding Source |
Population, N Gender Mean age (SD) Ethnicity |
Serum 25(OH)D Assay Time points |
Bone Health Outcomes Assay |
Results |
|
Case-control studies |
||||
|
Okonofua (1986)94 |
21 Healthy term born infants |
25(OH)D^ |
PTH (RIA-midportion) |
Serum 25(OH)D mean (SD) (nmol/L): Lower in Asian vs. white term born infants (p<0.01) White: 15 (5) (range 9-39) Asian: 6 (4) (range < 5 - 20) |
|
|
NR |
Cord and maternal sampling |
fractures during birth |
|
|
UK |
|
|
||
|
|
NR |
|
|
|
|
NR |
|
|
|
Mean (SD) serum PTH (pmo/L): Higher in Asian vs. white infants (p < 0.05) White: 55 (6) Asian: 44 (7) |
|
|
10 Caucasian (47.6%), 11 Asian (52.4%) |
CPBA |
|
|
|
|
|
Measured at baseline |
|
|
|
|
|
|
|
Maternal 25(OH)D in white mothers was 30 (11) nmol/L and in Asian mothers was 15 (10) nmol/L serum PTH was higher in Asian mothers. 25(OH)D levels in mothers were significantly higher than neonatal levels; the two were correlated (r=0.60). |
|
|
|
|
|
fractures during birth: 0 |
|
Bougle (1998)97 |
82 Healthy term born infants (also 44 preterm) |
25(OH)D^ |
LS BMD and BMC (DXA) |
Full term infants: Serum 25(OH)D mean (SD) nmol/L (range) 75 (52.5) (10-292.5) |
|
France |
|
Assay NR |
|
|
|
|
NR |
|
|
|
|
NR |
|
At or following hospital discharge |
|
Full term infants: 25(OH)D negatively related to BMD (r =−1.7, p=0.02) and to BMC in full term (r =−0.04, p=0.02), in a simple regression analysis but not related to BMC or BMD in a multiple regression analysis. |
|
|
Term 40 wks (range 37-42) |
|
||
|
|
Asian |
|
|
|
|
Author (year) Country Funding Source |
Population, N Gender Mean age (SD) Ethnicity |
Serum 25(OH)D Assay Time points |
Bone Health Outcomes Assay |
Results |
|
Namgung (1998)95 |
71 Healthy term infants, 37 born in summer, 34 born in winter |
25(OH)D^ |
iPTH (Allegro RIA) |
Serum 25(OH)D mean (SD) (nmol/L): Winter born infants had lower 25(OH)D than summer born (p<0.001). Winter born: 26.8 (19.0) Summer born: 75.0 (24.0) |
|
|
Measured in cord samples |
Whole body BMC (DXA) measured before 3 d of age |
||
|
Korea |
|
|||
|
|
Winter 38% female Summer 59% female |
|
|
|
|
Public |
HPLC |
|
|
|
|
|
|
|
|
% of infants with levels < 27.5 nmo/L Winter born: 97% Summer born: 47% |
|
|
Mean (SD) gestational age: Winter: 38.3 (0.7) wks Summer: 38.3 (0.8) wks, range 37 - 41 wka |
Winter 26.8 (19.0) Summer 75.0 (24.0) |
|
|
|
|
|
No differences were observed for PTH. Serum PTH geometric mean range): Winter born: 5.8 (2.8 - 11.9) Summer born: 5.1 (1.8 - 14.6), NS |
||
|
|
Korean |
|
|
|
|
|
|
|
|
Winter born had 8% lower whole body BMC than summer born (p = 0.0002). BMC LSM (SD) (g/cm): Winter born: 86.7 (7.7) Summer born: 93.9 (7.8) |
|
|
|
|
|
Whole body BMC correlated positively with serum 25 (OH)D (r=0.243, p=0.047). |
|
|
|
|
|
Maternal 25(OH)D was lower in winter than summer: 24 (13) vs. 43 (18), p < 0.001. |
|
Author (year) Country Funding Source |
Population, N Gender Mean age (SD) Ethnicity |
Serum 25(OH)D Assay Time points |
Bone Health Outcomes Assay |
Results |
|
Park (1998)96 Korea NR |
35 Healthy term born infants born in winter, 18 exclusively breast-fed, 17 formula-fed with 400 IU vitamin D enrolled at ages 2 - 5 mo |
25(OH)D^ |
iPTH (Allegro RIA) LS BMC and BMD (DXA) |
Serum 25(OH)D mean (SD) nmol/L: Mean was lower in breast-fed vs. formula-fed infants, p = 0.001 Breast-fed: 39.9 (28.2) Formula-fed: 72.5 (22.2) |
|
HPLC |
|
|||
|
|
Measured at recruitment (ages 2 - 5 mo) |
|
||
|
|
|
% with 25(OH)D < 28 nmol/L Breast-fed: 8/18 (44%) Formula-fed: 1/17 (6%), p=0.01 |
||
|
|
Breast-fed: 28% female; Formula-fed: 47% female |
|
||
|
|
Breast-fed: 3.3 (1.2) mo; Formula-fed: 3.6 (1.1) mo |
|
|
Serum PTH mean (SD) (ng/L) Breast-fed: 14.8 (6.93) Formula-fed: 11 (5.47), NS |
|
|
Korean |
|
|
|
|
|
|
|
|
LS BMD no difference between breast-fed (N = 14.18) and formula-fed infants (N = 14/17) (data NR) |
|
|
|
|
|
LS BMC mean (g/cm) (SD) No difference between groups Breast-fed: 0.62 (0.2) Formula-fed: 0.65 (0.2) |
|
|
|
|
|
25(OH)D did not correlate with BMC (r=0.173, p=0.39, N=28). |
|
^ refers to both or either isoform of 25(OH)D (isoform not specified); if reported, the isoform is specified. + Jadad score out of 5; for all RCTs in the table, allocation concealment was assessed as "unclear". *SEM provided in graph but not estimable ** 1/80 infants did not clearly fit into any category and had findings suggestive of transient congenital hypoparathyroidism AC, allocation concealment: BMC, bone mineral content; BMD, bone mineral density; DXA, dual X-ray absorptiometry; iPTH, intact PTH; IU, international units; LS, lumbar spine; LSM, least squares mean; mo, months; NR, not reported; NS, not significant; PTH, parathyroid hormone; RIA, radioimmunoassay; SD, standard deviation; SPA, single photon absorptiometry; y, year(s) |
||||
Question 1A (Part 3). Are Specific Circulating Concentrations of Serum 25 Hydroxyvitamin D [25(OH)D] Associated With Bone Health Outcomes in Older Children and Adolescents?
Definition of study populations. The Institute of Medicine defines early childhood as ages 4 though 8 years, and puberty/adolescence as ages 9 through 13 years, and 14 through 18 years.4 Grouping by age for the purpose of this report were based on the study populations. In this section, children six years of age or older who had not yet entered puberty were included, and adolescence (marked by the onset of puberty) was defined by the presence of at least Tanner Stage 2 for sexual development.99 The age groups in the included studies for this section were: 6-10 years,100 age 9 years,101 8 – 10 years,102 9-15 years,103 15-16 years,104 10 – 17 years,105 and 10 – 18 years.106
Study characteristics. Three studies that included older children (one RCT,102 one prospective cohort101 and one before-after study100) assessed the association between serum 25(OH)D concentrations and bone health outcomes.
Four studies in adolescents assessed the association between 25(OH)D levels and bone health outcomes.103-106 There were two cohort studies,103,104 one case-control study106 and one RCT.105 The first cohort evaluated the association between serum 25(OH)D levels and lumbar spine and femoral neck BMD/bone mineral apparent density (BMAD) at baseline and 3 years.103 The second cohort study evaluated the seasonal variation in serum 25(OH)D concentrations and its relation to intact (i) PTH levels over an 18 month period.104 El Hajj Fuleihan105 evaluated the effect of low (1,400 IU/week) and high (14,000 IU/week) dose vitamin D3 on areal BMD and BMC of the lumbar spine, hip, forearm, and total body and body composition. Marwaha 106 evaluated 25(OH)D concentrations in 5,137 children and adolescents (aged 10-18 years) from Northern India and the association with serum PTH, ionized calcium and BMD of the forearm and calcaneus, with stratification by upper and lower socioeconomic status.
Bone health outcomes – ascertainment. For the studies on older children, PTH was measured by an immunoradiometric assay that detects the mid-region of the molecule, 102 and distal radial BMC was measured by single-photon absorptiometry (SPA).102 Javaid101 measured whole body and lumbar spine BMC and areal BMD by DXA , and calculated an apparent volumetric BMD at nine years of age in relation to maternal third trimester 25(OH)D status. Rajakumar100 evaluated the association between serum 25(OH)D concentrations, serum PTH and markers of bone turnover.
For adolescents, lumbar spine BMD, femoral BMD, and lumbar spine bone mineral apparent density (BMAD) was measured by DXA103 and iPTH by immunoradiometric assay.104 Fuleihan measured areal BMD and BMC at the lumbar spine, hip and forearm, and total body and lean body mass by DXA.105 Marwaha106 evaluated forearm and calcaneal BMD using peripheral DXA and PTH with an immunoradiometric assay.
There were no studies that assessed the association between serum 25(OH)D concentrations and fractures in older children or adolescents.
For assessment of 25(OH)D levels, different methods were used depending on the study. These included radioimmunoassay or radioimmunometric methods in three studies,101,103,106 and CPBA in three studies.100,104,105
Population characteristics. For older children, ages ranged from eight to ten years in two studies with mixed gender.101,102 Included subjects were aged 6 – 10 years in the Rajakamar study who exhibited a combination of pre- and early pubertal status (33/42 pre-pubertal Tanner stage I).100 Eligibility criteria for two studies required that participants be healthy, without comorbidities.100,102 The prospective cohort study by Javaid did not state whether children with comorbidities were excluded. The mean dietary intake of calcium/vitamin D was reported in two studies.100,101
For adolescents, subjects ranged in age from nine to 16 years.103-106 All patients were at least Tanner Stage 2 for pubertal development with the exception of the Marwaha study which did not report pubertal status. However, the patients in the latter study were 10-18 years of age and it is anticipated that the majority were at least Tanner Stage 2 puberty. The studies involved either female,103,105 male,104 or mixed genders.106 Participants were reported as healthy, without known comorbidities, in two of four studies.103,104 The mean dietary intake of calcium/vitamin D was reported in three studies.100,103,104 Additional characteristics are summarized in Table 3.
Confounders/effect modifiers. In the studies on older children, Javaid adjusted for the age of the child at the time of the BMC measurement due to the strong association between age and whole body BMC.101 Since bone size can affect the BMD results, volumetric BMD at the lumbar spine was calculated. For adolescents in the 25(OH)DBMC/BMD cohort study,103 adjustments were made for the time to followup, and regression analyses were performed to determine covariates for BMD and BMC. El-Hajj Fuleihan105 made adjustments for lean mass and bone area, and did exploratory subgroup analyses on pre and post menarcheal girls in their analysis of vitamin D status in relation to BMD and BMC. Marwaha106 adjusted BMD for both height and weight.
Study quality. On the Jadad scale, one RCT scored 3/5102 and one scored 4/5105 indicating both were of high quality. The overall study quality for the observational studies was fair. Limitations included failure to adjust for relevant confounders or other sources of bias, and higher numbers of participants lost to followup.
Qualitative synthesis of individual study results. In a study of pre-pubertal Finnish girls, 400 IU vitamin D2, increased serum 25(OH)D levels (measured by RIA) compared with placebo but did not impact mid-region PTH or distal radial BMC (SPA) after 13 months.102 Radial BMC was not adjusted for bone size in this study.
In the before-after study by Rajakumar,100 baseline vitamin D status (measured by CPBA with deficiency defined as a serum 25(OH)D < 25 nmol/L (10 ng/ml) and insufficiency defined as < 50 nmol/L) was negatively correlated with PTH (but not associated with baseline serum calcium, phosphorus, albumin, or 1,25-(OH)2D). Serum PTH remained stable at levels of 25(OH)D around 75 nmol/L. There were no significant differences between the vitamin D insufficient and sufficient groups with regard to gender, weight, height, BMI and skin pigmentation. The mean (SD) daily dietary vitamin D intake was 277 (146) IU (mean intakes of 233 in the insufficiency group and 318 IU in the sufficient group were not significantly different). Dietary calcium intake was significantly higher in the sufficient group.
Javaid101 reported that low serum 25(OH)D concentrations (measured by RIA) in mothers during late pregnancy were weakly but significantly associated with reduced whole body (r =
0.21, p<0.01) and lumbar spine (r = 0.017, p = 0.03) age-adjusted BMC (DXA-Lunar DPX-L). Bone mass in children of mothers who were vitamin D deficient (25(OH)D < 28 nmol/L) during pregnancy was significantly lower compared to children born to vitamin D sufficient mothers. Reduced umbilical venous calcium also predicted reduced childhood bone mass (p = 0.0286). Whether this observation is mediated, totally or in part, through an effect on bone size and/or muscle mass is not clear. Maternal vitamin D status was positively associated with whole body and spine BMC in the offspring, and neither childhood height nor lean mass was associated with maternal 25(OH)D levels. Adjustment for childhood height did not significantly weaken the relation between maternal vitamin D status and whole body BMC. In contrast, volumetric BMD of the lumbar spine (which corrects for bone size) was not associated with maternal vitamin D status. Milk intake and physical activity at age nine were not significant determinants of bone mass although these findings do not rule out the possibility that factors such as UV exposure, diet and other lifestyle characteristics may have affected bone mass. When socioeconomic status was adjusted for, it did not change the association substantially. The type of postnatal feeding in the first three months also did not affect bone mass.
For girls age 9 – 15 years, the three year cohort study (N = 171) by Lehtonen-Veromaa evaluated the relation between baseline 25(OH)D levels (measured by RIA) and the change in lumbar spine (r = 0.35, p < 0.001) and femoral neck BMD (r = 0.32, p < 0.001). Baseline 25(OH)D also correlated with the change in LS BMAD (size-corrected form of BMD) (r = 0.35, p < 0.001) and FN BMAD (r = 0.24, p < 0.002). The difference in the percent increase from baseline in lumbar spine BMD (adjusted for the followup period) between those with low 25(OH)D levels (<20 nmol/L) and those with higher 25(OH)D levels was four percent. The difference in lumbar spine BMD was 12.7, 13.1 and 16.7 percent for the lowest, middle and highest 25(OH)D tertiles, respectively.103
In another cohort (N = 175) of French teenage boys, there was a significant negative correlation between serum iPTH and 25(OH)D levels (measured by CPBA), with a plateau in PTH demonstrated at 25(OH)D levels of 83 nmol/L and above.104 At this level of 25(OH)D, the iPTH reached a plateau at 2.48 pmol/L.
El-Hajj Fuleihan105 found a significant association between baseline serum 25(OH)D levels (measured by CPBA) and baseline BMD at the lumbar spine (r=0.16, p=0.033), femoral neck (r = 0.17, p = 0.028), and radius (r = 0.24, p = 0.002) (DXA-Hologic 4500). There was also a significant association between baseline serum 25(OH)D levels and baseline radius BMC (r = 0.16, p = 0.033). The mean baseline serum 25(OH)D was 35 nmol/L (14 ng/ml). In post hoc analyses, there were negative correlations between baseline serum 25(OH)D levels and percent change in lumbar spine BMD (r = −0.16, p = 0.044) or subtotal body BMD (r = −0.20, p = 0.009) over one year. Significant negative associations were found between baseline serum 25(OH)D levels and percent change in spine, femoral neck and radius BMC.
After vitamin D supplementation for one year, total hip BMC increased in the high dose (14,000 IU/wk) group (pre- and post-menarcheal girls combined) but there were no significant changes in BMC or BMD at other skeletal sites. In an exploratory subgroup analysis in pre-menarcheal girls alone (N = 34), total body lean tissue mass increased in both supplementation groups. Lumbar spine areal BMD was significantly increased in the low dose (1,400 IU/wk) group, and trochanter BMC was increased in both the high and low dose groups. The magnitude of the treatment effect was not significant after adjusting for both bone area and lean tissue mass. The authors acknowledge a limitation of DXA in evaluating areal BMD and BMC is the lack of
consensus on how best to adjust for bone size. In postmenarcheal girls, there were no differences in changes in lean mass, BMD or BMC amongst the three groups. In boys (data not shown), the authors reported there was no consistent positive effect of vitamin D supplementation on lean mass, BMD or BMC.
Marwaha106 showed that children with a lower socioeconomic status had significantly lower 25(OH)D concentrations (measured by RIA) and mean BMD (unadjusted for bone size) for the forearm and calcaneus (DXA-PIXI-1.34) was higher in the upper socioeconomic group. There was a significant negative correlation between serum immunoreactive PTH and 25(OH)D concentrations (r = −0.202, p < 0.001). PTH concentrations only increased at 25(OH)D concentrations below 12.5 nmol/L. There was no significant correlation between the mean serum concentration of 25(OH)D and BMD in both groups.
|
Summary. Serum 25(OH)D and bone health outcomes in older children and adolescents Quantity: There were seven studies in older children and adolescents (two RCTs, three cohorts, one case-control and one before-after study) that evaluated the relation between circulating 25(OH)D and bone health outcomes. In older children, there was one RCT, one prospective cohort and one before-after study. One RCT did not find an association between 25(OH)D and distal radial BMC. Both the RCT and before-after study found no evidence of an association between 25(OH)D levels and PTH in older children. Three studies in older children or adolescents evaluated serum 25(OH)D and PTH levels, and found an inverse non-linear relation with a plateau of PTH at 25(OH)D levels above 75-83 nmol/L in two studies (both measured by CPBA) and above 30 nmol/L in another (measured by RIA). Two of three studies found a positive association between baseline 25(OH)D status and BMC/BMD. The effect of bone size and muscle mass on these outcomes in relation to baseline 25(OH)D status was not reported. One RCT demonstrated a significant relation between baseline 25(OH)D and baseline BMD of the lumbar spine, femoral neck and radius. However, only high dose supplementation with 14,000 IU/wk of vitamin D3 increased BMC of the total hip. Quality: The two RCTs each scored ≥ 3/5 on the Jadad scale and therefore were of higher quality. Most observational studies were of fair quality. Consistency: Overall, there was fair evidence of an inverse association between 25(OH)D and PTH in adolescents. There was also fair evidence of an association between serum 25(OH)D levels and baseline BMD and change in BMD/BMC indices from the studies in older children and adolescents. However, the results from two randomized trials of vitamin D supplementation have not confirmed a consistent benefit on BMD/BMC across sites and age groups. One cohort showed that maternal vitamin D status was weakly associated with whole body and spine BMC in nine year olds. Adjustment for childhood height did not significantly weaken the relation between maternal vitamin D status and whole body BMC, in contrast to the lumbar spine data, where apparent volumetric BMD (adjusts for bone size) was not associated with maternal vitamin D status. |
Table 3. Serum 25(OH)D Levels and Bone Health Outcomes in Older Children and Adolescents
|
Author (year) Country Funding |
Population, N Attrition Gender Mean age Ethnicity |
Intervention Duration |
25(OH)D Assay |
Bone Health Outcomes |
Results |
Jadad AC |
|
RCTs |
||||||
|
Ala-Houhala (1988)102 |
60 Children, 8 - 10 y old IG1: 30; CG: 30 |
IG1:Vit D2400 IU 5-7×/wk CG: placebo |
25(OH)D^ Measured at baseline (1st winter) mid-study (autumn), and end of study 2nd winter) |
PTH (midregion 44-68, RIA) |
Serum 25(OH)D mean (SD) nmol/L Baseline (winter): IG1: 49.3(19.0) vs. CG: 46 (15.5) Mid-study (autumn): IG1: 78 (24.3) vs. CG 59 (17.8) End-of-study (winter): IG1: 71.3 (23.4) vs. CG 43.3 (19.5), p < 0.01 |
1 |
|
|
Unclear |
|||||
|
|
distal radius BMC (SPA) |
|
||||
|
Finland |
Excluded: IG1 6; CG 3 |
|
|
|
||
|
|
|
13 mo |
|
|
||
|
Public |
|
|
|
|
|
|
|
|
% female: IG1 62%; CG 48% |
|
CPBA |
|
|
|
|
|
|
|
|
Baseline serum PTH mean (SD) pmol/L: IG1: 40 (20); CG 39 (19) (NS) No difference between groups in PTH at 13 mo |
|
|
|
|
NR; range 8-10 y |
|
|
|
|
|
|
|
|
|
|
No difference between groups in distal radius BMC at 13 mo |
|
|
|
|
Caucasion |
|
|
|
|
|
|
Fuleihan (2006)105 |
179 children and adolescent girls (34 pre-menarcheal and 134 post-menarcheal) IG1: 62 IG2: 59 CG: 58 |
IG1: 1,400 IU D/wk IG2:14,000 IU D/wk CG: Placebo |
25(OH)D^ Measured at baseline, 6 mo, 1y |
BMD and BMC LS, forearm, total body DXA (Hologic 4500A) |
25(OH)D mean (SD) nmol/L baseline: IG1: 35 (22.5) IG2: 35 (20.0) CG: 35(17.5) |
4 |
|
|
Unclear |
|||||
|
Lebanon |
|
|
||||
|
|
CPBA (Incstar, DiaSorin) |
|
|
|||
|
Private |
|
|
|
|
||
|
|
1 y |
|
|
1y: IG1: 42.5 (15) IG2: 95 (77.5) CG: 40 (20.0) |
|
|
|
|
Lost to follow up or discontinued: 11 |
|
|
|
Covariates: percent change in bone area, percent change in lean mass Significant association between baseline serum 25(OH)D and: LS BMD (r=0.16, p=0.033), Femoral neck (r=0.17, p=0.028), and Radius BMD levels (r=0.24, p=0.002) Radius BMC levels (r=0.16, p=0.033). Largest increases in bone mass in IG2 (high dose) subjects with lowest 25(OH)D levels at baseline |
|
|
|
100% female |
|
|
|
|
|
|
|
10-17 y |
|
|
|
|
|
|
|
Middle Eastern |
|
|
|
|
|
|
Author (year) Country Funding |
Population, N Attrition Gender Mean age Ethnicity |
Intervention Duration |
25(OH)D Assay |
Bone Health Outcomes |
Results |
|
Prospective Cohort Studies |
|||||
|
Guillemant (1999)104 |
175 Healthy adolescent boys from a jockey training center |
NA |
25(OH)D^ Measured after summer (Sept–Oct) and after winter (March-April) |
iPTH (immunoradiometric assay, Nichols) |
25(OH)D mean (SD) Post-summer 58.5 (10) Post-winter 20.6 (6.0), P=0.0001 |
|
France |
|
|
|
||
|
|
|
|
|
iPTH negatively correlated with 25(OH)D, non-linear, (p <0.001, r=−0.504) |
|
|
NR |
100% male |
|
|
|
|
|
|
|
|
CPBA |
|
|
|
|
Range 13 y 5 mo to 16 y 1 mo |
|
|
|
At > serum 25(OH)D > 83 nmol/L, iPTH plateau occurred at 2.48 pmol/L |
|
|
Caucasion |
|
|
|
seasonal variation in mean (SD) iPTH: summer 2.76 (0.97) vs. winter 4.20 (1.21) pmol/L |
|
Javaid (2006)101 |
198 Children with known maternal 25(OH)D status in third trimester (original cohort: children born to 596 white women in a study of maternal nutrition and fetal growth 1991- 1992) |
NA |
25(OH)D^ Measured in mothers in third trimester |
Total body and lumbar spine BMC and areal BMD calculated volumetric BMD (DXA Lunar DPX-L) |
Maternal serum 25(OH)D in late pregnancey: 18% had serum 25(OH)D levels < 27.5 nmol/L and 31% had levels 27.5-50 nmol/L |
|
U.K. |
|
|
|||
|
|
|
RIA (IDS) |
Mothers with lower 25(OH)D during pregnancy had children with reduced total body (r=0.21, p=0.0088) and lumbar spine BMC (r=0.17, p=0.03). Adjustment for height did not weaken the relationship between total body BMC and 25(OH)D; Volumetric LS BMD was not associated with maternal 25(OH)D. |
||
|
Public |
|
|
|||
|
|
9 y old |
|
|
|
adjusted for age of child |
|
|
Caucasion |
|
|
|
|
|
Author (year) Country Funding |
Population, N Attrition Gender Mean age Ethnicity |
Intervention Duration |
25(OH)D Assay |
Bone Health Outcomes |
Results |
|
Lehtone-Veromaa (2002)103 |
191 Healthy adolescent girls |
NA |
25(OH)D^ baseline, 1 and 3 y |
LS BMD and BMAD FN BMD and BMAD DXA (QDR 4500C Hologic) |
25(OH)D mean (SD) nmol/L baseline: 34.0 (13.2) (winter) 1 y: 33.2 (11.1) 3 y: 40.6 (15.8) |
|
15 (7.9%) dropped out during the 3 y (final N=171) |
|
RIA (DiaSorin) |
|||
|
Finland |
|
|
|
|
|
|
|
|
|
|
Baseline 25(OH) D correlated with ∆ LS BMD (r=0.35, p < 0.001) and ∆ FN BMD (r=0.32, p < 0.001) |
|
|
Public |
|
|
|
|
|
|
|
100% female |
|
|
|
|
|
|
|
|
|
|
Baseline 25(OH)D correlated with ∆ LS BMAD (0.35, p < 0.001) and ∆ FN BMAD (0.24, p < 0.002) |
|
|
12.9 (1.7) y, range 9-15 y |
|
|
|
|
|
|
|
|
|
Adjusted for: baseline reproductive y, bone mineral values, increases in height and weight, mean intake of calcium and mean amount of physical activity Significant correlation between baseline 25(OH)D and ∆ 3-y adjusted LS or FN BMD and BMAD. |
|
|
|
Caucasian |
|
|
|
|
|
|
|
|
|
|
Difference in mean 3-y ∆ LS BMD between group with baseline 25(OH)D<20 nmol/L and group with baseline 25(OH)D ≥37.5 was 4%. |
|
Author (year) Country Funding |
Population, N Attrition Gender Mean age Ethnicity |
Intervention Duration |
25(OH)D (isoform measured) Assay |
Bone Health Outcomes |
Results |
|
Case-Control Studies |
|||||
|
Marwaha (2005)106 |
5137 Healthy school children 3089 from Lower Social Economic Status (LSES), 2048 from Upper Social Economic Status (USES) |
NA |
25(OH)D^ |
BMD (distal forearm and calcaneum) using DXA (Lunar PIXI-1.34)) measured in subset N = 555 |
Serum 25(OH)D mean (SD): 29.5 (18) LSES: 26 (1); USES: 34 (1) 25(OH)D < 22.5 nmol/L: 35.7%; LSES 42.3% vs. USES 27%, p < 0.01 |
|
|
|
RIA Measured in subset N = 740 |
|||
|
India |
|
||||
|
NR |
|
|
Prevalence of clinical vitamin D deficiency (defined by genu varum or genu valgum): LSES 11.6% vs. USES 9.7%, p=0.07 |
||
|
|
|
|
|
iPTH (immunoradiometric assay, DiaSorin) N = 740 |
|
|
|
% female: LSES: 65.1% USES: 52.7% |
|
|
Forearm mean BMD significantly higher (p<0.01) in USES group compared to LSES BMD adjusted for height and weight |
|
|
|
Mean age NR Range 10 – 18 y |
|
|
|
Serum Ca no significant difference between groups but dietary calcium intake lower in LSES group |
|
|
Indian |
|
|
|
No significant correlation between BMD and serum 25(OH)D in either group |
|
|
|
|
|
|
Significant negative correlation between PTH and 25 (OH)D, r=0.020, p<0.01 |
|
Author (year) Country Funding |
Population, N Attrition Gender Mean age Ethnicity |
Intervention Duration |
25(OH)D (Isoform Measured) Assay |
Bone Health Outcomes |
Results |
|
Before-After Studies |
|||||
|
Rajakumar (2005)100 |
42 Healthy 6 - 10 y olds Tanner stage I/II (81% I) Skin type III/IV (81% IV) Vit D dietary intake: mean (SD) 277 (146) IU/d 16/41 (39%) dietary intake < 200 IU/d |
Vit D 400 IU/d (isoform not specified) |
25(OH)D^ Measured at baseline and 1 mo |
iPTH (Immulite iPTH chemiluminescent assay) |
Serum 25(OH)D mean (SD) nmol/L baseline: 60.0 (26.3) 49% < 50 71% < 75 |
|
U.S. |
|
|
|||
|
|
1 mo |
CPBA (Nichols Advantage chemiluminescence) |
|
|
|
|
Public |
|
|
|
Group 1 = 25(OH)D < 50 nmol/L at baseline: 38.5 (8.0) Group 2 = 25(OH)D > 50 nmol/L at baseline: 80.3 (20.5) |
|
|
|
|
|
|
1 mo (total group): 68.8 (18.8) Group 1: 57.5 (16) Group 2: 79.5 (14.5) Increase in serum 25(OH)D was observed only in group 1 7/39 (18%) of group 1 continued to have a level < 50 nmol/L after 1 mo of supplementation |
|
|
|
2 withdrew for personal reasons |
|
|
|
|
|
|
34% female |
|
|
|
|
|
|
|
|
|
|
Negative correlation between 25(OH)D and PTH at baseline (r = -0.325, p = 0.038) Inflection point for PTH started at 25(OH)D ~ 75 nmol/L |
|
|
8.9 (1.2) y (range 6 -10 y) |
|
|
|
|
|
|
African American |
|
|
|
iPTH mean (SD) pmol/L Baseline: 4.62 (1.9) 1 mo: 4.24 (2.1) |
|
|
|
|
|
|
Negative correlation of 25(OH)D with body weight (r = −0.378, p = 0.015) at baseline |
|
|
|
|
|
|
No significant differences at baseline or 1 mo in markers of bone turnover, 1,25-(OH)2D or PTH between groups with 25(OH)D < 50 nmol/L or > 50 nmol/L at baseline |
|
BMC, bone mineral content; BMD, bone mineral density; BMAD, bone mineral apparent density; CG, control group; CPBA, competitive protein binding assay; d, day; DXA, dual X-ray absorptiometry; IG, intervention group; iPTH, intact p; arathyroid hormone; LSES, lower socioeconomic status; mo, month(s); FN, femoral neck; LS, lumbar spine; RIA, radioimmunoassay; SD, standard deviation; SPA, single photon absorptiometry USES, upper socioeconomic status; y, year |
|||||
Question 1B. Are Specific Circulating Concentrations of 25-Hydroxvitamin D [25(OH)D] Associated with Bone Health Outcomes in Pregnant and Lactating Women?
Vitamin D is essential for calcium homeostasis in the body including transport of calcium across the placenta in order to provide the fetus with mineral, especially during the last trimester of pregnancy. The rate of fetal accretion of calcium increases from approximately 50 mg/day at 20 weeks gestation to 330 mg/day at 35 weeks.107 To provide for such fetal calcium needs, physiological changes occur naturally during pregnancy so that intestinal absorption of calcium is doubled; this occurs via an up-regulation of the active hormone of vitamin D, 1,25-(OH)2D. The mechanism mediating the increase in vitamin D activity is not fully understood; it may involve pregnancy-associated hormones, placental synthesis of vitamin D, or a change in the balance between production of 1,25-(OH)2D and 24,25-(OH)2D. During lactation, the typical daily loss of calcium has been estimated to range from 280 to 400 mg. To meet these demands, skeletal calcium is released by temporary bone demineralization. This section presents the results of studies that investigated the association between vitamin D status in pregnant or lactating women and their bone health outcomes.
Overview of Relevant Study Characteristics and Results
Five observational studies evaluated the association between vitamin D status and bone health outcomes in mothers, or their offspring. One prospective study101 involved the analysis of the bone status by DXA at nine years of age in 198/596 previously studied offspring and the results of this study are summarized in the section on children (Section 1A part 3). The remaining four studies provided data on changes in vitamin D status during pregnancy, and the effect of maternal vitamin D status during pregnancy on outcomes of birth gestation or size. All studies included serum 25(OH)D measurements and other markers of calcium homeostasis. Study characteristics and 25(OH)D assays are outlined in Table 4.
The time of assessment of vitamin D status, the assay method for 25(OH)D and bone health outcomes varied across studies which precluded quantitative synthesis of results.
Vitamin D Status in Pregnant and Lactating Women
Study characteristics. Three prospective cohort studies reported on vitamin D status during pregnancy,108-110 one included assessment six weeks postpartum109 and one also measured 25(OH)D concentrations postpartum and during lactation.108 A prospective cohort study110 measured vitamin D status in early pregnancy (11 weeks) and at the beginning of the third trimester and then assessed the relationship between vitamin D status with infant size at birth.
In the before-after study, serum 25(OH)D and PTH were measured.111 The study duration was from first “booking” into the maternity clinic (presumably in the first trimester) to delivery
with measurement of vitamin D status at 36 weeks of gestation for those mothers identified as vitamin D deficient at baseline.
Bone health outcomes. Only one of the prospective cohort studies in lactating women included change in bone mineral density as an outcome.108 None of the included studies evaluated bone mineral content (BMC), fractures or ultrasound parameters as an outcome. Three studies evaluated serum PTH concentrations as an outcome.108,109,111 One study evaluated maternal vitamin D status during pregnancy and the association with infant body size at birth.110
Population characteristics. Sample sizes ranged from 40 to 160 women who were recruited during pregnancy. Mean vitamin D intake and calcium intake were not reported for any of the studies which is important given that calcium intake modulates serum PTH. All studies involved pregnant women but ethnicity and geographical location varied widely. One study enrolled non-European ethnic minority women,111 another study enrolled only Asian women,109 and two studies enrolled mainly Caucasian women.108,110
Confounders/covariates. Intake of vitamin D supplements111 was identified as covariate in one study. Sowers108 used multiple linear regression and linear mixed models (paired comparisons between early and late pregnancy) to examine the predictability of calciotrophic hormones on the rate of change in BMD of the spine and femoral neck, after adjusting for concentrations of other hormones and the time since parturition. Morley adjusted for maternal BMI, smoking during pregnancy, and maternal PTH levels in the evaluation of the association of serum 25(OH)D levels at less than 16 weeks and 28 weeks gestation with offspring birth size.110 One study did not adjust for any confounders in the analysis.111
Outcome characteristics. One cohort study measured BMD with dual energy x-ray absorptiometry (DXA) at the femoral neck and lumbar spine over 4 to 6 time points ranging from just after delivery to 18 months postpartum during lactation.108 Midmolecule or Intact PTH was measured using radioimmunoassay,108 immunoradiometric assay,109 or chemiluminescent methodology.110,111
Qualitative Synthesis of Individual Study Results
Maternal vitamin D status. In the study of non-European minority women from South Wales,111 50 percent of the women were vitamin D deficient at the first antenatal visit, using a criterion of serum 25(OH)D < 20 nmol/L. Vitamin D supplementation (800-1600 IU) D during pregnancy normalized vitamin D status in 60 percent of the deficient group. In the study in Saudi Arabia of 40 Asian women,109 serum 25(OH)D declined significantly from baseline (about 11 weeks gestation) to the third trimester (mean of 31.4 wk of gestation) and remained low through to 6 weeks post-delivery. However, at all timepoints, mean serum 25(OH)D concentrations were within the normal range of a reference group of non-pregnant women (N = 280) who were healthy and non-lactating, suggesting that although serum levels decline during the end of the third trimester, they do not differ extensively from those of the non-pregnant state. None of the pregnant women were classified as having subclinical vitamin D deficiency (25(OH)D < 20 nmol/L). In the study110 in primarily Caucasian women in Australia, serum 25(OH)D was similar at recruitment (11 weeks of gestation) and at the beginning of the third trimester of pregnancy (28-32 weeks of gestation) but there were significant differences between
mean values in winter versus summer months. The percent who were vitamin D deficient (9-10 percent as defined by 25(OH)D < 28 nmol/L) was significantly greater in winter than summer.
One cohort study assessed vitamin D status postpartum and in relation to breast-feeding.108 There was a non-significant trend to a decline in vitamin D status in the initial 2 -4 months and the pattern was not influenced by the season of birth. Vitamin D status was not influenced by the duration of breast-feeding. The percent of women who were vitamin D deficient was not provided but based on the mean values, some of the women would have had 25(OH)D values less than 20 nmol/L. Data on vitamin D intake or sun exposure were not provided.
Vitamin D status and bone health outcomes. In the cohort study by Sowers, bone mineral density of lumbar spine and femoral neck was measured in 115 mothers with different breast-feeding practices during the postpartum period and vitamin D status was not associated with changes in BMD of the femur or spine.108 Women were recruited during the third trimester, lumbar spine BMD was measured at two weeks, 6, 12 and 18 months postpartum and femoral neck at two weeks, two, four, six, 12 and 18 months. Serum PTH and the other calciotrophic hormones were not associated with changes in femoral or lumbar spine BMD, suggesting that 25(OH)D, PTH and 1,25-(OH)2D do not explain the calcium mobilization and bone turnover that occurs during lactation.108
In the before-after study in pregnancy,111 serum 25(OH)D did not appear to correlate with serum PTH concentrations, with 65/80 women with low 25(OH)D having PTH in the normal range.
In a prospective cohort study on 40 Asian women (280 non-pregnant controls),109 serum 25(OH)D levels negatively correlated with intact PTH (r = −0.62, 0<0.001). In this study, serum osteocalcin, a bone formation marker was below the reference range observed in non-pregnant women, and declined in the second trimester compared to the first, but then rose to within or above the reference range at term and 6 weeks postpartum. This suggests changes in bone turnover do occur during early pregnancy, irrespective of normal vitamin D status.
In the prospective cohort study by Morley there was no association between baseline maternal 25(OH)D concentrations and measures of infant size at birth.111 There was an inverse association between maternal log2 25(OH)D and log2 PTH. Using the maternal 25(OH)D concentrations at 28-32 weeks, the mean gestational length was significantly shorter (0.7 weeks, 95% CI -1.3,-0.1 weeks) in the vitamin D-deficient mothers compared to mothers with 25(OH)D concentrations over 28 nmol/L. This association was not altered by inclusion of log2 PTH, serum calcium and albumin concentrations. Infants born to mothers who were vitamin D deficient at 28-32 weeks gestation, had lower mean knee-heel length (−2.7 mm) compared to infants born to mothers who were not vitamin D deficient, after adjusting for gestation length.110 Further nonparametric smooth regression analysis and adjustment of confounders suggested the possibility of a linear association when 25(OH)D levels were below 30-40 nmol/L, but there was no association at higher 25(OH)D levels. Low maternal 25(OH)D levels were associated with a negative impact on long bone growth and the authors postulated that maternal PTH may affect fetal growth via an affect on 1,25-(OH)2D production.110
Study quality. There were no RCTs identified that evaluated the association between serum 25(OH)D concentrations and bone health outcomes in pregnant and lactating women. The before-after study111 was poorly designed, lacked detail regarding the duration and compliance with the vitamin D supplements, and the analyses were incomplete. A limitation of the included studies was failure to adjust for all relevant covariates. Only one six-week cohort study was considered to be of good quality, since it included an age-matched non-pregnant cohort with control values for all biochemical measurements (N = 280) and provided six serial measures with no attrition during followup.109 The cohort study conducted during lactation,108 was of good quality as it included six serial biochemical measures, four measures of spinal BMD and six of femoral neck BMD throughout lactation, and adjusted for a number of covariates. The one study in which the primary outcome was size of offspring at birth was judged to be of fair quality due to loss of followup of over 20 percent.110
|
Summary. Serum 25(OH)D levels and bone health outcomes in pregnancy and lactation Quantity: Four studies (no RCTs, three cohorts, one before-after study) assessed vitamin D status at various time points in pregnancy with vitamin D deficiency being observed in 0 to 50 percent of subjects. Only one cohort study (N=115) included maternal BMD as an outcome and there was no relation between vitamin D status and postpartum changes in BMD. Quality: Quality scores ranged from poor to good. Skin color, vitamin D supplementation, calcium intake and sun exposure were not controlled for or assessed in all studies. Consistency: Two studies observed no change in vitamin D status during pregnancy, whereas another observed a decline in serum 25(OH)D from the 1st to 3rd trimester. There was insufficient evidence on the association between 25(OH)D and change in bone density during pregnancy. One good prospective cohort did not find an association between serum 25(OH)D and the changes in BMD that occur during lactation. There was fair evidence that serum 25(OH)D correlated negatively with PTH levels in pregnancy. Limitations in the study design and sources of bias highlight the need for additional research on vitamin D status in pregnancy and lactation, and the association with bone health outcomes. |
Table 4. Serum 25(OH)D Levels and Bone Health Outcomes in Pregnant or Lactating Women
|
Author (year) Country, Funding |
Population, N Attrition Mean age Ethnicity |
Duration |
Serum 25(OH)D mean (SD) (nmol/L) Assay |
Bone Health Outcomes |
Results |
|
Prospective Cohorts |
|||||
|
Ardawi (1997)109 |
40 Pregnant women 280 Non-pregnant women |
6 wks |
25(OH)D^ Pregnant women: 1st trimester: 54 (10) 2nd trimester: NR 3rd trimester: 33 (8) term: 35 (11) 6 wks postpartum: 33 (8) |
iPTH (IRMA) |
Serum 25(OH)D declined significantly from 1st to 3rd trimester and remained low through 6 wks postpartum. No values were < 20 nmol/L. |
|
Saudia Arabia |
|
|
|
||
|
|
NR |
|
|
|
|
|
Public |
|
|
|
PTH (pregnant women): Serum 25(OH)D levels correlated negatively with serum iPTH (r=-0.62, p <0.001); 1st trimester: 1.31 (0.25) 2nd trimester: 2.26 (0.39) term: 1.86 (0.87); 6 wks postpartum: significant increase compared to pregnancy values (~ 3.5, graph only, exact value NR) |
|
|
|
NR |
|
|
||
|
|
Pregnant women 26.8 (5.8) y; non-pregnant women 27.8 (5.3) y |
|
|
|
|
|
|
|
CPBA |
|
||
|
|
Arab |
|
|
|
|
|
|
|
|
|
|
Serum 25(OH)D in pregnancy correlated positively with 1,25-(OH)2D (r=0.52, p < 0.001), serum PTH-related peptide (r =0.51, p < 0.001), serum Ca (r=0.23, p < 0.001), serum Mg (r=0.62, p < 0.01) |
|
Author (year) Country, Funding |
Population, N Attrition Mean age Ethnicity |
Duration |
Serum 25(OH)D mean (SD) (nmol/L) Assay |
Bone Health Outcomes |
Results |
|
Morley (2006)110 |
475 Pregnant women recruited at < 16 wks gestation from antenatal clinic Unclear if recruitment was consecutive |
NA |
25(OH)D^ geometric mean at recruitment: In summer: 62.6 In winter: 49.2, p < 0.001 |
PTH (chemiluminescent enzyme-labelled immunometric assay) |
After adjustment for seasonal variation, increase in 25(OH)D concentrations between early and late pregnancy: gemometric mean ratio 1.06, 95% CI 1.02, 1.10, p = 0.004 |
|
Australia |
|
|
|||
|
|
|
|
Infant linear growth (head, mid-arm, calf circumference) Knee-heel length |
|
|
|
Public |
|
% < 28 nmol/L: In summer: 0.8% In winter: 9.4%, p < 0.001 |
|
||
|
|
|
|
|
No association between maternal 25(OH)D and PTH levels at recruitment (11 wks gestation) |
|
|
|
21% attrition |
|
|
||
|
|
29.3 (6.4) y |
|
At 28 – 32 wks gestation: In summer: 48.3 In winter: 68.9, p < 0.001 |
|
|
|
|
|
|
|
Positive association between maternal PTH and measures of infant size (to knee-heel length, birth weight) independent of 25(OH)D status. |
|
|
|
98.6% Caucasian (excluded those thought to be at high risk for deficiency including dark skinned individuals) 105 White, 7 Asian American, 3 African American |
|
|
||
|
|
|
% < 28 nmol/L In summer: 3.7% In winter: 10.0%, p = 0.02 |
|
||
|
|
|
|
Mothers with serum 25(OH)D < 28 nmol/L, at 28-32 wk gestation, had babies with: shorter (−0.7 wk) gestation length, and knee heel length (−2.7mm) after adjustment for gestation length, and lower birth weight (−157 g) than those with 25(OH)D ≥28 nmol/L |
||
|
|
|
RIA |
|
|
Author (year) Country Funding |
Population, N Attrition Mean age Ethnicity |
Duration |
Serum 25(OH)D mean (SD) (nmol/L) Assay |
Bone Health Outcomes |
Results |
|
Sowers (1998)108 |
115 Women in third trimester, with a parity of 0 – 1, recruited on basis of intent to breastfeed or formula-feed exclusively. |
18 mo |
25(OH)D^ postpartum stages: 2 wks 40.3 (11.3) 2 mo 30.1 (7.5) 4 mo 37.4(10.5) 6 mo 33.6 (10.4) 12 mo 29.5 (8.4) 18 mo 27.0 (7.3) |
BMD: FN and LS (DXA-Lunar) |
25(OH)D concentration was not predictive of changes in FN or LS BMD or bone turnover markers. |
|
U.S. |
|
PTH (midmolecule, RIA) |
|
||
|
|
|
|
Pattern of decline in 25 (OH)D concentration over 18 mo period was independent of lactation status |
||
|
Public |
|
|
|||
|
|
2 wks: N = 115; 18 mos: N = 71 |
|
|
|
PTH, 25(OH)D and 1,25-(OH)2D had no association with prolactin or PTH-related peptide and did not differ by lactation practice. |
|
|
|
|
RIA |
|
|
|
|
Mean age: 29.3 (20-40) y |
|
|
|
|
|
|
91% Caucasian; 6% Asian American; 3% African American |
|
|
|
|
|
Author (year) Country, Funding |
Population, N Attrition Mean age Ethnicity |
Duration |
25(OH)D nmol/L Assay |
Bone Health Outcomes |
Results |
|
Before-After Studies |
|||||
|
Datta (2002)111 |
160 Consecutive ethnic minority pregnant women in the U.K. recruited at first antenatal visit; those identified as vit D def (serum 25(OH)D < 20 nmol/L) were treated with vit D 800 IU/d and followed to delivery |
Early pregnancy to delivery |
25(OH)D^ 80/160 (50%) had 25(OH)D < 20 nmol/L |
PTH levels provided for vit D def women only |
At baseline, 65 of 80 (81%) women with serum 25(OH)D < 20 nmol/L had normal PTH (< 5.6 pmol/L) |
|
Wales |
|
||||
|
Funding NR |
|
Reported for vit D def women only: Recruitment: 14.5 (2.3) End of study (with treatment): 28.1(15.9) |
|
35/58 (60%) re-tested at delivery had 25(OH)D within normal range |
|
|
|
|
|
At delivery, mean serum 25(OH)D increased from 15 to 27.5 nmol/L, but mean PTH level remained the same |
||
|
|
|
Vit D status at delivery in those treated with supplements reported for 58/80 |
|
||
|
|
|
|
serum PTH mean (SD) pmol/L: at recruitment: 3.69 (2.78) pmol/L end of study (post treatment): 4.06 (3.17), NS |
||
|
|
Attrition: 58/80 (73%) vit D def women had post treatment (post delivery) assessment |
|
|
||
|
|
|
RIA |
|
Compliance with vit D not measured |
|
|
|
Mean age NR |
|
|
|
|
|
|
African (N = 36), Afro-Caribbean (N = 4), Indian (N = 100), Middle Eastern (N = 9), Far Eastern (N = 11) |
|
|
|
|
|
^ total 25(OH)D or either isoform of 25(OH)D (isoform not specified); def, deficient or deficiency; IRMA, immunoradiometric assay; IU, international units; Mg, magnesium; NR, not reported; PTH, parathyroid hormone; RIA, radioimmunoassay; SD, standard deviation; vit, vitamin; wk. weeks; y, year; |
|||||
Question 1C. Are Specific Circulating Concentrations of 25 Hydroxyvitamin D [25(OH)D] Associated With Bone Health Outcomes in Postmenopausal Women and Elderly Men?
Overview of Relevant Studies
This section summarizes the evidence from the studies that investigated the association between serum 25(OH)D concentrations and bone health outcomes in postmenopausal women and/or elderly men. The discussion focuses on observational studies and only the few (vitamin D supplementation) RCTs that specifically investigated the association of serum 25(OH)D with one or more bone health outcomes are discussed. The majority of RCT data are presented in Question 3. Tables 5-8 summarize the studies included in this section, including the vitamin D assays used.
For the prospective cohorts, assessment of study quality was based on a number of factors including how representative the cohort was, the method of ascertainment of the outcome, whether key confounders were adjusted for in the analysis, the adequacy of followup, size of the study and whether the main objective was to evaluate the association between serum 25(OH)D and bone health outcomes. For the case-control studies, study quality was evaluated based on whether methods were used to minimize sample bias: for example, similar sampling of cases and controls, matching on relevant variables and the use of population based controls or more than one control group.
Study characteristics. A total of 41 studies (42 records) evaluated the association between serum 25(OH)D concentrations and bone health outcomes in postmenopausal women and elderly men. Of these 41 studies, 10 were RCTs,112-121 14 were single prospective cohorts,122-135 and 17 were case-control studies (18 records).29,136-152 One publication was companion paper,146,147 and we refer to the primary record with the most relevant data in the results.146 Study characteristics such as population, sample size, duration of followup, country, and 25(OH)D assays are summarized in Tables 6-8.
Variability in the measurement and reporting of serum 25(OH)D and bone health outcomes, along with differences in populations precluded formal meta-analysis. The results are reported by bone health outcome: fractures, bone mineral density (BMD), falls and performance measures.
Association with Fractures
Study characteristics. Fifteen studies reported on the relation between serum 25(OH)D and fractures. Of the 15 studies, three were single prospective cohort studies130,131,133 and 12 case-control studies (Table 6).29,137,139,141,142,144-146,148-151
Population characteristics. Two cohorts included females only131,133 and one cohort130 included both genders. Six case-control studies included females,29,137,139,142,145,148 one included males only,150 four included both genders,141,144,146,151 and one study did not specify the gender.149
Fracture outcomes and ascertainment. Gerdem included low-trauma fractures (hip, wrist, humerus, vertebral) identified in followup interviews with participants and from a hospital x-ray database.131 Cummings included x-ray-confirmed hip and vertebral fractures133 and Woo included osteoporotic fractures (hip, wrist and vertebral) that were validated with hospital records or death certificates.130 All case-control studies involved hip fracture cases.
Cohorts. The study quality of the cohorts ranged from poor130 to good.133 Losses to followup ranged from 6 to 34 percent. Two studies reported adjusting for weight and one also adjusted for BMD, age and use of estrogen and self-rated health.133 Duration of followup ranged from 30 months to a maximum of 5.9 years.
Woo et al. (1990), followed 427 independently living elderly Chinese subjects (mean age 69 years for men and 70 years for women) for 2.5 years to determine which biochemical variables predicted fractures. A relative risk of fractures for subjects with lower serum 25(OH)D levels (<79 nmol/L in males and < 65.5 nmol/L in females) was reported but the confidence intervals were wide and the result was not significant (RR 3.42, 95% CI, 0.79-14.9). The study had a number of limitations, including a high loss to followup (34 percent), a low event rate (only nine subjects had fractures) and a lack of adjustment for confounders such as BMD and age (although adjustment was made for alcohol intake, smoking and BMI).130
Gerdhem et al. (2005) evaluated the association between 25(OH)D and fractures in a three year prospective cohort of 1044 ambulatory women in Sweden. The mean 25(OH)D level was 95 ± 30 nmol/L. Only 4.4 percent of subjects had a serum 25(OH)D level below 50 nmol/L. Of the cohort, 119/986 (12 percent) sustained a low-trauma fracture (159 fractures). Nine out of the 43 women (21 percent) who had 25(OH)D levels below 50 nmol/L had at least one fracture versus 110 of 943 (12 percent) women with levels above 50 nmol/L, representing a two fold increased risk of fracture (HR 2.04, 95% CI 1.04-4.04). Women with serum 25(OH)D levels below 75 nmol/L had a hazard ratio of 1.01, (95% CI 0.71-1.61). When women who took vitamin D supplements were excluded from the analysis, those with a 25(OH)D level < 50 nmol/L had a hazard ratio of 1.99 (95% CI 0.97-4.0). It was unclear if relevant confounders were adjusted for.131
Cummings et al. (1998) in a prospective cohort of 9,704 Caucasian community-dwelling women age 65 years and older evaluated risk factors for hip and vertebral fractures.133 Women were followed for a maximum of 5.9 years, and a random sample was selected from the subset of the original cohort who experienced fractures (N = 133 hip and 138 vertebral fracture cases). Controls were randomly selected from the same cohort (case-cohort) and logistic regression and proportional hazards analysis were used to evaluate predictors. Variables adjusted for included age, weight, BMD, season, and use of vitamin D supplements. Twenty-two percent of subjects had 25(OH)D levels below 47.5 nmol/L. The authors did not report a significant association (adjusted for age and weight) between serum 25(OH)D concentrations and risk of hip (RR 1.2, 95% CI 0.7-1.9) or vertebral fractures (RR 1.1, 95% CI 0.6-1.8) in those with serum 25(OH)D concentrations <47.5 nmol/L. They did report an association between lower serum 1,25-(OH)2D3 levels and risk of hip fractures but not vertebral fractures.
Case-controls. All 12 case-control studies reported cases of hip fractures (radiographically confirmed).29,137,139,141,142,144-146,148-151
Nine case-control studies matched cases and controls on age.29,137,139,141,142,145,147,148,150 Four studies matched cases and controls on gender and postmenopausal status.29,137,139,140 Two case
control studies did not provide details on matching.149,151 None of the studies matched cases and controls on BMD. A limitation of case-control studies in the evaluation of the association with fractures is that measurement of serum 25(OH)D concentrations are made after the hip fracture has occurred and can be affected by hospitalization, trauma or treatment. Two studies included both hospitalized and community controls.141,150
Ten of twelve case-control studies found significantly lower 25(OH)D levels in hip fracture patients compared to controls.29,139,141,142,144-146,148,150,151 Three case-control studies adjusted for relevant covariates in their analysis, but this did not alter the difference in serum 25(OH)D between cases and controls.29,142,146 Cooper, however, reported that there was no residual difference in serum 25(OH)D between cases and controls after adjusting for age and albumin (Table 6).145
Diamond et al. performed a multiple regression analysis to determine the predictors of hip fractures in men (e.g., age, weight, comorbidity, 25(OH)D levels, free testosterone) and found that a serum 25(OH)D concentration < 50 nmol/L was the strongest predictor of hip fracture (regression coefficient 0.34 +/− 0.19, p = 0.013).150
Two case-control studies did not find a significant difference in serum 25(OH)D concentrations between hip fracture cases and controls.137,149 In one of these studies, there was no mention if the controls and cases were matched by age.149
|
Summary. Serum 25(OH)D levels and fractures in postmenopausal women and older men Quantity: Fifteen studies (three prospective cohorts and twelve case-controls) reported on the association between serum 25(OH)D and fractures. Quality: The quality of the prospective cohorts and case-controls ranged from poor to good. Consistency: One of three cohorts reported an inverse association between serum 25(OH)D and fractures, and nine of twelve case-control studies found lower 25(OH)D concentrations in cases versus controls. Differences in results may be attributed to whether or not all relevant confounders were controlled for and differences in baseline serum 25(OH)D status. Based on the above studies, the level of evidence for an association between serum 25(OH)D and fractures is inconsistent. |
Association with Falls
Study characteristics. The relation between serum 25(OH)D and falls was reported in one RCT,114 three prospective cohorts,122,123,134 and one case-control study.138
Population characteristics. The RCT included elderly women in long-term geriatric care facilities.114 Two prospective cohorts included institutionalized elderly men and women,122,123 and one included older community-dwelling women.134 The case-control study included both elderly men and women living in nursing homes or hostels (intermediate-care facilities).138
Fall outcomes – definition and ascertainment. Falls were defined as “an event resulting in a person inadvertently coming to rest on the ground” in the RCT114 and in one cohort.123 Another cohort defined falls as “landing on the ground or falling and hitting an object like a table”134 and the third cohort did not provide a definition for falls or the method of ascertainment.122 Falls were ascertained by the staff completing regular fall diaries in two studies.123,134 In the case-control study, falls were retrospectively evaluated by nursing staff using a rating scale.138
RCTs. One RCT by Bischoff, with a Jadad quality score of 3/5, evaluated the effect of vitamin D3 on falls in elderly residents in long-term care.114 Fifty percent of the participants were vitamin D deficient (< 30nmol/L). Bischoff reported a significant inverse association between serum 25(OH)D and falls.
Prospective cohorts. All three cohorts were representative and adjusted for one or more relevant covariates (age, cognitive status, illness severity) in the analysis.122,123,134 Losses to followup were small in all cohorts and overall study quality of the cohorts was good. The proportion of participants who were vitamin D deficient (investigator-defined) varied from 2.6 percent (<25 nmol/L) in one,134 to 22-45 percent (< 25 nmol/L) in another,123 and 64-74 percent in the third cohort (<39 nmol/L).122
Sambrook et al. (2004) explored the relation between serum 25(OH)D, PTH and falls in 646 elderly ambulatory elderly institutionalized males and females (mean age 85-86.6 yrs). Serum 25(OH)D and PTH were significant predictors of time to first fall. However, after adjusting for age, incontinence and illness severity, serum 25(OH)D did not remain a predictor [adjusted HR, 0.99 (95% CI 0.98-1.00), p=0.06]. Participants were divided into four groups based on serum 25(OH)D and PTH concentrations: group 1, 25(OH)D < 39 nmol/L and PTH > 66 pg/ml; group 2, 25(OH)D < 39 nmol/L and PTH < 66 pg/ml; group 3, 25(OH)D > 39 nmol/L and PTH > 66 pg/ml and; group 4, 25(OH)D > 39 nmol/L and PTH < 66 pg/ml. Survival analysis found that subjects in group 1 were 1.65 times more likely to fall than those in group 4, after adjusting for age, incontinence and illness severity [HR 1.65 (95% CI 1.10-2.46), p=0.02].122
Flicker (2003), in a cohort of 1,619 older individuals in residential care (mean age 83.7 years), examined the association between serum 25(OH)D and fall risk (adjusted for weight, cognitive status, psychotropic drug use, prior wrist fracture and wandering behavior, but not functional status). The log serum 25(OH)D remained an independent predictor of time to first fall [HR 0.74 ( 95% CI 0.59-0.94), p=0.01] and was consistent with a 20 percent lower risk of falls with a doubling of serum 25(OH)D.123
Faulkner et al. (2006),134 in a secondary analysis of a sample of women (median age 70 years) with falls (N = 389) who were randomly selected from a cohort of 9,526 community-dwelling older women, evaluated the relation between serum concentrations of vitamin D metabolites and fall rates. Although there was a trend of higher 25(OH)D3 concentrations with weaker grip strength, in multivariate models after adjustments for age, height, BMI, season, activity, self-rated health and other variables, serum 25(OH)D3 concentrations were not associated with increased falls.
Stein et al. in a case-control study of 83 vitamin D deficient subjects (33 fallers and 50 non-fallers) who were residents of nursing homes or hostels, examined whether falls were associated with serum 25(OH)D and PTH concentrations. Cases and controls were matched on age, setting and level of independence. Falls were scored after serum 25(OH)D measurements. The study
quality was fair. Stein found that serum 25(OH)D was significantly lower in fallers versus non-fallers (p = 0.02). Multiple logistic regression analysis revealed that predictors of falls included: walking unaided, hostel residence and serum PTH. Neither serum 25(OH)D or 1,25-(OH) 2D were independent predictors for falls, after adjustment for PTH concentrations.138
|
Summary. Serum 25(OH)D levels and falls in postmenopausal women and older men Quantity: Five studies (one RCT, three cohorts and one case-control) evaluated the association between serum 25(OH)D concentrations and falls. The one RCT, two of the three cohorts and one case-control study found an inverse association between serum 25(OH)D and a risk of falls. In one cohort with a low percentage of vitamin D deficient participants, the association did not persist after adjustment for age and illness severity. Another cohort did not observe an association between serum 25(OH)D and falls, and one case-control study did not find an association after adjusting for serum PTH. Quality: The RCT and three prospective cohorts were of good quality and the case-control study was of fair quality. Consistency: There is fair evidence of an association between lower serum 25(OH)D concentrations and an increased risk of falls in institutionalized elderly. PTH may be an important confounder. One study suggested a specific serum 25(OH)D concentration of 39 nmol/L, below which fall risk is increased. |
Association with Performance Measures
Study characteristics. The relation between 25(OH)D and performance measures was examined in seven studies including three randomized trials,112,113,115 and four prospective cohort studies.124,125,131,134 Multiple performance measures were evaluated as outlined in Table 7.
RCTs. Three RCTs reported on the relation between 25(OH)D concentrations and performance measures including the Physical Activity Scale for the Elderly (PASE),113 postural sway and quadriceps strength,115 and muscle strength and activities of daily living.112 The study quality ranged from 3/5 to 5/5 on the Jadad scale and sample sizes ranged from 65 to 139. Corless did not find an association between the change in serum 25(OH)D concentrations and change in muscle strength or independence indices. However, two RCTs did find an association between baseline serum 25(OH)D and performance measures: PASE, single leg stance and aggregate functional performance.113,115
Prospective cohorts. The study quality of the cohort studies ranged from fair (three of the four) to good. Losses to followup were over 30 percent in two cohorts.124,125
Gender was 100 percent female in three cohorts and the remaining cohort included both males and females.124 Three cohorts adjusted for age, body mass index, chronic disease,124,125,134 serum creatinine,124 and two adjusted for the effect of seasonal variation, activity or baseline strength assessments.101,125
Four cohorts124,125,131,134 examined the relation between serum 25(OH)D and various performance measures. Visser et al. (2003) assessed whether low serum 25(OH)D and high serum PTH concentrations were associated with a loss of muscle strength in a cohort of 1,509 older individuals. Followup data were available on 1,008 participants and 9.6 percent were vitamin D deficient and 3.8 percent had secondary hyperparathyroidism (> 7 pmol/L). Participants with low serum 25(OH)D levels (< 25 nmol/L) compared to those with levels (> 50 nmol/L were more likely to experience loss of grip strength and appendicular skeletal muscle mass (ASMM), even after adjusting for sex, age, BMI, physical activity level, chronic disease, creatinine, season and smoking, [adjusted OR 2.57 (95% CI 1.40-4.70); p<0.05 and OR 2.14 (95% CI 0.73-6.33); p = 0.09, respectively]. Participants in the highest tertile of PTH (> 4.0 pmol/L) were 1.71 times more likely to experience loss of grip strength and ASMM. The high loss to followup in this study (33 percent of the 501 participants) may have affected the association, as those lost to followup were more likely to have poorer health status.124
Gerdhem et al. (2005), in a prospective cohort of 1,044 ambulatory women, found that serum 25(OH)D concentrations correlated with gait speed (r = 0.17, p<0.001), Romberg’s balance test (r = 0.14, p<0.001), and activity level (r=0.15, p<0.001). In a multiple regression analysis, however, only 5 percent of the variability in serum 25(OH)D was explained by fall and anthropometric variables. The authors suggested a threshold level between serum 25(OH)D concentration and physical activity exists at 87.5 nmol/L.131
Verreault et al. (2002) in a three year cohort of 1,002 community-dwelling elderly (mean age 75 yrs) found the annual rate of decline in strength, walking speed and time to perform repeated chair stands was similar across baseline serum 25(OH)D tertiles: (deficient < 25 nmol/L, low normal: 25-52 nmol/L and high normal > 53 nmol/L), after adjusting for age, race, education, BMI, seasonal variation and presence of chronic conditions. Adjusted rates of decline in performance, except grip strength, were not associated with baseline PTH. This cohort included women who were moderately to severely disabled so participants may have been below a functional level where vitamin D deficiency might have had an additional impact. There was high loss to followup in this study (37 percent).125
Faulkner (2006), in the cohort of 389 women described above, reported that serum 25(OH)D3 concentrations were not associated with changes in neuromuscular function, including grip strength, balance and chair stand time in an age, BMD and height-adjusted multivariate models.134
|
Summary. Serum 25(OH)D levels and performance measures in postmenopausal women and older men Quantity: Seven studies (three RCTs and four cohorts) assessed the relation between 25(OH)D and performance related measures. Quality: The overall quality of the evidence from RCTs and cohorts was fair to good. Consistency: Two RCTs and two cohorts reported an association between 25(OH)D and performance measures. Two cohorts and one RCT did not find association between 25(OH)D and performance measures. Overall, there is inconsistent evidence for an association of serum 25(OH)D concentrations with performance measures. In studies that did report an association, specific concentrations below which declines in performance measures were increased ranged from 50 to 87 nmol/L. |
Association with Bone Mineral Density
Study characteristics. Nineteen studies evaluated the association between serum 25(OH)D and bone mineral density. Of these, six were RCTs,116-121 seven single prospective cohorts,126-129,131,132,135 and six case-control studies.136,139-141,143,152
Population characteristics. All RCTs included postmenopausal women.116-121 Four cohorts included females only128,129,131,135 and three included both genders.126,127,132 Three case-control studies included females only,139,140,143 two included both genders,136,153 and one included 100 percent males.152
Bone density measurement. The BMD sites assessed in each study are in Table 8. Types of bone densitometry included dual photon absorptiometry (DPA) or dual energy-x-ray absorptiometry) (DXA) (Hologic or Lunar manufacturer).
RCTs. The study quality of the six RCTs116-121 ranged from 2/5 to 5/5 on the Jadad score with five trials having a score of ≥ 3/5.116,117,119-121 Only one RCT reported an association between baseline 25(OH)D levels and change in BMD.119
Prospective Cohorts. Four of the seven cohorts adjusted for either BMI or weight, which is an important confounder of the association with BMD126,128,129,132 and three cohorts adjusted for age.128,129,132 Only two cohorts adjusted for physical activity, calcium use, smoking status or levels of other hormones.128,132 The study quality of the prospective cohorts ranged from fair to good.
Three cohorts evaluated the relation between serum 25(OH)D levels and BMD,127,131,132 and five examined the relation between 25(OH)D levels and changes in BMD.126-129,135
Of the seven cohorts, four reported an association between serum 25(OH)D and femoral neck BMD,126,128,129,132 and one found a positive association between change in 25(OH)D and lumbar spine, but not femoral neck, BMD.135
Stone et al. in a cohort of 231 older Caucasian women (mean age 65.5 years), found that women in the highest quartile of serum 25(OH)D (≥ 80 nmol/L) had a mean annual loss in total hip BMD of −0.1 percent (95% CI −0.5, 0.3) compared to −0.7 percent (95% CI −1.1, −0.4) in the lower quartile (< 52.5 nmol/L). The association remained significant after adjusting for age, weight, season, use of calcium, multivitamins, serum estradiol and other hormones. Serum PTH and 1,25-(OH)2 D were not significantly associated with hip bone loss. There was no association between serum 25(OH)D levels and calcaneal BMD after adjusting for age and weight.128
In a cohort of older men and women (mean age 74 years, 228/327 with complete data) from the Framingham study with knee osteoarthritis, Bischoff-Ferrari reported a positive association between 25(OH)D and BMD of the femoral neck that was independent of age, gender, BMI, disease severity and physical activity.132 Fifteen percent of the cohort were classified as vitamin D deficient (<40 nmol/L), and 51 percent had levels between 40-80 nmol/L. Individuals in the 40-80 nmol/L group had a 7.3 percent higher BMD than those in the deficient group and individuals in the > 80 nmol/L group had an 8.5 percent higher BMD than the deficient group. In a subgroup analysis, the relationship was similar in both genders but most pronounced in men.132
Two small cohorts found a positive association between serum 25(OH)D and BMD of the femoral neck..126,129 Del Puente et al. (2002) investigated the relation between serological
markers and change in BMD in 139 healthy premenopausal and postmenopausal women (mean age 58 years).129 They reported that serum 25(OH)D was an independent predictor of change in femoral neck BMD and lumbar spine. However, in stepwise analysis discrimination models, only the association with femoral neck remained significant (r2 = 0.26).129
Melin et al. (2001) examined the relation between serum 25(OH)D, PTH and femoral neck BMD in 64 community-dwelling older individuals (mean age 83.7 years) and found that femoral neck Z-score was associated with serum 25(OH)D after both summer (r = 0.38, p = 0.003) and winter (r = 0.37, p = 0.003). In a multiple regression analysis with Z-score as the dependent variable and 25(OH)D and BMI as independent variables, only 25(OH)D remained a significant predictor of BMD after winter (adjusted r2 = 0.14, p=0.005).126
A small cohort study of eighteen healthy older women (mean age 77 years) reported an association between serum 25(OH)D and lumbar spine bone mineral density.135 Rosen noted that differences in serum 25(OH)D between the first and second winter were associated with bone loss at the lumbar spine (r = 0.59, p = 0.04) but not at femoral neck, supporting the hypothesis that seasonal changes in serum 25(OH)D influence the rate of annual bone loss in postmenopausal women.135
Dennison et al. did not find an association between baseline serum 25(OH)D and BMD or bone loss at either proximal femur or lumbar spine in 316 healthy, active older individuals (mean age 66 years), after adjusting for adiposity. Limitations of this study included a change in densitometer model between the baseline and followup assessment and lack of adjustment for season of data collection or vitamin D intake.127
Case-control studies. Five out of six studies matched cases and controls on age136,139-141,143 and three studies matched on gender and postmenopausal status.139,140,143 None of the studies adjusted for weight or BMI in analyses.
Of the six case-control studies that evaluated the relation between 25(OH)D and BMD, one reported a weak association between 25(OH)D and BMC of the femoral neck (r = 0.054 p = 0.05).136 Two case-control studies reported significantly lower 25(OH)D levels in women with osteoporosis.140,143 Boonen reported that both serum 25(OH)D3 and PTH were highly predictive of femoral neck BMD (r2 = 32 percent, p<0.001).139 Thiebaud reported that femoral neck BMD was weakly correlated with 25(OH)D concentrations and the only significant association was with trochanteric BMD.141 Villareal reported that lumbar spine BMD correlated with serum 25(OH)D (r = 0.41, p < 0.01) in participants with low 25(OH)D levels (< 38 nmol/L). However, multivariate analysis revealed that iPTH was the main determinant of the decrease in spine BMD.143 Al-Oanzi conducted a study in men and did not find a significant difference in serum 25(OH)D between those with osteoporosis (T score ≤ 2.5) versus those without.152
|
Summary. Serum 25(OH)D levels and bone mineral density Quantity: Nineteen studies assessed the association between 25(OH)D and bone mineral density. Five RCTs, and three cohort studies did not find an association between serum 25(OH)D levels and BMD or bone loss. Four cohorts found a significant association between 25(OH)D and bone loss, which was most evident at the hip sites and evidence for an association between 25(OH)D and lumbar spine BMD was weak. Six case-control studies suggested an association between 25(OH)D and BMD and the association was most consistent at the femoral neck BMD. In some studies, it was unclear whether the effect of serum 25(OH)D on bone loss was mediated by serum PTH. Quality: The overall quality of studies varied from fair to good. Consistency: There was discordance between the results from RCTs and the majority of observational studies that may be due to the inability of observational studies to control for all relevant confounders. Based on results of the observational studies, there is fair evidence to support an association between serum 25(OH)D and BMD or changes in BMD at the femoral neck. Specific circulating concentrations of 25(OH)D below which bone loss at the hip was increased, ranged from 30-80 nmol/L. |
Table 5. Studies Reporting Serum 25(OH)D Levels and Bone Health Outcomes in Postmenopausal Women and Older Men
|
Outcome (N studies) |
Study Design |
Associations |
|
Fractures (N=15) |
RCTs=0 Cohorts=3 Case-controls=12 |
Association: 1 cohort131 9 case-controls29,139,141,142,144,146,148,150,151 |
|
|
|
No Association: 2 cohorts130,133 3 case-controls137,145,149 |
|
Falls (N=5) |
RCTs=1 Cohorts=3 Case-controls=1 |
Association: 1 RCT114 1 cohort123 1 case-control138 |
|
|
|
No Association: 2 cohorts122,134 |
|
BMD/BMC (N=19) |
RCTs=6 Cohorts=7 Case-controls=6 |
Association: 1 RCT119 4 cohorts: FN BMD126,128,129,132; 1 cohort LS BMD135 6 case-controls: FN BMC136; FN, Tr and TH BMD139,141 LS BMD140,143,152 |
|
|
|
No Association: 5 RCTs116-118,120,121 3 cohorts: FN BMD135; proximal femur, LS BMD127; FN, LS BMD131 |
|
Performance measures (N=7) |
RCTs=3 Cohorts=4 |
Association: 2 cohorts124,131 2 RCTs113,115 |
|
|
|
No Association: 2 cohorts125,134 1 RCT112 |
|
BMC, bone mineral content; BMD, bone mineral density; FN, femoral neck; LS, lumbar spine; RCTs, randomized controlled trials; TH, total hip; Tr, trochanter |
||
Table 6. Serum 25(OH)D Levels and Fractures in Postmenopausal Women and Older Men
|
Author (year) Country Funding |
Population, N Gender Mean age (SD) Ethnicity |
Duration |
25(OH)D Mean (SD) nmol/L Assay |
Bone Health Outcomes |
Covariates Summary of Results |
|
Prospective Cohorts |
|||||
|
Cummings (2006)133 |
Subset of a cohort of 9704 ambulatory community-dwelling women ≥ 65 years of age (nested case-control study) |
5.9 y |
25(OH)D^ |
Hip fractures |
Adjusted for age, weight and calcaneal BMD (SPA) |
|
|
|
22% in the subset had serum 25(OH)D ≤47.5 nmol/L |
vertebral fractures |
|
|
|
US |
|
There were no statistically significant unadjusted or adjusted (age, weight, season, use of vit D supplements) association between serum 25(OH)D or PTH and the risk of hip or vertebral fracture. |
|||
|
Public |
Groups analyzed: Of the 332 women in the cohort who had hip fractures, 133 were randomly selected; Of the 389 women who had new vertebral fractures in the cohort, 138 were randomly selected; 359 ctrls were randomly selected; of these, 343 served as ctrls for hip fracture cases and 264 served as ctrls for vertebral fractures (based on availability of XRs) |
|
|
|
|
|
|
|
RIA |
BMD calcaneus (SPA) PTH (measured by IRMA) |
||
|
|
|
|
|
For women in the lowest quintile of serum 25(OH)D levels, there was no increased risk for hip or vertebral fracture. |
|
|
|
|
|
|
Women in the lowest quintile of serum 1,25-(OH)2D had a significant increase in hip fracture risk (RR 2.1, 95% CI 1.2-3.5) but not vertebral fracture risk. |
|
|
|
100% female |
|
|
|
|
|
|
72.6 y (subset) |
|
|
|
|
|
|
White |
|
|
|
|
|
Author (year) Country Funding |
Population, N Attrition Gender Mean age (SD) Ethnicity |
Duration |
25(OH)D Mean (SD) nmol/L Assay |
Bone Health Outcomes |
Covariates Summary of Results |
|
Gerdhem (2005)131 |
1,044 Ambulatory independently living women |
3 y |
25(OH)D^ 95 (30) < 50 nmol/L: 4.4% < 75 nmol/L: 26% |
Fractures (low energy) |
119/986 (12%) had a total of 159 low energy fractures (29 hip, 28 wrist, 12 proximal humerus, 43 vertebral and 47 other) |
|
Sweden |
58/1044 (6%) did not complete |
|
|
||
|
Public |
100% female |
|
CPBA |
|
9/43 (21%) with 25(OH)D < 50 nmol/L had one or more fractures vs. 110/943 (12%) with 25(OH)D > 50 nmol/L: HR 2.04 (95% CI, 1.04 - 4.04). |
|
|
75 y (range 75-75.9 y) |
|
|
|
|
|
|
NR |
|
|
|
|
|
|
|
|
|
|
Fracture association was independent of season although a seasonal difference was noted in mean level of 25(OH)D (Sept 101 nmol/L vs. Feb 89.8 nmol/L). |
|
Woo (1990)130 |
427 Elderly ≥ 60 y living independently in sheltered housing. 144/427 (34%) |
30 mo |
25(OH)D^ |
Fractures |
Adjusted for age, gender, drinking, smoking and BMI. |
|
|
|
fracture subset N=9) 63.3 (6.9) no fracture subset 74 (1.15), NS |
|
|
|
|
Hong Kong |
|
|
|
Subjects with lower serum 25(OH)D (males < 79 nmol/L and females < 66 nmol/L) had a nonsignificant increase in adjusted RR for fracture. |
|
|
NR |
60% females |
|
|
|
|
|
|
Women: 70 y Men: 69 y |
|
CPBA |
|
|
|
|
Asian (Chinese) |
|
|
|
|
|
Author (year) Country Funding |
Population, N Gender Mean age (SD) Ethnicity |
Matching Variables |
25(OH)D Mean (SD) nmol/L Assay |
Bone Health Outcomes |
Covariates Summary of Results |
|
Case-Control Studies |
|||||
|
Bakhtiyarova (2006)151 |
64 Hip fracture cases (spontaneous or low trauma) |
NR |
25(OH)D^ |
Hip fractures |
Median serum 25(OH)D levels significantly lower in hip fracture cases vs. ctrls (graph only). |
|
|
|
Cases: 22.4 (11.4) Ctrls: 28.1 (10.1) |
|
||
|
Russia |
97 ctrls admitted to opthamology dept |
|
|
|
|
|
|
|
|
|
Hip fracture patients more likely to have serum 25(OH)D < 25 nmol/L than ctrls (65% vs. 47%, p=0.006). |
|
|
NR |
|
|
25(OH)D <25 nmol/L: Cases: 65%; Ctrls: 47% 25(OH)D<40 nmol/L: Cases 89%; Ctrls 89%; 25(OH)D <50 nmol/L: Cases 100%, Control 98% |
|
|
|
|
Cases: 69% female Ctrls: 55% female |
|
|
|
|
|
|
Cases: 68.8 (9.5) y Ctrls: 70.2 (8.3) y |
|
|
|
|
|
|
White (Caucasion) |
|
CPBA |
|
|
|
Boonen (1997)142 |
117 Elderly women with hip fractures and 117 community-dwelling ctrls |
Age, PM status, gender, ethnicity |
25(OH)D^ |
Hip fractures |
Serum 25(OH)D significantly lower in cases vs. ctrls (p=0.001). |
|
|
Cases 25.25 (22) Ctrls: 53.75 (33.25) |
BMD (FN and Tr) (DXA) |
|
||
|
Belgium |
|
Hip BMD (FN and Tr) significantly lower in cases vs. ctrls (p < 0.001). |
|||
|
|
100% female |
|
|
|
|
|
Public |
|
|
CPBA |
|
|
|
|
Cases: 79.2 y Ctrls: 77.7 y |
|
|
|
|
|
|
White (Caucasion) |
|
|
|
|
|
Author (year) Country Funding |
Population, N Gender Mean age (SD) Ethnicity |
Matching Variables |
25(OH)D Mean (SD) nmol/L Assay |
Bone Health Outcomes |
Covariates Summary of Results |
|
Boonen, (1999)139 |
100 Postmenopausal women 50 osteoporotic hip fracture patients and 50 independently living ctrls |
Age, gender, PM status, sampled at the same time of year |
25(OH)D3 |
Fractures |
Adjusted for age Mean 25(OH)D3 was significantly lower cases vs. ctrls. |
|
|
Cases: 29.3 (26.5) Ctrls: 68.75 (39), p < 0.001 |
BMD (FN and Tr) (DXA) |
|||
|
Belgium |
|
||||
|
|
|
|
25(OH)D < 30 nmol/L: 64% of cases vs. 8% ctrls within the same 4 mo sampling period (no relation b/w 25(OH)D and mo of sample collection). |
||
|
Public |
|
|
PTH (IRMA) |
||
|
|
|
|
CPBA |
|
|
|
|
100% female |
|
|
|
|
|
|
Cases: 74.2 (7.8) y Ctrls: 75.8 (5.6) y |
|
|
|
FN and Tr BMD were significantly lower in cases than ctrls. |
|
|
NR |
|
|
|
No significant relation b/w the 25(OH)D3-PTH axis and BMD when analyzed separately. In multiple regression analyses of pooled data, models using 25(OH)D3 and PTH were predictive of FN BMD (R2=32%, p<0.001). |
|
Cooper (1989)145 |
41 Hip fractures 40 Healthy ctrls (20 inpatient and 20 outpatient) |
Age (cases and one of the two control groups similar), gender |
25(OH)D^ Fracture patients: 23.5 (14.5), Inpatient ctrls: 35.75 (23.5) Outpatient ctrls: 48.5 (25) |
Hip fractures |
Age and albumin |
|
|
PTH (immunoreactive, C-terminal) |
Mean 25(OH)D was significantly lower in cases vs. ctrls (p<0.01). When age and albumin were used as covariates in the analysis, there was no residual difference in serum 25(OH)D levels. |
|||
|
UK |
|||||
|
NR |
100% female |
|
|||
|
|
Cases 77.4 (8.6) y Ctrls 73.3 (10.5) (inpatients), and 66.9 (11.8) y (outpatients) |
|
|
|
|
|
|
|
25(OH)D <20 nmol/L): Cases: 49% vs. Ctrls: 10 – 15% |
|
More hip fracture cases (49%) had 25(OH)D levels <25 nmol/L vs. 15% of inpatient and 10% of outpatient ctrls. |
|
|
|
NR |
|
RIA |
|
|
|
Author (year) Country Funding |
Population, N Gender Mean age (SD) Ethnicity |
Matching Variables |
25(OH)D Mean (SD) nmol/L Assay |
Bone Health Outcomes |
Covariates Summary of Results |
|
Diamond (1998)150 |
41 Men with hip fracture 82 healthy ctrls (41 in-patient and 41 out-patient) |
Age, gender |
25(OH)D^ |
Hip fractures |
Age, body weight, comorbidity score, smoking history, alcohol intake, serum calcium, albumin, 25(OH)D and free testosterone. |
|
|
|
Cases 45.6, range 36.9-52.3 Inpatients ctrls 61.1 (range 50.0-72.2) Outpatients ctrls 65.9 (range 59.0-72.8), p = 0.007 for cases vs. combined ctrls |
|
||
|
Australia |
|
|
|||
|
NR |
100% male |
|
|
Men with hip fractures had significantly lower 25(OH)D levels vs. ctrls (p=0.007). 25(OH) D < 50 nmol/L: 63% of fracture patients vs. 25% of combined ctrls, OR 3.9 (95% CI 1.74 - 8.78). |
|
|
|
Cases: 79.6 y Ctrls: 78.7 y and 77 y |
|
|
||
|
|
NR |
|
|
|
|
|
|
|
|
RIA |
|
|
|
|
|
|
|
|
Multiple regression analysis showed that serum 25(OH)D level < 50 nmol/L was strongest predictor of hip fracture (r = 0.34 (0.19), p=0.013). Age was the best determinant of a serum 25(OH)D level < 50 nmol/L, p=0.028 |
|
Erem (2002)137 |
21 Women with hip fractures and 20 healthy PM women, all independent community-dwellers |
Age, gender, PM status |
25(OH)D^ Cases 26.9 (25.0) Ctrls: 24.9 (20.5) |
Hip fractures |
NR |
|
Turkey |
|
|
Non significant difference in 25(OH)D levels in hip fracture patients vs. ctrls |
||
|
Public |
|
CPBA |
|
||
|
|
|
|
|
|
25 (OH)D levels in all groups < 37.5 nmol/L |
|
|
100% female |
|
|
|
|
|
|
Cases: 76.7 (6.5) y Ctrls: 75.4 (6.3) y |
|
|
|
|
|
|
Far Eastern |
|
|
|
|
|
Author (year) Country Funding |
Population, N Gender Mean age (SD) Ethnicity |
Matching Variables |
25(OH)D Mean (SD) nmol/L Assay |
Bone Health Outcomes |
Covariates Summary of Results |
|
Landin-Wilhelmsen, (1999)140 |
128 PM women with osteoporosis 227ctrls from outpatient clinic |
Age, gender, PM status |
25(OH)D3 Cases: 88 (30) Ctrls: 96 (32) |
Fractures |
NR |
|
|
BMD and BMC: LS, TB and FN (DXA) |
25(OH)D significantly lower in osteoporotic women vs. ctrls (p<0.05); PTH significantly higher in osteoporotic women vs. ctrls (p < 0.001) |
|||
|
Sweden |
|
|
RIA |
|
|
|
|
100% female |
|
|
PTH (IRMA) |
|
|
Public |
|
|
|
|
|
|
|
osteoporotic women: 59 (6) y ctrls: 59 (5) y |
|
|
|
Fracture history in 56% of osteoporotic women vs. 4% of ctrls, p<0.001 |
|
|
|
|
|
|
osteoporotic women had lower body weight and BMI vs. ctrls (p<0.001). |
|
|
NR |
|
|
|
|
|
Lau, (1989)144 |
200 hip fracture patients in hospital and 427 community-living ctrls |
Ethnicity |
25(OH)D^ |
Hip fractures |
NR 25(OH)D levels were significantly lower in cases vs. ctrls (p<0.01). |
|
Hong Kong |
|
Men cases <70 y: 56.3 (18) and 70 y: 46.3 (17.3) Ctrls <70 y: 84.8 (25.5) and 70 y: 80.5 (21.5 |
|
||
|
NR |
NR |
|
|
Hip fracture patients with low 25(OH)D male < 36.5 nmol/L, female, < 34.3 nmol/L, defined by lower limit of 95% CI for ctrls) were less mobile than those with normal 25(OH)D; 33% with low 25(OH)D could walk outdoors without an aid vs. 61% of those with a normal 25(OH)D level. |
|
|
|
Age range: 49-93 y (cases), 60-90 y (ctrls) |
|
|
||
|
|
Asian |
|
|
|
|
|
|
|
|
Women cases <70 y: 44.5 (13.8) and 70 y: 42.8 (15.5) ctrls <70 y: 72.5 (15.5) and 70 y: 65 (17) |
|
|
|
|
|
|
CPBA |
|
|
|
Author (year) Country Funding |
Population, N Gender Mean age (SD) Ethnicity |
Matching Variables |
25(OH)D Mean (SD) nmol/L Assay |
Bone Health Outcomes |
Covariates Summary of Results |
|
LeBoff (1999)29 |
98 community-dwelling women 30 with hip fracture and osteoporosis (OP) (group 1); 68 women admitted for elective joint replacement with (17) or without (51) osteoporosis (group 2) |
Gender, PM status, setting, surgical procedure OP in group 1 and subset of group 2 |
25(OH)D^ median: Group 1: 32.4, Group 2: OP 49.9; non-OP 55.0 |
Hip fractures |
Adjusted for age and estrogen replacement therapy. |
|
U.S. |
BMD: LS, FN, Tr, total body (DXA) |
|
|||
|
|
|
Women with hip fracture and OP had significantly lower 25(OH)D vs. women with OP admitted for surgery (p=0.01) and vs. women without OP admitted for surgery (p=0.02). |
|||
|
Public |
|
||||
|
|
|
RIA |
|
|
|
|
|
|
|
|
% of women with 25(OH)D < 30 nmol/L: Signficantly more in group 1 (50%) vs. OP or non-OP group 2 (graph only ~ 5% for OP and 10% for non-OP) (p < 0.002). |
|
|
|
100% female |
|
|
|
|
|
|
Group 1: 77.9 y Group 2: OP 69.9 y; non-OP 64.4 y |
|
|
|
|
|
Mean BMD (LS, FN, Tr) was significantly less in women with acute hip fracture/OP vs. elective surgery non-OP ctrls. |
|||||
|
|
NR |
|
|
|
|
|
Lips (1983)147 and Lips (1987)146 |
125 consecutive patients with femoral neck fracture and 74 healthy community ctrls |
Age |
25(OH)D^ |
Hip fractures |
Adjusted for age and sex |
|
|
Cases: 18.5 (10.6) Ctrls: 32.9 (13.6) |
|
Serum 25(OH)D levels lower in cases vs. ctrls (p<0.001). |
||
|
The Netherlands |
|
|
|
|
|
|
|
Cases: 67% female Ctrls: 73% female |
|
|
|
|
|
|
|
|
serum 25(OH)D < 20 nmol/L: Cases: 62% Ctrls: 16% |
|
|
|
Public |
|
|
|
|
|
|
|
Cases: 75.9 (11) y Ctrls: 75.6 (4.2) y |
|
|
|
|
|
|
NR |
|
CPBA |
|
|
|
Author (year) Country Funding |
Population, N Gender Mean age (SD) Ethnicity |
Matching Variables |
25(OH)D Mean (SD) nmol/L Assay |
Bone Health Outcomes |
Covariates Summary of Results |
|
Lund (1975)149 |
67 consecutive cases of proximal femur fractures ctrls: milddle aged (30-59 y) N = 27 and elderly healthy individuals (60-95 y) N = 67 at same time of year |
Age |
25(OH)D^ |
Proximal femur fractures |
There was no statistically significant difference in serum 25(OH)D levels vs. either ctrl. |
|
Denmark |
|
range 7.5-195 nmol/L N=12 (18%) <25 nmol/L |
|
||
|
NR |
|
|
|
||
|
|
|
CPBA |
|
|
|
|
|
NR |
|
|
|
|
|
|
NR |
|
|
|
|
|
|
NR |
|
|
|
|
|
Punnonen (1986)148 |
40 cases of hip fracture and 25 ctrls (from gynecological clinic) |
Age, gender, setting |
25(OH)D^ |
Hip fractures (FN) |
NR |
|
|
|
Cases: 18.2 (13.2) Ctrls: 53.3 (24.1) |
|
25(OH)D levels were significantly lower in cases vs. ctrls, (p<0.01). |
|
|
Finland |
|
|
|
|
|
|
|
100% female |
|
|
|
|
|
NR |
|
|
|
|
|
|
|
Cases: 77.1 (8.6) y Ctrls: 73.8 (8.4) y |
|
CPBA |
|
|
|
|
NR |
|
|
|
|
|
Author (year) Country Funding |
Population, N Gender Mean age (SD) Ethnicity |
Matching Variables |
25(OH)D Mean (SD) nmol/L Assay |
Bone Health Outcomes |
Covariates Summary of Results |
|
Thiebaud, (1997)141 |
179 Hip fracture patients; 180 hospital ctrls; 55 community ctrls |
Age, setting (for cases and one control group) |
25(OH)D^ Women: Fracture cases: 25.5 (20.5) Hospital ctrls: 31.5 (26.5) Community ctrls: 53 (23) |
Fractures |
Adjusted for age, sex, and creatinine |
|
|
|
BMD: FN, TH and Tr (DXA) |
Women and men with hip fractures had significantly lower 25(OH)D levels vs. ctrls. Fracture patients had lower hip (TH, FN) BMD vs. either ctrl group (p < 0.001). |
||
|
Switzerland |
|
|
|||
|
|
Cases: 76% female Hospital Ctrls: 75% female Community ctrls: 85% female |
|
|
||
|
Public |
|
|
|
||
|
|
|
|
In multivariate logistic regression of the risk for hip fracture, serum albumin and PTH were significant. In women, BMD was weakly correlated with 25(OH)D and the only significant association was at the Tr (r=0.13, p < 0.05). |
||
|
|
Cases: women 81.0 y; men 77.7 y Hospital ctrls: women 80.9, men 76.9 y Community ctrls: women 71.7 y, men 71.3 y |
|
Men Fracture cases: 17.25(18.5) Hospital ctrls: 27.75 (21.5) Community ctrls: 31.5(22.8) |
|
|
|
|
|
|
RIA |
|
|
|
Note: ^ total 25(OH)D or either isoform of 25(OH)D (isoform not specified); BMC, bone mineral content; BMD, bone mineral density; ctrls, controls; DXA, dual energy X-ray absorptiometry; FN, femoral neck; PM, post menopausal; RIA, radioimmunoassay; SD, standard deviation; SPA, single-photon absorptiometry; TH, total hip; Tr, trochanter; wks, weeks; y years |
|||||
Table 7. Serum 25(OH)D Levels and Falls and/or Performance Measures in Postmenopausal Women and Older Men
|
Author (year) Country Funding |
Population, N Attrition Gender Mean age (SD) Ethnicity |
Intervention Duration |
Serum 25(OH)D Mean (SD) nmol/L Assay |
Bone Health Outcomes |
Covariates Summary of Results |
Jadad AC |
|
RCTs |
||||||
|
Bischoff-Ferrari (2003)114 |
122 Elderly women in long-stay geriatric care |
IG: 800 IU D3 + 1200 mg Calcium carbonate daily CG: 1200 mg Ca daily |
25(OH)D^ Median (IQR): baseline IG1: 30.75 (23-55) CG: 29 (23-55) values < 30 nmo/L: 50%. |
Falls |
Age, height, weight, BMI, number of falls in pre-treatment period, being a faller in the pre-treatment period, prior vit D use, comorbidity index. muscle strength, use of walking aid, baseline 1,25-(OH)2D, 25(OH)D, iPTH, albumin and observation time during treatment |
3 |
|
|
iPTH (RIA) |
Unclear |
||||
|
|
drop outs IG1: 31% CG: 25% |
|
|
|||
|
Switzerland |
|
|
|
|||
|
Public and private |
|
|
|
|||
|
|
100% female |
|
|
|
|
|
|
|
|
12 wks (6 wk pre-treatment) |
End of study IG1: 65.5 (49.75-82.75) CG: 28.5 (24.5-41.5) |
|
Vit D + Ca accounted for 49% reduction in falls (−0.68; 95% CI 14-71%, p=0.01) after adjustment for age, number of falls in pretreatment period, being a faller in pre-treatment period, baseline 1,25-(OH)2D, and 25(OH)D. Predictors other than treatment were being a faller, number of falls in pre-treatment period and age. |
|
|
|
85.3 y range 63-99 |
|
|
|||
|
|
NR |
|
|
|
||
|
|
|
|
RIA |
|
|
|
|
Corless (1985)112 |
82 Elderly hospital patients with serum 25(OH)D < 40 nmol/L |
IG1: 9,000 IU/d D2 CG: placebo |
25(OH)D^ Mean (SEM): |
ADLs: muscle strength and independence index |
NR |
5 |
|
|
|
No significant correlation between change in 25(OH)D and change in muscle strength’ (r=0.12, p>0.3) or independence’ indices (r=0.26, p>0.1). |
Unclear |
|||
|
U.K. |
|
|
Baseline IG1: 16.6 (2.1) CG: 17.6 (2.05) % < 20 nmol/L: IG1: 66% CG: 70% |
|
||
|
|
Drop outs IG1: 9/41 (22.1%), CG: 8/41 (19.5%) |
9 mo |
|
|
||
|
Public |
|
|
|
|
||
|
|
IG1: 78.1% female CG: 78.8 % female |
|
|
|
|
|
|
|
|
|
End of study: graph only (IG1: ~ 110 nmol/L) |
|
|
|
|
|
IG1: 82.3 (6.0) y CG: 82.6 (6.9) y |
|
|
|
|
|
|
|
NR |
|
CPBA |
|
|
|
|
Author (year) Country Funding |
Population, N Attrition Gender Mean age (SD) Ethnicity |
Intervention Duration |
Serum 25(OH)D Mean (SD) (nmol/L) Assay |
Bone Health Outcomes |
Covariates Summary of Results |
Jadad AC |
|
Dhesi, (2004)115 |
139 Ambulatory older adults with a history of falls and 25(OH)D <30 nmol/L |
IG1: 600,000, D2 (injection) CG: placebo |
25(OH)D^ Baseline IG1: 26.8 (25.5-28) CG: 25 (23.8–26.3) |
Falls, postural sway, reaction time, aggregate functional performance time and quadriceps strength |
NR |
5 |
|
|
Significant correlation between 25(OH)D and ∆ aggregate functional performance time in both groups (r=0.19, p=0.03). |
Unclear |
||||
|
U.K. |
|
|
||||
|
|
|
6 mo |
|
|||
|
Public |
Drop outs IG1: 8/70 (11.4%), CG: 8/69 (11.6%) |
|
|
|
||
|
|
|
End of study IG1: 43.8 (41.3-46.3) CG: 31.5 (28.5-34.5) |
|
|
|
|
|
|
IG1: 75.7% female CG: 79.7% female |
|
|
|
|
|
|
|
IG1: 77.0 (6.3) y CG: 76.6 (6.1) y |
|
|
|
|
|
|
|
|
RIA |
|
|
|
|
|
|
Caucasion |
|
|
|
|
|
|
Kenny (2003)113 |
65 Healthy, community-dwelling men with normal 25(OH)D |
IG1: 1,000 IU D3 + 500 mg Ca CG: 500 mg Ca daily |
25(OH)D^ Baseline IG1: 65 (17.5) CG: 60 (17.5) |
Ability to rise from a chair, static balance, 8-foot walk, TUG, timed supine to stand test and PASE questionnaire. |
NR |
4 |
|
|
|
Association between baseline 25(OH)D and single-leg stance time (r=0.245, p<0.05) and PASE Score (r=0.360, p<0.01). |
Adequate |
|||
|
U.S. |
|
|
||||
|
|
IG1: 4/33 (12.1%), CG 1/32 (3.1%) |
|
|
|||
|
Public |
|
End-of-study (graph only) IG1: ~ 83 CG: ~ 50 |
|
|
|
|
|
|
|
6 mo |
|
|
|
|
|
|
100% male |
|
|
|
|
|
|
|
IG1: 77 y CG: 75 y |
|
|
|
|
|
|
|
|
CPBA |
|
|
|
|
|
|
NR |
|
|
|
|
|
|
Author (year) Country Funding |
Population, N Attrition Gender Mean age (SD) Ethnicity |
Duration |
Serum 25(OH)D Mean (SD) nmol/L Assay |
Bone Health Outcomes |
Covariates Summary of Results |
|
Prospective Cohorts |
|||||
|
Faulkner (2006)134 |
9,704 Older community-dwelling women (from the Study of Osteoporotic Fractures), and 389/400 (97.2%) drawn at random entire cohort for serum measures |
4 y |
25(OH)D3 Median (IQR) |
Falls; GS, quadriceps strength, chair-stand time, walking speed, reaction time and balance-walk time measured in subset of 389 |
Adjusted for age, height, BMI, clinical site, season of serum collection, education, ethnicity, physical activity, smoking, alcohol use, housebound status, dietary calcium intake, orthostatic hypotension, stroke, Parkinson’s disease, arthritis, diabetes, osteoporosis, hyperthyroidism, cognitive impairment, visual acuity, self-rated health, use of estrogen, thyroid hormones, calcium supplements, corticosteroids, diuretics, and CNS-active medications. |
|
U.S. |
|
Total cohort: 62.5 (47.5-77.5) Women using vit D supplements (N=4,273): 67.5 (52.5 - 85) Women not using vit D supplements (N=5,253): 55 (42.5-70) |
|||
|
Public |
|
||||
|
|
100% female |
|
|
|
|
|
|
|
|
% < 25 nmol/L Women using vit D supplements: 0.6% Women not using vit D supplements: 4.2% |
|
|
|
|
Median (IQR): 70 (67-75) y |
|
|
||
|
|
|
|
|
There was a trend toward higher 25(OH)D3 concentrations associated with weaker grip strength (p=0.017) vs. women in the first quartile. |
|
|
|
66% Northern European (excluded African Americans) |
|
|
||
|
|
|
RIA |
|
||
|
|
|
|
|
|
25(OH)D3 was not associated with neuromuscular function, ∆ neuromuscular function (grip strength, chair stand time, walking speed and balance walk time) or fall rates. |
|
Author (year) Country Funding |
Population, N Attrition Gender Mean age (SD) Ethnicity |
Duration |
Serum 25(OH)D Mean (SD) nmol/L Assay |
Bone Health Outcomes |
Covariates Summary of Results |
|
Flicker (2003)123 |
1,619 Institutionalized elderly, both low (N=667) and high level care (N=952) |
145 d (low level care) and 168 d (high level care subjects) |
25(OH)D^ Low level care: WA (32°S): 39.3 (20.1) NSW (34°S): 43.7 (22.5) Victoria (38°S) 38.4 (19.6) p<0.05 High level care: WA (32°S): 33 (17.3) NSW (34°S): 32.4 (22.4) Victoria (38°S): 30.7 (19.4) |
Falls |
Adjusted for weight, cognitive status, psychotropic drug use, prior wrist fracture and presence of wandering behavior |
|
Australia |
|
||||
|
Public |
All 1,619 included in analysis |
|
After excluding bed bound residents and adjusting for above covariates, log serum 25(OH)D level was independently associated with time to first fall: adjusted HR 0.74 (95% CI, 0.59-0.94, p=0.01). |
||
|
|
100% female |
|
|
||
|
|
Low level care: 83.7 (8.7) y High level care: 83.7 (9.1) y |
|
|
||
|
|
|
% < 25 nmol/L: Low level care: 22% High level care: 45% |
|
20% reduction in risk of falling with doubling of 25(OH) D level. |
|
|
|
NR |
|
|
|
|
|
|
|
|
RIA |
|
|
|
Gerdhem (2005)131 |
1,044 Ambulatory independently living women |
3 y |
25(OH)D^ 95 (30) < 50 nmol/L: 4.4% < 75 nmol/L: 26% |
Gait speed, Romberg balance test, lower extremity strength |
NR |
|
|
|
25(OH)D correlated with: gait speed r=0.17, p<0.001), Romberg balance test (r=0.14, p<0.001), self-estimated activity level (r=0.15,p<0.001), thigh muscle strength (r=0.08, p=0.02). |
|||
|
Sweden |
|
|
|
||
|
|
58/1,044 (6%) did not complete |
|
|
|
|
|
Public |
|
CPBA |
|
||
|
|
100% female |
|
|
|
|
|
|
|
|
|
|
5% of the variability in 25(OH)D explained by fall-related and anthropometric variables multiple regression). |
|
|
75 (75-75.9) y |
|
|
|
|
|
|
NR |
|
|
|
|
|
Author (year) Country Funding |
Population, N Gender Mean age (SD) Ethnicity |
Duration |
Serum 25(OH)D Mean (SD) nmol/L Assay |
Bone Health Outcomes |
Covariates Summary of Results |
|
Sambrook (2004)122 |
646 Ambulatory residents of institutional care facilities (hostels and nursing homes) > 65 y |
1 y |
25(OH)D^ Fallers: 28.8 (14.2) Non-fallers: 33.2 (16.5) |
Falls |
Adjusted for age, incontinence, illness severity; Interactions between PTH, 25(OH)D and other variables were tested. |
|
Australia |
|
|
|
||
|
% <39 nmol/L: 73.6% Men: 64.5%, Women: 75.8% |
|
||||
|
NR |
|
|
|
After adjusting for age, incontinence and illness severity, serum 25(OH)D was no longer a significant predictor of falls. |
|
|
|
9/646 (1%) did not complete |
|
|
||
|
|
|
|
RIA |
|
|
|
|
Fallers: 84% female Non-fallers: 79% female |
|
|
|
|
|
|
|
|
|
25(OH)D was related to balance. There was a 1.65X increased risk of falls in group with 25(OH)D < 39 nmol/L and PTH > 66 pg/mL compared to those with 25(OH)D > 39 nmol/L and PTH < 66 pg/mL. |
|
|
|
Fallers: 86.6 y (6.5) y Non-fallers: 85.1 (6.4) y |
|
|
|
|
|
|
NR |
|
|
|
|
|
Visser (2003)124 |
1,509 Older individuals from longitudinal study of aging 501/1509 (33%) did not complete |
3 y |
25(OH)D^ NR |
GS and ASMM Sarcopenia defined as a loss of GS > 40%, and ASSM > 3% |
Adjusted for sex, age, BMI, physical activity level, chronic disease, creatinine, season of data collection and smoking. |
|
The Netherlands |
|
< 25 nmol/L: 9.6% <12.5 nmol/L: 1.3% |
|||
|
|
|
|
|
|
Separate analysis adjusted for weight change. Interactions explored between PTH and 25(OH)D |
|
Public |
NR |
|
CPBA |
|
|
|
|
Stable GS: 74.2 (6.1) y Loss of GS: 76.9 y (6.5) Stable ASMM: 73.7 (5.9) y Loss of ASMM: 74.9 (6.4) y |
|
|
|
|
|
|
|
|
|
Individuals with 25(OH)D <25 nmol/L vs. levels >50 nmol/L were more likely to experience loss of GS (adjusted OR 2.57, 95% CI 1.40-4.70, p<0.05); loss of ASMM, NS. |
|
|
|
NR |
|
|
|
|
|
Author (year) Country Funding |
Population, N Attrition Gender Mean age (SD) Ethnicity |
Duration |
Serum 25(OH)D Mean (SD) nmol/L Assay |
Bone Health Outcomes |
Covariates Summary of Results |
|
Verreault (2002)125 |
1,002 Elderly women, ≥ 65 y with moderate to severe disability living in community |
3 y |
25(OH)D^ Mean: 52.9 % <25 nmol/L: 12.4% |
Lower extremity strength, GS, walking speed, repeated chair stands. Disability in activities involving mobility and upper extremity function. |
Adjusted for: baseline performance, age, BMI, comorbidity and other confounders associated with a decline in performance. (Cox proportional hazard model) age, race, education, smoking and baseline BMI, season and presence of comorbidity. |
|
U.S. |
|
||||
|
Public |
374/1002 (37%) |
|
RIA |
||
|
|
100% female |
|
|
No association between low 25(OH) D levels and loss of muscle strength or declines in mobility or disability. Results were similar when 25(OH)D and PTH were both included in the model. |
|
|
|
NR |
|
|
|
|
|
|
NR |
|
|
|
|
|
Author (year) Country Funding |
Population, N Gender Mean age (SD) Ethnicity |
Matching Variables |
Serum 25(OH)D Mean (SD) nmol/L Assay |
Bone Health Outcomes |
Covariates Summary of Results |
|
Case-Control Studies |
|||||
|
Stein (1999)138 |
83 ambulatory nursing home and hostel residents grouped as fallers 33) vs. never fell (50) |
Age, setting, level of independence |
25(OH)D^ Median: Cases: 22 Ctrls: 29 |
Falls |
Adjusted for PTH; interactions sought between weight and gender |
|
Australia |
|
|
Serum 25(OH)D lower in patients who had a fall vs. those who did not (95% CI for difference in medians: 1 - 13 nmol/L, p=0.019). |
||
|
|
|
CPBA |
|
||
|
Public |
|
|
|
|
|
|
|
|
|
|
|
Bivariate OR (95% CI) for falling vs. never falling for Ln 25(OH)D was 0.33 (0.13-0.83). Neither Ln 25(OH)D or 1,25-(OH)2D were independent predictors after adjusting for PTH. |
|
|
66% female |
|
|
|
|
|
|
|
|
|
|
|
|
|
Median age (IQR): 84 (79-89) y |
|
|
|
|
|
|
NR |
|
|
|
|
|
AC, allocation concealment; ADLs, activities of daily living; ASMM, appendicular skeletal muscle mass; BMI, body mass index; CPBA, competitive protein binding assay; CI, confidence interval; ctrls, controls; GS, grip strength; IQR, interquartile range; NS, not significant; OR, odds ratio; PTH, parathyroid hormone; RIA, radioimmunoassay; SD, standard deviation; y, years |
|||||
Table 8. Serum 25(OH)D Levels and BMD/BMC in Postmenopausal Women and Older Men
|
Author (year) Country Funding |
Population, N Attrition Gender Mean age (SD) Ethnicity |
Intervention Duration |
Serum 25(OH)D Mean (SD) nmol/L Assay |
Bone Health Outcomes |
Covariates Summary of Results |
Jadad AC |
|
RCTs |
||||||
|
Aloia (2005)117 |
208 Post menopausal women |
IG: 800 IU D3 for 2 y, then 2,000 IU for 1 y + 1200 - 1500 mg Ca CG: 1200 - 1500 mg Ca |
25(OH)D^ |
BMD: LS, total hip, total body, mid radius (DXA) |
NR |
5 |
|
|
|
Baseline: IG1: 48.3 (20.9) CG: 43 (16.6) |
No association between serum 25(OH)D and ∆ BMD. Analyses examining those with low baseline 25(OH)D or high PTH showed no influence of 25(OH)D on ∆ BMD. |
Adequate |
||
|
U.S. |
IG1: 3/104 (2.9%), CG: 3/104 (2.9%) did not complete |
|
|
|||
|
Public |
|
PTH (IA, Allegra) |
|
|||
|
|
|
3 mo 800 IU D3 IG1: 70.8 (95% CI 66.4-76.1) |
|
|
||
|
|
100% female |
|
3 mo 2000 IU D3 IG1: 86.9 (95% CI 80.1-94.1) CG: no significant change |
|
|
|
|
|
|
3 y |
|
|
|
|
|
|
IG1: 59.9 (6.2) y CG: 61.2 (6.3) y |
|
|
|
|
|
|
|
100% African American |
|
|
|
|
|
|
|
|
RIA |
|
|
|
|
|
Cooper (2003)120 |
187 Post menopausal women not on HRT |
IG1: 10,000 IU Vit D2/wk + 1000 mg Ca/d CG: 1000 mg Ca/d |
25(OH)D^ |
BMD: LS, FN, Ward’s triangle, Tr, proximal forearm (DXA) |
NR |
4 |
|
|
|
IG1: 82.6 (27.0) CG: 81.6 (24.4) |
No significant correlation between baseline 25(OH)D concentration and ∆ BMD at any site or between ∆ 25(OH)D and ∆ BMD at any site. |
Unclear |
||
|
Australia |
IG1: 20/93 (21.5%), CG: 14/94 (14.9%) did not complete |
|
|
|||
|
Public and private |
RIA |
|
||||
|
|
|
2 y |
|
|
|
|
|
|
100% female |
|
|
|
|
|
|
|
IG1: 56.5 (4.2) y CG: 56.1 (4.7) y |
|
|
|
|
|
|
|
Caucasian |
|
|
|
|
|
|
Author (year) Country Funding |
Population, N Attrition Gender Mean age (SD) Ethnicity |
Intervention Duration |
Serum 25(OH)D Mean (SD) nmol/L Assay |
Bone Health Outcomes |
Covariates Summary of Results |
Jadad AC |
|
Dawson-Hughes (1995)118 |
247 Healthy, ambulatory postmenopausal women |
IG1: 700 IU D3 + 500 mg Calcium citrate malate CG: 100 IU D3 + 500 mg Ca daily |
Baseline: NR |
BMD LS, FN and total body (DXA) |
NR |
3 |
|
End of study IG1: 100.1 (24.5) CG: 66.3 (25.5) Difference in means: 33.8 (95% 27.6, 40.1) |
25(OH)D concentrations during either season did not correlate with ∆ BMD at any site. |
Unclear |
||||
|
US |
|
|
|
|||
|
|
IG1: 5/128 (4%), CG: 8/124 (6%) did not complete |
|
|
|
||
|
Public and private |
|
|
|
|||
|
|
|
2 y |
CPBA |
|
|
|
|
|
100% female |
|
|
|
|
|
|
|
IG1: 63.0 y CG: 64.0 y |
|
|
|
|
|
|
|
Caucasion |
|
|
|
|
|
|
Ooms (1995)119 |
348 Elderly women |
IG1: 400 IU D3 CG: placebo daily |
25(OH)D^ Median (25th and 75th percentiles): IG1: 27 (19-36) CG: 26.0 (19-37) |
BMD: FN, Tr and distal radius (DXA) |
Season |
4 |
|
|
IG1: 51/177 (28.8%) CG: 53/171 (31.0%) |
Effect of vitamin D supplementation was independent of baseline 25(OH)D as well as 25(OH)D corrected for season. |
Unclear |
|||
|
The Netherlands |
|
|
||||
|
|
100% female |
2 y |
|
|
|
|
|
Public |
|
|
1 y followup: IG: 62 (52-70) CG: 23 (17-31) |
|
|
|
|
|
IG1: 80.1 (5.6) y CG: 80.6 (5.5) y |
|
|
|
|
|
|
|
NR |
|
CPBA |
|
|
|
|
Author (year) Country Funding |
Population, N Attrition Gender Mean age Ethnicity |
Intervention Duration |
Serum 25(OH)D Mean (SD) nmol/L Assay |
Bone Health Outcomes |
Covariates Summary of Results |
Jadad AC |
|
Schaafsma (2002)121 |
85 Healthy, postmenopausal women 50 - 70 y |
IG1: eggshell powder + 200 IU D3 IG2: Ca carbonate + 200 IU D3 CG: placebo |
25(OH)D^ IG1: 97.1 (24.1) IG2: 83.1 (22.4) CG: 91 (36.5) |
BMD: LS, hip (DXA) |
NR |
4 |
|
|
|
No significant correlation between 25(OH)D and BMD. |
Unclear |
|||
|
The Netherlands |
|
|
|
|||
|
12/85 (14%) did not complete |
|
|
|
|
||
|
|
|
% change: IG1: 25.1 (29.8) IG2: 43.8 (27.3) CG: 11.1 (22.7) |
|
|
|
|
|
NR |
|
|
|
|
|
|
|
|
100% female |
12 mo |
|
|
|
|
|
|
IG1: 60.5 y IG2: 59.5 y CG: 63.5 y |
|
|
|
|
|
|
|
|
CPBA |
|
|
|
|
|
|
Caucasian |
|
|
|
|
|
|
Storm (1998)116 |
60 Postmenopausal women without osteoporosis |
IG1: 4 glasses of fortified milk (325 IU of vitamin D/quart) IG2: Ca carbonate CG: placebo daily |
25(OH)D^ Mean (SE): IG1: 63.5 (8) IG2: 68.8 (7.3) CG: 59.8 (6.8); levels dropped almost 20% during 2 winters and returned to baseline during summer |
BMD: Tr, FN, LS (DXA) |
Independent variables: Ca intake, 25(OH)D, bone markers, PTH, insulin growth factor I, age, BMI, thiazide use, smoking, and baseline BMD |
4 |
|
The Netherlands |
Unclear |
|||||
|
|
7/60 (12%) |
|
|
|||
|
Public |
|
|
Serum 25(OH)D was not a significant determinant of FN BMD at baseline, during winter (p=0.23) or over the entire study period. |
|
||
|
|
100% female |
|
|
|||
|
|
IG1: 71 y IG2: 72 y CG: 71 y |
2 y |
End of study mean (SE): pooled: 67.8 (3.5) |
|
|
|
|
|
|
|
CPBA |
|
|
|
|
|
Caucasian |
|
|
|
|
|
|
Author (year) Country Funding |
Population, N Gender Attrition Mean age (SD) Ethnicity |
Duration |
Serum 25(OH)D Mean (SD) nmol/L Assay |
Bone Health Outcomes |
Covariates Summary of Results |
|
Prospective Cohorts |
|||||
|
Bischoff-Ferrari (2005)132 |
327 Individuals with knee OA |
1 - 2 y |
25(OH)D^ 69.5 (30.5) nmol/L |
BMD FN (DXA Lunar DPX-L) |
Adjusted for age, sex, BMI, knee pain, physical activity, cohort and disease severity. |
|
|
64% female |
|
|
||
|
U.S. |
|
|
% with values< 37.5 nmol/L: 15% % with values 40-80 nmol/L: 51% % with values > 80 nmol/L: 34% |
|
|
|
|
228 complete data |
|
|
Significant positive association between 25(OH)D and BMD independent of age, sex, BMI, knee pain, physical activity, and disease severity. |
|
|
Public |
|
|
|
||
|
|
74.4 (11.1) y Females: 76.6 (9.9) y Men: 70.6 (12.1) |
|
|
||
|
|
|
|
|
Significant trend between being in a higher serum 25(OH)D group and having higher BMD (p<0.04) |
|
|
|
NR |
|
RIA |
|
|
|
del Puente (2002)129 |
139 Active, non-institutionalized females (109 menopausal and 30 pre-menopausal) |
2 y |
25(OH)D^ Age 45-49 y: 57.7 (14.7) Age 50-59 y -59.2 (19.2) Age 60-69 y: 54.2 (16.7) Age 70-79 y: 54.5 (19) |
BMD LS and FN (DXA) |
Adjusted for age, menopausal status, current smoking status and BMI. |
|
Italy |
|
|
|
25(OH)D independent predictor of BMD change at FN and LS (FN ∆ BMD (beta 0.26 0.13), p=0.04 and LS ∆ BMD (beta 0.07 0.03), p=0.04). |
|
|
|
124 at followup 15/139 (11%) did complete |
|
|
||
|
Public |
|
|
|
||
|
|
|
|
<37.5 nmol/L: 17.3%; (range 9.1 to 27.5% across age groups). |
|
|
|
|
100% female |
|
|
|
|
|
|
|
|
|
In stepwise analysis discrimination models only FN significant (partial R2=0.26, p=0.04). |
|
|
|
58 (9) y |
|
|
|
|
|
|
|
|
CPBA |
|
|
|
|
Caucasian |
|
|
|
|
|
Dennison (1999)127 |
316 Healthy adults age 60-75 y |
4 y |
NR |
BMD: LS and proximal femur (DXA) |
Adjusted for adiposity |
|
|
All 316 included in analysis |
|
CPBA |
No association between baseline 25(OH)D and BMD at LS and proximal hip beta=0.002 spine, 0.001 hip) and no association between 25(OH)D and bone loss after adjustment for adiposity. |
|
|
U.K. |
|
|
|
||
|
45% female |
|
|
|
||
|
Public |
|
|
|
|
|
|
|
Women: 65.6 (2.8) y Men: 66.1 (3.2) y |
|
|
|
|
|
|
NR |
|
|
|
|
|
Author (year) Country Funding |
Population, N Attrition Gender Mean age (SD) Ethnicity |
Duration |
Serum 25(OH)D Mean (SD) nmol/L Assay |
Bone Health Outcomes |
Covariates Summary of Results |
|
Gerdhem (2005)131 |
1,044 Ambulatory independently living women |
3 y |
25(OH)D^ 95 (30) |
BMD: FN and LS (DXA) |
NR |
|
|
|
|
|
No association between baseline 25(OH)D and BMD. |
|
|
Sweden |
58/1044 (6%) did not complete |
|
% with values < 50 nmol/L: 4.4% % with values < 75 nmol/L: 26% |
|
|
|
Public |
100% female |
|
|
See other tables for other outcomes |
|
|
|
75 (75-75.9) y |
|
|
|
|
|
|
|
|
CPBA |
|
|
|
|
NR |
|
|
|
|
|
Melin (2001)126 |
64 Healthy, independent elderly individuals |
1 y |
25(OH)D^ |
BMD: FN (DXA) |
Adjusted for BMI |
|
Sweden |
|
|
Outdoor exposure ≥ 3 h/wk (N=49); males: 67.5 (15) females: 60 (27.5) nmol/L. Indoor exposure < 3 h/wk females (N=14): 40 (12.5) % with values < 77.5 nmol/L: 78% |
|
FN BMD associated with serum 25(OH)D after summer (r=0.38, p=0.003) and winter (r=0.37, p=0.003). After adjusting for BMI, 25(OH)D remained a significant determinant after winter (adjusted R2=0.14, p=0.005). |
|
|
All 64 included in analysis |
|
|
||
|
Public |
|
|
|
||
|
|
81% female |
|
|
||
|
|
83.7 y |
|
|
||
|
|
Caucasian |
|
|
|
|
|
|
|
|
RIA |
|
|
|
Rosen (1994)135 |
18 Healthy independently living elderly women |
2 y |
25(OH)D^ Baseline: 72.5 (6.7) |
BMD LS and FN (DXA) |
NR |
|
|
|
|
|
|
∆ 25(OH)D between summer and winter was associated with LS BMD in 2nd y (r=0.59, p=0.04) but not FN BMD. |
|
U.S. |
3/18 (17%) |
|
6 mo: 63 (3) 12 mo: 88 (7.8) 18 mo: 70.9 (8.5) |
|
|
|
Public |
100% female |
|
|
|
|
|
|
77 (2) y |
|
CPBA |
|
|
|
|
NR |
|
|
|
|
|
Author (year) Country Funding |
Population, N Attrition Gender Mean age (SD) Ethnicity |
Duration |
Serum 25(OH)D Mean (SD) nmol/L Assay |
Bone Health Outcomes |
Covariates Summary of Results |
|
Stone (1998)128 |
261 Healthy elderly females > 65 y random sample -subcohort of individuals not on HRT from Study of Osteoporotic Fractures |
42 - 71 mo |
25(OH)D^ 65.5 (24.5) |
BMD TH (DXA) calcaneal (SPA) |
Adjusted for age, weight, clinic site, current use of Ca supplements, multivitamins containing vitamin D, physical activity, smoking status and season. Controlled for levels of other hormones. |
|
U.S. |
|
|
|||
|
|
|
RIA |
|||
|
Public |
|
|
|
||
|
|
30/261 (11%) without calcaneal BMD; 43/261 (16%) without hip BMD |
|
|
|
Significant association between lower 25(OH)D levels and TH BMD loss. Lower 25(OH)D levels associated with increased loss at TH after adjusting for estradiol, testosterone, and SHBG, season, and use of supplements. |
|
|
100% female |
|
|
|
|
|
|
71.3 (4.8) y |
|
|
|
|
|
|
|
|
|
|
25(OH)D not associated with calcaneal BMD after adjusting for age and weight. |
|
|
Caucasian |
|
|
|
|
Author (year) Country Funding |
Population, N Gender Mean age (SD) Ethnicity |
Matching Variables |
Mean (SD) nmol/L Assay |
Bone Health Outcomes |
Covariates Summary of Results |
|
Case-control studies |
|||||
|
Al-Oanzi (2006)152 |
56 Men with idiopathic osteoporosis 114 male ctrls |
NR |
25(OH)D3 Cases: 44.7 (21) Ctrls: 43.3 (17) |
BMD diagnosis of osteoporosis based on T-score FN and LS |
NR |
|
|
|
No significant difference between plasma 25(OH)D in cases and ctrls, but mean free plasma 25(OH)D was about 33% lower in men with OP vs. ctrls (p<0.0001). |
|||
|
U.K. |
|
|
|
|
|
|
|
100% male |
|
RIA |
|
|
|
Public |
|
|
|
|
|
|
|
Cases: 59.6 (13.6) y Ctrls: 62.4 (10.4) y |
|
|
|
|
|
|
Caucasion |
|
|
|
|
|
Boonen (1999)139 |
100 Postmenopausal women 50 hip fracture patients, 50 ctrls |
Age, PM status, sampled at same time of year |
25(OH)D^ |
BMD FN and Tr (DXA) Fractures |
Adjusted for age |
|
|
Cases 29.25 (26.5) Ctrls: 68.75 (39) |
|
Mean 25(OH)D3 was lower in cases vs. ctrls (p<0.001). Vitamin D deficiency (< 30 nmol/L): 64% of cases vs. 8% ctrls within the same 4 mo sampling period (no relation b/w 25(OH)D and mo of sample collection). FN and Tr BMD were significantly lower in cases than ctrls. No significant relation found b/w the 25(OH)D3-PTH axis and BMD in cases and ctrls. In multiple regression of pooled data, models using 25(OH)D3 and PTH were highly predictive of FN BMD (R2=32%, p < 0.001). |
||
|
Belgium |
|
|
|||
|
|
|
|
|
|
|
|
Public |
100% female |
|
% with values < 30 nmol/L cases: 64% ctrls: 8% |
|
|
|
|
Cases: 74.2 (7.8) y Ctrls: 75.8 (5.6) y |
|
|
||
|
|
NR |
|
CPBA |
|
|
|
|
|
|
|
|
|
|
Landin-Wilhelmsen (1999)140 |
128 PM osteoporotic pts, 227 age matched ctrls from outpatient clinic |
Age, gender, PM status |
25(OH)D3: Cases: 88 (30) Ctrls: 96 (32) |
BMD and BMC: LS, TB and FN (DXA) |
NR |
|
|
25(OH)D significantly lower in OP pts vs. ctrls (p<0.05). |
||||
|
|
|
RIA |
Fractures |
|
|
|
Sweden |
|
|
|
|
|
|
|
100% female |
|
|
|
OP pts had lower body weight and BMI vs. ctrls (p<0.001). |
|
Public |
|
|
|
|
|
|
|
Cases 59 (6) y Ctrls 59 (5) y |
|
|
|
|
|
|
NR |
|
|
|
|
|
Author (year) Country Funding |
Population, N Gender Mean age (SD) Ethnicity |
Matching Variables |
Serum 25(OH)D Mean (SD) nmol/L Assay |
Bone Health Outcomes |
Covariates Summary of Results |
|
Villareal (1991)143 |
98 Ambulatory, independently living PM women 49 women with low (<38 nmol/L) 25(OH)D and 49 Ctrls. |
Age, gender, PM status, ethnicity, season, independence status, geographical location |
Cases: 23 (7) Ctrls: 58.9 (19) |
BMD (LS, T12-L3) QCT |
NR |
|
|
|
|
Women with low 25(OH)D levels had a reduced LS BMD. In the low 25(OH)D group, LS BMD correlated with 25(OH)D (r=0.41, p < 0.01). |
||
|
U.S. (Mid West) |
CPBA |
iPTH (RIA) |
|||
|
NR |
|
|
In multivariate analysis, iPTH was the major determinant of a decrease in LS BMD. |
||
|
|
100% female |
|
|
|
|
|
|
Cases: 64 y Ctrls: 63 y |
|
|
|
|
|
|
Caucasion |
|
|
|
|
|
Thiebaud (1997)141 |
179 Hip fracture patients (136 women and 43 men) 180 hospital ctrls (136 women and 44 men) 55 community ctrls (47 women and 8 men) |
Age, setting (for cases and one control group) |
25(OH)D^ Fracture cases: women 25.5 (20.5) men 17.25(18.5) Hospital ctrls: women 31.5 (26.5) men 27.75 (21.5) Community ctrls: women 53(23) men 31.5 (22.8) |
BMD FN, TH and Tr DXA) |
Adjusted for age, sex, and creatinine 25(OH)D levels generally low especially in hospital ctrls and hip fracture cases. |
|
Switzerland |
Fractures |
|
|||
|
|
|
|
Women and men with hip fractures significantly lower 25(OH)D levels vs. ctrls. Fracture patients had lower hip BMD vs.ctrls (p < 0.001). |
||
|
Public |
|
|
|||
|
|
|
|
|
Significant biochemical markers in the multivariate logistic regression model of the risk for hip fracture were serum albumin and PTH. |
|
|
|
% female hip fracture cases: 76% hospital ctrls: 76% community ctrls: 85% |
|
|
|
|
|
|
|
|
RIA |
|
|
|
|
|
|
|
|
In women FN, Tr BMD weakly correlated with 25(OH)D and the only significant association was at the Tr (r=0.13, p < 0.05). |
|
|
Cases: 81.0 y (women) and 77.7 y (men); Hospital ctrls: 80.9 y (women) and 76.9 y (men); Community ctrls: 71.7 y (women) and 71.3 y (men) |
|
|
|
|
|
|
NR |
|
|
|
|
Question 2. How Does Dietary Intake of Vitamin D, Sun Exposure, and/or Vitamin D Supplementation Affect Serum 25(OH)D Concentrations?
For each vitamin D source (dietary intake from fortified foods, vitamin D supplementation or sun exposure), our objectives were to determine the effect on circulating levels of 25(OH)D and to determine whether the effect is altered by specified individual or environmental characteristics.
Question 2A. Does Dietary Intake from Foods Fortified with Vitamin D Affect Concentrations of Circulating 25(OH)D?
Overview of Relevant RCTs
When evaluating the effect of food fortification on circulating 25(OH)D concentrations, it is important to acknowledge the potential confounding effect generated by the food source, the assay used to measure 25(OH)D and potential differences in the bioavailability and/or metabolism of vitamin D2 versus vitamin D3. Most studies in this review used dairy products as the source of fortified food. There is potential for study contamination through altered intake of other nutrients such as calcium, phosphate and acid load that can affect bone and mineral homeostasis.
Study characteristics. A total of 13 RCTs, 12 parallel design,116,155-165 and one factorial design,166 studied the effect of dietary sources of vitamin D on circulating 25(OH)D concentrations. Two of the 13 trials did not provide the vitamin D content of the dietary source and were excluded.116,162 Therefore, the following summary includes a total of 11 trials (Table 9).155-161,163-166
Within the included trials, there were a total of 697 subjects in the vitamin D dietary intervention groups and 584 in the control groups for a total of 1,281 subjects.155-161,163-166
Population characteristics. All trials were in adults. Two trials studied young adults,158,160 one included young women,164 three involved postmenopausal women,155,157,159 one included elderly men,163 and the remaining four studied elderly individuals of both genders.156,161,165,166 Four out of the six trials that included both males and females provided the gender breakdown156,158,165,166 and the percentage of females ranged from 51165 to 83158 percent. The ethnicity of the study population was reported in four trials,155,157,159,163 and BMI was also reported in four trials.155,163,164,166 The vitamin D dietary intake was evaluated at baseline in three trials161,164,166 and sunlight exposure was assessed in three studies.156,158,166 The studies did not provide an assessment of skin type of participants. Sunlight exposure was assessed in only three of the 11 trials although several others excluded subjects who had recent or planned exposure to higher-than-usual levels of sunshine. Methods of ascertainment included a sunlight exposure score during the summer in a subsample,158 the percentage of participants who were outside daily during sunny period and the percentage who avoided sunlight166 and an outdoor score to reflect the average exposure to sunlight per day per season.156 Results showed that sunlight
exposure did not predict post therapy serum 25(OH)D in the total sub-sample,158 that there was no significant difference in sunlight exposure between groups at baseline166 or during the study.156 Participants were community-dwelling in all of the included trials.155-161,163-166
Interventions and comparators. The vitamin D dietary interventions included fortified milk,155-159,163 nutrient dense fruit and dairy based products,166 high vitamin D diet,165 fortified orange juice,160 fortified cheese,161 and fortified bread.164 The RCT with a factorial design had two other intervention groups that included an exercise program and a combined program of exercise and nutrient dense products.166
The type of vitamin D administered within the described vitamin D dietary interventions was vitamin D3 in eight trials,155,157-161,163,164 and was not specified in three.156,165,166 The vitamin D content was 200 - 1,000 IU. Seven trials also specified the calcium content within the dietary intervention.155-160,163
The comparators within the included trials were as follows: usual diet or no intervention,155,157,163,165,166 unfortified liquid milk,156,158 fortified milk with a lower dose of calcium but same dose of vitamin D compared to intervention group,159 unfortified orange juice,160 unfortified cheese or no cheese,161 and regular wheat bread or regular wheat bread and a vitamin D3 supplement.164
The duration of the intervention ranged from three weeks164 to 24 months.155,157,163
Compliance was reported in four trials and was reported to be greater than 85 percent.155,156,161,163
Study quality. Six out of the 11 trials had a methodological quality score of ≥ 3/5 on the Jadad scale (Table 9).156,157,159-161,163 Ten trials reported the percent lost to followup,155-159,161,163-166 and of these, only one reported losses greater than 20 percent.166 In all trials, the description of allocation concealment was unclear.155-161,163-166
Intention-to-treat analysis. One trial carried out an intention-to-treat analysis,165 eight trials did not,155-160,163,164,166 and the type of analysis was unclear in one trial.161
Outcomes
Vitamin D status by serum 25(OH)D. Seven trials measured total 25(OH)D (i.e., D2 and D3),155,157,158,161,163,164,166 whereas four trials specifically measured 25(OH)D3 levels.156,159,160,165 Refer to Table 9 for baseline, end of study and absolute change in serum 25(OH)D levels in addition to other measurement details.
Harms. None of the studies reported adverse side effects related to the consumption of the dietary intervention under investigation.155-161,163-166
Study Selection for Meta-Analysis
Meta-analysis was conducted to quantify the effects of dietary sources with vitamin D with/without calcium versus placebo or calcium on serum 25(OH)D levels. Seven of the 11 included trials that reported (or provided sufficient data to calculate) the absolute change in total 25(OH)D or 25(OH)D3 concentrations were included in the meta-analysis.155,156,158,160,164-166 The
other four RCTs were excluded due to insufficient data required to calculate the change in 25(OH)D levels,157,163 between group differences in baseline 25(OH)D levels,161 or the intervention and control groups receiving equal amounts of vitamin D.159
Quantitative Data Synthesis
Combining all seven trials that investigated the effect of food fortification or dietary sources of vitamin D (with/without calcium) versus control was not possible due to heterogeneity of the treatment effect (I2 = 79.2 percent). However, the individual weighted mean differences (WMD) demonstrated a clear trend toward a significantly higher absolute change in serum 25(OH)D in the treatment group versus control (Figure 3).155,156,158,160,164-166 Potential sources of heterogeneity are the different 25(OH)D assays used (two studies each used HPLC, RIA or CPBA, and one study did not report the assay), the dietary vehicles used, study populations, the type or dose of vitamin D (unclear in one trial165), and the outcome employed (i.e., total 25(OH)D versus 25(OH)D3).
Figure 3. Forest Plot on the Effect of Dietary Sources of Vitamin D (with/without calcium) vs. Control on Absolute Change in Total Serum 25(OH)D or 25(OH)D3.
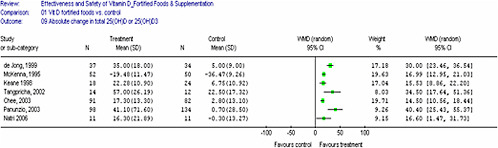
Combined data from two trials (N = 275) that were similar in the dietary vehicle used (fortified skim milk), population studied (postmenopausal women and young adults), dose of vitamin D (400 and 480 IU daily), type of vitamin D (D3), 25(OH)D assay (RIA), and outcome (total 25(OH)D) demonstrated a significantly higher absolute change in serum 25(OH)D (WMD 15.71, 95% CI 12.89, 18.53, heterogeneity I2 = 0 percent) in the treatment group155,158 (Figure 4). Similarly, a significantly higher percent change in serum 25(OH)D was demonstrated in the treatment group (WMD 19.13, 95% CI 15.32, 22.95). However, heterogeneity of the treatment effect was high (I2 = 54.1 percent).155,158 The study by McKenna et al. demonstrated a decrease in 25(OH)D levels in both groups as a result of seasonal decline. However, food fortification reduced the degree of seasonal decline in the treatment group.158
Figure 4. Forest Plot on the Effect of Vitamin D3Fortified Skim Milk (with calcium) vs. Control on Absolute Change in Total Serum 25(OH)D.
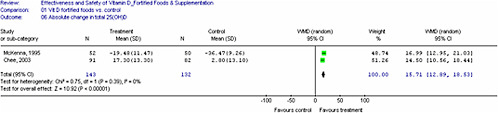
In an attempt to explain the heterogeneity found in the overall analysis, the following subgroups were analyzed: (1) younger versus older individuals; (2) all trials that administered 400 IU/day (the most common dose); (3) the use of total 25(OH)D versus 25(OH)D3 and (4) the type of vitamin D assay (RIA, HPLC versus CPBA). The subgroup analysis that included studies of younger individuals demonstrated a significant absolute increase in 25(OH)D levels (4 trials, N = 323, WMD 17.02, 95% CI 12.49, 21.56, heterogeneity I2 = 44.4 percent).155,158,160,164 However, combining trials within all of the other subgroup analyses was not possible as the heterogeneity of the treatment effect was high. A meta-regression to further explore heterogeneity was not carried out due to the limited number of trials with sufficient data.
Publication Bias. We were not able to evaluate the possibility of publication bias given the limited number of trials with sufficient data required to conduct such an investigation.
Qualitative Data Synthesis
Results from the four trials157,159,161,163 that were excluded from the quantitative analysis are described below.
Daly et al. (2006) explored the effect of fortified milk (800 IU vitamin D3 plus 1000 mg of calcium) versus no additional milk in older Caucasian, ambulatory men (mean age 62 years) over a two year period. Serum 25(OH)D was increased in the milk supplementation group relative to controls (27 percent, p<0.001). Baseline characteristics did not differ between groups.163
Johnson et al. (2005) investigated the effects of vitamin D fortified cheese (600 IU D3 daily) on serum 25(OH)D versus unfortified cheese or no cheese for two months in older men and women.161 Serum 25(OH)D measured at the beginning of the study demonstrated a significant difference between the fortified cheese versus control groups. Overall compliance with consumption of 85 grams of cheese per day was high (96.2 percent) with no difference between groups. Results demonstrated that, despite a significantly higher total vitamin D dietary intake in the fortified cheese versus the two control groups (unfortified cheese and no cheese groups), the end of study serum 25(OH)D decreased by a mean of 6 (SD 2) nmol/L (p<0.001) in the fortified cheese group. While not a clinically significant decrease, the authors speculated that this decrease reflected the higher baseline serum 25(OH)D in the fortified cheese group.161
Lau et al. (2001) investigated the benefits of milk supplementation (240 IU D3 plus 800 mg Ca) in postmenopausal Chinese women over a two year period.157 At 12 months, serum 25(OH)D was higher in the milk supplementation group compared to baseline (p<0.05). Baseline and followup serum 25(OH)D for the control group, a comparison of serum 25(OH)D between the intervention and control group, and participants’ sunlight exposure and vitamin D intake were not reported.157
Palacios et al. (2005) assessed the effect of consuming milk enriched with calcium and vitamin D (1,200 mg Ca plus 228 IU D3) versus milk with lower calcium content but the same amount of vitamin D (900 mg Ca plus 228 IU D3) daily for six months in healthy postmenopausal women. Serum 25(OH)D3 increased from baseline in those women who consumed the milk enriched with calcium (which also contained phosphorus and lactose) even thought the amount of vitamin D was similar (p <0.001). The calcium enriched milk group had significantly higher serum 25(OH)D3 at the end of study than the non-enriched group (p = 0.007). These results led the authors to speculate that calcium may affect the absorption of vitamin D. However, compliance was not measured. The participants’ sunlight exposure and vitamin D intake were also not reported.159
Dose response of serum 25(OH)D to dietary interventions. The positive direction of the treatment effect of dietary interventions with foods fortified with vitamin D is consistent. Based on our synthesis of the data from the individual trials, the treatment effect may be dependent on baseline serum 25(OH)D levels (Table 10). Those trials with low baseline 25(OH)D levels (i.e., < 50 nmol/L)156,160,164-166 consistently demonstrated a greater percent increase in 25(OH)D levels at the end of study compared to trials with higher baseline 25(OH)D levels (i.e., > 50 nmol/L).155,157-159,161 Observations from such indirect comparisons need to be interpreted cautiously due to differences in baseline characteristics of the study populations, the bioavailability of the vitamin D in the various food sources and the different measures of serum 25(OH)D used.
Summary
Despite the possibility of study contamination by altered intake of other nutrients contained within the different food sources that affect bone and mineral homeostasis, food sources enriched with vitamin D in the form of milk, orange juice or other dairy and fruit based products (i.e., yogurt, custard and fruit juice) significantly improved vitamin D status in vitamin D deficient, insufficient or sufficient populations including young adults, postmenopausal women and elderly men. This was demonstrated by a significant rise in serum 25(OH)D in individuals that received vitamin D enriched dietary interventions compared to controls on an individual trial basis,155-160,163-166 and by combining trials that permitted a quantitative analysis.155,158
Increases in serum 25(OH)D from vitamin D enriched dietary interventions may depend on baseline 25(OH)D levels as well as vitamin D dose. However, this observation is based on indirect comparisons of the individual trials and should be interpreted with caution. It was not possible to determine if results vary with age, BMI and ethnicity given the limited data available and the between trial differences in terms of population characteristics, dietary interventions and measurement of serum 25(OH)D levels.
|
Summary. Serum 25(OH)D levels and dietary intake of vitamin D Quantity: There were eleven RCTs (N = 1,281) of which seven (N = 668) permitted a quantitative analysis. However, due to significant heterogeneity of the treatment effect, only two trials (N = 275) could be combined. Quality: Mean quality score (Jadad) for the 11 RCTs was 2.8/5 with scores ranging from 1 to 4 (six trials had a score ≥ 3). In all trials, the description of allocation concealment was unclear. Only one trial reported losses to followup > 20 percent. Consistency: The majority (10/11) of individual trial results were consistent with a significant effect of dietary intake from foods fortified with vitamin D on 25(OH)D concentrations. The individual treatment effects of the seven trials ranged from 15 (95% CI 11-18) to 40 (95% CI 25-55) nmol/L (fortification consisting of 100 - 1,000 IU of vitamin D) and the combined treatment effect from the two trials (dose 400-480 IU vitamin D3) was 16 (95% CI 13-19) nmol/L. There is good evidence that dietary intake of vitamin D increases serum concentrations of 25(OH)D. |
Table 9. Serum 25(OH)D Levels and Fortified Foods
|
Author (year) Country (latitude) |
Population, N Mean age (SD) Ethnicity |
Dietary Source Vit D daily dose; Ca Duration |
Absolute change in mean serum 25(OH)D (SD) (nmol/L) |
Assay Fasting sample (Y/N) Season of sample |
Jadad Score+ |
|
Chee (2003)155 |
173 Postmenopausal women (IG1 91, CG 82) |
IG1: Skim milk powder (400 IU D3 + 1200 mg Ca) CG: usual diet |
25(OH)D^ IG 17.3 (13.3) CG 2.8 (13.1)** |
RIA |
2 |
|
Malaysia (3° 7' N) |
|
|
Y |
|
|
|
|
59 (3) y |
24 mo |
|
|
|
|
|
|
|
|
NR |
|
|
|
Asian (Chinese) |
|
|
|
|
|
Daly (2006)163 |
149 Ambulatory men ≥ 50 y (IG1 76, CG 73) |
IG1: fortified milk (800 IU D3 + 1000 mg Ca) CG: usual diet |
25(OH)D^ IG1: 5.7 CG: –15.1 |
RIA |
3 |
|
Australia (37° 47’S) |
|
|
Y |
|
|
|
|
61.9 (7.7) y |
24 mo |
|
|
|
|
|
|
|
|
NR |
|
|
|
Caucasian |
|
|
|
|
|
de Jong (1999)166 |
71 Elderly individuals (IG1 37, CG 34) |
2 nutrient dense vs. regular products 400 IU vit D |
25(OH)D^ IG1: 35 (18) CG: 5 (9) |
CPBA |
2 |
|
The Netherlands (51°58' N) |
|
|
Y |
|
|
|
78.8 y |
4 mo |
|
|
|
|
|
|
|
|
|
NR |
|
|
|
Dutch (Caucasian) |
|
|
|
|
|
Johnson (2005)161 |
110 Adults > 60 y (IG1 33, IG2 34, CG 33) |
IG1: fortified cheese (600 IU D3) IG2: unfortified cheese CG: no cheese |
25(OH)D^ IG1: −6.0 (11.49) IG2: 3.5 (7.29) CG: 0.75 (10.05)* |
RIA |
4 |
|
U.S. (45° 25′ N) |
|
|
Y |
|
|
|
|
NR |
|
|
|
|
|
|
|
2 mo |
|
Winter |
|
|
|
NR |
|
|
|
|
|
Keane (1998)156 |
42 Elderly individuals (IG1 18, CG 24) |
IG1: fortified milk (200 IU vit D + 800 mg Ca) CG: unfortified milk (4 IU vit D + 600 mg Ca) |
25(OH)D3 IG1: 22.25 (10.90) CG: 6.75 (10.92)* |
CPBA |
4 |
|
Ireland (53° 22' N) |
|
|
NR |
|
|
|
|
78.1 y (range 66-91) |
12 mo |
|
|
|
|
|
|
|
|
Late winter |
|
|
|
NR |
|
|
|
|
|
Author (year) Country (latitude) |
Population, N Mean age (SD) Ethnicity |
Dietary Source Vit D daily dose; Ca Duration |
Absolute change in mean serum 25(OH)D (SD) (nmol/L) |
Assay Fasting sample (Y/N) Season of sample |
Jadad Score |
|
Lau (2001)157 |
185 Postmenopausal women (IG1 95, CG 90) |
IG1: Milk powder (240 IU D3 + 800 mg Ca) CG: no intervention |
25(OH)D^ IG1: 23.2 (13.2)** CG: not estimable |
CPBA |
3 |
|
China (22°17' N) |
|
NR |
|
||
|
|
|
24 mo |
|
|
|
|
|
56.9 y IG1: 57.1 (1.78) y CG: 56.8 (1.5) y |
|
|
NR |
|
|
|
Asian (Chinese) |
|
|
|
|
|
McKenna (1995)158 |
102 Younger adults (IG1 52, CG 50) |
IG1: fortified skim milk 480 IU D3 + 1525 mg Ca/L, 2L/wk) CG: unfortified skim milk (12 IU D3 + 1270 mg Ca/L, 2L/wk) |
25(OH)D^ IG1: − 15 (21.1), CG: − 31 (24.2)** |
RIA |
2 |
|
Ireland (53° 22' N) |
|
NR |
|
||
|
|
median (range) 22.6 y (17 – 54) |
|
|
|
|
|
|
|
5 mo |
|
Late winter (baseline) & summer (end of study) |
|
|
|
NR |
|
|
|
|
|
Natri (2006)164 |
41 Women 25-45 y (IG1 11, IG2 10, IG3 9, CG 11) |
IG1: fortified wheat bread (400 IU D3) IG2: fortified rye bread (400 IU D3) IG3: regular wheat bread + vit D3 supplement 400 IU D3) CG: regular wheat bread |
25(OH)D^ IG1: 16.3 (21.89) IG2: 14.9 (19.61) IG3: 19.5 (30.3) CG: −0.3 (13.27)* |
RIA |
1 |
|
Finland (60° 10' N) |
Y |
|
|||
|
|
29.1 y |
|
|
Feb – March |
|
|
|
NR |
3 wks |
|
|
|
|
Palacios (2005)159 |
69 Postmenopausal women (IG1 34, CG 35) |
IG1: fortified Ca-enriched skim milk (228 IU D3 + 1,200 mg Ca) (also contained phosphorus, lactose) IG2: fortified skim milk (228 IU D3 + 900 mg Ca) |
25(OH)D3 IG1: 13.9 (30.0) CG: 0.7 (34.3)** |
RIA |
4 |
|
Spain (37° 8' N) |
|
Y |
|
||
|
|
62.7y |
6 mo |
|
NR |
|
|
|
Caucasian |
|
|
|
|
|
Panunzio (2003)165 |
232 Elderly individuals (IG1 98, CG 134) |
IG1: diet with vit D (400 IU D) CG: diet without vit D |
25(OH)D3 IG1; 41.1 (71.6) CG: 0.7 (28.5)** |
NR |
2 |
|
Southern Italy (41° 27' N) |
|
Y |
|
||
|
|
|
10 wks |
|
|
|
|
|
NR; range 65-74 y |
|
|
NR |
|
|
|
NR |
|
|
|
|
|
Author (year) Country (latitude) |
Population, N Mean age (SD) Ethnicity |
Dietary Source Vit D daily dose; Ca Duration |
Absolute change in mean serum 25(OH)D (SD) (nmol/L) |
Assay Fasting sample (Y/N) Season of sample |
Jadad Score |
|
Tangpricha (2002)160 |
26 Healthy adults aged 19-60 y (IG1 14, CG 12) |
IG1: fortified orange juice (1,000 IU D3 + 350 mg Ca) CG: unfortified orange juice (350 mg Ca) |
25(OH)D3 IG1: 57.0 (26.19) CG: 22.3 (17.32)* |
CPBA |
4 |
|
U.S. (42°22' N) |
NR |
|
|||
|
|
29.0 (9.0) y |
|
|
Spring |
|
|
|
|
3 mo |
|
|
|
|
|
NR |
|
|
|
|
|
*SEM or 95% CI converted to SD; **Absolute change calculated from baseline and end of study data; ^ refers to total (both isoforms) 25(OH)D or isoform not specified; +Jadad score out of 5; allocation concealment for all studies in the table was rated as “unclear”; NR, not reported Ca, calcium; CG, control group; CPBA, competitive protein binding assay; IG, intervention group; IU, international units; mo, month(s); N, north; NR, not reported; S, south; vit, vitamin; Y, yes; y, year |
|||||
Table 10. Absolute and % Change in Serum 25(OH)D for the Intervention Group in Supplementation Trials (grouped by vitamin D dosages < 400 IU vs. ≥ 400 IU/d)
|
Author (year) |
Daily Vitamin D Dose |
IG Baseline 25(OH)D (nmol/L) |
IG End of Study 25(OH)D (nmol/L) |
Absolute (%) Change in 25(OH)D (nmol/L) |
Jadad Score+ |
|
< 400 IU/d |
|||||
|
Keane (1998)156 |
200 IU vit D^ |
24* |
46.25* |
22.3 (92.9)* |
4 |
|
Lau (2001)157 |
240 IU D3 |
66 |
89.2 |
23.2 (35.1) |
3 |
|
McKenna (1995)158 |
137 IU D3 |
77 |
62 |
−15 (−19.5) |
2 |
|
Palacios (2005)159 |
228 IU D3 |
109.9* |
123.9* |
14 (12.7)* |
4 |
|
≥ 400 IU/d |
|||||
|
Chee (2003)155 |
400 IU D3 |
69.1 |
86.4 |
17.2 (25.0) |
2 |
|
Daly (2006)163 |
800 IU D3 |
77.2 |
NR |
NR |
3 |
|
de Jong (1999)166 |
400 IU D^ |
37 |
72 |
35 (94.6) |
2 |
|
Johnson (2005)161 |
600 IU D3 |
57.5 |
52.5 |
−5 (−8.7) |
4 |
|
Natri (2006)164 |
400 IU D3 |
29 |
45.3 |
16.3 (56.2) |
1 |
|
Panunzio (2003)165 |
400 IU D^ |
40.2* |
81.3* |
41.1 (102.2)* |
2 |
|
Tangpricha (2002)160 |
1,000 IU D3 |
37* |
94* |
57 (154)* |
4 |
|
Note: *25(OH)D3 ; ^isoform of vitamin D not specified; +Jadad score out of 5; allocation concealment was rated as “unclear” for all studies listed in the table; IG, intervention group; IU, international units; NR, not reported |
|||||
Question 2B. What is the Effect of UV Exposure on Circulating 25(OH)D Concentrations?
Overview of Relevant RCTs
Study characteristics. Eight randomized trials evaluated the effect of ultraviolet exposure on serum 25(OH) D concentrations.167-174
Within these eight parallel design trials, there were a total of 337 subjects with 197 subjects in the intervention group and 140 subjects in the comparator groups. Four trials evaluated the effect of natural sun exposure,168,169,171,172 and four trials evaluated the effect of artificial UV exposure167,170,173,174 on circulating 25(OH)D concentrations.
Population characteristics. There were seven trials in adult populations and one in infants.172 Three trials involved younger or middle-aged adults169,170,174 and four trials included older adults.167,168,171,173 The percentage of females ranged from 17170 to 100 percent,167 and one trial had only male participants.174 In the trial in infants, 55 percent were female.172
Body Mass Index was not reported in any of the trials. Skin type was reported in two trials: Matsuoka170 in which all individuals were skin type III (i.e., sometimes burn, always tans) and Falkenbach included skin types II (i.e., always burns, sometimes tans) and III.174 Another trial reported that skin pigmentation varied from fair to medium.168
Vitamin D intake. One trial reported daily dietary vitamin D of 3.1 nmol or 48 IU168 and another estimated dietary intake of 100 IU of vitamin D plus 1,000 mg of calcium per day.167 Dietary intake was not reported in the remaining six trials.170-175
Vitamin D deficiency. In four of the eight trials, the proportion of subjects with vitamin D deficiency at baseline (< 30 nmol/L) was reported.167-169,172 In two trials of elderly nursing home residents, 93 percent of subjects were vitamin D deficient (<30 nmol/L) in one trial,167 and 50 percent in the other trial.168 In contrast, in a trial on community-dwelling adults in Australia, only 10 percent were vitamin D deficient.169 In the infant trial,172 20 percent of infants were deficient and 11 percent were diagnosed with rickets. Baseline concentrations and type of vitamin D assay are presented in Table 11.
Interventions. In the four trials that used solar exposure,168,169,171,172 the dose was one minimal erythemal dose (MED) in one trial,168 and a geometric mean of 138 J/m2 in another trial.169 In two trials, the exact dose was not reported but described as 2 hours of sunshine per day with face and hands exposed172 or 15 versus 30 minutes with head, neck and arms exposed.171 All trials were conducted in southern latitudes, except for the infant trial.172 In the four trials that used artificial UV,167,170,173,174 the description of the dose was as follows: (1) one suberythematous dose of 27 mJ/cm2 to the whole body,170 (2) 1/2 MED at doses from 30 to 140 mJ/cm2;167 (3) high energy versus low energy UV-B to provide suberythematous doses,174 and (4) a dose of 160 mJ/cm2 per week.173
The frequency of UV exposure was a single exposure in one trial,170 one173 to three times per week,167 ten times over a 12 day period,174 and daily in four trials.168,169,171,172 The duration of the intervention varied from a single exposure,170 to 12 days in one trial,174 28 days in two
trials,171,172 and 12 weeks in three trials.167,168,173 Marks et al. used sunscreen as the intervention.169
Ascertainment of UV exposure. Three of the four trials that used natural sun exposure reported the method of ascertainment of UV-B exposure. Ho et al. used a sunshine diary to record minutes outdoors per day and used the average weekly UV score for September to October.172 Lovell used UV sensitive polysulphone badges and readings on a UV meter coupled to a sensor.168 Marks also used polysulphone film badges in addition to a sun exposure and clothing diary.169
Comparators. In four trials, the comparator was a placebo.169,171-173 Two trials included a comparator arm of vitamin D3 400 IU167 or two dosages of vitamin D3; 289 IU or 867 IU.168 The two remaining trials used lower energy UV-B,174 or UV-B with 50,000 IU vitamin D2 versus vitamin D2 alone as comparators.170
Compliance. Compliance was reported in only two trials.167,174 In the Chel trial167 three patients in the UV-B group did not complete the treatment and in the other trial174 one subject did not comply with treatment.
Study quality. Study quality scores on the Jadad scale ranged from 1 to 4 out of a possible 5, with all except two trials having a score of less than 3.169,171 A description of trial withdrawals was adequately reported in six of the trials.167-169,172-174 In all eight trials, the description of allocation concealment was unclear. One challenge with trials of UV exposure is the difficulty of blinding study participants to the intervention.
Type of analysis. Three trials performed an intention-to-treat analysis.170,171,174 In five trials an intention-to-treat analysis was either not performed or the type of analysis was unclear.167-170,173
Qualitative data synthesis. Quantitative synthesis of the trials of UV exposure and serum 25(OH)D was not possible due to the heterogeneous study populations, the interventions (e.g., length and area of exposure, and dose) and lack of complete data.
Outcomes. Followup serum 25(OH)D or 25(OH)D3 concentrations were evaluated in six trials167,168,171-174 (Table 11). The change in serum 25(OH)D concentrations from baseline was significant in all of the six trials.
Reid (1986) compared the effect of sun exposure in 15 Caucasian older men and women living in residential homes in New Zealand. The subjects were randomized into three groups of five each; controls who did not change their daily routine and the two intervention groups (outside daily for either 15 or 30 minutes for four weeks). Body surfaces exposed included head, neck, legs and forearms. Mean baseline serum 25(OH)D concentrations were different across groups: 35 nmol/L (15 minute group); 60 nmol/L (30 minute group), and; 60 nmol/L (control group). Serum 25(OH)D increased in both the 15 and 30 minute groups, however the increase (18.5 nmol/L) was only significant in the 30 minute group.171
Lovell (1988) studied the effect of sun exposure in Caucasian elderly nursing home residents in Australia compared to vitamin D3 (either 289 IU or 867 IU/day) over a three month period. The median increase (11.0 nmol/L) in serum 25(OH)D concentrations was significant after the second month of treatment in the UV-B group and the lower dose vitamin D group and after the first month, with 867 IU vitamin D3.168
In Asian breast-fed infants aged one to eight months who were not receiving supplemental vitamin D, Ho (1985) assessed the effect of two hours of sunshine per day for two months (face and hands uncovered) versus the usual amount of sunshine. Infants in the intervention group received 115 minutes of sunshine per day compared to controls who received an average of 63 minutes. There was a significant increase in serum 25(OH)D in the treatment group, but not in the infants receiving usual sunshine exposure. Serum 25(OH)D concentrations correlated with UV exposure scores, even after adjusting for age. The estimated UV score needed to maintain serum 25(OH)D at 27.5 nmol/L was 24 minutes per day with only the face uncovered.172
Marks et al. (1995) conducted a seven-month RCT in Australia of daily sunscreen use (SPF of 17) compared to placebo in 113 subjects over age 40 years. Participants were recruited from a random sample of a trial designed to evaluate the effect of regular sunscreen use in subjects with solar keratoses. Sunscreen was applied daily to the head, neck, forearms and dorsum of each hand. The mean baseline serum 25(OH)D3 was 54.2 nmol/L. When the results were stratified by age, serum 25(OH)D3 increased less in subjects over 70 years in the sunscreen group (7.4 nmol/L) versus those younger than 70 years (15.9 nmol/L) but the differences were not significant. Overall serum 25(OH)D3 concentrations increased by the same amount in the sunscreen and non-sunscreen groups with a difference of 0.99 nmol/L (95% CI −7.0, 5.0). Nine out of 11 subjects with serum 25(OH)D3 below the reference range had values within the reference range by the end of the study. The absence of a difference between groups may have been due to incomplete compliance with sunscreen use.169
In a 12 week trial, Toss (1982) studied the effect of artificial UV exposure on 42 elderly nursing home residents compared to vitamin D2 450 IU plus calcium 600 mg daily, calcium alone, or placebo. Front and back were exposed to UVR for 1 minute each, then 2 minutes and followed by ten treatments of 3 minutes each. The mean UV total dose was 160 mJ/cm2. There were significant increases in serum 25(OH)D in both the UV group (end of study 25(OH)D was 59 nmol/L) and in the vitamin D2 group (42 nmol/L), compared to no change in serum 25(OH)D in the control and calcium groups.173
Chel (1998) investigated the effect of artificial UV-B irradiation in 45 elderly females in The Netherlands. The majority of subjects were vitamin D deficient (<30 nmol/L). Subjects were randomized to receive UV-B (one-half MED) three times per week, 400 IU vitamin D3 or placebo for 12 weeks. Six areas of 4 cm2 were irradiated with UV-B doses increasing from 30 to 140 mJ/cm2, and individual doses were adjusted according to skin sensitivity as determined by the MED. After 12 weeks, the median serum 25(OH)D concentrations increased to 60 nmol/L in both the UV- B (increase of 42 nmol/L) and vitamin D3 (increase of 37 nmol/L) groups (p<0.001).167
Falkenbach (1992) evaluated the effect of artificial high energy (less emission in range of 300 nm) versus low energy, shorter wavelength UV-B in healthy young men (N=24) in Germany, during the winter. Both treatment groups were treated ten times over a 12-day period in a solarium. The initial exposure was three minutes and increased by 10 percent with each session to achieve suberythemal doses, using both ventral and dorsal irradiation. Baseline serum 25(OH)D3 concentrations were higher (115-124 nmol/L) than in other trials which may reflect younger age of subjects. Fasting serum 25(OH)D3 concentrations measured three days after the last exposure increased significantly in both groups and remained elevated for four weeks, in the
low energy, shorter wavelength UV-B group (Table 11). Serum PTH concentrations were significantly decreased in this group.174
Matsuoka (1992) evaluated if administration of vitamin D2 interfered with the release of vitamin D3 from the skin after exposure to UV-B light. A total of eighteen subjects were randomized to receive oral 50,000 IU vitamin D2 alone, 50,000 IU vitamin D2 followed by UV-B exposure 12 hours later or UV-B alone. UV-B was given as a single dose to the whole body at a suberythematous dose of 27 mJ/cm2. Total serum 25 (OH)D concentrations (measured by CPBA) did not increase significantly in any group. Vitamin D3 concentrations (measured by HPLC) increased significantly after UV-B treatment (increase of 27.5 nmol/L). A similar increase in vitamin D3 was observed when UV-B exposure was preceded by vitamin D2, suggesting that elevated serum vitamin D2 does not interfere with release of vitamin D3 from the skin.170
|
Summary. Effect of UV Exposure on 25(OH)D Concentrations Quantity: Eight RCTs evaluated the effect of UV exposure on serum 25(OH)D concentrations. Four trials used solar exposure and four used artificial UV-B sources. Quality: The overall quality of the trials was low, with only two of eight trials having a score of ≥ 3/5 on the Jadad scale. Consistency: There was heterogeneity in the age and gender of subjects, dose, and duration of UV exposure that made synthesis of the results difficult. In addition, it was difficult to ascertain the exact dose. Both artificial and solar exposure increased serum 25(OH)D concentrations in vitamin D deficient and replete subjects. Three trials in elderly nursing home populations (solar or artificial UV-B exposure) demonstrated significant increases in serum 25(OH)D concentrations.167,168,171 One trial using artificial UV-B exposure in elderly females reported an increase of 42 nmol/L in serum 25(OH)D (measured by RIA) with ½ MED exposure to the lower back, three times per week.167 These results support the belief that older individuals have adequate capacity to synthesize vitamin D3 in response to UV-B exposure, despite the decreased availability of 7-dehydrocholesterol in the skin. One trial evaluated the effect of sunscreen on serum 25(OH)D concentrations and found that the UV-B response was not suppressed by sunscreen use.169 There is fair evidence that solar and artificial UV-B exposure increase 25(OH)D levels. The included trials did not address the issue of whether serum 25(OH)D response is attenuated in heavily pigmented groups. It was also not possible, to evaluate the impact of effect modifiers such as age, ethnicity, seasonality and latitude. |
Table 11. Effect of UV Exposure on Serum 25(OH)D Levels
|
Author (year) Country (Latitude) Season Funding |
Population, N Mean Age (SD) % Vit D Deficient Ethnicity |
UV Exposure Comparator |
Serum 25(OH)D Assay Baseline (nmol/L) |
Serum 25(OH)D at end of trial or Absolute change (nmol/L) |
Jadad Score+ |
|
Chel (1998)167 |
45 elderly females in nursing home |
Artificial 1/2 MED on lower back 3 x/wk 12 wks |
25(OH)D^ |
Median 60** ↑42 |
2 |
|
The Netherlands (52°12' N) |
|
RIA |
|
||
|
85 y |
|
|
|
|
|
|
|
|
|
Median (25,75th percentile) 18 (12, 25) |
|
|
|
NR |
93% had values < 30 nmol/L 60% had values < 20 nmol/L |
|
|
|
|
|
Public |
Vitamin D3 400 IU/d |
23 (14, 28) |
60** ↑37 |
|
|
|
|
|
Control |
12 (8, 18) |
NS |
|
|
|
NR |
|
|
|
|
|
Falkenbach (1993)174 |
24 healthy young men |
Artificial UV-B: higher energy of total UV-B but less energy at wavelengths < 300 nm compared to other group 10x in 12d |
25(OH)D3 |
3 d after exposure: 221.3 (64.0)* 4 wks after exposure: 236.8 (56.0)** |
2 |
|
|
|
RIA |
|
||
|
Germany (50°11' N) |
Age range 21-37 y |
|
|
|
|
|
|
115.5 (88.0) |
|
|
||
|
Winter |
NR |
|
|
|
|
|
Public |
NR |
Lower energy dorsal/ventral irradiation 10x in 12d |
123.8 (63.8) |
3 d after exposure: 196.0 (86.0)* 4 wks after exposure: 152.5 (81.3) |
|
|
Ho (1985)172 |
54 infants (breast-fed) |
Sunlight 2 h × 4 wks, face and hands exposed 12 wks |
25(OH)D^ |
100 (57.5) ↑30 (37.5) ** |
3 |
|
China (39° 55' N) |
Mean age 4.0 (1.7) mo |
CPBA |
|
|
|
|
Sept-October |
|
|
70 (37.5) |
|
|
|
|
20% had values < 27.5 nmol/L |
Control- usual amount of sunshine |
52.5 (37.5) |
45 (35), NS |
|
|
Public |
|
|
|
||
|
|
Asian |
|
|
|
|
|
Author (year) Country (Latitude) Season Funding |
Population, N Mean Age (SD) % Vit D Deficient Ethnicity |
UV Exposure Comparator |
Serum 25(OH)D Assay Baseline (nmol/L) |
Serum 25(OH)D at end of trial or Absolute change (nmol/L) |
Jadad Score+ |
|
Lovell (1988)168 |
38 elderly nursing home residents |
Daily sun exposure to arms and legs (20, 30 and 40 min in April, May and June respectively) 3 mo |
25(OH)D^ |
↑60.6 (26.3-102.5)* |
2 |
|
Australia (27° 28' S) |
|
CPBA |
|
|
|
|
Age 55-95 y |
|
|
|
||
|
Fall/winter |
|
median (range) 32.6 (18.8, 112.8) |
|
|
|
|
|
50% had values < 25 nmol/L |
|
|
||
|
NR |
|
vitamin D3 289 IU/d |
18.3 (10.8, 71.3) |
47.3 (12-87.8) |
|
|
|
Caucasian |
vitamin D3 867 IU/d |
41.1(15.5, 57.8) |
↑24.9* |
|
|
|
|
Control |
18.9 (7.8, 77.3) |
NS |
|
|
Marks (1995)169 |
113 community-dwelling adults |
Sunlight + sunscreen (SPF17) applied daily to hands, arms, head and neck, 7 mo |
25(OH)D^ |
↑11.8 |
4 |
|
Australia (37° 03' S) |
|
CPBA |
|
|
|
|
Age > 40 y |
|
|
|
||
|
Spring/summer |
|
56.6 (95%CI 52-61.2) |
|
|
|
|
|
10% had values < 30 nmol/L |
|
|
|
|
|
Public |
|
|
|
|
|
|
|
|
Sunlight + placebo mean daily UV 137.9 vs. 138.7 J/m2 |
51.6 (95% CI 47-56.2) |
↑12.8 |
|
|
|
NR |
|
|
||
|
Matsouka (1992)170 |
18 medical students |
UV-B suberythemal dose 27mJ/cm2 x1, total body 3 d |
Total and 25(OH)D3 |
mean (SEM) 25(OH)D3 35 (12.5) ↑ 27.5 Total 25 (OH)D: no change |
1 |
|
USA (39° 53' N) |
NR |
HPLC CPBA |
|
||
|
Winter |
NR |
|
mean (SEM) 25(OH)D3 – 12.5 (2.5) |
|
|
|
NR |
Caucasion |
|
|
|
|
|
|
|
vit D2 50,000 IU + UV-B same dose as above |
7.5 (2.5) |
25(OH)D3 35 (12.5) ↑27.5 25(OH)D no change |
|
|
|
|
50,000 IU D2 |
NR |
25(OH)D3 no change 25(OH)D no change |
|
|
Author (year) Country (Latitude) Season Funding |
Population, N Mean Age (SD) % Vit D Deficient Ethnicity |
UV Exposure Comparator |
Serum 25(OH)D Assay Baseline (nmol/L) |
Serum 25(OH)D at end of trial or Absolute change (nmol/L) |
Jadad Score+ |
|
Reid (1986)171 |
15 elderly nursing home residents |
Sunlight 15 min/day Head, neck, forearms, lower legs exposed 4 wks |
25(OH)D^ |
↑7 (2.8) |
1 |
|
New Zealand (37° S ) |
|
CPBA |
|
|
|
|
80 y |
|
|
|
||
|
Spring |
|
mean (SEM) 35 (5) |
|
|
|
|
|
NR |
|
|
|
|
|
Public |
|
Sunlight 30 min/day |
60 (12.5) |
↑18.5 (3)* |
|
|
|
Caucasian |
Control |
60 (15) |
↑5 (2.8) |
|
|
Toss (1982)173 |
42 elderly nursing home residents |
Artificial UVR (270-400 nm) once a week for 12 wks, mean dose 160 mJ/cm2 (ventral/dorsal) |
25(OH)D^ |
~59 |
1 |
|
|
|
|
|
|
|
|
Sweden (57° 43' N) |
|
CPBA |
|
|
|
|
85 y |
|
|
|
||
|
|
|
~27 (from graph) |
|
|
|
|
NR |
NR |
|
|
|
|
|
|
|
Vit D2 150 IU +Ca 600 mg 3X/wk for 12 wks |
~20 |
~42 |
|
|
|
NR |
|
|
|
|
|
|
|
Ca 600 mg |
~24 |
NS |
|
|
Note: *significant change from baseline within IG; ** significant between groups and within group; + Jadad score out of a total of 5; allocation concealment for all studies listed in the table was rated as “unclear” CPBA, competitive protein binding assay; d, day; MED, minimal erythemal dose; min, minutes; mJ, millijoules; mo, month(s); N, north; NR, not reported; NS, not significant; RIA, radioimmunoassay; S, south; SEM, standard error of the mean; UV-B, ultraviolet-B; UVR, ultraviolet radiation; wkly, weekly; wks, weeks; y, year |
|||||
Question 2C. What Is the Effect of Vitamin D Supplementation on Circulating 25(OH)D?
Overview of Relevant RCTs
Study characteristics. A total of 74 RCTs in 81 published reports evaluated the effect of vitamin D supplementation on circulating 25(OH)D concentrations.60,61,90-93,102,105,112-115,117-121,167,168,176-185,185-236 Within the trials, five had the following companion publications: Greer93 had one companion193; Grados191 had two companion papers190,237; Dawson-Hughes184 had one companion185; Schaafsma121 has one companion221; and Sorva224 had two companion papers.225,226 For each trial in this section we refer to the primary publication (Table 12).
Sixty-nine studies were parallel design randomized trials.60,61,90-93,102,105,112-115,117-121,167,168,176-184,186-190,192,194-197,199-207,209-215,217-220,222,224,227,229-236 Four were crossover trials,198,216,223,228 and one a factorial trial.208
Baseline BMI was reported in nineteen trials and ranged from 24.8199 to 32.8 kg/m2.196
Study quality. Five trials112,115,203,210,238 received a rating of 5/5 on the Jadad scale, 13 trials received a rating of 4/592,113,119-121,178,184,190,192,206,219,223,228 and 17 trials were rated 3/5.102,114,117,177,180,183,193,197-200,215,216,218,222,229,231 Thirty-nine trials received a Jadad score of 2/5.60,61,90,91,93,118,167,168,176,179,181,182,186-189,194-196,201,202,204,205,207,209,211-214,217,220,224,227,230,232-236 These ratings indicate that more than half of the studies were of lower quality (Table 12).
Interventions. Vitamin D3 alone was the intervention in 29 trials.60,61,105,113,119,167,168,186-189,194,195,198,200,203,206,208-210,216,223,230-236
Twenty-six trials used vitamin D3 combined with calcium as the intervention.113,114,117,118,121,177,178,180,181,183,184,187,190,192,197,199,200,202,207,213,215,218,219,222,224,228
Fifteen trials used vitamin D2 alone as the intervention.90-93,102,112,115,120,176,179,196,211,212,214,227 and the type of vitamin D was not stated in four trials.168,204,217,220
Three trials had separate vitamin D2 and vitamin D3 arms.61,229,230
Qualitative data synthesis. Baseline serum 25(OH) D concentrations were reported in 61 trials.60,102,105,112-115,117,119-121,167,168,177-181,184,187-190,192,194-210,212,214-220,222-224,227-230,232-236
Twenty-one trials examined the efficacy of vitamin D supplements in vitamin D deficient populations (mean serum 25(OH)D ≤ 30 nmol/L),112,114,119,167,179,180,189,190,197,199,207,209,210,214,218,220,222,224,227,235,236 and three other trials had a subgroup of patients who were vitamin D deficient (≤ 30 nmol/L).90,91,202
Vitamin D assay. The majority of trials (N = 42) used a competitive binding protein assay to measure serum 25 (OH)D concentrations.60,91,93,102,105,112,113,118,119,121,168,176,178-184,190,194-196,198-200,202,204-207,209-211,214,215,220,224,227,232,235,236
Twenty-nine trials used an immunoassay method.61,90,114,115,117,120,167,177,186-189,192,197,201,203,208,212,213,216-218,222,223,228,230,231,233,234 and three trials used HPLC.92,219,229 No trials reported using liquid chromatography-tandem mass spectrometry to measure serum 25(OH)D concentrations.
The qualitative results are presented by age group and additional details are presented in Table 12. For the vitamin D3 (+/- calcium) versus placebo or calcium trials that provided adequate data, the results of quantitative synthesis are presented after the qualitative section. We did not conduct quantitative analyses of vitamin D2 versus placebo due to the smaller number of trials, heterogeneity of trials and lack of adequate data.
Infants
Seven trials included term infants.90-93,182,217,236 Only two trials had a quality score of ≥ 3.92,93 Sample sizes ranged from 30 to 312 and six out of the eight trials were published prior to 1995.
Intervention. Vitamin D2 was used in four trials90-93 vitamin D3 in another236 and the isoform was not stated in three trials.182,217,220 In most trials, infants received daily doses ≤ 400 IU of vitamin D2.90,92,93,182 Zeghoud (1994) administered either 200,000 IU or 100,000 IU vitamin D3,236 and Zeghoud (1997) administered 500 IU versus 1,000 IU daily.91
Vitamin D status. Baseline serum 25(OH)D concentrations were not reported in all trials. In one trial in France, all subjects were vitamin D deficient236 and in another trial by Zeghoud 63 percent had levels <30 nmol/L.91 In another trial the mean cord serum 25(OH)D concentrations were < 27.5 nmol/L in 95 percent of infants90 (Table 12). Serum 25()H)D assays included CPBA in four trials, immunoassay in two and HPLC in one trial.
Zeghoud et al. (1994) randomized 30 healthy formula-fed neonates to receive either 200,000 IU of vitamin D once at birth or 100,000 IU at birth, 3 and 6 months. Mean (SD) serum 25(OH)D concentrations increased to 150 (55) nmol/L with 200,000 IU and to 92 (42) with 100,000 IU, 15 days post dose. In the 100,000 IU treatment arm, the mean (SD) 25(OH)D concentrations 3 months after each dose were 43.7 (24.7), 52.2 (29.2), and 67.5 (30) nmol/L.236
In another trial, Zeghoud (1997) randomized 80 healthy full term neonates to receive either 500 or 1000 IU of vitamin D2/day from birth to three months of age. At birth, 63.7 percent of neonates had serum 25(OH)D concentrations ≤ 30 nmol/L (mean 17.9, SD 7.8), the majority born to mothers who had not received vitamin D supplement. Twenty-seven percent of the mothers had received an oral dose of 100,000 IU vitamin D2 in the sixth to seventh month of pregnancy. Neonates were grouped by 25(OH)D concentration; group 1 (N = 14) had a total vitamin D (both D2 and D3 measured) concentration ≤ 30 nmol/L and elevated serum PTH (> 6.4 pmol/L); group 2 (N = 36) had low 25(OH)D concentrations (mean 22.7 (6.5) nmol/L) without PTH elevation and group 3 (N = 29) had serum 25(OH)D concentrations > 30 nmol/L. One month after beginning the 1,000 IU dose of vitamin D, mean 25(OH)D concentrations ranged from 65 to 70 nmol/L and PTH concentrations were similar amongst the three groups. In the 500 IU arm, mean 25(OH)D concentrations increased and ranged from 58 to 63 nmol/L. However, the levels attained by the vitamin D deficient group were significantly lower than the other groups and serum PTH concentrations remained elevated in 14.3 percent of infants in this group. These results suggest that neonates with vitamin D deficiency may respond differently and require higher doses of supplemental vitamin D.91 This trial had a 35 percent loss to followup. Specker et al. in a trial of 312 term infants from two northern and southern cities in China evaluated three dosages of vitamin D (100, 200 or 400 IU vitamin D2/day for six months) for the prevention of rickets. Mean cord serum vitamin D concentrations at baseline were lower in northern infants than those in the south (12.5 versus 45 nmol/L, samples drawn in the fall). At 6 months, serum 25(OH)D concentrations increased in a dose response manner in the
northern children (30, 38 and 63 nmol/L respectively). However, some infants in the 100 and 200 IU dose arms, remained vitamin D deficient, suggesting that these doses may be inadequate for infants residing in northern latitudes.90
Greer et al. randomized 18 term exclusively breast-fed infants to either 400 IU of vitamin D2 or placebo. After 12 weeks, the mean serum 25(OH)D concentration was 95 nmol/L in vitamin D supplemented compared to 50 nmol/L in controls (p<0.01).93 Similar concentrations of 25(OH)D were seen at the end of 6 months (93 (30) versus 58.8 (25) nmol/L) in another trial by Greer conducted in Caucasian, breast-fed infants with the same dose of vitamin D2.92
In Turkey, Pehlivan randomized 40 breast-fed infants to 400 or 800 IU of vitamin D (isoform not stated). Ninety-five percent of the mothers had 25(OH) D levels below 40 nmol/L, due to lack of sun exposure (mean 25(OH)D level 17.5), and 80 percent had levels <25 nmol/L. The mean serum 25(OH)D was 83.7 (SD 53.7) and 24 percent of the infants had baseline serum 25(OH)D levels below 40 nmol/L. Followup mean (SD) serum 25(OH)D at 16 weeks was 76.9 (35.4) and 91.8 (61.5) nmol/L for the 400 IU and 800 IU groups respectively, and 79.5 percent of infants had 25(OH)D levels within the normal range.217
Chan (1982) randomized 91 term infants into one of three groups, 1) breast-fed alone, 2) breast-fed with 400 IU vitamin D and 3) fed with Similac containing 400 IU/L of vitamin D. Lactating mothers were supplemented with 400 IU vitamin D. After 6 months, mean serum 25(OH)D (SD) levels in the three groups were 47.5 (23.4), 57.5 (40.5), and 45.0(31.6) nmol/L, respectively. There were no significant differences in 25(OH)D between nursing mothers who were supplemented and those who were not.182
|
Summary. Vitamin D supplementation on 25 (OH)D levels in Infants Quantity: Seven trials included infants and few trials used vitamin D3. Quality: Most trials were of lower methodological quality. Consistency: One trial suggested that 200 IU of vitamin D2 may not be enough to prevent vitamin D deficiency, in some infants residing at northern latitudes. A dose-response was noted in this same trial (100, 200, 400 IU/day). Consistent responses to vitamin D supplementation were noted across the seven trials, and some trials suggested that infants who are vitamin D deficient, may respond differently and require higher doses of vitamin D. |
Pregnant Women and Lactating Mothers
There were six trials of vitamin D supplementation in pregnant or lactating women.176,179,186,201,211,220 All trials scored either 1/5 or 2/5 on the Jadad scale. Sample sizes ranged from 40 to 126 women.
Intervention. Three trials administered 1,000 IU vitamin D2 daily176,179,211 and the remaining trials used vitamin D3. Dosages ranged from 400 to 1,000 IU.
Vitamin D status. Assays for circulating 25(OH)D were CPBA in four trials and RIA in two. Brooke included women who were vitamin D deficient, with a mean serum 25(OH)D
concentration of 20 nmol/L179 and the mean serum 25(OH)D at baseline was < 30 nmol/L in another trial.220
Brooke compared 1,000 IU vitamin D2 versus placebo given at 28 weeks to 126 Asian women who were vitamin D deficient and reported large increases in both serum and cord blood with 25(OH)D levels of 168 (increase of 148) versus 16.2 nmol/L in the controls (Table 12). This dose also improved neonatal serum calcium (five infants in the control group had symptomatic hypocalcemia versus none in the vitamin D group). The serum 25(OH)D values in this trial were not, however, replicated in other trials and may be related to the fact that an older CPBA assay was used.
Rothberg et al. randomized nursing mothers to 500 IU or 1,000 IU vitamin D daily (isoform not stated) versus placebo for six weeks post delivery. By day four, serum 25(OH)D (mean, SD) levels in the mothers were 34 (13.5), 36.8 (12.3) and 25(13.8) nmol/L respectively. These mean concentrations were lower than in the other trials and could be due to the fact that the mothers did not receive vitamin D fortified milk or D supplemented diets. By six weeks, the mean 25 (OH)D concentrations were significantly lower in the unsupplemented mothers (26.5 nmol/L) than in supplemented mothers (35 nmol/L). Maternal serum 25(OH)D concentrations correlated directly with infant serum 25(OH)D values.220
In a trial of 77 women conducted in winter, Mallet compared 1,000 IU vitamin D2 to a single dose of 200,000 IU vitamin D2 given in the last trimester versus placebo.211 Mallet reported mean maternal plasma concentrations of 25.3 nmol/L with 1,000 IU, 26.3 nmol/L with 200,000 IU dose compared to 9.4 nmol/L in the controls, levels that were lower than those achieved in the Brooke trial. Cord blood levels increased, but were lower than serum concentrations.
Delvin administered 1,000 IU vitamin D3 to mothers during the last six months of pregnancy compared to no supplement and reported that mean serum 25(OH)D increased significantly to 55 nmol/L versus 27.5 in controls (cord serum 25(OH)D: 45 and 17.5 respectively). Serum 25(OH)D concentrations in infants at 4 days of age were 32.5 (2.5) in the supplemented and 12.5 (2.5) nmol/L in controls.
In a small trial of 18 lactating women, Hollis administered 2,000 IU (1600 IU vitamin D2 and 400 IU vitamin D3 prenatal) versus 4,000 IU vitamin D (1,600 IU D2 and 400 IU D3 prenatal) for 3 months. The serum 25(OH)D concentrations increased by 36.1 nmol/L in the 1,600 IU group (to 90.3 nmol/L) and 44.5 nmol/L with 3,600 IU group (111.3 nmol/L).201 In this trial, serum 25(OH)D levels ranged from 69.5 to 77 nmol/L with 1,600 and 3,600 IU vitamin D2, respectively.
The mean value of 25(OH)D achieved in the treated groups was less than 45 nmol/L in all studies except one in which serum 25(OH)D in mothers at delivery was 168 ± 12.5 nmol/L.179
In a 20 week trial of 100 breast-fed infants in Finland, Ala-Houhala (1985) compared three supplementation protocols in healthy term infant- mother pairs: 1,000 IU or 400 IU of vitamin D2 given to the infants, or 1,000 IU daily provided to the lactating mothers. The mean serum 25(OH)D concentration in the infants receiving 1000 IU increased to 57.5 (28) nmol/L compared to 45 (21) nmol/L with 400 IU vitamin D2. Infants who did not receive supplementation but whose mothers received 1000 IU vitamin D2 during lactation had a mean serum 25(OH)D serum concentration of only 14 (9.4) nmol/L.176 Therefore, supplementing lactating mothers with 1,000 IU during winter months did not increase serum 25(OH)D concentrations in the infant.
There were no randomized trials evaluating the efficacy of 400 IU of vitamin D3 in lactating women.
|
Summary. Vitamin D supplementation on 25 (OH)D levels in Pregnant or Lactating Women Quantity: There were six small trials of vitamin D supplementation in pregnant or lactating women. No randomized trials studied the effect of 400 IU vitamin D3. Three trials used 1,000 IU of vitamin D2 and one trial used 1,000 IU of vitamin D3. Quality: All trials were of low methodological quality. Consistency: 1,000-3,600 IU/day of vitamin D2 and 1,000 IU/d of vitamin D3 resulted in significant increases in serum 25(OH)D concentrations in lactating mothers and in cord blood. One trial found that supplementation of lactating mothers with 1,000 IU of vitamin D2 during winter months did not increase serum 25(OH)D concentrations in the infants. |
Children and Adolescent Populations
Four trials examined the effect of vitamin D supplementation in children or adolescent populations. Two trials were conducted in pre-pubertal children,102,223 one included both prepubertal and post-pubertal children,105 and one was 100 percent adolescent males.194 Sample sizes ranged from 20223 to 179.105
Study quality (Jadad score) was ≥ 3/5 in three trials.102,105,223
Intervention. The intervention was vitamin D2 in one trial,102 and vitamin D3 in the other three trials.105,194,223 Doses ranged from 200 to 2,000 IU per day.
Serum 25(OH)D assays used were CPBA in three trials and RIA in one.
Ala-Houhala administered 400 IU of vitamin D2, 5-7 times per week for a year in Finnish children aged 8-10 years and reported a mean increase in serum 25(OH)D of 22 nmol/L with supplementation compared to a decrease of 2.7 in the placebo group. There was no change in PTH levels. In a crossover trial during winter, Schou et al. administered 600 IU vitamin D3 to 20 healthy children (mean age 9.8 years) and reported in the group given placebo first that the 25(OH)D concentration was 33.7 (SD 10.4) nmol/L, increasing to 50.2 (SD 14.2) nmol/L during vitamin D supplementation. There was no significant effect on PTH concentrations.
In a trial in females aged 10-17 years, 200 IU or 2,000 IU of vitamin D3 were given. The mean increases in serum 25(OH)D concentrations ranged from 8 nmol/L (end of study 43 nmol/L) with 200 IU daily, to 60 nmol/L with 2,000 IU vitamin D3 daily compared to a decrease of 5 nmol/L in controls.105
Guillemant administered 100,000 IU vitamin D3 every two months to adolescent male jockeys and reported that with low dietary calcium intakes, vitamin D3 prevented the wintertime decrease in serum 25(OH)D and rise in serum PTH. The mean increase in serum 25(OH)D was 35 nmol/L.
|
Summary. Vitamin D supplementation on 25(OH)D levels in Children and Adolescents Quantity: There were four trials that examined the effect of vitamin D on 25(OH)D in children or adolescents with doses ranging from 200 to 2,000 IU of vitamin D3/day and 400 IU of vitamin D2. Quality: The study quality was ≥3 in three trials. Consistency: There were consistent increases in 25(OH)D concentrations ranging from 8 nmol/L (200 IU), 16.5 (with 600 IU D3) to 60 nmol/L (2,000 IU of vitamin D3). |
Premenopausal Women and Younger Men
Nine trials were identified that included solely younger adults.60,61,177,187,198,227,229,230,234 Of these, the study quality was ≥ 3 in four trials.177,198,229,234 Most trials were small with sample sizes ranging from 18187 to 116.198 Four additional trials included populations of younger and older adults. Of these, two trials included premenopausal and postmenopausal women; the mean age of women in one of the trials was 47.2 (range 24 - 70 years),216 and the other trial included six premenopausal women who had a mean age of 30 years in a total of 105 participants.232 Two trials included a population of younger and older men.195,196
Interventions. Three trials compared the effect of vitamin D2 to vitamin D3.61,229,230 Eight of the nine trials exclusively in younger adults had at least one treatment arm of vitamin D3 (doses ranged from 600 IU/d to 10,000 IU/d); two studies used vitamin D in combination with calcium.177,187 The doses in vitamin D2 trials ranged from 4,000 IU daily229,230 to 100,000 IU (single dose).227
Serum 25(OH)D was measured by CPBA in three trials,60,198,227 and RIA or HPLC in the others.
Of the three trials that evaluated the effect of vitamin D2 versus D3 in younger adult populations (N = 121), the cohorts included healthy volunteers (mean age 38.9 years),230 healthy pre-menopausal women (mean age 33 years)229 and healthy male volunteers (mean age 33 years).61
In an eight week trial, Tjellsen examined the effect of 4,000 IU vitamin D2 versus 4000 IU vitamin D3 in 19 healthy premenopausal women during September to November.229 Both arms had similar baseline serum 25(OH)D concentrations (measured by HPLC). Tablet analysis revealed that vitamin D3 contained 4,400 IU and vitamin D2 3,800 IU. Treatment with vitamin D2 did not increase total 25(OH)D concentrations (median 88.8 nmol/L, range 49.3-120.8) due to a decrease in vitamin D3 metabolites whereas vitamin D3 significantly increased total serum 25(OH)D from a baseline median of 77.5 (range 46.3 - 100.5) to a median of 113.5 (range 77.5-138.5) nmol/L. The authors concluded that vitamin D2 and vitamin D3 have a differential effect on serum 25(OH)D concentrations.
Trang et al. assessed the efficacy of equimolar amounts of vitamin D2 (4,000 IU daily) or vitamin D3 (4,000 IU daily) on serum 25(OH)D concentrations in 72 volunteers for two weeks during wintertime.230 Mean serum 25(OH)D (SD) levels increased from 43.7 (17.7) nmol/L to 57.4 (13.0) nmol/L, an increase of 13.7 nmol/L, in the vitamin D2 treated subjects and from 41.3 (17.7) nmol/L to 64.6 (17.2) nmol/L, an increase of 23.3 nmol/L, in the vitamin D3 group. The
difference in the increase from baseline in group means was 9.6 nmol/L (95% CI 1.4, 17.8). They also examined responses based on baseline serum 25(OH)D levels and reported larger increases in individuals with lower serum 25(OH)D concentrations. There was no difference from baseline or between groups in mean serum 1,25-(OH)2D.
Armas et al. examined the relative efficacy of vitamin D2 versus vitamin D3 with a single oral 50,000 IU dose over a 28 day period in 30 healthy males (mean age 33 (11.5) years). Baseline serum 25(OH)D concentrations were similar. The mean BMI (SD) of subjects was 27.14 (2.77) kg/m2. Vitamin D2 and D3 produced similar increases in serum 25(OH)D over the first three days suggesting comparable conversion to the 25-hydroxy metabolite. However, by 14 days, serum 25(OH)D concentration peaked in the vitamin D3 treated subjects but fell to baseline in the vitamin D2 treated subjects. The area under the curve of the rise in serum 25(OH)D (SD) at 28 days was 150.5 (58.5) in the vitamin D2 arm and 511.8 (80.9) nmol/L in the vitamin D3 arm (p<0.002). Armas concluded that the vitamin D2 potency was less than one third that of vitamin D3.61
In the five trials that administered vitamin D3 (+/-) calcium to populations of exclusively younger adults,60,177,187,198,234 the reported increases in serum 25(OH)D were 39 nmol/L with 600 IU,177 6 nmol/L with 800 IU,187 92 nmol/L with 5,000 IU and 159 nmol/L with 10,000 IU vitamin D3 daily.60 Vieth234 randomized 73 healthy adult men and women to either 1,000 or 4,000 IU vitamin D3 and the mean increase in serum 25(OH) concentration was 25.4 and 58.4 nmol/L (end of study 25(OH)D concentrations of 68.7 (16.9) and 96.4 (14.6) nmol/L respectively).
Stephens administered 100,000 IU vitamin D2 orally or by injection, to 33 vitamin D deficient (serum 25(OH)D < 12.5 nmol/L) Asian men and women. The mean increase in serum 25(OH)D by one month was 36 nmol/L with a significantly greater mean serum 25(OH)D with oral vitamin D (52 nmol/L) compared to intramuscular vitamin D (32.5 nmol/L). The difference between the two treatment arms was not significant at 3 or 6 months. The variability was also greater with intramuscular vitamin D compared to oral administration.227
|
Summary. Vitamin D supplementation on 25 (OH)D levels in Premenopausal Women and Younger Men Quantity: Ten small trials included premenopausal women and younger males. Three trials these compared vitamin D2 to vitamin D3 in healthy young adults. Of these, one trial analyzed content of the tablets. Two of the three trials used RIA, and one HPLC to measure 25(OH)D. Doses of vitamin D3 ranged from 600 to 10,000 IU/day and vitamin D2 (4,000 IU/day or 50,000 to 100,000 for one dose) Quality: The methodological quality of 8/10 trials was poor. Consistency: Three trials found that vitamin D2 and D3 in healthy adults may have different effects on serum 25(OH)D concentrations. Vitamin D2 appeared to have a smaller effect on serum 25(OH)D, which may have been due to more rapid clearance and/or different metabolism than vitamin D3. One trial compared 100,000 IU vitamin D2 orally versus injection and found a greater variability in response with the intramuscular preparation. A dose-response effect was noted in those trials that used multiple doses of vitamin D3. |
Postmenopausal Women or Older Men
Thirty trials included solely postmenopausal women, older men or a combination of both.113,115,117-121,178,183,184,189,190,192,199,202-206,208,210,212-215,218,219,228,231,233 Four additional trials included a combination of younger and older adults. Two trials also included younger men195,196 and two trials also included premenopausal women.216,232
The study quality was ≥ 3 in 22 trials and sample sizes ranged from 15 to 2578.
Intervention. Of the 30 trials, four assessed the effect of vitamin D2 (+/-calcium) versus placebo or calcium115,120,212,214 and one trial used injectable vitamin D2.115 Seven trials assessed vitamin D3 versus placebo or calcium.119,203,206,208,210,231,239 Fourteen trials assessed vitamin D3 + calcium versus placebo184,190,192,199,213,215 or calcium.113,117,178,183,202,218,219,228 Vitamin D3 dosages ranged from 300 IU199 to 2,000 IU per day.219 In one trial,204 the vitamin D isoform was not reported. In four trials, the comparator was either another dosage of vitamin D3118,233 or the same dosage of vitamin D3 combined with calcium.192 Kenny compared 400 IU vitamin D with calcium carbonate versus vitamin D and calcium citrate.205
Vitamin D status. Seven trials were conducted in populations with mean serum 25(OH)D concentrations ≤ 30 nmol/L, range 17.5 to 27.8 nmol/L.119,189,190,199,210,214,218
Serum 25(OH)D assays used were CPBA in 16 trials, RIA in 13 trials and HPLC in one trial.
In the vitamin D deficient trials, doses of vitamin D3 ranged from 200 IU189 to 880 IU/day,218 and vitamin D2 was given as a 15,000 IU weekly dose in one trial.214 Serum 25(OH)D concentrations with daily doses of either 200 IU or 300 IU of vitamin D3 resulted in a mean increase of 11.4 nmol/L relative to placebo,189,199 while 400 IU increased serum 25(OH)D by 38 nmol/L relative to placebo.119
Deroisy reported that with 200 IU of vitamin D3, the end of study mean serum 25(OH)D (SD) was 42.5 (16), and PTH concentrations decreased to 2.45 pmol/L.189
Grados used 800 IU of vitamin D3 combined with calcium 1,000 mg versus placebo and reported a median increase in serum 25(OH)D of 45 nmol/L relative to placebo, consistent with a dose-response.190 Serum PTH concentrations normalized (3.1, range 2.3-4.1) in the vitamin D3 arm and remained elevated in the placebo group.
Pfeifer administered 880 IU vitamin D3 with 1,200 mg calcium versus calcium to 148 older women (mean serum 25(OH)D <30 nmol/L) . The mean increase was 22.16 relative to placebo and serum PTH decreased from 6.11 to 4.55 with vitamin D3 versus 5.26 in the placebo group.
In the trial with vitamin D2, the mean increase in serum 25(OH)D was 33.6 nmol/L relative to placebo.214
Aloia et al. randomized 208 African-American women to either 800 IU vitamin D3 + calcium versus calcium.117 In the vitamin D3 arm, after two years the dose of vitamin D was increased to 2,000 IU daily. The baseline mean serum 25(OH)D concentrations was 48.3 nmol/L and after 3 months increased by 22.75 with 800 IU, and 39 nmol/L with 2,000 IU/day, relative to placebo.
In nine trials that used either daily vitamin D3 or D2 as the intervention, mean serum 25(OH)D concentrations of over 75 nmol/L were achieved,113,117,118,202,204,212,213,233,239 with doses ranging from 400 IU vitamin D (isoform not stated)240 to 2,000 IU D3 per day.117,219
Meier et al. reported that 500 IU of vitamin D3 combined with 500 mg calcium prevented the rise in serum PTH and the increase in bone turnover seen with winter declines in vitamin D status (mean baseline 25(OH)D of 75 nmol/L).213
Vieth compared 600 IU versus 4,000 IU vitamin D3 in individuals at risk for vitamin D deficiency. Baseline serum 25(OH)D levels of 49 and 46 nmol/L increased to 79 and 112 nmol/L, respectively.233
Goussous et al. assessed the effect of 800 IU vitamin D3 plus 1,000 mg calcium versus 800 IU vitamin D3 daily on 25(OH)D in healthy older men and women.192 Mean baseline serum 25(OH)D concentrations in the two arms were 47.9 and 49.1 nmol/L, respectively. Increases in serum 25(OH)D (SD) concentrations were not statistically significant in the vitamin D3 and calcium group (16.25 (14.8) nmol/L) compared to the vitamin D3 alone group (16.6 (17.4) nmol/L). The authors concluded that in older healthy men and women, the level of calcium intake (500-1500 mg) does not affect the serum 25(OH)D response to 800 IU vitamin D3.
Dawson-Hughes et al. assessed the effect of 100 IU versus 700 IU of vitamin D3 (plus 500 mg calcium) in healthy postmenopausal women.118 Seasonal variation was included as part of the study dosing. After 9 months, the 700 IU vitamin D3 arm attained a mean serum 25(OH)D of 100.1 (24.5) nmol/L versus 66.3 (25.5) nmol/L with 100 IU vitamin D3 (absolute difference 33.8 nmol/L). BMI was reported but the authors did not report if BMI affected the individual responses to vitamin D3.
Elderly Populations
Fourteen trials were conducted in elderly individuals residing in either long-term care or nursing homes.112,114,167,168,180,181,188,197,200,207,209,222,224,235 One trial202 included an arm with elderly institutionalized women. The study quality was ≥ 3/5 in seven of the 14 trials. Sample sizes ranged from 30 to 3270.181 The majority of the studies reported a mean age in the ninth decade.
Intervention. Of the 14 trials, two trials assessed vitamin D2 versus placebo,112,197 seven trials evaluated vitamin D3 versus placebo,167,168,200,209,210,224,235 and four trials assessed vitamin D3 plus calcium versus placebo or calcium.114,180,181,207 Two trials compared vitamin D3 plus calcium to a different dose of vitamin D3.188,222
Vitamin D status. Assays used to determine serum 25(OH)D levels were CPBA in eight trials and RIA in six trials. Eleven of fourteen trials included populations that were vitamin D deficient at baseline112,114,167,180,197,202,207,209,222,224,235 with mean serum 25(OH)D concentrations ranging from 6.5222 to 30 nmol/L.114 In one trial, a subgroup of institutionalized subjects were reported to have serum 25(OH)D levels ≤ 30 nmol/L.202
With vitamin D2, Harwood197 reported increases ranging from 12 to 40 nmol/L after a single 300,000 IU intramuscular injection and another trial reported an increase of 98 nmol/L to an end of study serum 25(OH)D of 115 nmol/L with 9,000 IU oral vitamin D2 daily.112
Sorva224 using 1,000 IU/day of vitamin D3 in geriatric long-term care patients reported an increase of 46 nmol/L relative to control, and intact PTH levels decreased from 3.4 to 2.9 pmol/L versus an increase in placebo from 4.0 to 4.4 pmol/L.
Honkanen et al. used a dose of 1,800 IU vitamin D3 daily and the serum 25(OH)D concentrations increased by 39.9 nmol/L or 52.6 nmol/L (95% CI 49, 57) when compared to placebo. Serum PTH data were not provided.202
Weisman administered a single dose of vitamin D3 (100,000 IU) to 57 elderly nursing home residents and after five months, the mean increase in serum 25(OH)D was 65 nmol/L, relative to placebo. One limitation of this trial was the significant baseline differences in serum 25(OH)D between intervention and controls.
Sebert et al. assessed a combination tablet of 400 IU vitamin D3 combined with 500 mg calcium given twice daily versus separate administration of 800 IU vitamin D3 (8 drops) and 500 mg calcium to evaluate if the combination had a different effect on serum 25(OH)D in elderly deficient institutionalized subjects.222 Baseline plasma 25(OH)D levels increased from 6.5 to 36.5 nmol/L at 6 months (p<0.001) with the combination tablet and from 6.3 to 33.75 nmol/L in the comparator arm (calcium and separate vitamin D drops) (p<0.001), and PTH levels decreased by a similar amount.222
The increases in mean serum 25(OH)D with 800 IU of vitamin D3 ranged from 21197 to 65 nmol/L.114 Krieg et al. used 880 IU of vitamin D3 with 1,000 mg calcium versus placebo and they reported a mean increase in 25(OH)D of 51.5 (end of study 25(OH)D of 66.2 nmol/L) compared to placebo and a decline in serum PTH values to 32.1 (2.4) after one year versus an increase in PTH in controls to 55.1 (4.4) pmol/L. Combining results from the two trials in vitamin D deficient populations that used similar doses of vitamin D3 (880 or 1000 IU), and assays, resulted in an increase of 51 nmol/L (95% CI 46-57) versus placebo.207,224
End of study mean 25(OH)D levels (>75 nmol) were achieved in two trials that used vitamin D3 doses of 800 IU in vitamin D deficient populations.180,209
In four trials that had mean baseline serum 25(OH)D concentrations >30 nmol/L168,181,188,200 and used doses from 800 IU to 2,000 IU vitamin D3, serum 25(OH)D levels > 75 nmol/L were attained.
Himmelstein used 2,000 IU vitamin D3 daily in a population of elderly nursing home residents with mean serum 25(OH)D of 40-50 nmol/L and reported an increase of 42.4 (95% CI 32-53) nmol/L relative to the control group. PTH levels were not affected after supplementation.200
In two small trials in men, Harris compared the response to vitamin D supplementation in younger versus older men.195,196 In one trial of 1,800 IU vitamin D2, there was a significant difference in serum 25(OH)D concentrations with a 90 percent greater increase in younger men (30.4 versus 7.5 nmol/L). In the trial that used 800 IU vitamin D3, there was no difference in mean absolute increase in younger versus older men. The difference in results may be explained by differences in the dose used in each trial or may be due to differential metabolism of vitamin D2 in different age groups (e.g., metabolism to 24(OH)D).
|
Summary. Effect of Supplementation on Postmenopausal Women and Older Men Quantity: 44 trials were conducted exclusively in postmenopausal women and older men, with 14 of these in elderly populations living in long-term care or nursing homes. One trial was |
|
in early postmenopausal women. Doses of vitamin D3 ranged from 100 to 4000 IU/day and 9,000 IU vitamin D2. One trial was conducted in African American women. Quality: Methodological quality was ≥ 3 in 24 trials. Consistency: One trial found that wintertime declines in serum 25(OH)D were prevented with 500 IU of vitamin D3 daily. A dose response with increasing doses of vitamin D3 was noted although there was a variability in response to similar doses across trials that may have been due to differences in serum 25(OH)D assays or baseline 25(OH)D status. It was difficult to comment on how the results differed by assay, since there were often other differences between trials such as the dose used. Similarly, although some trials suggested a greater response to vitamin D in populations that were vitamin D deficient at baseline compared to those who were not, this was difficult to assess due to heterogeneity of assays. |
Meta-analysis of Trials of Oral Vitamin D3 (+/- Calcium) on Serum 25(OH)D Concentrations
Study selection. As summarized above, 44 RCTs investigated the effect of oral vitamin D3 supplementation (+/− calcium) versus no treatment, placebo or calcium on serum 25(OH)D concentrations.60,61,105,113,114,117,119,121,167,168,177,178,180,181,183,184,186,187,189,190,194,195,197,199,200,202,203,206-210,213,215,216,218,219,223,224,228,230-232,235
Seventeen trials administered oral vitamin D3 supplements with or without calcium versus no treatment, placebo or calcium on an intermittent or daily basis and presented sufficient data to combine results of the absolute change in serum 25(OH)D concentrations.60,105,113,177,181,184,189,194,195,199,200,202,207,216,218,219,224 Due to a significant and unexplained difference in baseline serum 25(OH)D levels between the treatment and control groups, we excluded the study by Riis et al.219 A total of 16 trials were therefore included in the meta-analysis. Two trials60,105 included more than one treatment arm with different doses of vitamin D3 and one placebo group, so we used results from only one treatment group (i.e., 1,000 IU/day60 and 2,000 IU/day105) in all analyses. The study by Heaney et al.60 warrants discussion as multiple measurements of serum 25(OH)D were taken over time. A compartment model was used to derive a monotonic form for concentration as a function of time. This model was fitted to each individual's data to extrapolate an estimate of the equilibrium (asymptotic) 25(OH)D concentration. The estimates from the Heaney study differ from the other included studies that did not require extrapolation.
The effect of vitamin D3supplementation (+/− calcium) versus placebo or calcium on 25(OH)D concentrations. Combining the 16 trials with a random effects model demonstrated large heterogeneity of treatment effect, (I2 = 97.7 percent). However, the point estimates for each trial consistently favored vitamin D3.60,105,113,177,181,184,189,194,195,199,200,202,207,216,218,224 (Figure 5a).
Figure 5a. The Effect of Vitamin D3Supplementation (+/- calcium) vs. Placebo or Calcium on Absolute Change in 25(OH)D Concentrations.
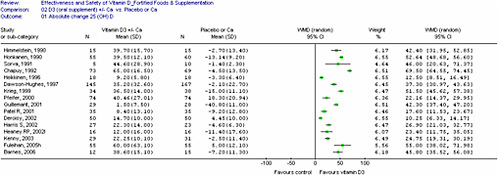
We conducted subgroup and sensitivity analyses and a meta-regression on dose to explore potential sources of heterogeneity.
Subgroup analyses were conducted in an attempt to explain heterogeneity and included: (1) dosage of vitamin D3 (i.e., grouped by ≤ 400 versus. > 400 IU/day), (2) study population (i.e., older institutionalized, older community-dwelling versus younger community-dwelling individuals), (3) frequency of administration (i.e., intermittent versus daily vitamin D3), (4) assays used (i.e., CPBA versus RIA and HPLC), and (5) study quality (high quality studies defined by a Jadad score ≥ 3). Other potential explanations for the heterogeneity are the potency of the vitamin D supplement and whether 25(OH)D3 or total 25(OH)D was measured. Only one trial 60 assessed 25(OH)D3 and the potency of the vitamin D supplement was measured in only two trials.60,183
Subgroup Analyses
(1) Dose. To examine the effect of dose, the daily dose was derived for the two studies that used an intermittent dose of vitamin D3.105,194 The trials were classified by dose (i.e., (< 400 IU/day),189,199 versus (≥ 400 IU/day)).60,105,113,177,181,184,194,195,200,202,207,216,218,224
Combined results of two trials using < 400 IU/day demonstrated a significant increase in serum 25(OH)D levels [N = 136, WMD 11.36 (95% CI 8.56, 14.15), heterogeneity I2 = 0 percent].189,199 Combined results of trials that used doses ≥ 400 IU was not possible due to large heterogeneity of the treatment effect (WMD varied from 17.6 to 52.6) (I2 = 96.0 percent). The weighted mean differences ranged from 17.6 to 69.5 (Figure 5b).
Figure 5b. The Effects of Vitamin D3 Supplementation (with/without calcium) vs. Placebo or Calcium on Absolute Change in 25(OH)D Levels by Dose.
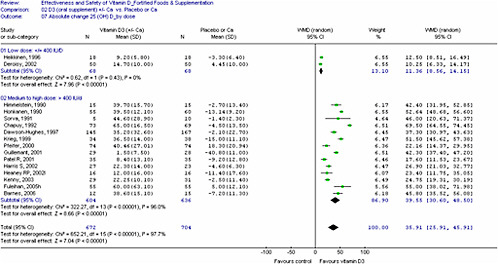
(2) Study Population. To explore the effect of age and health status of the study participants, the trials were classified as follows: (1) community-dwelling younger adults,60,105,177,194,195,216 (2) community-dwelling older adults,113,184,189,195,199,202,218 and (3) elderly institutionalized individuals.181,200,202,207,224 Two studies reported results for two different populations.195,202 Combining the trials by the defined subgroups was not possible due to heterogeneity of the treatment effect and did not explain the overall heterogeneity (community-dwelling younger adults: heterogeneity I2 = 85.8 percent; community-dwelling older adults: heterogeneity I2 = 97.0 percent; elderly institutionalized individuals: I2 = 89 percent).
Baseline vitamin D status of the study populations were categorized as either vitamin D deficient at baseline (i.e. serum 25(OH)D levels < 30 nmol/L)189,199,202,207,218,224 or serum 25(OH)D > 30 nmol/L.60,105,113,177,181,184,194,195,200,202,216 Results demonstrated that combining of trials was not possible due to heterogeneity of the treatment effect (vitamin D deficient: heterogeneity I2 = 98.1 percent versus not vitamin D deficient: heterogeneity I2 = 96.3 percent) (Figure 5c).
Figure 5c. The Effects of Vitamin D3Supplementation (with/without calcium) vs. Placebo or Calcium on Absolute Change in 25(OH)D Levels by Vitamin D Status.
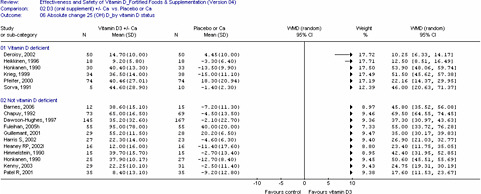
When we combined data from two trials207,224 that had similar population characteristics (age, institutionalized participants, vitamin D deficiency) and dose (880 -1000 IU), the increase in serum 25(OH)D compared to control was 51.2 nmol/L (95% CI 45.5, 57), I2 = 0.
(3) Vitamin D assay. To explore the impact of different assays, the included trials were divided into three groups as defined a priori: RIA,177,189,216,218 CPBA 60,105,113,181,184,194,195,199,200,202,207,224 or HPLC. None of the included studies used HPLC.
Combining was not possible due to heterogeneity of the treatment effect (RIA: heterogeneity I2 = 93 percent versus CPBA: heterogeneity I2 = 97.5 percent).
Other subgroup analyses conducted but not presented here included (1) baseline 25(OH)D levels by classifying those with 25(OH)D levels as deficient and (2) compliance. These analyses did not reduce the heterogeneity and therefore did not permit pooling of the results.
Sensitivity analyses. The sensitivity analyses included: (1) study quality and, (2) loss to followup. Allocation concealment was not explored, since only one study reported adequate allocation concealment.
The included studies were divided into high (quality score > 3 on the Jadad scale)105,113,177,184,199,200,216,218 versus low quality subgroups.60,181,189,194,195,202,207,224 However, combining was not possible due to heterogeneity of the treatment effects (high quality: heterogeneity I2 = 93.7 percent versus low quality: heterogeneity I2 = 98.2 percent).
The effect of loss to followup was explored by grouping the trials into those that reported a loss of over 20 percent181,207 versus less than 20 percent.105,113,177,184,189,194,195,199,202,218,224 Combining trials was not possible due to heterogeneity of the treatment effects (loss to followup over 20 percent: heterogeneity I2 = 95.3 percent versus less than 20 percent: heterogeneity I2 = 97.2 percent).
Meta-regression on dose. A meta-regression of the 16 trials (a weighted linear mixed effects model estimated by REML), N = 1376, was conducted to estimate the extent to which
dose of vitamin D3 explained the heterogeneity of the treatment effects. Results demonstrated a significant association between the daily dose of oral vitamin D3 on serum 25(OH)D concentrations and the regression coefficient [beta=0.016 (95% CI 0.007,0.032), p = 0.042] suggesting that if the dose of vitamin D3 increases by 1 IU, the serum 25(OH)D concentrations can be expected to increase by 0.016 nmol/L. The estimated between-study variance (tau-squared) was reduced from 393.6 to 222.9. See Figure 5d for a graphical representation of the treatment effect versus daily dose.
Figure 5d. 25(OH)D Treatment Effect vs. Daily Oral Vitamin D3Dose
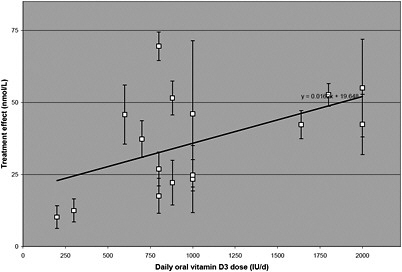
The effect of oral vitamin D3with/without calcium supplementation on serum concentrations of serum PTH. The effect of vitamin D supplementation on serum PTH was assessed in 14 of the 16 trials.60,113,177,181,184,189,194,195,199,200,207,216,218,224
Vitamin D supplementation significantly decreased PTH concentrations in nine trials (four of which were in vitamin D deficient populations)60,113,181,184,189,207,216,218,224 or was sufficient to maintain serum iPTH levels, in spite of seasonal effects, in one trial.194 Nine trials used a vitamin D3 dose of ≥ 700 IU.60,113,181,184,194,207,216,218,224 Explanations for the failure to observe a decrease in serum PTH include that the vitamin D dose may have been too low for a population with low baseline 25(OH)D concentrations,199 or that serum 25(OH)D may have been above the threshold where further changes in PTH would occur. In addition, PTH is modulated by other factors such as calcium intake.19
|
Summary. Quantitative Analysis Seventeen trials of vitamin D3 provided sufficient data to conduct a quantitative analysis. The treatment effect of oral vitamin D3 supplementation increases with increasing doses. Combining trials by different clinical and methodological characteristics did not change the direction of this effect nor did it reduce the heterogeneity found. Meta-regression results demonstrated a significant association between dose and serum 25(OH)D levels (p = 0.04). The meta -regression (exploratory only) results suggested that 100 IU of vitamin D3 will increase the serum 25(OH)D concentrations by 1-2 nmol/L. This suggests that doses of 400-800 IU daily may be inadequate to prevent vitamin D deficiency in at-risk individuals. Vitamin D3 doses of 700 IU daily or more significantly and consistently decreased serum concentrations of PTH in vitamin D deficient populations. Given the limitations in the measurement of 25(OH)D concentrations and the lack of standardization and calibration, it is difficult to suggest precise recommendations for adequate intakes, especially since optimal levels of serum 25(OH)D have not been defined. |
Table 12. RCTs on Vitamin D Supplementation and Serum 25(OH)D Levels
|
Author (Year) Country Funding |
Population, N Ethnicity BMI (kg/m2) |
Vitamin D Supplement Duration |
25(OH)D Baseline Mean (SD) nmol/L |
25(OH)D End of Study Mean (SD) nmol/L Assay |
Jadad Score |
|
Infants (N=7) |
|||||
|
Chan (1982)182 |
91 Term infants |
IG1: Breast-fed + vit D 400 IU/d IG2: Similac (contains vit D 400 IU /L) CG: Breast-fed with no vit D supplementation |
IG1 35 (2.5) IG2 50 (5) CG 50 (7.5) |
IG1 57.5 (7.5) IG2 45.0 (5) CG 47.5 (5) |
1 |
|
U.S. |
Caucasian |
|
|||
|
Public/Private |
NR |
|
CPBA |
|
|
|
|
|
6 mo |
|
|
|
|
Greer (1982)93 Greer, 1981193 |
18 Healthy, breast fed infants |
IG1: 400 IU/d D2 CG: placebo |
NR (no differences at start of study) |
IG1 95 CG 50 (p<0.01) at 12 wks |
2 |
|
U.S. |
17 Caucasian, 1 Asian |
12 wks with 52 wk followup data |
|
|
|
|
|
|
|
CPBA |
|
|
|
Public |
|
|
|
|
|
|
|
NR |
|
|
|
|
|
Greer (1989)92 |
46 Human milk-fed term infants |
IG1:400 IU/d D2 CG: Placebo |
IG1 59.7 (11.78) CG 58.8 (19.13) |
IG1 92.4 (29.7) CG 58.8 (24.9) |
3 |
|
U.S. |
|
|
|
|
|
|
|
Caucasian |
6 mo |
|
HPLC |
|
|
Public |
|
|
|
|
|
|
|
NR |
|
|
|
|
|
Pehlivan (2003)217 |
40 Breast fed infants born to mothers with 25(OH)D levels < 25 nmol/L |
IG1: vit D 400 IU/d IG2: vit D 800 IU/d [given to newborns at the start of the 2nd week] |
83.7 (53.7) |
IG1 76.9 (35.4) IG2 91.8 (61.5) |
1 |
|
Turkey |
|
|
|
||
|
IA |
|||||
|
NR |
|
|
|
|
|
|
|
NR |
16 wks |
|
|
|
|
|
NR |
|
|
|
|
|
Author (year) Country Funding |
Population, N Ethnicity BMI (kg/m2) |
Vitamin D Supplement Duration |
25(OH)D Baseline Mean (SD) nmol/L |
25(OH)D End of Study Mean (SD) nmol/L Assay |
Jadad Score |
|
Specker (1992)90 |
312 Term infants |
IG1:100 IU/d IG2: 200 IU/d IG3: 400 IU/d vit D2 |
(Cord serum by location and season of birth) North: Spring 15.0, Fall 12.5 South: Spring 30.0, Fall 45.0 |
Mean (range) North: IG1 30 (undetectable (<7.5)-135) IG2 37.5 (undetectable-175) IG3 62.5 (undetectable-168) South: IG1 50 (10-155) IG2 55 (10-175) IG3 62.5 (undetectable-185) |
2 |
|
U.S. |
Asian |
|
|
||
|
Public |
NR |
6 mo |
|
||
|
|
|
|
|
RIA |
|
|
Zeghoud (1994)236 (Only RCT included) |
30 Healthy neonates Formula fed |
IG1: 200,000 IU vit D3 at birth (single dose) IG2: 100,000 IU D3 at birth, 3 and 6 mo |
All subjects had values < <25 nmol/L. |
IG1 150 (55) 2 wks after dose IG2 NR for 2 wks after dose; 67.5 (30) 3 mo post 3rd dose |
1 |
|
|
NR |
|
|||
|
France |
|
|
|
|
|
|
|
NR |
9 mo |
|
|
|
|
NR |
|
|
|
CPBA |
|
|
Zeghoud (1997)91 |
80 Healthy neonates and their mothers |
IG1: 500 IU/d vit D2 IG2: 1000 IU/d vit D2 |
Grouped by 25(OH)D level: Grp 1: (< 30nmol/L, high PTH) 17.9 (7.8); Grp 2: (< 30) PTH, 22.7 (6.5) Grp 3: (> 30) 43.7 (10.6) |
∆ 25(OH)D (3 mo): Grp 1: IG1 58, IG2 70; Grp 2: IG1 63, IG2 68; Grp 3: IG1 61, IG2 65 (SD not estimable- Figure 4) |
1 |
|
France |
|
|
|
||
|
|
79 were European |
birth to 3 mo |
|
||
|
NR |
|
|
|
||
|
|
NR |
|
|
|
|
|
|
|
|
CPBA |
|
|
Author (year) Country Funding |
Population, N Ethnicity BMI (kg/m2) |
Vitamin D Supplement Duration |
25(OH)D Baseline Mean (SD) nmol/L |
25(OH)D End of Study Mean (SD) nmol/L Assay |
Jadad Score |
|
Pregnant Women and Lactating Mothers (N=6) |
|||||
|
Ala-Houhala (1985)176 |
100 Healthy term mother-infant dyads |
IG1: 1,000 IU/d vit D2 after delivery (mothers) IG2: 400 IU/d vit D2 (infants) IG3: 1,000 IU/d vt D2 (infants) |
infants IG1 23.8 IG2 17.5 IG3 22.5 |
[Winter groups] IG1 14.0 (9.25) IG2 45.0 (21.0) IG3 57.0 (28.0) |
1 |
|
Finland |
NR |
|
|||
|
Public |
NR |
5 mo |
|
CPBA |
|
|
Brooke (1980)179 |
126 Pregnant women |
IG1: 1,000 IU/d vit D2 IG2: placebo |
[At allocation, for both groups 28 wks] |
Maternal serum/Cord IG1 168.0 (95.2)/138(11) CG 16.2 (22.1)/10(2) |
2 |
|
U.K. |
Asian |
|
|
|
|
|
|
|
last trimester |
20.1 (21.4) |
|
|
|
Public |
NR |
|
|
CPBA |
|
|
Delvin (1986)186 |
40 Pregnant women |
IG1: 1,000 IU/d vit D3 CG: no supplement |
At delivery IG1 65 (17.5) CG 32.5 (20) |
Mean (SEM) Maternal serum/cord IG1 55(10)/45.0 (5) CG 27.5(11) 17.5 (2.5) (p<0.0005) |
1 |
|
France |
NR |
|
|
||
|
6 mo of pregnancy to delivery |
|||||
|
Public/Private |
NR |
|
|
|
|
|
|
|
|
|
RIA |
|
|
Hollis (2004)201 |
18 lactating mothers and 18 nursing infants |
IG1: 1,600 IU vit D2 and 400 IU D3 (total 2000 IU) IG2: 3,600 IU D2 and 400 IU D3 total 4,000 IU) |
Mean (SEM) Mothers: IG1 69.0 (8.3) IG2 82.3 (6.0) |
Mean (SEM) Mothers: IG1 90.3 (5.8) IG2 111.3 (9.8) |
2 |
|
U.S. |
|
||||
|
Public |
African American: IG1 33.3%; IG2 22.2%; White: IG1 66.7%; IG2 77.8% |
|
|
|
|
|
|
3 mo |
Infants: IG1 19.8 (2.8) IG2 33.5 (8.3) |
Infants: IG1 69.5 (9.8) IG2 77.0 (12.5) |
|
|
|
|
NR |
|
|
RIA |
|
|
Author (year) Country Funding |
Population, N Ethnicity BMI (kg/m2) |
Vitamin D Supplement Duration |
25(OH)D Baseline Mean (SD) nmol/L |
25(OH)D End of Study Mean (SD) nmol/L Assay |
Jadad Score |
|
Mallet (1986)211 |
77 Pregnant women |
IG1: 1,000 IU/d vit D2 in last 3 mo of pregnancy IG2: 200,000 IU vit D2 (single dose IG3: no supplement |
NR |
Maternal/cord plasma IG1 25.3 (7.7)/15.7 (5.1) IG2 26.0 (6.4)/18.2 (5.2) CG 9.4 (4.9)/5.3 (2.5) |
2 |
|
France |
NR |
|
|
||
|
NR |
NR |
|
|
||
|
|
|
3 mo |
|
CPBA |
|
|
Rothberg (1982)220 |
77 Term mother-infant pairs |
IG1: 500 IU/d vit D IG2: 1,000 IU/d vit D CG: placebo |
Day 4 mothers: 29.8 (15.0) infants: 22.3 (17.8) |
Mothers: IG1 34.0 (13.5) IG2 36.8 (12.3) CG 25.0 (13.8) |
2 |
|
South Africa |
Caucasian |
|
|
|
|
|
|
|
6 wks (mothers) |
|
|
|
|
Public |
NR |
|
|
Infants: IG1 25.5 (13.8) IG2 23.5 (5.3) CG 2.8 (3.5) |
|
|
|
|
|
|
CPBA |
|
|
Author (year) Country Funding |
Population, N Ethnicity BMI (kg/m2) |
Vitamin D Supplement Duration |
25(OH)D Baseline Mean (SD) nmol/L |
25(OH)D End of Study Mean (SD) nmol/L Assay |
Jadad Score |
|
Children and Adolescent Populations (N=4) |
|||||
|
Ala-Houhala 1988)102 |
60 Healthy 8 - 10 year old children |
IG1: 400 IU vit D2 (5-7x per wk) CG: placebo 1 y |
IG1 49.3 (19.0) CG 46.0 (15.5) |
IG1 71.3 (23.8) CG 43.3 (19.5) |
3 |
|
Finland |
NR |
|
|
CPBA |
|
|
|
|
NR |
|
|
|
|
Public |
NR |
|
|
|
|
|
Guillement (2001)194 |
59 Adolescent boys at a jockey training school |
IG1: 100,000 IU vit D3 q 2 mo CG: Placebo |
IG1 53.7 (12.2) CG 61.0 (15.5) |
IG1 55.2 (11.5) CG 20.2 (6.5) |
2 |
|
France |
|
6 mo |
|
CPBA |
|
|
|
Caucasian |
|
|
|
|
|
NR |
|
|
|
|
|
|
|
NR |
|
|
|
|
|
Fuleihan (2006)105 |
179 10 - 17 y old girls |
IG1: 1,400 IU/wk vit D3 IG2: 14,000 IU/wk vit D3 CG: placebo |
IG1 35 (23) IG2 35 (20) CG 35 (18) |
IG1 42.5 (15) IG2 95 (78) CG 40 (20) |
4 |
|
Lebanon |
NR |
|
|||
|
Private |
NR |
12 mo |
|
CPBA |
|
|
Schou (2003)223 |
20 Healthy children mean age 9.8 y |
IG1: 600 IU/d vit D3 first × 4 wks, then placebo after washout IG2: placebo first × 4 wks, then 600 IU/d vit D3 (crossover) |
Values while receiving placebo: IG1 (receiving placebo first): 33.7 (10.4) IG2 (receiving placebo second): 32.3 (12.3) |
IG1(receiving vit D second): 50.2 (4.5) IG2 (receiving vit D first): 43.4 (8.7) |
3 |
|
Denmark |
|
|
|||
|
|
Caucasian |
|
|||
|
NR |
|
|
|
|
|
|
|
NR |
2 × 4 wk treatment periods with 2 wk washout in between treatments |
|
|
|
|
|
|
|
RIA |
|
|
|
Author (year) Country Funding |
Population, N Ethnicity BMI (kg/m2) |
Vitamin D Supplement Duration |
25(OH)D Baseline Mean (SD) nmol/L |
25(OH)D End of Study Mean (SD) nmol/L Assay |
Jadad Score |
|
Premenopausal Women and Younger Men (N=9) |
|||||
|
Armas (2004)61 |
30 Healthy adult men age 20 - 61 y |
IG1: 50,000 IU vit D2 (1 tablet) IG2: 50,000 IU vit D3 (10 tablets) CG: no supplement |
NR (not estimable from graph) |
AUC28 (area under the curve the increment in 25(OH)D above baseline, adjusted for mean rise in untreated controls) IG1(D2): 150.5 (58.5) nmol-d/I IG2 (D3): 511.8 (80.9) nmol-d/I (p<0.002) |
1 |
|
U.S. |
|
|
|
||
|
|
NR |
|
|
|
|
|
|
|
28 d |
|
|
|
|
Public |
|
|
|
|
|
|
|
27.14 (2.7) |
|
|
|
|
|
|
|
(5,000 IU D3 tablets assayed and contained 5513 IU) |
|
|
|
|
|
|
|
|
RIA |
|
|
Barnes (2006)177 |
30 Healthy 18 - 27 y old university students |
IG1: 600 IU/d vit D3 + 1,500 mg/d Ca CG: 1,500 mg/d Ca |
IG1 47.9 (16.0) CG 55.5 (18.6) |
IG1 86.5 (24.5) CG 48.3 (16.8) |
3 |
|
Northern Ireland |
|
|
|
||
|
|
|
|
|
IA (ELISA) |
|
|
NR |
NR |
8 wks |
|
|
|
|
|
IG 24.8 (4.41) CG 22.9 (1.83) |
|
|
|
|
|
Deroisy (1998)187 |
18 Young adult men |
three different formulations of 800 IU/d D3 + 1,000 mg/d Ca: Orocal (IG1); Ideos (IG2); Cacit (IG3) CG: placebo |
Mean (SEM) IG1 67.8 (7.4) IG2 69.4 (8.0) IG3 55.2 (5.4) CG 69.0 (7.6) |
Mean (SEM) IG1 73.7 (6.6) IG2 67.6 (7.6) IG3 56.2 (3.6) CG 62.1 (5.9) (Day 8) |
2 |
|
Belgium |
NR |
|
|||
|
Private |
NR |
|
|||
|
|
|
8 days |
|
|
|
|
|
|
|
|
RIA |
|
|
Heaney (1997)198 |
116 Adult men |
IG1:1,000 IU/d D3 IG2: 5,000 IU/d D3 IG3: 10,000 IU/d D3 |
Median (IQR) 69 (53-84) |
% ∆ from baseline IG1 7.89 (4.3) IG2 3.10 (5.8) IG3 44.02 (6.8) |
3 |
|
U.S. |
2 Hispanic, 3 African American, 5 Asian, 106 Caucasian |
|
|
||
|
Public |
8 wks |
|
|
|
|
|
|
|
|
|
CPBA |
|
|
|
Median (IQR) 25.3 (23.8-27.3) |
|
|
|
|
|
Author (year) Country Funding |
Population, Ethnicity BMI (kg/m2) |
Vitamin D Supplement Duration |
25(OH)D Baseline Mean (SD) nmol/L |
25(OH)D End of Study Mean (SD) nmol/L Assay |
Jadad Score |
|
Heaney (2003)60 |
67 Community-dwelling men |
IG1: 1,000 IG2: 5,000 IG3: 10,000 IU /d D3 CG: no supplement |
IG1 72.05 (16.0) IG2 69.3 (16.6) IG3 65.6 (24.4) CG 70.1 (23.2) |
Absolute ∆ from baseline IG1 12.0 (16.0) IG2 91.9 (37.6) IG3 159.4 (62.4) CG 11.4 (17.6) |
1 |
|
U.S. |
|
|
|||
|
|
NR |
|
|||
|
Private |
|
|
|
|
|
|
26.2 (2.4) |
20 wks |
||||
|
|
|
CPBA (Nichols) |
|
||
|
Stephens (1981)227 |
33 Adults with 25(OH)D < 12.5 nmol/L |
IG1: 100,000 IU D2 (oral) IG2: 100,000 IU D2 (IM injection) both single dose |
IG1 16.5 (8.5) IG2 14.0 (7.3) |
1 mo: IG1 52.5 (12) IG2 32.5 (13) 3 mo: IG1 29.5 (7.0) IG2 25.8 (8.8) 5 mo: IG1 24.5 (5.3) IG2 23.5 (11.6) |
2 |
|
U.K. |
|
|
|||
|
Public |
Asian |
5 mo |
|
|
|
|
|
NR |
|
|
|
|
|
|
|
|
|
CPBA |
|
|
Tjellesen (1986)229 |
19 Healthy pre menopausal women |
IG1: 4,000 IU/d D2 IG2: 4,000 IU/d D3 |
Median (range) IG1 75.3 (55.3-95.8) IG2 77.5 (46.3-100.5) |
Median (range) IG1 88.8 (49.3-120.8) IG2 113.5 (77.5-138.5) IG2 – significantly different from baseline (p<0.01) |
1 |
|
Denmark |
|
|
|
||
|
|
NR |
8 wks |
|
|
|
|
Public |
|
|
|
|
|
|
|
NR |
|
|
|
|
|
|
|
|
|
HPLC |
|
|
Trang (1998)230 |
72 Healthy adult volunteers |
IG1: 4,000 IU/d D2 IG2: 4,000 IU D3/d CG: no treatment |
IG1 43.7 (17.7) IG2 41.3 (17.7) CG 39.8 (18.7) |
IG1 57.4 (13.0) IG2 64.6 (17.2) CG 42.8 (20.7) |
2 |
|
Canada |
|
|
|||
|
|
NR |
|
|
|
|
|
Public |
|
14 d |
|
RIA |
|
|
|
NR |
|
|
|
|
|
Author (year) Country Funding |
Population, N Ethnicity BMI (kg/m2) |
Vitamin D Supplement Duration |
25(OH)D Baseline Mean (SD) nmol/L |
25(OH)D End of Study Mean (SD) nmol/L Assay |
Jadad Score |
|
Vieth (2001)234 |
73 Healthy men and women |
IG1: 1,000 IU/d IG2: 4,000 IU/d D3 |
IG1 43.3 (16.8) IG2 37.9 (13.4) |
IG1 68.7 (16.9) IG2 96.4 (14.6) |
2 |
|
Canada |
|
|
|
|
|
|
|
White: IG1 66.6%, IG2 71.4%; Black: IG1 6.1%, IG2 10.7%; Asian: IG1 27.3%, IG2 17.9 |
2-5 mo |
|
RIA |
|
|
Public |
|
|
|
|
|
|
|
NR |
|
|
|
|
|
Mixed Populations of Premenopausal and Postmenopausal Women or Younger and Older Men: Community Dwelling (N=4) |
|||||
|
Harris (1999)196 |
20 Young and old men, community dwelling mean age (SD): young: 26.0 (1.8) y old: 68.2 (2.5) y |
IG1: 1,800 IU/day vit D2 CG: no treatment |
young: IG1 32.4 (10.7); CG 42.4 (13.0) old: IG1 39.9 (9.3); CG: 39.9 (6.1) |
∆ from baseline young: IG1 30.4 (9.5); CG -9.2 (15.0) old: 7.5 (13.0); old: -3.7 (6.3) |
2 |
|
U.S. |
|
|
|||
|
|
3 wks |
|
|||
|
Public |
|
|
|
||
|
|
|
|
|
CPBA |
|
|
|
NR |
|
|
|
|
|
|
IG (young) 26.1 (1.9); (old) 32.8 (5.3) CG (young) 27.7 (3.6); (old) 28.7 (5.6) |
|
|
|
|
|
Harris (2002)195 |
26 Young and 26 older community-dwelling men; mean age (SD): young 28.7 (4.6) y old: 72.8 (4.5) |
IG1: 800 IU/d vit D3 CG: no intervention |
young: IG1 59.9 (16.4); CG 48.9 (17.2) old: IG1 61.5 (15.7); CG 53.8 (18.2) |
young: IG1 82.4 (11.8); CG NR old: IG1 83.6 (19.0); CG NR |
1 |
|
U.S. |
|
|
|||
|
|
8 wks |
|
|
||
|
Public |
|
|
∆ from baseline young: IG1 22.5 (14.7); CG -4.6 (6.1) old: IG1 22.1 (13.4); CG – 4.5 (6.5) |
|
|
|
|
NR |
|
|
|
|
|
|
IG1 young 25.0 (4.9); old 25.1 (4.2), CG young 29.0 (4.3); old 30.0 (3.2) |
|
|
|
|
|
|
|
|
CPBA |
|
|
|
Author (year) Country Funding |
Population, N Ethnicity BMI (kg/m2) |
Vitamin D Supplement Duration |
25(OH)D Baseline Mean (SD) nmol/L |
25(OH)D End of Study Mean (SD) nmol/L Assay |
Jadad Score |
|
Patel (2001)216 |
70 Pre and postmenopausal, community-dwelling women |
IG1: 800 IU/d D3 CG: Placebo |
IG1 68.1 (20.3) CG 75.7 (19.0) |
IG1 76.5 (21.0) CG 66.5 (21.0) (estimated from figure – last followup prior to crossover) |
2 |
|
U.K. |
|
|
|
||
|
|
1 y |
|
|
||
|
NR |
|
|
|
|
|
|
|
NR |
|
|
RIA |
|
|
|
IG 25.1 (4.6) CG 25.0 (4.9) |
|
|
|
|
|
van der Klis (1996)232 |
105 Pre and postmenopausal Dutch women (pre-Neth and post Neth); and postmenopausal women in Curacao (post Cur) |
Postmenopausal black and white Curacao women (post Cur): 800 IU/d vit D3 single dose or 2 doses 400 IU/d vit D3 (pooled) 9 wks |
Post Cur 85.1 (26.9) |
Post Cur 5 wks 102.6 (28.6) |
2 |
|
|
Post Neth 58.5 (23.8) |
|
|
||
|
The Netherlands |
|
Post Neth 5 wks 87.9 (28.1) |
|
||
|
|
Pre- Neth 46.2 (13.3) |
|
|||
|
Public |
|
|
|
|
|
|
|
Postmenopausal white Dutch women (post Neth): 800 IU/d D3 vs. 400 IU/d vit D3 vs. placebo 5wks |
|
Pre Neth ~ 85 (estimated from figure) |
|
|
|
|
85 Caucasian, 20 black |
|
|
|
|
|
|
|
CPBA |
|
||
|
|
NR |
Premenopausal white Dutch women (pre-Neth): 800 IU/d vit D3 4 wks |
|
|
|
|
Author (year) Country Funding |
Population, N Ethnicity BMI (kg/m2) |
Vitamin D Supplement Duration |
25(OH)D Baseline Mean (SD) nmol/L |
25(OH)D End of Study Mean (SD) nmol/L Assay |
Jadad Score |
|
Postmenopausal Women and Older Men: Community Dwelling (N=30) |
|||||
|
Aloia (2005)117 |
208 Healthy postmenopausal women |
IG1: 800 IU D3/d for 2 y, then 2000 IU/d D3 for 1 y, + Ca 1200-1500 mg/d CG: placebo + Ca 1200 - 1500 mg/d) |
IG1 48.25 (20.9) CG 43.0 (16.6) |
IG1 after 3 mo of 800 IU 70.8 IG1 after 3 mo of 2000 IU: 86.9 CG did not change significantly |
5 |
|
U.S. |
|
|
|||
|
Public |
African American |
|
|
||
|
IG1 29 (4) CG 30 (4) |
3 y |
||||
|
|
|
RIA |
|
||
|
Brazier (2002)178 |
48 Early postmenopausal women |
IG1: 10 mg/d alendronate + 800 IU/d D3 + 1000 mg/d Ca IG2: 10 mg/d alendronate + placebo + 500 mg/d Ca |
median (quartile 1, 3) total group 22.5 (17.5, 25.0) |
∆ from baseline median (quartile 1, 2) at 3 mo IG 65.0 (52.5, 72.5) CG 35 (22.5, 47.5) |
4 |
|
France |
|
||||
|
Private |
NR |
|
|
|
|
|
|
|
3 mo |
|
|
|
|
|
Median (quartile 1;3) 25.2 (22.9; 27.0) |
|
|
CPBA |
|
|
Cooper (2003)120 |
187 Early postmenopausal women |
IG1: 10,000 IU/wk D2 CG: placebo + Ca 1000 mg/d 2 yrs |
IG1 81.6 (24.4) CG 82.6 (27.0) |
∆ from baseline IG1: +5.3 (18.1) (y 1) IG1: −6.4 (15.6) (y 2) CG average annual rate: -6.7 (0.7) |
3 |
|
Australia |
|
|
|||
|
Public/Private |
Caucasian |
|
|
|
|
|
|
NR |
|
|
RIA |
|
|
Dawson-Hughes (1997)184 Bischoff-Ferrari (2006)185 |
445 Older men and women, living at home |
IG1:700 IU/d D3 + 500 mg/d Ca citrate malate CG: placebo |
Men IG1 82.5 (40.8) CG 84.0 (31.8) Women IG1 71.8 (33.3) CG 61.3 (25.8) |
Absolute 3 y ∆ Men IG1 +29.5 (29.0) CG −6.7 (25.5) Women IG1 +40.3 (35.8) CG +1.8 (20.3) |
3 |
|
|
Caucasian (430), Black (11) and Asian (4) |
3 y |
|
||
|
U.S. |
|
|
|||
|
Public |
|
|
|
|
|
|
|
NR |
|
|
CPBA |
|
|
Author (year) Country Funding |
Population, N Ethnicity BMI (kg/m2) |
Vitamin D Supplement Duration |
25(OH)D Baseline Mean (SD) nmol/L |
25(OH)D End of Study Mean (SD) nmol/L Assay |
Jadad Score |
|
Dhesi (2004)115 |
139 Ambulatory older adults with a history of falls, living independently |
IG1: 600,000 IU D2 (single injection) CG: placebo |
Mean (95% CI) IG1 26.75 (25.50-28.00) CG 25.00 (23.75-26.73) |
Mean (95% CI) IG1 43.75 (41.25-46.25) CG 31.50 (28.50-34.50) |
3 |
|
U.K. |
|
||||
|
Public |
|
6 mo |
|
RIA |
|
|
|
Caucasian |
|
|
|
|
|
|
NR |
|
|
|
|
|
Dawson-Hughes 1991)183 |
276 Healthy postmenopausal women |
IG1: 400 IU/d vit D3 + 377 mg/d Ca CG: 377 mg/dCa |
NR |
[By season] Aug-Nov IG1 97 (23.8) CG 81.3 (25.0) Feb-May IG1 92.1 (23.8) CG 60.6 (28.5) |
3 |
|
U.S. |
|
|
|
|
|
|
|
Caucasian |
1 y |
|
|
|
|
Public/Private |
|
|
|
|
|
|
|
NR |
|
|
|
|
|
|
|
|
|
CPBA |
|
|
Dawson-Hughes 1995)118 |
261 Healthy postmenopausal women |
IG1 700 IU/d D3 + 500 mg/d Ca CG: 100 IU/d D3+ 500 mg/d Ca |
NR |
9 mo IG1 100.1 (24.5) CG 66.3 (25.5) Mean difference (95% CI) 33.8 (27.6, 40.1) |
2 |
|
U.S. |
|
2 y |
|
|
|
|
|
Caucasian |
|
|
|
|
|
Public/Private |
|
|
|
|
|
|
|
IG1 26.6 (4.4) CG 26.3 (3.8) |
|
|
CPBA |
|
|
Deroisy (2002)189 |
100 Elderly, community-dwelling women with serum 25(OH)D < 30 nmol/L |
IG1: 200 IU/d D3 + 500 mg/d Ca CG: 500 mg/d Ca |
IG1 27.8 (10.0) CG 28.3 (10.0) |
IG1 42.5 (16.0) CG 32.75 (16) |
2 |
|
Belgium |
|
|
|
|
|
|
|
3 mo |
|
RIA |
|
|
|
NR |
|
|
|
|
|
|
|
NR |
|
|
|
|
|
|
NR |
|
|
|
|
|
Author (year) Country Funding |
Population, N Ethnicity BMI (kg/m2) |
Vitamin D Supplement Duration |
25(OH)D Baseline Mean (SD) nmol/L |
25(OH)D End of Study Mean (SD) nmol/L Assay |
Jadad Score |
|
Grados (2003)190 Companions: Brazier (2005)191 Grados (2003)237 |
192 Elderly community-dwelling women with serum 25(OH)D < 30 nmol/L |
IG1: 800 IU D3 + 1000 mg/d Ca CG: Placebo |
(Median) 17.5 (both groups) |
Median increase IG1 55, CG 10 |
3 |
|
12 mo |
Mean (SD) IG1 18.3 (NR) CG 17.5 (NR) |
Median (IQR 1,3) IG1 71.9 (58.1-89.4) CG 26.9 (20-35) |
|
||
|
France |
NR |
|
|
||
|
NR |
IG 27.0 (4.4) CG 26.4 (4.3) |
|
|
CPBA |
|
|
Goussous (2005)192 |
55 Elderly men and women |
IG1: 800 IU/d D3 + 1000 mg/d Ca IG2: 800 IU/d D3 |
IG1 47.9 (15.9) IG2 49.1 (16.7) |
IG1 64.1 (15.9) IG2 65.7 (14.7) |
4 |
|
U.S. |
|
|
|
|
|
|
|
Caucasians IG 82.6%; CG 86.2% |
3 mo |
|
RIA |
|
|
Public |
|
|
|
|
|
|
|
NR |
|
|
|
|
|
Heikkinen (1998)199 |
72 Postmenopausal women |
IG1: HRT IG2: 300 IU/d D3 + 500mg/d Ca IG3: HRT + 300 IU/d D3 + 500 mg/d Ca CG: 500 mg/d Ca |
IG1: 29.9 (15.5), SE 2.9 IG2 28.1 (11.5), SE 2.8 IG3 24.1 (9.3), SE 2.2 CG 28.0 (10.6), SE 2.5 |
IG1 28.2 (8.4), SE 2.1 IG2 37.5 (9.5) (33.5% increase from baseline) IG3 33.3 (8.9), SE 2.1 (38.2% increase from baseline) CG 24.7 (8.9), SE 2.1 |
3 |
|
Finland |
|
|
|||
|
|
NR |
|
|||
|
Public/Private |
|
|
|
||
|
|
Mean (SEM) IG1 24.8 (0.52) IG2 25.7 (1.03) IG3 24.8 (0.52) CG 24.7 (0.61) |
|
|
|
|
|
|
1 yr |
|
|
|
|
|
|
|
|
CPBA |
|
|
|
Honkanen (1990)202 |
66 Independent PM women and 70 institutionalized PM women |
IG1: 1800 IU/d vit D3 + 1550 mg/d Ca (either home or hospital) CG: no treatment |
Independent group: IG1 42.8 (17.9) CG 36.0 (13.3) Institutionalized group: IG1 24.5 (12.6) CG 24.0 (14.7) |
Independent group: IG1 80.7 (14.0) CG 23.3 (13.3) Institutionalized group: IG1 64.4 (21.0) CG 10.4 (7.3) |
2 |
|
Finland |
|
||||
|
Private |
NR |
11 wks |
|
||
|
|
NR |
|
|
CPBA |
|
|
Author (year) Country Funding |
Population, N Ethnicity BMI (kg/m2) |
Vitamin D Supplement Duration |
25(OH)D Baseline Mean (SD) nmol/L |
25(OH)D End of Study Mean (SD) nmol/L Assay |
Jadad Score |
|
Hunter (2000)203 |
158 Postmenopausal monozygotic twins pairs |
IG1: 800 IU/d vit D3 CG: placebo |
IG1 70.8 (30.0) CG 70.3 (28.3) |
6 mo: SEM intrapair diff IG1 35.5 (6.0) (increase of 57% vs. CG increase of 15%) 24 mo: IG1 ~105 (estimated from figure) (increase of 47% vs. CG increase of 12%) |
5 |
|
U.K. |
|
|
|
||
|
|
|
2 y |
|
|
|
|
Public/Private |
NR |
|
|
|
|
|
|
IG 24.1 (3.7) CG 24.1 (3.2) |
|
|
|
|
|
|
|
|
|
RIA |
|
|
Jensen (2002)204 |
99 Late postmenopausal women |
IG1: 400 IU/d vit D + 1450 mg/d Ca IG2: multi-nutrient with 400 IU/d vit D + 1450 mg/d Ca CG: dietary education |
IG1 41.4 (24.2) IG2 40.2 (18.5) CG 41.9 (17.5) |
IG1 76.6 (22.1) IG2 87.7 (30.5) CG 58.4 (32.5) |
2 |
|
U.S. |
|
||||
|
Private |
NR |
|
CPBA |
|
|
|
|
IG 25.4 (3.4) IG2 25.1 (3.5) CG 25.9 (4.5) |
3 y |
|
|
|
|
Kenny (2004)205 |
40 Older postmenopausal women with osteopenia/osteoporo sis (N=40) |
IG1: 400 IU/d vit D3 + 1000 mg/d calcium citrate IG2: 400 IU/d vit D3 + 1000 mg/d calcium carbonate |
IG1 62.5 (18.8) IG2 59.5 (17.3) |
IG1 68.8 (15.3) IG2 73.0 (17.3) |
2 |
|
US |
|
|
|
||
|
|
|
CPBA |
|
||
|
Public/Private |
|
|
|
|
|
|
|
|
3 mo |
|
|
|
|
|
Caucasian, Hispanic |
|
|
|
|
|
|
27.4 (0.5) |
|
|
|
|
|
Kenny (2003)113 |
65 Healthy, community-dwelling elderly men |
IG1: 1000 IU/d vit D3 + 500 mg Ca IG2: placebo + 500 mg Ca |
IG1 65.0 (16.75) CG 59.0 (18.75) |
IG1 87.25 (13.75) CG 56.50 (17.00) |
4 |
|
U.S. |
|
|
|
||
|
|
|
|
|
CPBA |
|
|
Public |
NR |
6 mo |
|
|
|
|
|
IG 27.4 (3.2) CG 28.3 (2.4) |
|
|
|
|
|
Author (year) Country Funding |
Population, N Ethnicity BMI (kg/m2) |
Vitamin D Supplement Duration |
25(OH)D Baseline Mean (SD) nmol/L |
25(OH) End of Study Mean (SD) nmol/L Assay |
Jadad Score |
|
Khaw (1994)206 |
191 Elderly independently living individuals |
IG1: 100,000 IU vit D3 single dose CG: placebo |
IG1 35.4 (15.5) CG 33.6 (14.0) |
25(OH)D ∆ IG1 19.4 (11.6) CG −2.7 (10.8) |
3 |
|
U.K. |
|
|
|
||
|
|
NR |
|
|
|
|
|
Public |
|
5 wks |
|
CPBA |
|
|
|
NR |
|
|
|
|
|
Latham (2003)208 |
243 Frail elderly, the majority community-dwelling |
IG1: 300,000 IU vit D3 single dose CG: placebo |
Median (95% CI) IG1 37.5 (35, 45) CG 47.5 (40, 52.5) |
Median ∆ (from baseline to 3 mo) IG1 22.5 CG 0.0 6 mo results NR |
5 |
|
New Zealand / Australia |
|
||||
|
|
NR |
6 mo |
|
|
|
|
Public |
|
|
|
|
|
|
|
IG 24 (5.6) CG 25 (5.6) |
|
|
RIA |
|
|
Lips (1996)210 |
2578 Elderly individuals, living independently in apartments or homes the elderly |
IG1: 400 IU/d vit D3 CG: placebo |
Median, (25th-95th percentiles) IG1 27 (19-36) CG 26 (19-37) |
Median (25th-95th percentiles) IG1 54 (43-61) CG 23 (17-28) subset of patients at 3 y (N=96) |
5 |
|
The Netherlands |
|
|
|||
|
|
3-3.5 y |
|
|||
|
Public |
|
|
|
|
|
|
|
NR |
|
|
|
|
|
|
NR |
|
|
CPBA |
|
|
Mastaglia 2006)212 |
45 Postmenopausal women |
IG1: 5,000 IU/d vit D2 + 500 mg Ca IG2: 10,000 IU/d vit D2 + 500 mg Ca CG: 500 mg/d Ca |
Median (25-75th percentile) IG1 42 (23.7-45.0) IG2 32.5 (27.5-37.5) CG 45.0 (31.2-61.2) |
Median (25-75th percentile) IG1 77.5 (66.2-156.2) IG2 97.7 (79.3-123.1) CG 55.0 (72.5-8) |
1 |
|
Argentina |
NR |
|
|||
|
Public |
Median (25-75th percentile) IG1: 27.4 (25.0–31.7) IG2: 25.9 (22.4–30.4) CG: 25.8 (23.2–28.6) |
|
|
RIA |
|
|
|
3 mo |
|
|
|
|
Author (year) Country Funding |
Population, N Ethnicity BMI (kg/m2) |
Vitamin D Supplement Duration |
25(OH)D Baseline Mean (SD) nmol/L |
25(OH)D End of Study Mean (SD) nmol/L Assay |
Jadad Score |
|
Meier (2004)213 |
55 Healthy adult men and postmenopausal women |
IG1: 500 IU/d vit D3 + 500 mg/d Ca CG: no supplements |
IG1 75.25 (28.5) CG 77.00 (23.25) |
Feb/Mar 2 y IG1 87.75 (20.25) CG 51.25 (21.5) Aug/Sept 2 y IG1 80.25 (20.5) CG 84.5 (28.75) |
2 |
|
Australia |
|
|
|||
|
NR |
NR |
2 y |
|
|
|
|
NR |
|||||
|
|
|
|
RIA |
|
|
|
Nordin (1985)214 |
137 Elderly women |
IG1: 15,000 IU/wk vit D2 CG: placebo |
Mean (SE) IG1 20.3 (1.8) CG 24.4 (2.1) |
Mean (SE) IG1 59.1 (5.0) CG 29.6 (2.7) |
1 |
|
U.K. |
NR |
|
|
||
|
|
|
1 y |
|
|
|
|
NR |
NR |
|
|
CPBA |
|
|
Ooms (1995)119 |
348 Postmenopausal women |
IG1: 400 IU/d vit D3 CG: placebo |
Median (25th-95th percentiles) IG1 27.0 (19-36) CG 26.0 (19-37) |
Median (25th-95th percentiles) IG1 62.0 (52-70) CG 23.0 (17-31) |
3 |
|
The Netherlands |
|
|
|
||
|
|
NR |
2 y |
|
||
|
Public |
|
|
|
|
|
|
|
IG 28.1 (4.1), CG 28.6 (4.0) |
|
|
CPBA |
|
|
Orwoll (1988)215 |
92 Adult men |
IG1: 1000 IU/d vit D3 +1000 mg/d Ca CG: placebo |
IG1 60 (18) CG 57 (20) |
IG1 85 (20) CG 60 (18) |
3 |
|
U.S. |
NR |
|
|
|
|
|
|
|
1 y |
|
CPBA |
|
|
Public |
NR |
|
|
|
|
|
Pfeifer (2000)218 |
148 Elderly, community-dwelling women |
IG1: 880 IU/d vit D3 + 1200 mg/d Ca CG: 1200 mg/d Ca |
IG1 25.65 (13.63) CG 24.63 (12.14) |
∆ (8 wks) IG11 +40.46 (27.01) CG +18.30 (20.94) |
3 |
|
Germany |
|
|
|||
|
Private |
NR |
8 wks |
|
RIA |
|
|
|
NR |
|
|
|
|
|
Author (year) Country Funding |
Population, N Ethnicity BMI (kg/m2) |
Vitamin D Supplement Duration |
25(OH)D Baseline Mean (SD) nmol/L |
25(OH)D End of Study Mean (SD) nmol/L Assay |
Jadad Score |
|
Riis (1984)219 |
15 Post-menopausal women |
IG1: 2000 IU/d vit D3 + 500 mg/d Ca CG: 500mg/d Ca |
IG1 32.5 (13.2), SE (5) CG 60.0 (28.3), SE (10) |
IG1 120.0 (13.2), SE (5) CG 55.0 (21.2), SE (7.5) |
4 |
|
Denmark |
NR |
|
|
|
|
|
|
|
|
|
HPLC |
|
|
NR |
NR |
1 y |
|
|
|
|
Schaafsma (2002)121 Companion: Schaafsma221 |
73 Post-menopausal Dutch women |
IG1: 400 IU/d vit D3 + 1000 mg/d Ca (eggshell powder-enriched supplement) IG2: 400 IU/d vit D3 + 1000 mg/d Ca (CaCO3-enriched supplement) CG: placebo |
IG1 97.1 (24.1) IG2 83.1 (22.4) CG 91.0 (36.5) |
% ∆ at 12 mo IG1 25.1 (29.8) IG2 43.8 (27.3) CG 11.1 (22.7) |
2 |
|
Caucasian |
|
|
|||
|
The Netherlands |
IG1 26.5 (3.2) IG2 28.1 (4.8) CG 28.7 (4.4) |
|
CPBA |
|
|
|
NR |
|
|
|
|
|
|
|
|
12 mo |
|
|
|
|
Tfelt-Hansen, (2004)228 |
17 Healthy women (≥ 4 y post-menopausal) |
IG1: 1600 IU/d vit D3 + 2500 mg/d Ca IG2: 2500 mg/d Ca CG: placebo |
66 (22) |
IG1 65 (18) IG2 NR CG NR |
2 |
|
Sweden |
|
|
|
|
|
|
|
NR |
|
|
RIA |
|
|
Private |
|
7 wks |
|
|
|
|
|
25.7(3.6) |
|
|
|
|
|
Trivedi (2003)231 |
2686 Elderly individuals |
IG1 100,000 IU vit D3 q 4 mo CG: placebo |
NR |
IG1 74.3 (20.7) CG 53.4 (21.1) |
3 |
|
U.K. |
|
|
|
|
|
|
|
NR |
5 y (25(OH)D measured after 4 y) |
|
RIA |
|
|
Public |
|
|
|
|
|
|
|
IG 24.3 (3.4) CG 24.4 (3.0) |
|
|
|
|
|
Author (year) Country Funding |
Population, N Ethnicity BMI (kg/m2) |
Vitamin D Supplement Duration |
25(OH)D Baseline Mean (SD) nmol/L |
25(OH)D End of Study Mean (SD) nmol/L Assay |
Jadad Score |
|
Vieth (2004)233 Studies A and B |
Individuals at risk for deficiency, endocrine outpatients Study A: N=93, Study B: N=112 (46 continuers from Study A, 66 new patients) |
IG1: 4000 IU/d vit D3 IG2: 600 IU/d vit D3 |
Study A IG1 49 (9) IG2 46 (9) |
Study A IG1: 112 (41) IG2: 79 (30) |
1 |
|
Canada |
6 mo |
|
|
|
|
|
|
|
Study B IG1 39 (9) IG2 39 (9) |
Study B (NR separately -graph only) |
|
|
|
Public |
|
|
|
||
|
|
NR |
|
|
RIA |
|
|
|
NR |
|
|
|
|
|
Postmenopausal Women and Older Men: Institutionalized (N=14) |
|||||
|
Bischoff-Ferrari (2003)114 |
122 Elderly women in long-stay geriatric care |
IG1: 800 IU vit D3 + 1200 mg Ca CG: placebo + 1200 mg/d Ca |
Median (IQR) IG1 30.7 (23, 55) CG 29 (23, 55) |
Median (IQR) IG1 65.5 (49.8, 82.8) CG 28.5 (24.5, 41.5) % ∆ IG1 +71% CG −4%, p<0.0001 |
3 |
|
Switzerland |
|
12 wks |
|
|
|
|
|
NR |
|
|
|
|
|
Public |
|
|
|
|
|
|
|
IG1 24.7 (5.3) CG 24.7 (5.6) |
|
|
RIA |
|
|
Chapuy (1992)181 |
3270 Elderly, ambulatory women in nursing homes |
IG1: 800 IU/d vit D3 + 1200 mg/d Ca CG: Placebo |
IG1 40.0 (27.5) CG 32.5 (22.5) |
IG1 105 (22.5) CG 27.5 (17.5) |
2 |
|
France |
|
|
|
||
|
|
|
|
|
CPBA |
|
|
Public/Private |
NR |
18 mo |
|
|
|
|
|
NR |
|
|
|
|
|
Chapuy (2002)180 |
639 Elderly ambulatory, institutionalized women |
IG1: 800 IU/d vit D3 + 1200 mg/d Ca (combined) IG2: 800 IU/d vit D3 + 1200 mg/d Ca (separate) CG: placebo |
IG1 21.3 (13.3) IG2 22.5 (16.5) CG 22.8 (17.3) |
2 y IG1 ~75 (estimated from graph) IG2 ~80 CG ~15 |
3 |
|
France |
|
||||
|
Private |
|
|
|
||
|
|
NR |
|
|
|
|
|
|
|
2 y |
|
CPBA |
|
|
|
NR |
|
|
|
|
|
Author (year) Country Funding |
Population, N Ethnicity BMI (kg/m2) |
Vitamin D Supplement Duration |
25(OH)D Baseline Mean (SD) nmol/L |
25(OH)D End of Study Mean (SD) nmol/L Assay |
Jadad Score |
|
Chel (1998)167 |
45 Elderly female nursing home patients |
IG1: 400 IU/d vit D3 CG: no treatment |
Median, 25th-95th percentiles IG1 23 (14-28) CG 12 (8-18) |
Median at 12 wks,IG1: 60; CG: NS at 16 wks (4 wks post treatment) IG1 ~50 (p<0.001) CG ~16, NS (derived from figure) |
2 |
|
The Netherlands |
|
|
|||
|
|
|
12 wks |
|
||
|
Public |
NR |
|
|
|
|
|
NR |
|||||
|
|
|
|
RIA |
|
|
|
Corless (1985)112 |
82 Elderly hospital patients with low or low normal plasma 25(OH)D levels |
IG1: 9,000 IU/d vit D2 CG: placebo |
IG1 16.60 (11.90), SE (2.10) CG 17.63 (11.80), SE (2.05) |
40 wks IG1 115 CG 10 (estimated from graph) |
5 |
|
U.K. |
|
|
|||
|
|
9 mo |
|
|||
|
Public |
|
|
|
|
|
|
|
NR |
|
|
CPBA |
|
|
|
NR |
|
|
|
|
|
Deroisy (1998)188 |
119 Elderly women, 80% institutionalized |
IG1: 800 IU/d vit D3 + 1000 mg/d Ca (combined) IG2: 800 IU/d vit D3 + 1200 mg/d Ca (separate) |
IG1 50.55 (30.75) IG2 49.15 (28.38) |
1 y IG1 122.9 (43.6) (p=0.001 for ∆ from 6 to 12 mo) IG2 113.1 (38.3) (p = 0.003 for ∆ from 6 to 12 mo) |
2 |
|
Belgium |
|
|
|
||
|
|
NR |
|
|
||
|
Private |
|
|
|
|
|
|
NR |
1 y |
||||
|
|
|
RIA |
|
||
|
Harwood (2004)197 |
150 Elderly women from a ‘fast track’ orthogeriatric rehabilitation ward previously community-dwelling |
IG1 300,000 IU D2 single injection IG2 300,000 IU D2 single injection + 1000 mg/d Ca IG3: 800 IU/d D3 oral + 1000 mg/d Ca CG: placebo |
Mean (range) IG1 28 (10-67) IG2 30 (12-85) IG3 29 (6-75) CG 30 (12-64) |
IG1 40 IG2 44 IG3 50 CG 27 (p<0.0005) |
3 |
|
U.K. |
|
||||
|
Public |
|
||||
|
|
NR |
|
|
RIA |
|
|
|
|
1 y |
|
|
|
|
|
24.2 (2.9) |
|
|
|
|
|
Author (year) Country Funding |
Population, N Ethnicity BMI (kg/m2) |
Vitamin D Supplement Duration |
25(OH)D Baseline Mean (SD) nmol/L |
25(OH)D End of Study Mean (SD) nmol/L Assay |
Jadad Score |
|
Himmelstein, (1990)200 |
30 Elderly nursing home males and females |
IG1: 2000 IU/d vit D3 CG: placebo |
IG1 40.4 (18.2), SEM (4.7) CG 49.9 (19.4), SEM (5.0) |
IG1 80.1 (25.9), SEM (6.9() CG 47.2 (22.1), SEM (5.7) |
2 |
|
U.S. |
|
6 wks |
|
CPBA |
|
|
|
All Caucasian except 1 Asian |
|
|
|
|
|
Public |
|
|
|
|
|
|
|
NR |
|
|
|
|
|
Krieg (1999)207 |
248 Elderly institutionalized women |
IG1: 880 IU/d D3 + 500 mg/d Ca CG: no intervention |
IG1 29.75 (17.5), SEM (3) CG 29.25 (18.5), SEM (3) |
IG1 66.25 (23.3), SEM (4) CG 14.25 (15.4), SEM (2.5) |
2 |
|
Switzerland |
|
|
|
|
|
|
|
|
2 y |
|
CPBA |
|
|
NR |
NR |
|
|
|
|
|
|
IG 25.7 (4.8) CG 23.8 (5.4) |
|
|
|
|
|
Lips (1988) |
72 Elderly nursing home residents, and 70 and home for aged residents |
IG1: 400 IU/d vit D3 IG2: 800 IU/d vit D3 CG: placebo |
Nursing home: 23.6 (8.9) Home for aged: 23.8 (13.3) |
Nursing home IG1 ~70 IG2 ~90 CG ~20 Home for aged IG1 ~75 IG2 ~80 CG ~25 (estimated from figure) |
1 |
|
The Netherlands |
|
||||
|
Public |
|
1 y |
|
|
|
|
|
NR |
|
|
|
|
|
|
NR |
|
|
|
|
|
|
|
|
|
CPBA |
|
|
Lovell (1988) |
32 Elderly (age 55-95 y) nursing home residents |
IG1: 230 IU/d vit D3 IG2: 866 IU/d vit D3 CG: placebo |
Median (range) IG1 18.3 (10.8-71.3) IG2 41.1 (15.5-57.8) CG 18.9 (7.3-77.3) |
Median (range) IG1: 47.3 (12.0-87.8) IG2 78.0 (45.0-91.0) CG 15.1 (6.8-68.8) |
2 |
|
Australia |
|
||||
|
NR |
Caucasian |
3 mo |
|
|
|
|
|
|
|
|
CPBA |
|
|
|
NR |
|
|
|
|
Question 3A.
What is the Evidence Regarding the Effect of Supplemental Vitamin D on Bone Density in Women of Reproductive Age and Postmenopausal Women and Elderly Men?
Overview of Relevant RCTs
Study characteristics. A total of 17 randomized trials evaluated the effect of supplemental vitamin D (with or without calcium) versus control (calcium, placebo or no treatment) on bone mineral density. Of these 17 trials, 16 were parallel design RCTs of either supplemental vitamin D2 or D3117-120,180,181,183,184,197,203,204,213,237,241-243 and one was a crossover trial of vitamin D3.216 Treatment duration varied from one183 to seven years,243 and most trials were less than three years in duration. Three articles190,191,237 were companion papers and we refer to the primary publication237 when discussing the results provided in either paper.
Study population. The majority of trials included postmenopausal women. Only one trial included premenopausal women,216 and one trial included women who were recently postmenopausal.242 Only two trials included older men > 60 years.184,213 Thirteen trials included community-dwelling individuals.117,118,120,183,184,203,204,213,216,237,241-243 Two trials had populations of ambulatory elderly subjects living in either nursing homes or seniors’ apartments,180,181 and one trial included women living in homes or apartments for the elderly.119 Harwood included women living in the community who had sustained a hip fracture and were admitted to hospital.197 One trial enrolled postmenopausal African-American women.117
Interventions. The majority of the trials used oral vitamin D3, and two trials administered vitamin D2 (Table 13).120,197 Harwood also included an oral vitamin D3 arm.197 The daily dose of vitamin D3 ranged from 300 IU242 to 2,000 IU.117 Aloia et al. administered 800 IU vitamin D3 for two years followed by 2,000 IU daily for one year. Five trials used a dose of 800 IU vitamin D3,180,181,197,203,216 four trials used a daily dose less than 800 IU but greater than or equal to 400 IU.118,119,183,184,204,213,241,243 One trial used 300 IU vitamin D3.242 Doses of vitamin D2 ranged from 10,000 IU orally per week120 to an annual injection of 300,000 IU.197
Fourteen trials had treatment arms that combined vitamin D with calcium,117,118,180,181,183,183,184,197,204,213,237,241-243 and three trials administered vitamin D alone.119,203,216
Daily calcium dosages ranged from 377 mg in one trial,183 500 mg in three trials118,184,213 1,000 mg in four trials,120,237,241,243 to 1,200 mg or more in three trials.180,181,204
Dietary vitamin D intake: nine trials estimated the mean baseline daily dietary vitamin D intake117,118,180,183,184,203,237,241,243 which ranged from 40 IU180 to 202 IU.184 (Table 13)
Comparators. Comparators included calcium in five trials,117,120,183,204 low dose vitamin D3 (100 IU) plus calcium in one trial,118 and placebo in 11 trials.119,180,181,184,197,203,213,216,237,241-243
Compliance. Compliance with vitamin D was reported in eleven trials and the compliance rates (compliance defined as > 80% of supplementation taken) were over 80 percent in seven of the eleven trials.117-119,180,184,203,237 One study reported an adherence score as ‘excellent’ but did
not provide a percentage score,204 and another reported a compliance rate (compliance defined as > 70% of supplementation taken) in 83-84%.181 Another study gave supplements in the presence of a nurse to ensure compliance but did not specifically report a rate.180 The WHI trial reported a rate of adherence (> 80% of assigned medication taken) of 60 – 63 percent in the first three years of followup and 59% at end of study.243
Study quality. The overall quality score on the Jadad scale ranged from 1 (lowest) to 5 (highest). Four trials received a score of ≤ 2.118,181,204,213 Thirteen trials received a score of ≥ 3 consistent with high quality.117,119,120,180,183,184,197,203,216,237,241-243 Two trials adequately reported the allocation concealment.117,203 Fourteen trials reported losses to followup with seven reporting losses over 20 percent.119,180,181,184,197,204,237
Type of analysis. Six trials reported an intention-to-treat analysis.117,180,181,184,242,243
25 (OH) D levels. Thirteen trials reported baseline serum 25(OH) D levels.117,119,120,180,181,184,197,203,204,213,216,237,242 Fifteen trials reported followup or change in 25(OH)D levels.118-120,180,181,183,184,197,203,204,213,216,237,242 Of the fifteen trials reporting 25(OH)D, six used an RIA assay,117,120,197,203,213,216 one used a chemiluminescent immunoassay243 and eight studies used a CPBA (at least two184,204 of which were the Nichols Advantage Assay).
Vitamin D-deficient populations. Mean baseline 25(OH)D concentrations were ≤ 30 nmol/L in three trials.180,197,237 Ooms reported median 25(OH)D of 27.0 and 25 nmol/L in treatment and placebo groups, respectively,119 and the mean 25(OH)D concentrations were just over 30 nmol/L in another trial.213
BMD by region of interest. Fourteen trials assessed effect of vitamin D on lumbar spine BMD,117,118,120,183,184,197,203,204,213,216,237,241-243 twelve assessed femoral neck BMD,118-120,180,181,184,197,213,237,241-243 five trials evaluated total hip BMD,117,197,203,204,243 eight assessed total body BMD,117,118,183,184,203,204,237,243 and five assessed a forearm site.117,119,120,180,241
Ascertainment of BMD. BMD was assessed by DXA using Hologic machines in nine trials,117,180,181,197,203,204,213,216,243 Lunar technology in four trials,118,183,184,242 Norland in three trials,119,120,241 and either Lunar, Hologic or Norland in one trial.237 One trial used one of three densitometers, Lunar, Hologic or Norland and standardized the results.237
Individual trial results for lumbar spine, femoral neck and total body BMD are summarized in Table 13. Three trials evaluated BMD in a subpopulation of the total trial population.180,181,243
Data Synthesis
Six trials did not provide data in a format that would permit pooling.197,203,213,216,237,243 One was a crossover trial,216 and one trial evaluated the effect of vitamin D3 on postmenopausal twins, in which one member of each twin pair was randomized to vitamin D3 and the other to placebo and intra-pair differences analyzed.203 In four trials, adequate data were not provided within the published paper.197,213,237,243
In the twin pair (mean age 58.7 years) trial by Hunter et al., there was no significant difference in BMD at the lumbar spine with or without supplementation over a two year period and during that time, there was a mean one percent loss at the total hip.203
Patel (2001), in a two year crossover trial, evaluated whether vitamin D3 prevented seasonal changes in BMD in healthy women (mean age 47.2 years).216 Vitamin D3 had no overall effect on lumbar spine, femoral neck or total body BMD. Treatment effect coefficients of lumbar spine BMD were not significantly different from zero in either the low (baseline serum 25(OH)D < 60 nmol/L) or high vitamin D (baseline serum 25(OH)D > 80 nmol/L) groups. The authors concluded that the women in this study were too replete to demonstrate seasonal changes in BMD and that vitamin D supplements did not have significant effect on BMD.
In a two year trial, Meier (2004) evaluated the effect of six months of 500 IU of daily vitamin D3 plus 500 mg of calcium in healthy adults (male mean age 60.6 years and female mean age 54.1 years) during the winter to determine if supplements prevented seasonal bone loss. In the vitamin D3 and calcium treated subjects, the lumbar spine and femoral neck BMD increased in the second year compared to the first year, versus controls who continued to lose BMD.213
In the Women’s Health Initiative trial (N = 36,282), a subgroup of 2,431 women from three of 40 centers had BMD measured (lumbar spine, total hip and total body). Women were randomized to either vitamin D3 400 IU plus 1,000 mg of calcium daily or placebo. Non-significant differences in lumbar spine and total body BMD were reported, with results in favour of the vitamin D3 and calcium treated group. The BMD at the total hip was 1.06 percent higher compared to the control group after an average of seven years of treatment (p<0.001).243
Harwood et al. compared BMD changes of the lumbar spine and hip with injectable vitamin D2 300,000 units (± calcium), vitamin D3 800 IU/day (± calcium) or no treatment in women who had sustained a hip fracture. Differences in BMD for vitamin D treated versus control group ranged from 1.1 to 3.3 percent at femoral neck, 2.5 to 4.6 percent at the trochanter, and 2.1 to 4.6 percent at the total hip, with greater effects seen with oral vitamin D3 plus calcium.197
Grados (2003) compared vitamin D3 800 IU with calcium 1,000 mg per day in 192 elderly women in France. All women had 25(OH)D concentrations below 30 nmol/L with mean concentrations of 18.25 nmol/L which increased to 56 nmol/L after treatment. After one year, there was a median increase of 2.98% at the lumbar spine in the treatment group versus −0.21 in placebo and a 1.19% increase at the femoral neck versus −0.83% in placebo group. There was a significant increase in BMD at the total body and the trochanter compared to placebo.190,237
In a two year trial, Cooper evaluated the effect of oral 10,000 IU vitamin D2 weekly plus calcium 1,000 mg versus calcium alone, and did not find a significant difference in annual change of the lumbar spine, femoral neck or forearm BMD between the two groups.120
For meta-analyses, given that calcium alone increases bone density, BMD results from similar sites and treatment durations were combined in the following groups: (1) vitamin D3 alone, (2) vitamin D3 plus calcium versus placebo, and (3) vitamin D3 plus calcium versus calcium. Due to variable reporting, and differences in treatment arms, quantitative pooling was limited.
The combined results by BMD site are presented in Table 14. Eleven trials provided data that allowed quantitative analysis.117-120,180,181,183,184,204,241,242
Oral vitamin D3plus calcium versus placebo. Comparing vitamin D3 plus calcium to placebo, there were significant increases in BMD at the lumbar spine after one year with a combined estimate from two trials (N = 507) of 1.40 percent (95% CI 0.84, 1.97).184,237,241 Significant increases at the femoral neck180,184,237,241 were observed with a combined estimate of
1.37 percent (95% CI 0.24, 2.50) from three trials after one year. The heterogeneity of treatment effect varied from low to moderate depending on the site (Table 14).
Oral vitamin D3versus placebo. The combined estimates of trials that evaluated BMD of the lumbar spine242 or forearm119 were not significant with vitamin D3 alone, although in both trials the dose of vitamin D3 was 300 or 400 IU daily. In the trial by Ooms, there was a significant increase in femoral neck BMD with 400 IU vitamin D3 versus placebo over two years.119
Oral vitamin D3plus calcium versus calcium. The combined results of trials, including the trial on African American women, that compared vitamin D3 plus calcium vs. calcium did not demonstrate a significant effect on BMD of the lumbar spine, total hip, forearm or total body.117,204
Effect of baseline 25(OH)D concentrations and BMD response to vitamin D. Four trials assessed the effect of baseline serum 25(OH)D and BMD response to either vitamin D3 or D2.117-120 One trial had a population that was vitamin D deficient (median serum 25(OH)D 25-27 nmol/L by CPBA) and reported that the effect of vitamin D3 on femoral neck BMD was independent of baseline 25(OH)D concentrations.119 The other studies, one of which included African American women, did not report an association between baseline serum 25(OH)D concentrations and changes in BMD.
|
Summary. Effect of Vitamin D supplementation on bone mineral density in women of reproductive age, postmenopausal women and older men Quantity: Seventeen RCTs evaluated the effect of supplemental vitamin D2 or D3 on BMD, predominantly in populations of late menopausal women. Only one small trial included pre-menopausal women. Most trials had small sample sizes, were two to three years in duration and used vitamin D doses of ≤ 800 IU daily. Most trials used vitamin D3 and also included calcium ≥ 500 mg as a co-intervention. Quality: The Jadad quality score of the trials ranged from 1 to 5, with 13 of the 17 trials scoring ≥ 3/5. Most trials did not adequately report whether allocation sequence was concealed. Consistency: Combined results of trials of vitamin D3 plus calcium versus placebo were consistent with a small effect on lumbar spine, femoral neck and total body BMD. The WHI trial found a significant benefit of vitamin D3 400 IU plus 1,000 mg of calcium on total hip BMD. However, in combined trials of vitamin D3 plus calcium versus calcium, a significant increase in BMD was not observed, suggesting vitamin D3 may be of less benefit in calcium replete postmenopausal women. Vitamin D3 alone versus placebo did not show significant increases in BMD, except in one trial that noted an increase in femoral neck BMD. Only a few trials reported the impact of baseline serum 25(OH)D concentrations on BMD and in all of these trials, baseline 25(OH)D was not associated with increased BMD. Overall, there is good evidence that vitamin D3 plus calcium results in small increases in BMD of the spine, total body, femoral neck and total hip. Based on included trials, it was less certain if vitamin D3 alone has a significant effect on BMD. |
Table 13. Effect of Vitamin D2or D3on BMD by Site in Individual Trials
|
Author (year) Densitometer |
Duration Sample Size (n/total N) |
Vitamin D Type Dose (IU/day) Mean Dietary vitamin D intake (Tx/control) |
Lumbar spine BMD % change (SD) |
Femoral neck BMD % change (SD) |
Total Body BMD % change (SD) |
|||
|
Tx |
Control (e.g., placebo, calcium or lower dose of vit D) |
Tx |
Control |
Tx |
Control |
|||
|
Aloia (2005)117 Hologic QDR4500 |
3 years 208 |
800 D3 for 2y, then 2000 D3 for 1y + calcium (184 IU/d) |
0.25 (1.82) |
0.30 (1.82) |
NR |
NR |
−0.35 (1.60) |
−0.30 (1.50) |
|
Baeksgaard (1998)241 Norland DXA |
2 years 240 |
560 D3 + 1000 mg calcium (158/140 IU/d) |
1.6 |
−0.2 |
1 |
0.4 |
NR |
NR |
|
Chapuy (1992)181 Hologic QDR 1000 |
1.5 years 56 (56/3270) |
800 D3 + 1200 mg calcium (NR) |
NR |
NR |
2.90 (6.40) |
1.80 (9.40) |
NR |
NR |
|
Chapuy (2002)180 Hologic QDR 1000 |
2 years 114 (114/583) |
800 D3 + 1200 mg calcium (40/42 IU/day) |
NR |
NR |
−1.20 (7.40) |
−4.50 (7.10) |
NR |
NR |
|
Cooper (2003)120 Norland DXA |
2 years 276 (187/187) |
10,000 D2/wk + 1000 mg calcium (NR) |
0.21 (4.89) |
1.66 (5.27) |
0.87 (4.95) |
3.32 (5.10) |
NR |
NR |
|
Dawson-Hughes (1991)183 Lunar DPX |
1 year 261 (220-246/276 ) |
400 D3 + calcium 377 mg (during treatment 106/87- August - November) |
0.85 (2.41) |
0.15 (2.62) |
NR |
NR |
0.03 (1.35) |
−0.08 (1.25) |
|
Author (year) Densitometer |
Duration Sample Size (n/total N) |
Vitamin D Type Dose (IU/day) Mean Dietary vitamin D intake (Tx/control) |
Lumbar spine BMD % change (SD) |
Femoral neck BMD % change (SD) |
Total Body BMD % change (SD) |
|||
|
Tx |
Control (e.g., placebo, calcium or lower dose of vit D) |
Tx |
Control |
Tx |
Control |
|||
|
Dawson-Hughes (1995)118 Lunar DPX |
2 years 215 (215-246/261) |
700 D3 + 500 mg calcium (120/107 IU/day) |
−0.31 (2.87) |
−0.11 (3.15) |
−1.06 (3.76) |
−2.54 (4.07) |
−0.20 (1.66) |
−0.35 (1.56) |
|
Dawson-Hughes (1997)184 Companion: Lunar DPX |
3 years 389 |
700 D3 + 500 mg calcium (Women 174/184 IU/day Men 202/197 IU/day) |
2.12 (4.06) |
1.22 (4.25) |
0.50 (4.80) |
−0.70 (5.03) |
0.06 (1.83) |
−1.09 (1.71) |
|
Grados (2003)a237 Companions: Grados, (2003)b190 & Brazier (2005)191 Hologic, Lunar and Norland |
1 year 192 (67-72/192) |
800 D3 +1000 mg calcium (84.9/83.9 IU/day) |
2.98 * |
−0.21 * |
1.19 * |
−0.83* |
0.99 * |
0.11 * |
|
Author (year) Densitometer |
Duration Sample Size (n/total N) |
Vitamin D Type Dose (IU/day) Mean Dietary vitamin D intake (Tx/control) |
Lumbar spine BMD % change (SD) |
Femoral neck BMD % change (SD) |
Total Body BMD % change (SD) |
|||
|
Tx |
Control (e.g., placebo, calcium or lower dose of vit D) |
Tx |
Control |
Tx |
Control |
|||
|
Harwood, (2004)197 Hologic QDR 2000 |
1 year 150 (40/150) |
800 D3 + 1000 mg calcium, 300,000 D2 single injection, 300,000 D2 single injection+ 1000 mg calcium (NR) |
|
|
|
|
|
|
|
−1.6 (table 4-subgroup) |
8.2 |
−1.9 |
−0.9 |
NR |
NR |
|||
|
Hunter, (2000)203 Hologic QDR 2000 |
2 years 128 comparison of 64 pairs of twins |
800 D3 (135/134 IU/day) |
0.00 (5.62) |
0.00 (5.56) |
-- |
-- |
-- |
|
|
Jackson (2006)243 Hologic QDR 2000 and 4500 |
7 years (2431 of total sample) |
400 D3 + 1000 mg calcium (total vitamin D intake diet and supplements) 365/368 IU |
Graph |
Graph |
Graph |
Graph |
Graph |
Graph |
|
Jensen (2002)204 Hologic QDR 2000 |
3 years (68/83) |
400 D3 + 1450 mg calcium (NR) |
1.20 (4.32) |
0.73 (4.08) |
NR |
NR |
−1.10 (1.78) |
−1.78 (1.56) |
|
Komulaianen (1998)242 Lunar DXA |
5 years (206/425) |
300 D3 + 500 mg calcium (NR) |
−4.6 (5.08) |
−4.5 (4.90) |
−4.3 (5.03) |
−4.3 (4.9) |
NR |
NR |
Table 14. Combined Results of Effect of Vitamin D3on BMD
|
BMD site |
Comparison Duration, Sample size (N) |
WMD (95% CI), Heterogeneity I2 |
|
Lumbar spine |
Vitamin D3 + Ca vs. placebo 1 y - 2 trials (507) 2 y - 1 trial (197) 3 y - 1 trial (377) |
1.40 (0.84, 1.97), I2 = 0 1.80 (0.70, 2.9) 0.90 (0.06, 1.74) |
|
Vitamin D3 + Ca vs. calcium 1 y - 2 trials (263) 3 y - 2 trials (251) |
0.36 (−0.71, 1.43), I2 = 40 −0.03 (−0.52, 0.45, I2 = 0 |
|
|
Femoral neck |
Vitamin D3 vs. placebo 2 y - 1 trial (270) |
1.68 (0.13, 3.23) |
|
Vitamin D3 + Ca vs. placebo 1 y - 3 trials (625) 2 y - 3 trials (368) 3 y - 1 trial (386) |
1.37 (0.24, 2.50, I2 = 57 1.31 (−0.34, 2.97), I2 = 33 1.20 (0.22, 2.18) |
|
|
Vitamin D3 + Ca vs. calcium 2 y -1 trial (243) |
1.48 (0.50, 2.46) |
|
|
Total Hip |
Vitamin D3 + Ca vs. calcium 3 y - 1 trial (251) |
0.23 (−0.71, 1.17) |
|
Forearm |
Vitamin D3 vs. placebo 2 y - 1 trial (241) |
0.06 (−3.74, 3.86) |
|
Vitamin D3 + Ca vs. placebo 2 y - 1 trial (197) |
0.58 (−0.44, 1.62) |
|
|
Vitamin D3 + Ca vs. calcium 3 y - 1 trial (208) |
−0.25 (−0.68, 0.18) |
|
|
Total Body |
Vitamin D3 + Ca vs. placebo 1 y - 1 trials (314) 3 y - 1 trial (377) |
0.60 (0.34, 0.87) 1.15 (0.80, 1.50) |
|
Vitamin D3 + Ca vs. calcium 2 y - 2 trials (289) |
0.11 (−0.26, 0.48) |
Figure 6. Forest Plot: Effect of vitamin D3+ Calcium vs. Placebo on Femoral Neck BMD at 1 year
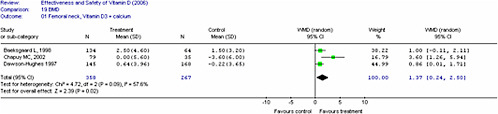
Question 3B.
What is the Evidence Regarding the Effect of Supplemental Vitamin D on Fractures in Women of Reproductive Age and/or Postmenopausal Women and Elderly Men?
Overview of Relevant RCTs
Study characteristics. Fifteen randomized trials evaluated the effect of either vitamin D2 or D3 (combined with or without calcium) on incident fractures. Thirteen trials were parallel design RCTs,180,181,184,197,210,218,231,242-247 and two were factorial trials.248,249 Duration ranged from one to seven years. Table 15 provides trial characteristics.
Thirteen trials randomized individual participants and the overall number of participants in the intervention arms was 32,092, with 32,491 participants in the control or placebo groups. Two trials randomized participants using a cluster design (cluster randomization refers to randomization by group, e.g., a residential unit). The combined sample size of the two cluster randomized trials was 6,719 in the intervention groups and 4,071 in the control groups.247,249 Porthouse et al. changed treatment allocation from unequal to equal during the trial so there are two entries for this study with different denominators: an equally randomized group (1:1 ratio) (study A) and an unequally randomized group (2:1 ratio in favor of the control) (study B).244
Population characteristics. Two trials were classified as secondary prevention trials as all participants had a history of fractures.197,248 Four other trials reported a baseline fracture prevalence that ranged from 10.7 to 26 percent.242-244,249
Seven trials included only postmenopausal females,180,181,197,218,242-244 and eight trials included both older males and postmenopausal females.184,210,231,245-249 Of these eight trials, the percentage of females ranged from 25231 to 95 percent.246 There were no trials in women of reproductive age.
Nine trials included community-dwelling participants.184,218,231,242-245,248,249 One trial included community-dwelling participants living independently in apartments.210 Four trials included cohorts of participants living in residential homes.180,181,246,247 One trial was conducted with hospitalized participants who had been community-dwelling prior to admission.197
Interventions. Eleven RCTs allocated participants to oral vitamin D3 with dosages ranging from 300 to 800 IU/day. Harwood allocated participants to either oral vitamin D3 arm or injectable vitamin D2 arms.197 Six trials used an oral dose of 800 IU vitamin D3 per day180,181,197,218,244,248 one trial administered 700 IU D3,184 and four trials a dosage of ≤ 400 IU vitamin D3 daily.210,242,243,249
Two trials used daily oral vitamin D2 with dosages equivalent to 1,000 or 1,100 IU, respectively.246,247
Two trials used an injectable preparation of either vitamin D2 or D3. Harwood used a single dose of 300,000 IM vitamin D2197 and another trial used an annual dose of 300,000 IU vitamin D3.245
Calcium supplementation as a co-intervention ranged from 500 mg in two trials184,242 to 1,000 mg in five trials197,243,244,248,249 to 1200 mg/day in three trials.180,181,218
Porthouse et al. had high baseline levels of dietary calcium intake in both the intervention (1,075 mg) and control groups (1,084 mg), and provided all participants with information on dietary calcium and vitamin D.244 Jackson also had a high mean baseline intake of calcium in both intervention and control groups (1,150 mg).243
Comparators. Seven trials compared oral or injectable vitamin D to placebo or control.197,210,231,243,245,247,248 Seven trials compared a combination of vitamin D plus calcium to placebo.180,184,197,243,244,248,249 Four trials compared vitamin D plus calcium versus calcium alone.218,242,246,248
Compliance. Compliance with vitamin D was reported in eleven trials and was greater than 80 percent in five trials.180,181,210,218,242 Compliance was less than 80 percent in six trials.184,231,243,243,244,248 In the three largest trials, the compliance ranged from 55 to 63 percent.243,244,248
Study quality. One trial had a quality score of 2/5 on the Jadad scale.181 Ten trials had a score of ≥ 3/5,180,184,197,210,231,242,244-246,248 and of these, two trials had the maximum score of five.210,248
Eight trials had losses to followup greater than 20 percent.180,181,184,197,210,231,246,248
Two trials provided an adequate description of allocation concealment,210,248 and allocation concealment was unclear in the remaining trials.
Type of analysis. Twelve trials reported an intention-to-treat analysis,180,181,184,210,231,242-244,246-249 and in three trials, an efficacy analysis was conducted or the type of analysis was unclear.197,218,245
Fracture outcomes. Three RCTs provided data on vertebral fractures,231,243,248 twelve trials on non-vertebral fractures,180,181,184,197,210,218,231,242-244,247,248 and fourteen trials provided data on either total or hip fractures.180,181,184,197,210,218,231,242-244,246-249
Ascertainment of fractures. Ascertainment of fractures varied with some trials using self-report (± x-ray confirmation) or administrative data197,210,231,244,246,249 and other trials verifying fractures by x-rays.180,181,184,218,242,243,248 One trial used several sources including self-report, physician verification, and administrative databases.248 Vertebral fractures were ascertained only by questionnaire in one trial231 and confirmed by x-rays in two trials.243,248
25(OH)D concentrations. Eleven trials reported baseline 25(OH)D concentrations.180,181,184,197,210,218,242,243,247-249 In six trials, 25(OH) concentrations were measured in a sub-sample of the total trial population.181,242,243,247-249
Vitamin D deficiency. Mean baseline serum 25 (OH)D concentrations below 30 nmol/L were reported in five trials.180,197,210,218,242
Eleven trials reported followup or change in mean 25(OH) D concentrations.180,181,184,197,210,218,231,242,247-249 Serum 25(OH)D concentrations were not reported in three trials.244-246 (See Table 16.)
Quantitative Data Synthesis
We conducted a meta-analysis of the 13 randomized trials that provided adequate data on fracture outcomes. Two entries (Study A and B) from Porthouse et al. are presented since the allocation changed from unequal to equal during the trial.244
Included in the meta-analysis is the Women’s Health Initiative (WHI, 2006) trial on calcium plus vitamin D3 (400 IU). The WHI trial was the largest primary prevention trial and involved 36,282 postmenopausal women (mean age of 62.4 years). Women enrolled in the WHI HRT and dietary modification trials were invited to participate in the calcium and vitamin D trial. A unique feature of this trial was that over 50 percent of women were current users of hormonal replacement therapy (HRT) and the rate of use of other osteoporosis medications was one percent. In this trial, the overall risk reduction in hip fractures with vitamin D plus calcium was not significant compared to placebo (12 percent, 95% CI -8 to 28). In subgroup analyses of women over age 60 years, and in women who were compliant, there was a significant reduction in hip fractures compared to placebo [≥ 60 years (21 percent, 95% CI 2-36); compliant women (29 percent, 95% CI 3-48)].243
Total fractures. Combined results from 13 trials (N=58,712) that used either oral vitamin D3or D2+/− calcium versus calcium or placebo resulted in a non-significant reduction in total fractures [(OR 0.90, (95% CI 0.81, 1.02), p=0.09)] with a I2 of 48 consistent with moderate heterogeneity of treatment effect (Figure 7).
Combined results from three trials (N=7,939) of vitamin D3alone versus placebo were not consistent with a significant reduction in total fractures [(OR 0.98, 95% CI, 0.79-1.23), p=0.08, I2=61 consistent with high heterogeneity].210,231,248
Combined results of three trials of vitamin D3plus calcium versus calcium (N=2,997)218,242,248 resulted in a non-significant reduction in total fractures [(OR 0.92, 95% CI 0.74-1.25), I2=10.2 percent].
Combined results of seven trials of vitamin D3plus calcium versus placebo (n=46,072)180,181,184,197,243,244,248 were consistent with a non-significant reduction in total fractures [OR 0.87, 95% CI 0.76-1.00, p=0.05, I2=43 percent] (Figure 8).
Non-vertebral fractures. Combined results from three trials (n=7,939)210,231,248 of vitamin D3alone versus placebo were not consistent with a significant reduction in non-vertebral fractures [(OR, 0.99, 95% CI, 0.83-1.17), p = 0.89, I2 = 27.6 percent].
Combined results from seven trials (N = 46,074),180,181,184,197,243,244,248 of vitamin D3plus calcium versus placebo were consistent with an OR of 0.87 (95% CI 0.75-1.00, p = 0.05), and a I2 of 44 percent.
Hip fractures. Combined results of three trials (N=7,939)210,231,248 of vitamin D3versus placebo were not consistent with a significant reduction in hip fractures [OR 1.11, 95% CI 0.86-1.44, I2 = 0].
The combined results of three trials of vitamin D3plus calcium versus calcium (N=2,997)218,242,248 were not consistent with a significant reduction in hip fractures [OR 0.91, 95% CI 0.61- 1.36, I2 = 0].
Combined results from seven trials (n=46,072)180,181,184,197,243,244,248 of vitamin D3plus calcium versus placebo were consistent with a non-significant effect, although the point estimate favoured vitamin D [OR 0.83, 95% CI 0.68-1.00, p=0.05, I2=16.2 percent] (Figure 8).
Vertebral fractures. The combined OR from three trials (n=44,260) with oral vitamin D2 or D3 (+/− calcium) versus placebo or calcium for vertebral fractures was 0.88 (95% CI 0.73- 1.07), I2=0.231,243,248
Results of Trials not Included in the Quantitative Synthesis
Larsen249 was a factorial cluster-randomized trial that did not appear to control for the effect of clustering in their per protocol analysis, so the results were not combined with the other trials.
Larsen administered 400 IU vitamin D3 with 1,000 mg calcium daily versus placebo and reported a significant reduction in total fractures [RR 0.84 (95% CI 0.72, 0.98), p<0.025]. When results were presented by gender, females had a decreased fracture risk [RR 0.81 (95% CI 0.68-0.95), p<0.01].249
Andersen et al. administered an annual injection of 300,000 IU of vitamin D3 versus placebo and did not report a significant reduction in hip fractures [HR 1.48 (95% CI 1.01-2.17)] or for any fracture [HR 1.10 (95% CI 0.94-1.29), p = 0.23)]. The results were similar in both males and females. Complete data were not provided.245
Subgroup and Sensitivity Analyses
To explore the heterogeneity of treatment effect we conducted subgroup analyses by: residential status (community-dwelling versus institutional), dosage, and 25(OH)D concentrations for the outcome of total fractures. Combining the three trials of vitamin D2/D3 plus calcium versus placebo or calcium in institutionalized populations180,181,246 resulted in a significant reduction in total fractures [OR 0.73 (95% CI 0.61-0.88), I2 = 0] versus a non
significant reduction when combining nine trials of community-dwelling participants [OR 0.95, (95% CI 0.86, 1.05) I2 = 23.4].184,197,210,218,231,242-244,248
When exploring heterogeneity of the seven trials of vitamin D3 and calcium versus placebo by residence, the combined OR for two trials180,181 in elderly populations in institutions was significant [OR 0.69 (95% CI 0.53, 0.90), I2 = 0] (Figure 9).
Subgroup analysis by dosage, (i.e., combining trials ≥ 800 IU of vitamin D versus those trials using < 800 IU/day) did not explain the heterogeneity of treatment effect.
In sensitivity analyses, we explored the heterogeneity of treatment effect by combining: (1) trials with high versus low study quality, (2) trials with over 80 percent compliance versus those with less than 80 percent compliance, and (3) trials that adequately reported allocation concealment compared to trials in which allocation concealment was not reported or was unclear. None of these analyses had a significant impact on the heterogeneity of treatment effect.
Effect of 25(OH)D concentrations on fracture risk. Eleven trials evaluated baseline serum 25(OH)D concentrations and five trials had low baseline serum 25(OH)D concentrations (<30 nmol/L).180,197,210,218,242 One trial that reported a significant reduction in fracture risk,181 had a mean baseline 25(OH)D concentration of 40 nmol/L.
Followup serum 25(OH)D concentrations (≥ 74 nmol/L) were reported in three trials that reported a significant reduction in total fractures.181,184,231
Combining the results from four trials of vitamin D3180,181,184,231 that had end of study 25(OH)D concentrations of ≥74 nmol/L was consistent with a significant reduction in total fractures [OR 0.73 (95 % CI 0.63-0.85), I2 = 0] compared to a non-significant reduction when combining results of trials with end of study 25(OH)D concentrations of < 74 nmol/L.
Publication bias. An evaluation of publication bias, using the method by Begg et al.250 suggested the possibility of bias, with a lack of smaller trials that failed to find an effect of vitamin D on fracture reduction..
|
Summary. Effect of vitamin D supplementation on fractures in women of reproductive age, postmenopausal women and older men Quantity: Fifteen trials examined the effect of either vitamin D2 or D3 alone or in combination with calcium on total, non-vertebral and hip fractures in postmenopausal women or older men. Few trials evaluated vertebral fractures. Most trials used vitamin D3. There were no trials identified in premenopausal women. Quality: Ten individually randomized trials had quality scores of ≥ 3 and eight trials reported high losses to followup. Consistency: Combining the results from 13 randomized trials of vitamin D2/D3 +/− calcium resulted in a non-significant reduction in total fractures that persisted when only trials of higher quality were combined. When combining seven trials of vitamin D3(400-800 IU) plus calcium, there was a reduction in the risk of total and hip fractures. However, in a subgroup analysis, this benefit was only evident when combining trials of institutionalized elderly subjects. One possible explanation is that the mean serum 25(OH)D level achieved in trials of institutionalized participants was higher than in the trials on community dwellers, and provided a greater level of vitamin D repletion. The combined estimate from trials with higher end-of-study serum 25(OH)D concentrations (≥ 74 nmol/L) was consistent with a significant reduction in fractures. This needs to be interpreted with caution given the variability in the 25(OH)D assays and incomplete assessment of vitamin D status in the fracture trials. The evidence for vitamin D3 plus calcium supplementation in community-dwelling individuals is less strong although one trial found a significant fracture reduction in community-dwelling older men and women, and in a subgroup analysis from the WHI trial, there was a reduction in hip fractures in women over age 60 years. Vitamin D3 combined with calcium is effective in reducing fractures in institutionalized populations. |
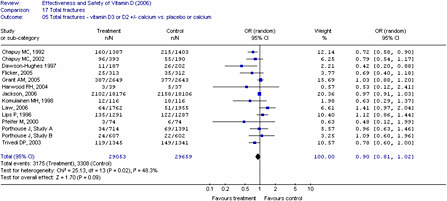
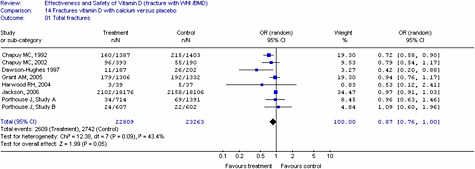
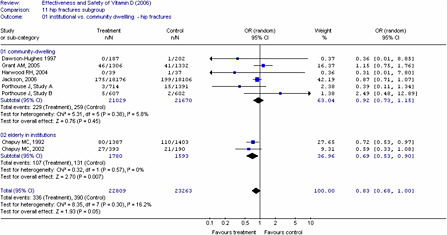
Table 15. OR (95% CI) for Total Fractures from Individual RCTs of Vitamin D
|
Author (year) |
Duration (year) |
Sample Size, N |
Vitamin D (IU/day) F/Up |
25(OH)D Assay |
Mean Baseline 25(OH) nmol/L IG |
End of trial 25(OH)D nmol/L IG |
OR (95% Score CI) |
Jadad Score+ |
|
Chapuy (2002)180 |
2 |
583 |
800D3 + 1200 mg Ca |
CPBA |
22 |
75 (graph) |
0.79 (0.54, 1.17) |
3 |
|
Chapuy (1992)181 |
1.5 |
3270 |
800D3 + 1200 mg Ca |
CPBA |
40 |
105 |
0.72 (0.58, 0.90) |
2 |
|
Lips (1996)210 |
4 |
2578 |
400 D3 |
CPBA |
27 |
62 |
1.12 (0.86, 1.44) |
5 |
|
Dawson-Hughes (1997)184 |
3 |
389 |
700 D3 + 500 mg Ca |
CPBA |
82.7 M, 67.5 F |
112 |
0.42 (0.20, 0.88) |
4 |
|
Law (2006)247 |
1 |
3717 |
1,100 D2 |
IA |
59 |
77 |
1.4 (0.9,2.0) |
2 |
|
Pfeifer (2000)218 |
1 |
148 |
800D3 + 1200 mg Ca |
RIA |
25.6 |
66.1 |
0.48 (0.12, 1.99) |
3 |
|
Komulainen (1998)242 |
5 |
232 |
300 D3 + 500 mg Ca |
CPBA |
28.6 |
37.5 |
0.71 (0.31, 1.61) |
3 |
|
Grant (2005)248 |
5 |
5292 |
800 D3 ± 1000 mg |
HPLC* |
39 |
62.2 |
1.02 (0.84, 1.22) |
5 |
|
Flicker (2005)246 |
2 |
625 |
1,100 D2 1,000 mg Ca |
RIA |
NR |
NR |
0.69 (0.4, 1.18) |
4 |
|
Jackson (2006)243 |
7 |
36,282 |
400 D3 + 1000 mg Ca |
RIA* |
46 |
NR |
0.97( 0.91, 1.03) |
4 |
|
Porthouse (2005)244 |
2 |
3314 |
800 D3 + 1000 mg Ca |
- |
- |
- |
0.96 (0.65, 1.46) Unequal |
3 |
|
|
|
|
|
|
|
|
1.09 (0.60, 1.96) Equal |
|
|
Trivedi (2003)231 |
5 |
2686 |
100,000 D3 q 4 mo |
RIA** |
NR |
74.3 |
0.78 (0.60, 1.00) |
3 |
|
Harwood (2004)197 |
1 |
150 |
800 D3 + 1000 mg Ca |
RIA |
(28-30) |
(40-50) |
0.58 (0.13, 2.64) |
3 |
|
|
||||||||
|
Note: *subsample of total group; **assay obtained from author; +allocation concealment was unclear for all trials except Grant 2005248 (adequate), Dawson-Hughes 1997251 (adequate) and Lips 1996210 (adequate). |
||||||||
Question 3C.
What is the Evidence Regarding the Effect of Supplemental Vitamin D on Falls in Postmenopausal Women and Elderly Men?
Overview of Relevant RCTs
Study characteristics. A total of 14 trials in 16 published reports evaluated the effect of vitamin D on falls and of these, 12 were RCTs with a parallel design,114,115,180,184,185,197,218,231,244,246,247,252 and four used a factorial design.208,248,249,253
Three trials used cluster randomization247,249,253 and the remaining trials randomized by individual patient.114,115,180,184,185,197,208,218,231,244,246,248,252 Porthouse et al. randomized patients in an equally randomized group in a 1:1 ratio (referred to as "study A") as well as, an unequally randomized group in a 2:1 ratio in favor of the control group (referred to as "study B").244
Bischoff-Ferrari et al. (2006)185 was identified as the companion paper to the primary publication Dawson-Hughes et al. (1997)184 and Larsen et al.(2005)253 was identified as companion paper to Larsen et al. (2004).249 We refer to the primary publications of each trial when discussing the results. Table 16 summarizes characteristics of the included trials.
Within the 12 RCTs, a total of 5,445 participants received the intervention and 5,212 received the control or placebo.114,115,180,184,197,208,218,231,244,246,248,252 In the two cluster randomized trials, 6,719 participants received the intervention and 6,603 received control.247,249
Population characteristics. A total of six trials included postmenopausal women only (i.e., greater than or equal to 95 percent of the participants were female)114,180,197,218,244,246 whereas the remaining eight trials included a combination of postmenopausal women and elderly men.115,184,208,231,247-249,252
Seven trials included community-dwelling residents115,184,218,231,244,248,249 and seven included participants who lived in residences with varied levels of assisted care.114,180,197,208,246,247,252
Interventions. Eleven trials used oral vitamin D3,114,180,184,197,208,218,231,244,248,249,252 two trials used oral vitamin D2,246,247 and two used a single intramuscular injection of vitamin D2.115,197
Six trials had an intervention arm of oral vitamin D plus calcium,180,184,197,244,246,248 and Harwood et al. had an injectable D2 treatment arm with and without calcium.197
Comparators. Seven trials compared vitamin D with placebo or control,115,197,208,231,247,248,252 and one trial compared vitamin D with calcium.248 Of the trials that used a combination of vitamin D plus calcium, the comparator was placebo in five trials180,184,197,244,248 and calcium in four trials.114,218,246,248
Compliance. Ten of the 14 trials reported the compliance rate with taking vitamin D.114,115,180,184,208,218,231,244,246,248 The method of assessment varied from direct observation by a study nurse,114,115,180,208 self-report questionnaires,231,244,248 to pill counts.184,218,246 In six of the ten trials, compliance rates were over 80 percent,114,115,180,184,208,218 and less than 80 percent in the four other trials.231,244,246,248 In the three largest trials, the compliance rates were 55,244 63,248 and 76231 percent, respectively.
Study quality. Eleven of 12 RCTs had a quality score of three or more on the Jadad scale.114,115,180,184,197,208,218,231,244,246,248 The two factorial-designed trials received 1/5 and 2/5 on the Jadad scales, respectively.247,249 Seven trials reported losses to followup of over 20 percent114,180,184,197,231,246,248 Two trials provided an adequate description of allocation concealment,208,248 and in all other trials, the description of allocation concealment was unclear.114,115,180,184,197,218,231,244,246,252
Type of analysis. Ten trials reported an intention-to-treat analysis,114,115,180,184,231,244,246-249 whereas four trials used an available case analysis in which the data were analyzed for every participant in whom the outcome of falls was obtained.197,208,218,252
Fall outcomes. Thirteen RCTs reported the number of individuals with falls,114,115,180,184,197,208,218,231,246-249,252 and the data was provided by the authors for one trial.244
Definition of falls. Seven trials included a definition for falls, all of which were a variation on “unintentionally coming to rest at a lower level or on the ground.”114,115,184,218,246,249,252
Ascertainment of falls. Different methods were used to ascertain the number of individuals with falls, and these included the use of postcards with followup visits,184 questionnaires,218,231,244,248 fall diaries with/without followup visits,115,208,246,252 followup visits only,180,197 hospital contacts,249 and record keeping by geriatric care staff.114,247
25(OH)D levels. Ten out of the 14 trials reported baseline 25(OH) D levels,114,115,180,184,197,208,218,247-249 seven trials reported the end of study 25(OH)D values114,115,197,231,247-249 and two reported the change in 25(OH)D from baseline.208,218 Three trials evaluated baseline and followup 25(OH) D levels in a sub-sample only.247-249 For vitamin D assay, baseline and end of study 25(OH)D levels (intervention group only) in the included trials refer to Table 16.
Quantitative Data Synthesis
Meta-analyses were conducted using data from the 12 RCTs to explore the effect of oral/injectable vitamin D with/without calcium on the risk of falls.114,115,180,184,197,208,218,231,244,246,248,252 Data from the two cluster randomized trials247,249 were not included in the quantitative analyses with trials that randomized individual patients. Refer to Tables 16 and 17 for a summary of the results.
Oral vitamin D alone. Combined data from four trials (N = 5,958) of oral vitamin D3versus placebo did not demonstrate a statistically significant reduction in the risk of falls [OR 1.03 (95% CI 0.91-1.17), heterogeneity I2 = 0 percent).208,231,248,252
Only one trial looked at the effect of oral vitamin D3versus calcium (N = 2,654), and the results did not demonstrate a statistically significant reduction in falls [OR 1.19 (95% CI 0.96 – 1.47)].248
Combined data from four trials (N = 7269) of oral vitamin D3versus placebo or calcium did not demonstrate a significant reduction in the risk of falls [OR 1.05 (95% CI 0.93-1.19), heterogeneity I2 = 0 percent).208,231,248,252
Oral vitamin D with calcium. Combined data from five trials (N = 7,056) of oral vitamin D3with calcium versus placebo showed a statistically significant reduction in the risk of falls [OR 0.85 (95% CI 0.76-0.96), heterogeneity I2 = 0 percent].180,184,197,244,248
Combined data from four trials (N = 3,512) of oral vitamin D2/D3with calcium versus calcium demonstrated a significant reduction in the fall risk [OR 0.81 (95% CI 0.68-0.97), heterogeneity I2 = 0 percent].114,218,246,248
Combined data from eight trials (N = 9,262) of oral vitamin D2/D3with calcium versus placebo or calcium demonstrated a significant reduction in the risk of falls [OR 0.84 (95% CI 0.76-0.93), heterogeneity I2 = 0 percent].114,180,184,197,218,244,246,248 Refer to Figure 10 for forest plot.
Oral vitamin D with or without calcium. Combined data from 11 trials (N = 13,888) of oral vitamin D2/D3with and without calcium versus placebo or calcium did not demonstrate a significant reduction in the risk of falls [OR 0.92 (95% CI 0.85-1.00), heterogeneity I2 = 0 percent).114,180,184,197,208,218,231,244,246,248,252
Injectable vitamin D. Combined data from two trials (N = 214) of injectable vitamin D2versus placebo did not show a statistically significant reduced fall risk [OR 0.31 (95% CI 0.04–2.12)]. However, heterogeneity of the treatment effect was high (I2 = 78.4 percent).115,197 Possible explanations include differences in the study populations (elderly women posthip fracture versus ambulatory elderly men and women with unreported fall histories) and dose of the vitamin D2 injection (300,000 IU versus 600,000 IU of vitamin D2).
A small trial (N = 73) of injectable D2with calcium versus placebo did not demonstrate a significant reduction in the risk of falls in the treatment group [OR 0.37 (95% CI 0.12-1.12)].197
Combined data from two trials (N = 250) of injectable vitamin D2with or without calcium versus placebo did not show a statistically significant reduction in falls [OR 0.42 (95% CI 0.13-1.33)]. However, heterogeneity of the treatment effect was high (I2 = 67.6 percent).115,197 See above for possible explanations.
There were no trials that compared the effects of injectable vitamin D with or without calcium to calcium alone.
Oral or injectable vitamin D with or without calcium. Combined data from nine trials (N = 11,895) of vitamin D2/D3(oral or injectable) with or without calcium versus placebo did not demonstrate a significant reduction in the risk of falls [OR 0.91 (95% CI 0.81-1.01), heterogeneity I2 = 24.4 percent].115,180,184,197,208,231,244,248,252
Combined data from four trials (N = 4,855) of vitamin D2/D3(oral or injectable) with and without calcium versus calcium also did not demonstrate a significant reduction in the risk of falls [OR 0.88 (95% CI 0.70-1.10), heterogeneity I2 = 28.8 percent).114,218,246,248
Combined data from all 12 trials (N = 14,101) of vitamin D2/D3(oral or injectable) with and without calcium versus placebo or calcium demonstrated a borderline significant reduction in fall risk [OR 0.89 (95% CI 0.80-0.99), heterogeneity I2 = 23.2 percent) (refer to Figure 11).114,115,180,184,197,208,218,231,244,246,248,252
Publication bias. A funnel plot (OR versus precision [1/standard error]) of the 12 RCTs that investigated the effect of oral or injectable vitamin D with/without calcium versus placebo or
calcium on fall incidence indicates possible asymmetry that was confirmed statistically (intercept 0.27 (90% CI 0.19 to 0.35), p = 0.0001), suggesting the possibility of bias although other potential causes of asymmetry exist (Figure 12).
We conducted separate subgroup and sensitivity analyses to ascertain whether the ‘overall’ treatment effect observed in our earlier analyses was influenced by various clinical or methodological characteristics respectively.
Subgroup and Sensitivity Analyses
Subgroup analyses were conducted as follows: (1) dose of vitamin D (less than or ≥ 800 IU/day; (2) setting (community-dwelling versus institutional participants); (3) study duration (≤ versus > one year, and; (4) gender (postmenopausal women versus a mixed population). The sensitivity analyses included: (1) ascertainment of falls (adequate definition and method of ascertainment versus inadequate or not reported); (2) compliance (less than versus greater than 80 percent); (3) allocation concealment (adequate versus unclear) and; (4) loss to followup (less than versus greater than 20 percent).
Combining six trials (N = 4,942) that included postmenopausal women only demonstrated a significant reduction in falls [OR 0.80 (95% CI 0.66-0.98)]. However, the heterogeneity of treatment effect was moderate (I2 = 44.8 percent) (Figure 13).114,180,197,218,244,246 However, combining trials by dose, setting and study duration did not demonstrate a significant reduction in falls.
For the sensitivity analyses, combining results from ten RCTs (N = 8,566) in which the allocation concealment was unclear demonstrated a significant reduction in falls [OR 0.85 (95% CI 0.76-0.96), heterogeneity I2 = 23.2 percent] ((Figure 14).114,115,180,184,197,218,231,244,246,252 Lastly, combining the six RCTs (N = 1,833) in which falls and ascertainment were adequately defined demonstrated a significant reduction in falls [OR 0.79 (95% CI 0.65-0.96), heterogeneity I2 = 0 percent].114,115,184,218,246,252
Results of Trials not Included in the Quantitative Synthesis
Both Larsen et al.249 and Law et al.247 were not included in the meta-analysis as they were cluster randomized trials. Larsen et al. compared 400 IU vitamin D3 plus 1,000 mg calcium carbonate daily to placebo and a multivariate analysis, including age, marital status and intervention program, demonstrated a 12 percent reduction in fall risk in those females who followed the calcium plus vitamin D program (RR 88, 95% CI 0.79-0.98). However, the effect of clustering was not controlled for in their analysis.249 Law et al. compared 100,000 IU of vitamin D2 every three months (equivalent to 1,100 IU daily) and did not find a significant reduction in fall risk in elderly people in care homes after adjusting for age, sex, length of time in trial and the cluster randomization of the trial (RR 1.09, 95% CI 0.95-1.25).247
Do Benefits of Vitamin D Supplementation on Falls Vary with Baseline Serum 25(OH)D Levels?
We were not able to quantitatively analyze if the effect of vitamin D supplementation on fall risk varies with baseline 25(OH)D levels as only four out of the 14 trials reported adequate data115,180,197,218 Three of the trials evaluated the effect of oral vitamin D3 (800 IU/day) and calcium,180,197,218 and two evaluated the effect of vitamin D2 in a single injection (300,000 IU or 600,000 IU) with/without calcium on falls.115,197 The 25(OH)D assays used were either RIA115,197,218 or CPBA.180 Differences in the type of vitamin D administered (D2 versus D3), route of administration (oral versus injectable), vitamin D dosage and 25(OH)D assays used in these four trials limit a direct comparison. Refer to Table 16 for baseline 25(OH)D levels, the assays used and OR (95% CI) of the trials.
|
Summary. The effect of vitamin D supplementation on falls in postmenopausal women and older men. Quantity: Combined results from 12 RCTs (N = 14,101) demonstrated a small reduction in falls with vitamin D2/D3 (oral or injectable) +/− calcium (OR 0.89, 95% CI 0.80-0.99) with the individual treatment effects ranging from OR 0.28 (95% CI 0.12-0.67) to 1.16 (95% CI 0.70-1.92). In the two cluster randomized trials, one demonstrated a significant fall reduction in postmenopausal women taking vitamin D3 plus calcium (RR 0.88, 95% CI 0.79-0.98) whereas the other trial did not show a reduction in falls in elderly individuals taking vitamin D2 (RR 1.09, 95% CI 0.95-1.25). Quality: Mean quality score (Jadad) for the 12 RCTs was 3.5/5 (range 2-5/5) with 11 of 12 trials obtaining a quality score of ≥ 3. In addition, two cluster randomization trials of factorial design were of low quality. Only two trials provided an adequate description of allocation concealment and seven had losses to followup > 20 percent. For the two cluster randomized trials, only one controlled for the effect of clustering. Consistency: The results from trials examining the effect of supplemental vitamin D on falls is consistent with 12 of the 14 trials demonstrating a non-significant reduction in falls. However, when combining RCTs there is inconsistent evidence regarding the effect of supplemental vitamin D on falls. The combination of 12 trials of either oral or injectable vitamin D2/D3 (+/−) calcium did demonstrate a small reduction in fall risk. Combination of eight RCTs of oral vitamin D2/D3 supplementation with calcium showed a reduction in fall risk, whereas four RCTs of oral vitamin D3 alone did not. Subgroup analyses showed a significant reduction in falls upon combining trials of postmenopausal women only. Sensitivity analyses showed a significant reduction in falls when combining (1) RCTs that explicitly defined falls and the method of fall ascertainment and (2) those in which the allocation concealment was unclear. However, combining trials by degree of compliance and loss to followup did not. Overall: There is inconsistent evidence that supplemental vitamin D reduces falls in postmenopausal women and older men. |
Table 16. OR (95% CI) from Individual RCTs Included in the Meta-Analysis on the Effects of Vitamin D on Fall Risk
|
Author (year) |
Duration (year) |
Sample size |
Vit D Dose (IU/d), Type |
Serum 25(OH)D Assay |
Baseline 25 (OH)D (nmol/L) mean (SD) IG |
End of Study 25(OH)D (nmol/L) Mean (SD) in IG |
OR (95% CI) |
Jadad Score |
|
Oral Vitamin D |
||||||||
|
Bischoff (2003)114 |
0.25 |
122 |
800 D3 + 1,200 mg Ca |
RIA |
Median 30.75+ |
Median 65.5 + |
0.68 (0.30, 1.53) |
3 |
|
Chapuy (2002)180 |
2 |
583 |
800 D3 + 1,200 mg Ca |
CPBA |
21.87+ |
1.08 (0.75, 1.54) |
3 |
|
|
Dawson-Hughes (1997)184 Companion: Bischoff-Ferrari 2006185 |
3 |
445 |
700 IU/d D3 + 500 mg Ca |
CPBA |
men: 82.75 (35.25); women: 67.5 (32.25)+ (all groups) |
- |
0.79 (0.54, 1.14) |
4 |
|
Flicker (2005)246 |
2 |
625 |
1,000 D2 + 600 mg Ca |
RIA |
- |
- |
0.82 (0.59, 1.12) |
4 |
|
Graafman (1996)252 |
0.6 |
354 |
400 D3 |
- |
- |
- |
0.91 (0.59, 1.40) |
2 |
|
Grant (2005)248 |
5 |
5,292 |
800 D3 |
HPLC |
25(OH)D3: *38.0 (16.25) (all groups) |
Mean change 25(OH)D3: |
0.99 (0.85, 1.16) |
5 |
|
Latham (2003)208 |
0.5 |
243 |
300,000 D3 (single dose) |
RIA |
Median: 37.5+ |
Median change: 22.5+ |
1.16 (0.70, 1.92) |
5 |
|
Trivedi (2003)231 |
5 |
2,686 |
833 D3 100,000 / 4 mos) |
- |
- |
74.3 (20.7) |
0.96 (0.79, 1.17) |
3 |
|
Pfeifer (2000)218 |
1 |
148 |
800 D3 + 1200 mg Ca |
RIA |
25.65 (13.63) |
66 |
0.51 (0.22, 1.15) |
3 |
|
Author (year) |
Duration (year) |
Sample size |
Vit D Dose (IU/d), Type |
Serum 25(OH)D Assay |
Baseline 25 (OH)D (nmol/L) mean (SD) IG |
End of Study 25(OH)D (nmol/L) Mean (SD) in IG |
OR (95% CI) |
Jadad Score |
|
Porthouse 2005)244 Study A (1:1) |
2 |
1,209 |
800 D3 + 1000 mg Ca |
- |
- |
- |
0.77 (0.60, 1.00) |
3 |
|
Porthouse 2005244 Study B (2:1) |
2 |
2,105 |
800 D3 + 1000 mg Ca |
- |
- |
- |
0.92 (0.75, 1.13) |
3 |
|
Injectable Vitamin D |
||||||||
|
Dhesi (2004)115 |
0.5 |
139 |
600,000 D2 (single injection) |
RIA |
26.75+ |
43.75+ |
0.73 (0.31, 1.75) |
5 |
|
Oral and Injectable Vitamin D |
||||||||
|
Harwood (2004)197 |
1 |
150 |
800 D3 + 1000 mg Ca (IG1), 300,000 D2 single injection (IG2) and 300,000 D2 single injection + 1000 mg Ca (IG3) |
RIA |
IG1 29 IG2 28 IG3 30 |
IG1 50 IG2 40 IG3 44 |
0.28 (0.12, 0.67) |
3 |
|
Note: *25(OH)D levels measured in subgroup only; +values transformed to SI units, ‡values derived from graph; pts – participants |
||||||||
Table 17. OR (95% CI) from Combined RCTs Included in the Meta-Analysis on the Effects of Vitamin D on Fall Risk.
|
Combined RCTs |
OR, 95% CI |
|
Oral vitamin D vs. placebo or calcium (4 trials, N = 7269) |
1.05 (0.93-1.19) |
|
Oral vitamin D + calcium vs. placebo or calcium (8 trials, N = 9,262) |
0.84 (0.76-0.93) |
|
Oral vitamin D (+/− calcium) vs. placebo or calcium (11 trials, N = 13,888) |
0.92 (0.85-1.00) |
|
Injectable vitamin D (+/− calcium) vs. placebo (2 trials, N = 250) |
0.42 (0.13, 1.33), I2 = 67.6% |
|
Overall Effect: Oral or injectable vitamin D (+/−calcium) vs. placebo or calcium, (12 trials, N = 14,101) |
0.89 (0.80-0.99) |
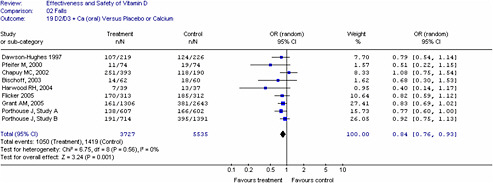
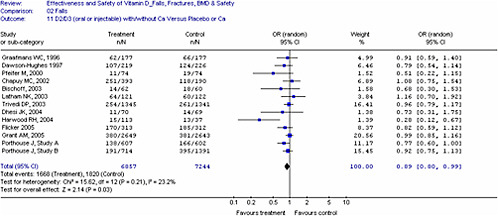
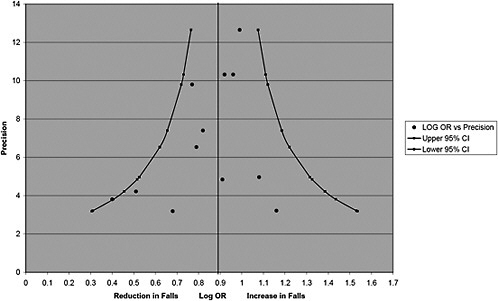
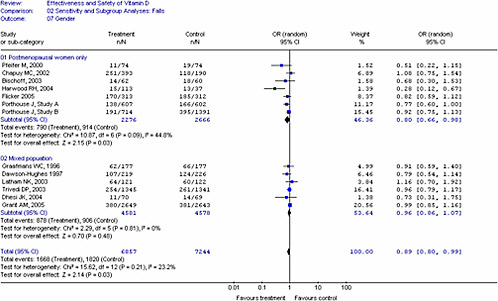
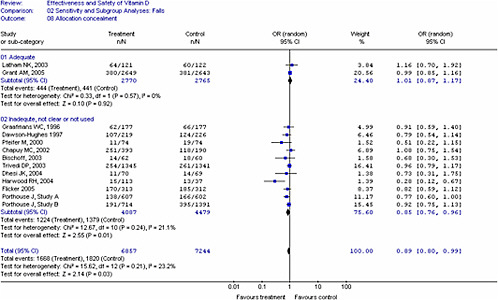
Question 4. Is There a Level of Sunlight Exposure (Time of Year, Latitude, BMI, the Amount of Skin Exposed) That is Sufficient to Maintain Adequate Vitamin D Concentrations, But Does Not Increase the Risk of Non-Melanoma or Melanoma Skin Cancer?
We did not identify any existing systematic reviews with our search of the vitamin D literature that addressed this question. Our search strategy may not have identified studies in the dermatology or photobiology literature that evaluated the effect of solar UV-B exposure in terms of a minimal erythemal dose and the risk of skin cancer.
A minimal erythemal dose (MED) is the amount of sun exposure required to produce a faint redness of the skin.254,255 Holick has stated that whole body exposure of healthy young and middle-aged adults to a single MED of simulated sunlight (equivalent to mid-day sun during summer at 41 degrees north) raised serum 25(OH)D to levels comparable to the oral ingestion of 10,000 to 25,000 IU of vitamin D3.255 Therefore, exposing the arms, face and hands (15 percent of the body surface) to 1 MED is estimated to produce the equivalent of 1,500 – 3,750 IU of vitamin D. Exposure of arms, face and hands to 1/6 to 1/3 MED should be adequate to produce doses in the range of current vitamin D adequate reference intakes. The amount of sun exposure that is needed to generate 1/3 MED will vary depending on external factors such as latitude, season, time of day, ozone amount, cloud amount, aerosol and reflectivity of the surface.256 It will also depend on individual factors such as skin type and age, with exposure times three to four times longer in individuals with highly pigmented skin.257,258
Beadle has also estimated epidermal vitamin D production in response to sun exposure.259 Of note, there is a limit to the amount of previtamin D3 that forms in skin with prolonged solar exposure as previtamin D3 can be photoisomerised further into inert isomers or back to 7-dehydrocholesterol (7-DHC).256
In an ecological study in Australia and New Zealand, data from the Global Solar UV Index, was used to convert daily Ultraviolet Index (UVI) data into sun exposure times. Unprotected sun exposure times (by location, month and time) that will produce 1/6 to 1/3 MED were developed for adults with moderately fair skin with exposure of 15 percent of body surface.260,261 The authors stated that it is impractical to prescribe a uniform message to the general population given the number of variables that need to be taken into consideration (e.g., latitude, skin pigmentation).261
The relation of a biological effect arising from UV radiation can be described by its wavelength dependence or action spectrum. The action spectrum of vitamin D synthesis in the skin is similar although not equivalent to the erythemal action spectrum.262,263 There are several action spectra that can be used for vitamin D (e.g., the 7-DHC absorption spectrum, the Ddosimeter action spectrum and the action spectrum for conversion of 7-DHC to previtamin D3).262,264,265 In a recently published model, a vitamin D3 effective UV dose (corresponding to an oral dose of approximately 1000 IU) was calculated, using the action spectrum for previtamin D3 synthesis, for different skin pigmentation types (Fitzpatrick I – VI skin types with skin of type VI
being dark skinned and the least sensitive to UV radiation).262 The model reference condition was Boston (mid-day, March 21, 42.2 degrees N, and total ozone approximating that defined in the U.S.standard atmosphere). The study took into account factors such as variable atmospheric and surface conditions, time of day, percent body exposure and dietary vitamin D intake. A changing erythema risk:vitamin D3 benefit ratio of sun exposure was identified as a function of solar elevation angle (i.e., latitude and season) with the least margin between adequate exposure for vitamin D3 synthesis and risk of sunburn at the low solar elevation angles that are common at high lattitudes.262
Another recent study263 has investigated the seasonal dependence of vitamin D UV levels relative to erythemal levels in the U.S., using calibrated high accuracy instruments. During eight months of the year (March-October) for all sites (18°N to 44°N), there was no measured latitude gradient of vitamin D UV even at the highest latitude, in contrast to a previous study.266 At lower latitudes (< 25°N), wintertime vitamin UV D levels were equal to summertime levels.263
Erythema may also represent a different endpoint than DNA damage i.e., an erythemal dose may be unrelated to the extent of DNA damage or individual susceptibility to DNA damage may vary. A direct quantitative relation between erythema and DNA damage has not been firmly established.267
Epidemiologic and experimental preclinical evidence exists that the three commonest types of skin cancer (cutaneous malignant melanoma, squamous cell carcinoma, and basal cell carcinoma) are caused by sun exposure.268 The relation of skin cancer to UV exposure differs depending on the type of cancer. For example, cumulative or chronic sun exposure appears to increase the risk of squamous cell carcinoma whereas risk of cutaneous malignant melanoma (CMM) and basal cell carcinoma appear to be related more to intermittent UV exposure, particularly early in life.269 The relation of CMM to sun exposure is complex, and only recently has it been possible to experimentally identify an action spectrum for melanoma.270 The effect of UV exposure and vitamin D photosynthesis on CMM may also be complex as melanoma cells can express vitamin D receptors and vitamin D metabolites may have a growth regulatory role.271,272
Question 5. Does Intake of Vitamin D, Above Current Reference Intakes, Lead to Toxicity?
Overview of Relevant Studies
Potential consequences of vitamin D toxicity include hypercalcemia, renal stones and soft tissue and vascular calcification. Clinical symptoms associated with hypercalcemia include nausea, vomiting, increased thirst and depression. Serum concentrations of 25(OH)D above 220 nmol/L have been associated with hypercalcemia.273 Hypercalciuria can be associated with vitamin D toxicity and may contribute to the development of nephrolithiasis, although other factors such as low urinary citrate and hyperoxaluria also predispose to renal stones.234
Randomized trials that reported safety outcomes by intervention group were included in this section of the report.
Study characteristics. A total of 22 randomized controlled trials (RCTs) (in 23 published reports) reported if vitamin D supplementation resulted in toxicity.77,105,112
114,117,118,178,180,181,184,191,197,202,207,209,212,233,234,236,243,248 Twenty-one were parallel design RCTs,77,105,112-114,117,118,178,180,181,184,191,197,202,207,209,212,233,234,236,243 and one RCT used a factorial design.248 Two publications reported the results of more than one study in each record.233,236 The Vieth publication (2004) included two trials and we refer to each as Study A and Study B respectively.233 Zeghoud et al. included two studies, only one of which was an RCT.236 Study characteristics are summarized in Table 18.
Population characteristics. Within the 22 included RCTs, there were a total of 47,802 subjects. Only two trials243,248 had large sample sizes, with the majority of remaining studies having sample sizes of less than 100 participants. There were a total of 25,562 participants within the intervention group and 22,240 participants within a comparator, control, or placebo group. Seven of the 22 trials included both males and females,77,112,184,209,233,234,248 thirteen included only females,105,114,117,118,178,180,181,191,197,202,207,212,243 one included only males,113 and one trial with infants did not specify the gender.236
Two trials included infants, healthy term neonates enrolled at birth in one study77 and infants 3 to 36 months of age (mean age 10.6 months, SD 6.1) who were diagnosed with vitamin D deficient rickets in the other.236 One trial included healthy (pre- and post-menarchal) female children aged 10 to 17 years.105 Two studies included predominantly middle-aged populations (mean age 41.6 and 38.8 years (range 18-56 years) in one study and mean age 53 and 55 years (range not reported) in the other study).233,234 Seventeen studies included older adults.112-114,117,118,178,180,181,184,191,197,202,207,209,212,243,248 The precise definition of an older population varied in the studies (e.g., postmenopausal women; individuals 65 years or older including mean ages ranging from 7th to the 9th decade). The adult populations were described as participants from long-term geriatric care facilities, nursing homes or homes for the aged in five studies112,114,181,207,209 or community-dwelling participants in ten studies.113,117,178,180,184,197,202,233,234,248
Ascertainment of toxicity. Ascertainment of toxicity was reported in most trials. The most commonly reported laboratory measure of calcium homeostasis was serum calcium (either total or ionized).112-114,117,178,181,181,184,191,197,202,202,207,209,209,212,236,248,274 In most trials, hypercalcemia was defined as a total serum calcium level above 2.7-2.8 mmol/L. Thresholds used to define hypercalciuria varied across studies. For example, hypercalciuria was defined as a mean urinary calcium-creatinine ratio <1.0 when calcium and creatinine are measured in mmol (or ≤ 0.37 when measured in mg) in a randomly collected sample or as a 24-hour urinary calcium excretion value with variable thresholds of 6.25-10 mmol/day.180,191,234 Criteria used to ascertain the outcome of renal stones were not clearly reported in all trials.
Interventions. Nineteen trials used oral vitamin D3,77,105,113,114,117,118,178,180,181,184,191,202,207,209,233,234,236,243,248 and three trials used vitamin D2.112,197,212
Seven trials had intervention arms of one or more doses of oral vitamin D.77,105,112,209,233,234,236 Fifteen had one or more arms of vitamin D with calcium.113,114,117,118,178,180,181,184,191,197,202,207,212,243,248
Comparators. Twelve trials compared vitamin D with placebo105,112,117,180,181,184,191,243,248 or control.197,202,207 Five studies had a comparator arm of calcium.113,114,178,212,248 Six trials used another dose of vitamin D as the comparator.77,118,209,233,234,236
Study quality. Twelve studies received a rating of ≥ 3 on the Jadad scale.105,112-114,117,178,180,184,191,197,243,248 Eleven studies were described as double-blind,105,112-114,117,178,180,184,191,234,248 and of those, nine adequately conducted the blinding.105,112-114,117,178,180,191,248 In the majority of trials (N = 19), allocation concealment was unclear77,105,112,114,118,178,180,181,184,191,197,202,207,209,212,233,234,236,243 whereas three studies provided an adequate description.113,117,248
Study withdrawals were adequately reported in 12 of the 22 studies.112,113,117,118,181,184,191,197,207,236,243,248 Of these trials, eight reported losses to followup of over 20 percent.112,180,181,184,191,207,209,233
Qualitative Synthesis
Infants. Two trials reported toxicity outcomes in infant populations.77,236 In one study, 56 infants with vitamin D deficient rickets (mean age 10.7 months) were randomized to receive a single oral dose of 150,000, 300,000 or 600,000 IU of vitamin D77 The other study included 30 healthy neonates with low baseline serum 25(OH)D (< 25 nmol/L) who were randomized at birth to receive either a single oral dose of 200,000 IU vitamin D3 or 100,000 IU at birth, three and six months of age.236 The latter study also reported on an earlier cohort of 30 non-randomized infants who were treated with 600,000 IU.
In the two trials, no serum calcium values were reported within the hypercalcemia range for the 100,000 and 150,000 IU doses. The Cesur trial reported eight cases of hypercalcemia (two in the 300,000 and six in the 600,000 treatment arms). Zeghoud et al. did not report any episodes of hypercalcemia during the RCT. However, an oral dose of 600,000 IU vitamin D3 resulted in a significant increase in serum calcium concentrations 2 weeks later (p>0.005), with no change in serum calcium in infants receiving a lower vitamin D dose (200,000 IU). Mean serum calcium concentrations in the 100,000 and 200,000 IU dose were significantly lower than serum calcium after an oral dose of 600,000 IU of vitamin D3. No withdrawals were reported in the trials of infant populations.77,236
Children. One trial examined the safety of vitamin D3 in healthy female children who received either weekly 1,400 IU (200 IU per day) or 14,000 IU (2,000 IU/day) of vitamin D3, or placebo.105 The authors reported that two subjects in the placebo group had serum calcium levels above the upper limit of normal at one year versus no subjects in the intervention groups. Three subjects (1.5 percent) in the 2,000 IU/day group had serum 25(OH)D levels over 250 nmol/L (256.4, 400.8, and 485.5 nmol/L), but none had concomitant hypercalcemia. There were 11 withdrawals out of 168 participants (16 percent). However, withdrawal rates did not differ by treatment arm. One girl in the low dose vitamin D arm dropped out due to glomuerulonephritis which was thought to be secondary to a post-streptococcal infection.
Adults. Two small trials by Vieth examined the safety of vitamin D3 in women of reproductive age or middle aged men.233,234 The populations included either healthy men and women234 or endocrine outpatients.233 Neither trial had a placebo or control group.233 In one trial, subjects were randomized to either 600 IU or 4,000 IU of vitamin D3 daily.233 The second trial by Vieth et al. compared 1,000 IU to 4,000 IU of vitamin D3 daily.234 The authors did not report if subjects with a history of renal stones were excluded.
Seventeen efficacy trials examined the safety of vitamin D in older adults.112-114,117,118,178,180,181,184,191,197,202,207,209,212,243,248 Fourteen trials used vitamin D3 as the intervention,113,114,117,118,178,180,181,184,191,202,207,209,243,248 and three trials used vitamin D2.112,197,212 Vitamin D doses ranged from 400 to 10,000 IU daily.212 Six trials included a treatment arm of either vitamin D2 or D3 alone,112,113,197,202,209,248 and thirteen had a treatment arm with vitamin D combined with calcium.114,117,118,178,180,181,184,191,197,207,212,243,248
Six trials used an immunoassay method to measure 25(OH)D,114,117,197,209,212,243 ten used CPBA,112,113,118,178,180,181,184,191,202,207 and one trial used HPLC.248
Exclusion criteria that were reported in the published trials are summarized in Table 17. Five trials excluded subjects with a history of hypercalcemia,114,180,191,209,243 seven trials excluded subjects with renal insufficiency,112,114,118,180,184,191,209 seven excluded subjects with primary hyperparathyroidism or other disorders of bone metabolism,113,114,117,118,178,184,191 and three trials excluded subjects who had a history of kidney stones.184,209,243 Most trials excluded subjects who had taken medications known to affect bone metabolism.
Hypercalcemia. Thirteen trials reported hypercalcemia as an outcome.112-114,178,180,181,191,197,207,209,233,234,248 In three trials, cases of hypercalcemia were reported in the vitamin D arm that were thought to be due to unmasking of underlying primary hyperparathyroidism.180,181,207 Six trials reported that there were no cases of hypercalcemia in either arm of the study.113,114,178,197,233,234
Twelve trials that compared vitamin D alone or vitamin D plus calcium to placebo or calcium reported on the outcome of hypercalcemia.112-114,117,178,180,181,191,197,207,209,248 Supplemental calcium carbonate or citrate doses ranged from 500 mg118,184,212 to 1,200 - 1,500 mg per day.117 Combining the results from the twelve trials that had either calcium or placebo as a comparator resulted in a Peto odds ratio of 1.58 (95% CI 0.9, 2.77), p = 0.11 and I2 = 0.5 percent. There were a total of 50/10,535 cases of hypercalcemia with 31/5410 (0.6 percent) in the vitamin D (+/− calcium) and 19/5125 (0.4 percent) in the placebo or calcium arm. Excluding cases that were due to underlying primary hyperparathyroidism, resulted in a Peto Odds Ratio of 1.4 (0.76, 2.5). Most cases of hypercalcemia were reported to be asymptomatic.
Hypercalciuria. Ten trials provided data on hypercalciuria within the adult populations.113,117,118,178,180,184,191,209,212,234 Vitamin D doses ranged from 700 IU vitamin D3/day118 to 10,000 IU vitamin D2/day.212 Seven trials had calcium carbonate 500-1,000 mg as a cointervention113,117,178,180,184,191,212 In six trials113,117,118,180,184,212 (N = 1190) that had calcium or placebo as a comparator , there were total of eighteen cases of hypercalciuria reported, 13 in the vitamin D arms and 5 in placebo/control (Peto OR of 1.78 (95% CI 0.68, 4.7), p = 0.24 and I2 = 0). In one trial, all four cases of hypercalciuria were reversed by lowering the calcium supplementation from 500 mg to 250 mg/day.118 In another trial in elderly women receiving 800 mg of vitamin D3 plus 1,000 mg of calcium, 20 percent had higher 24-hour urine calcium to creatinine ratios in the intervention group.191
Vieth compared 4,000 IU vitamin D3 to 1,000 IU daily, and reported more urinary calcium/creatinine ratios (> 1.0) in the 4,000 IU of vitamin D3 arm versus the 1,000 IU/day arm, although the relative number of cases of hypercalciuria during the 5 month followup was not significantly different between groups.234 Brazier compared 800 IU vitamin D3 plus 1,000 mg of calcium to placebo, and reported that significantly more participants in the vitamin D plus
calcium group had a higher 24 hour urine Ca/Cr ratio (threshold > 6.25 mmol/24 hours) (20 percent) compared to placebo.191
Nephrolithiasis. Seven of the 19 adult trials provided data on renal stones.117,180,181,197,202,243,248 Doses of vitamin D ranged from 400 IU vitamin D3243 to 800 IU daily.181 Duration of exposure ranged from one197 to seven years.243 Five trials reported that there were no cases of kidney stones documented during the trial.117,180,181,197,202
The Women’s Health Initiative (WHI) trial on postmenopausal women aged 50 to 79 years reported that there was an increase in renal stones in subjects treated with 400 IU vitamin D3 (the daily reference intake for women aged 50 to 70 years, and less than the reference intake for women > 70 years) plus calcium 1,000 mg compared to placebo.243 The WHI trial was the largest trial (N = 36,282) and at the seven year followup, 449/16,936 (2.7 percent) subjects in the vitamin D3 plus calcium group reported kidney stones versus 381/16,815 (2.3 percent) in the placebo group (HR 1.17, 95% CI 1.02-1.34), which appeared unrelated to high baseline calcium intake. Grant et al. reported two cases of kidney stones in the 800 IU vitamin D3/day (combined with 1,000 mg calcium) treatment arm, and two cases within the placebo arm after five years followup.
Three trials provided data on the effect of vitamin D on renal function180,191,248 and there was no significant effect on renal function compared to placebo.
Total withdrawals and other adverse events. In the adult trials, only one trial did not report data on total withdrawals.178 Total withdrawals ranged from 0234 to 60 percent of the study population.207 Total adverse events were summarized in 12 of 19 adult trials,112-114,117,178,191,202,207,212,234,243,248 and ranged from 0113,114,178,234 to 222 events (N = 208 subjects).117 Fifteen of the 222 events were considered to be serious adverse events, although none were judged as being related to vitamin D.117 Adverse events rates did not appear to differ significantly when comparing vitamin D combined with calcium versus placebo. Gastrointestinal (GI) disturbances, including nausea, diarrhea and abdominal pain were reported in eight trials in adults.114,180,181,191,202,207,243,248 No significant differences in GI disturbances between the vitamin D and calcium groups were reported.
Deaths were reported as an outcome in 11 trials. Overall, mortality not increased in the vitamin D treatment arms compared with the controls.112,117,180,181,184,191,197,207,209,243,248
|
Summary. Intake of vitamin D above current reference intakes and harms. Quantity: A total of 22 trials reported data on toxicity-related outcomes, 21 of which used doses above current reference intakes. Quality: Of 22 trials, only 12 received a rating of ≥ 3 on the Jadad scale. An adequate description of allocation concealment was reported in three trials. Consistency: Toxicity results from trials with intakes of vitamin D above current reference intakes varied and this may have been related to different doses, baseline characteristics of populations or exposure times. Most trials excluded subjects with renal insufficiency or hypercalcemia, were of small sample size and had short durations of exposure to vitamin D. Event rates were low across trials in both the treatment and placebo arms. The WHI trial on women aged 50 to 79 years, examined the effect of vitamin D3 400 IU (the daily reference intake for women aged 50 to 70 years and below the 600 IU reference intake for women > 70 years) in combination with 1,000 mg calcium carbonate versus placebo and found an increase in the risk of renal stones (Hazard Ratio 1.17 95% CI 1.02-1.34), corresponding to 5.7 events per 10,000 person years of exposure. Overall, there is fair evidence that vitamin D supplementation above current reference intakes, with or without calcium supplementation, was well tolerated. A significant increase in kidney stones was observed in one large trial in postmenopausal women taking 400 IU vitamin D3 with calcium. The quality of reporting of toxicity outcomes was inadequate in a number of the trials, and most trials were not adequately powered to detect adverse events. |
Table 18. Reported Safety Outcomes by Intervention on Group (RCTs)
|
Author (year) Duration (Timepoints for Toxicity Assessment) |
% Vitamin D Deficient Population Exclusion Criteria Ethnicity (country) |
Sample Size |
Intervention Compliance |
Followup Serum 25(OH)D (nmol/L) Assay |
Safety Outcomes |
|
Infants |
|||||
|
Cesur (2003)77 |
100% Vit D deficient rickets |
IG1: 20 IG2: 20 IG3: 16 |
IG1: 150,000 IU vit D IG2: 300,000 IU vit D IG3: 600,000 IU vit D (single dose) |
NR |
hypercalcemia: IG1: 0/20 (0%) IG2: 2/20 (10%) IG3: 6/16 (37.5%) |
|
2 mo |
Infants, mean age 10.7 mo |
|
|||
|
(d 3, 10 and 30) |
Patients with chronic liver/renal disease, malabsorption, or prolonged anticonvulsant use were excluded |
|
|
|
|
|
|
|
|
RIA |
hypercalciuria: IG2: d10 mean urinary Ca/Cr ratio increased; IG3: d 30 mean urinary Ca/Cr ratio increased (ratio > 0.37, measured in mg/dL) |
|
|
|
|
compliance 100% |
|
||
|
|
NR (Turkey) |
|
|
|
|
|
Zeghoud (1994)236 |
100% Serum 25(OH)D < 25 nmol/L |
IG1: 15 IG2: 15 |
IG1: 100,000 IU vit D3 0, 3 and 6 mo) IG2: 200,000 IU vit D3 single dose) |
mean (SD) IG1: NR for 2 wks after dose; 67.5 (30) 3 mo post 3rd dose IG2: 150 (55) 2 wks after dose NR for 3 mo after dose |
hypercalcemia: IG12: 0 IG23: 0 (no 25(OH)D levels were > 120 nmol/L in either group) |
|
|
Healthy term neonates enrolled at birth |
IG3: 30 (earlier cohort; not randomized) |
|||
|
9 mo |
|
||||
|
|
|
IG3: 600,000 IU vit D3 single dose) (earlier cohort) |
|
||
|
(IG1: 2wks and 6 mo; IG2: 2 wks after 1st dose and 3 mo after ea dose) |
NR |
|
hypercalciuria: NR |
||
|
|
|
|
|
IG3 (earlier cohort)1: hypercalcemia: 0; 50% had 25(OH)D levels > 120 nmol/L at 6 mo) |
|
|
NR (Algeria) |
|
compliance 100% |
IG3 (earlier cohort): 307 (160) 2 wks after dose |
||
|
|
|
|
|
CPBA |
|
|
Author (year) Duration (Timepoints for Toxicity Assessment) |
% Vitamin D Deficient Population Exclusion Criteria Ethnicity (country) |
Sample Size |
Intervention Compliance |
Followup Serum 25(OH)D (nmol/L) Assay |
Safety Outcomes |
|
Children |
|||||
|
Fuleihan (2006)105 |
NR; mean serum 25(OH)D 35 nmol/L |
IG1: 58 IG2: 55 CG: 55 |
IG1: 1400 IU vit D3 wk IG2: 14,000 IU vit D3 wk CG: Placebo |
mean (SD) IG1: 43 (15) IG2: 95 (78); 3/55 had 25(OH)D levels > 250 nmol/L but none had hypercalcemia CG: 40 (20) |
hypercalcemia: IG1: 0/58 (0%) IG2: 0/55 (0%) CG: 2/55 (13.6%) |
|
1 year |
|
|
|||
|
|
Female children and adolescents; majority postmenarcheal |
|
|
||
|
|
|
|
|
Hypercalciuria: NR |
|
|
(6 and 12 mo) |
|
|
|
|
WDAE: 1 poststreptococcal glomerulonephritis (IG1) |
|
|
Excluded subjects with disorders or medications known to affect bone metabolism |
|
compliance (volume returned): quantitation NR; described as "excellent" |
|
|
|
|
NR (Lebanon) |
|
|
CPBA |
|
|
Women Predominantly of Reproductive Age +/−Middle-aged Men |
|||||
|
Vieth (2001)234 |
4-6% 25(OH)D <25 nmol/L: 12-16% 25(OH)D <40 nmol/L: |
IG1: 33 IG2: 28 |
IG1: 1000 IU vit D3 /d IG2: 4000 IU vit D3 /d |
mean (SD): 3 mo: IG1: 68.7 (16.9) IG2: 96.4 (14.6) |
hypercalcemia: IG1: 0 IG2: 0 |
|
2-5 mo |
|
|
|
||
|
|
Generally healthy subjects (hospital workers) mean age IG1: 41.6 (range 18-53) IG2: 39.9 (range 23-56) |
at 5 mo: included IG1 15/33 and IG2 15/28 |
|
|
|
|
|
|
|
Hypercalciuria: mean urinary Ca/Cr ratio >1.0: from graph, 4 values > 1.0 over 5 mo in IG1 and 6 values (2 reported in same subject) in IG2 |
||
|
(0.5, 1, 2, 3, 4, and 5 mo) |
|
from 3 mo on: IG1: range 40-100 IG2: range 69-125 |
|||
|
|
|
|
compliance NR |
||
|
|
Caucasian 66.6-71%; Black 6.1-10.7%; Asian 17.9-27.3% (Canada) |
|
|
|
|
|
|
|
|
RIA |
|
|
|
Author (year) Duration (Timepoints for Toxicity Assessment) |
% Vitamin D Deficient Population Exclusion Criteria Ethnicity (country) |
Sample Size |
Intervention Compliance |
Followup Serum 25(OH)D (nmol/L) Assay |
Safety Outcomes |
|
Vieth (2004)233 |
Study A: serum 25(OH)D <61 nmol/L in spring or summer Study B:< 51 nmol/L |
A : 64; 37 completers B: 66 new patients and 46 continuers; 51 and 31 completers respectively |
IG1: 4200 IU vit D3 wk IG2: 28,000 IU vit D3/wk |
mean (SD): Study A: IG1: 79 (30) IG2: 112 (40) Study B: NR |
hypercalcemia: no mean increase in ionized calcium in either arm |
|
2 studies: A 3 mo B: continuers from A plus new patients 3 mo |
|||||
|
Thyroid clinic outpatients |
|
hypercalciuria: NR |
|||
|
NR |
|
|
|
||
|
|
compliance NR |
RIA |
|
||
|
|
Ethnicity NR (Canada) |
|
|
|
|
|
(2-6 mo) |
|
|
|
|
|
|
Predominantly Postmenopausal Women and/or Elderly Men |
|||||
|
Aloia (2005)117 |
NR; mean baseline 25(OH)D: 47 nmol/L (range 12.5 to 99.7) |
IG1: 104 CG: 104 |
IG1: 800 IU vit D3/d for 2 y, then 2000 IU vit D3 /d for 1 y + 1,200-1,500 mg Ca/ |
mean (95% CI) IG1: 70.8 (66.4-76.1) 3 mo after 800 IU/d; 86.9 (80.1-94.1) 3 mo after 2,000 IU/d CG: 46.9 (43.9-50.9) |
serum Ca: IG1: 2.38 mmol/L CG: 2.35 mmol/L hypercalcemia: IG1: 6/104 (5.8%); described as "mild" and within reference range upon repeated sampling CG: 3/104 (2.9%) |
|
3 years |
|
|
|||
|
|
Ambulatory postmenopausal African American women 50-70 y of age |
completers: 74 in each group |
|||
|
|
|
CG: Placebo + 1200-1,500 mg Ca/d |
|||
|
(3,6,12,18,24,27 ,30 and 36 mo) |
|
|
|
|
|
|
Excluded if: hormone therapy; prior treatment with bone active agents or illness known to affect bone metabolism |
|
|
|
||
|
|
|
|
RIA |
|
|
|
|
|
vit D compliance: 87% (SD 8%) (pill count) |
|
hypercalciuria (24 h urinary Ca excretion > 5 mg/kg/d): IG1: 3/104 (2.9%) (isolated episodes) CG: 1/104 (1%) (isolated episode) |
|
|
|
100% African American (U.S.) |
|
|
|
|
|
|
|
|
|
|
kidney stones: IG1: 0 CG: 0 |
|
|
|
|
|
|
mortality: IG1 1/104 (1.0%); CG: 2104 (1.9%) |
|
Author (year) Duration (Timepoints for Toxicity Assessment) |
% Vitamin D Deficient Population Exclusion Criteria Ethnicity (country) |
Sample Size |
Intervention Compliance |
Followup Serum 25(OH)D (nmol/L) Assay |
Safety Outcomes |
|
Bischoff (2003)114 |
50% Baseline serum 25(OH)D < 30 nmol/L 90% < 77.5 nmol/L |
IG1: 62 CG: 60 |
IG1: 800 IU vit D3 + 1,200 mg Ca/d CG: 1,200 mg Ca/d |
median (IQR) IG1: 65.5 (49.8-82.8) CG: 28.5 (24.5-41.5) |
hypercalcemia: IG1: 0 CG: 0 |
|
12 wks |
|
|
|
|
|
|
|
Residents of long-stay geriatric facility both genders; mean age (SD): IG1: 84.9 (7.7); CG: 85.4 (6.9) |
89 completers |
|
|
hypercalciuria: urinary Ca excretion ND |
|
|
|
|
RIA |
|
|
|
|
|
|
|
|
GI: IG1: 2 (constipation) CG: 0 |
|
(3 mo) |
Excluded if: hyperparathyroidism, hypocalcemia, hypercalcemia, or renal insufficiency; prior HRT or bisphosphonates in last 2 y |
|
|
|
|
|
|
|
compliance NR |
|
||
|
|
NR (Switzerland) |
|
|
|
|
|
Brazier (2002)178 |
100% Baseline serum 25(OH)D < 30 nmol/L |
IG1: 23 CG: 25 |
IG1: 800 IU vit D3 + 1,000 mg Ca + alendronate 10 mg CG: 1,000 mg Ca + alendronate 10 mg |
median (IQR) IG1: 65 (52.5-72.5) p<0.001) CG: 35 (22.5-47.5) p<0.01) |
hypercalcemia: IG1: 0 CG: 0 |
|
3 mo |
Osteopenic or osteoporotic postmenopausal community dwelling women; mean age (SD): 70 (6) y |
withdrawals by 3 mo: IG1: 3 and CG: 4 46 had at least one evaluation post baseline |
|
||
|
|
hypercalciuria: IG1: 0; urine Ca/Cr ratio increased significantly from baseline CG: 0 |
||||
|
|
|
CPBA |
|||
|
(0.5, 1 and 3 mo) |
|
|
|
||
|
Excluded if: concomitant disease; drugs that alter bone metabolism |
compliance NR |
|
|
||
|
|
|
|
|
urine Ca/Cr ratio (mmol/mmol) by d 30 increased significantly from baseline in IG1 IG1: 0.676 (0.372, 0.963) CG: 0.434 (0.233, 0.623) |
|
|
|
NR (France) |
|
|
|
|
|
|
|
|
|
|
24h urinary Ca (mmol/24h) IG1: 5.11 (3.30, 6.99) CG: 3.25 (2.00, 4.64) |
|
Author (year) Duration (Timepoints for Toxicity Assessment) |
% Vitamin D Deficient Population Exclusion Criteria Ethnicity (country) |
Sample Size |
Intervention Compliance |
Followup Serum 25(OH)D (nmol/L) Assay |
Safety Outcomes |
|
Brazier (2005)191 |
100% with baseline serum 25(OH)D < 30 nmol/L |
IG1: 95 CG: 96 |
IG1: 800 IU vit D3 + 1,000 mg Ca/d CG: Placebo |
median (IQR -Q1, Q3): IG1: 71.8 (58.1, 89.4) CG : 26.8 (20, 35) |
Hypercalcemia: IG1: 7 (7.4%) (2 withdrawn from study) vs. CG: 11 (11.5%) (0 withdrawn) |
|
1 year |
Ambulatory community dwelling women > 65 years of age who have vitamin D insufficiency; mean age 70 (6) y |
|
|
|
|
|
|
|
|
|
Hypercalciuria (24 h Ca/Cr ratio >6.25 mmol/L): IG1: ~20% CG: NR 24 h urinary Ca/Cr ratio significantly higher in IG1 IG1: 3.97 vs. CG: 2.35, p < 0.001 |
|
|
|
total withdrawals: IG1: 22.2% CG: 30.2% |
|
|
||
|
|
compliance 92.0-92.5% (pill count) |
|
|||
|
(3, 6, 9 and 12 mo) |
|
|
|
||
|
Excluded if: hypercalcemia, primary hyperparathyroidism, renal or hepatic insufficiency; medications affecting bone metabolism in last 6 mo |
|
CPBA |
|||
|
|
|
|
|
CrCl: no significant difference |
|
|
|
NR (France) |
|
|
|
Proportion of subjects with serum uric acid above normal threshold significantly increased in IG1 (53% vs. 37.2%, p = 0.046) but no difference in uric acid clearance |
|
|
|
|
|
|
Individuals with ≥ 1 AE: IG1: 72.6% vs. CG: 72.9%, NS |
|
|
|
|
|
|
WDAE: IG1: 15.8% vs. CG: 17.7%, NS SAE: IG1 14 (14.7%) vs. CG: 11 (11.5%), NS |
|
|
|
|
|
|
Osteomuscular: IG1 32 (33.7%) vs. CG 24 |
|
|
|
|
|
|
GI: IG1: 22 (23.2%) vs. CG: 21 (21.9%), NS |
|
|
|
|
|
|
Mortality: IG1: 3 (3.2%) CG; 1 (1.0%) |
|
Author (year) Duration (Timepoints for Toxicity Assessment) |
% Vitamin D Deficient Population Exclusion Criteria Ethnicity (country) |
Sample Size |
Intervention Compliance |
Followup Serum 25(OH)D (nmol/L) Assay |
Safety Outcomes |
|
Chapuy (1992)181 |
NR healthy ambulatory female residents of senior facilities mean age (SD): 84(6) y |
IG1: 1,634 CG: 1,636 |
IG1: 800 IU vit D3 + 1,200 mg Ca/d CG: Placebo |
mean (SD): IG1: 105 (22) CG: 27.5 (17.5) |
Hypercalcemia: IG1: 1 (0.06%) (due to primary hyperparathyroidism); CG: 0 |
|
1.5 years |
Subset for lab tests: 142 IG1: 73; CG: 69 |
|
|
Hypercalciuria: NR |
|
|
|
excluded if taking drugs that alter bone metabolism, vitamin D (within 6 months) |
|
|
GI (nausea, diarrhea, epigastric pain): IG1:40; CG 28 (all WDAE), NS |
|
|
(every 6 mo) |
|
CPBA |
|||
|
|
|
Of total sample, 54% completers |
|
|
Renal stones: IG1: 0; CG: 0 |
|
|
NR (France) |
|
|
|
|
|
|
|
|
|
Mortality: IG1: 258/1634 (15.8%) CG: 274/1636 (16.5%) |
|
Author (year) Duration (Timepoints for Toxicity Assessment) |
% Vitamin D Deficient Population Exclusion Criteria Ethnicity (country) |
Sample Size |
Intervention Compliance |
Followup Serum 25(OH)D (nmol/L) Assay |
Safety Outcomes |
|
Chapuy (2002)180 2 years |
76.8% Serum 25(OH)D < 30 nmol/L Ambulatory female residents of apartments for the elderly with low vitamin D and Ca intakes |
IG1: 199 IG2: 194 CG: 190 |
IG1: 800 IU vit D3 + 1,200 mg Ca /d fixed combination IG2: 800 IU vit D3 + 1,200mg Ca (separate) /d CG: Placebo |
mean: IG1 75 IG2: 80 CG 15 |
Hypercalcemia (12 mo): IG1 + IG2: 3 (1 related to myeloma, hyperparathyroidism) |
|
|
|
|
Hypercalciuria (12 mo) defined as urinary Ca > 350 mg/24 h: IG1+IG2: 5 (3%) CG: 2 (1.3), NS |
||
|
(every 3 mo) |
|
583/608 assessed at least once |
|
||
|
|
Excluded subjects with malabsorption, hypercalcemia, chronic renal failure; or taking drugs that alter bone metabolism, or vitamin D (> 100 IU/d) in last year |
|
|||
|
|
|
CPBA |
|||
|
|
69.2% completed 2 y |
Compliance (sachets, tablet count): > 95% |
|
Serum Cr: no change in either group |
|
|
|
|
|
24h Ca/Cr ratio: significant increase in IG1 at 12 and 24 mo: 24 mo IG1+IG2: 167.86 (123.10) CG: 113.15 (97.28), p<0.003 |
||
|
|
NR (France) |
|
|
|
|
|
|
|
|
|
|
Renal stones: IG1 + IG2: 0 CG: 0 |
|
|
|
|
|
|
Mortality: IG1+ IG2: 18% CG: 23.9%, NS |
|
|
|
|
|
|
GI: IG1 + IG2: 24 (3 WDAE) CG: 16, NS |
|
Author (year) Duration (Timepoints for Toxicity Assessment) |
% Vitamin D Deficient Population Exclusion Criteria Ethnicity (country) |
Sample Size |
Intervention Compliance |
Followup Serum 25(OH) (nmol/L) Assay |
Safety Outcomes |
|
Corless (1985)112 up to 40 wks |
NR; mean baseline serum 25(OH)D (sem): IG1: 17.63 2.05); CG: 16.60 (2.10); all subjects had baseline level < 40 nmo/L |
IG1: 41 CG: 41 |
IG1: 9,000 IU vit D2/d CG: Placebo |
IG1: mean ranged from ~90 to ~160 (30 wks) over course of study; CG: ~30 (estimated from graph) |
Hypercalcemia: IG1: 1/41 (2.4%) (hyperparathyroidism) CG: 0 |
|
|
Completed: IG1: 32 CG: 33 |
|
|
||
|
|
Compliance NR |
Mortality: IG1: 1 (2.4%) CG: 4 (9.8%) |
|||
|
(every 6 wks) |
Elderly patients in long-stay geriatric hospital wards plus 18 day patients mean age (sem): IG1: 82.3(6.0); CG: 82.6 (6.9) |
|
|
|
|
|
|
|
|
CPBA |
|
|
|
|
Excluded if renal insufficiency; clinical osteomalacia; hypokalemia; plasma 25(OH)D 40 nmol/L. NR (U.K.) |
|
|
|
|
|
Dawson-Hughes (1995)118 |
NR |
IG1: 124 IG2: 123 |
IG1: 100 IU vit D3 500 mg Ca IG2: 700 IU vit D3 + 500 mg Ca |
IG1: 100.1 (24.5) IG2: 66.3 (25.5) |
Hypercalcemia: IG1: 0 IG2: 0 |
|
Healthy ambulatory postmenopausal women with mean dietary intake of vit D 100 IU and Ca intake < 1000 mg; mean age (SD) IG1: 64.0 (5.3) IG2 63.0 (5.1) y |
|
|
|
||
|
|
Withdrawals: 5% (IG1: 8; IG2: 5) |
|
|
||
|
2 years |
|
|
CPBA |
Hypercalciuria: IG1: 2/124 (1.6%) (reversed by lowering calcium from 500 to 250 mg/d) IG2: 2/123 (1.6%) (reversed by lowering calcium from 500 to 250 mg/d) |
|
|
(9, 12, 24 mo) |
|
|
|
||
|
|
|
Compliance 98% pill count) |
|
||
|
|
Excluded if: malignancy, renal, hepatic, other disorders of bone metabolism; corticosteroids, estrogen, anticonvulsants; current use of vitamin D or calcium |
|
|
|
|
|
|
100% White (U.S.) |
|
|
|
|
|
Author (year) Duration (Timepoints for Toxicity Assessment) |
% Vitamin D Deficient Population Exclusion Criteria Ethnicity (country) |
Sample Size |
Intervention Compliance |
Followup Serum 25(OH)D (nmol/L) Assay |
Safety Outcomes |
|
Dawson-Hughes (1997)184 |
NR |
IG1: 187 CG: 202 initial enrolled 445, 389 baseline characteristics |
IG1: 700 IU vit D3 + 500 mg Ca (citrate malate) CG: placebo |
Absolute increase in mean 25(OH)D IG1: men +29.5 (29) (calc. mean 112) women +40.3 (35.8) (calc. mean 112) |
Hypercalcemia: IG1: 0; CG: 0 Serum ionized Ca mean change (SD): IG1: men +0.1 (0.2); women 0.1 (0.1). CG: men 0.0 (0.1) women 0.0 (0.2) |
|
|
Healthy ambulatory community dwelling women and men 65 years of age or older, mean age 70-72 y |
||||
|
3 years |
|
||||
|
|
|
|
Compliance: 92-93% (pill count) |
Hypercalciuria (WDAE): IG1: 1/187 CG: 0/202 |
|
|
|
Subjects with cancer or hyperparathyroidism; kidney stones, renal or liver disease; anti-resorptive medications (prior 6 mo), fluoride (prior 2 y); Ca intake of >1500 mg/d excluded. |
Withdrawals: 127 Completers: 318 (IG1 170; CG 148) |
|||
|
(every 6 mo) |
|
|
|||
|
|
|
CPBA |
24-h urinary Ca/Cr ratio mean change (SD): men: IG1: +35 (51) vs. CG: −4 (44); women: IG1: +67 (64) vs. CG: +9 (62), p < 0.005 for comparison between treatment groups |
||
|
|
Caucasian 6%, African American 2%, Asian 1% (U.S.) |
|
|
|
|
|
|
|
|
|
Withdrawals: total number 20 11 due to difficulty swallowing pills; WDAE: IG1: 3 constipation, 1 epigastric distress, 1 sweating, 1 hypercalciuria; CG: 3 (2 epigastric distress; 1 flank pain) |
|
|
|
|
|
|
|
Mortality: 4 (NR by group) |
|
Author (year) Duration (Timepoints for Toxicity Assessment) |
% Vitamin D Deficient Population Exclusion Criteria Ethnicity (country) |
Sample Size |
Intervention Compliance |
Followup Serum 25(OH)D (nmol/L) Assay |
Safety Outcomes |
|
Grantb (2005)248 |
NR |
IG1: 1343 IG2: 1306 IG3: 1311 CG: 1332 |
IG1: 800 IU vit D3/d IG2: 800 vit D3 + 1,000 mg Ca/d IG3: 1,000 mg Ca/d CG: placebo |
Baseline, mean (SD), 38 (16.25) in n=60; Increase after 1 y (nmol/L): IG1 24.5 (21.8) IG2 24 (17.25) IG3 3.5 (14.25) CG 7.8 (18) |
Hypercalcemia: Total cases 21, no significant difference b/w groups IG1; 6 (0.4%) IG2: 7 (0.5%) |
|
|
Excluded those with daily intake >200 IU vitamin D, >500mg Ca, use of vitamin D metabolites within previous 5 years. |
||||
|
5 years |
|
||||
|
(1 y, other timepoints not specified) |
|
|
|
||
|
|
|
|
Renal stones: IG1: 2 (0.1) IG2: 0 IG3: 0 CG: 2 (0.2) |
||
|
99% Caucasian |
|
|
|||
|
|
|
|
Compliance > 80% in 78-80% at 1 y; 54.5% taking medication at 2 y |
||
|
|
|
|
25(OH)D IG2 (Vit D3+Ca) 62 nmol/L |
||
|
|
|
|
|
Total adverse events: IG1: 153 (11.4); IG2: 210 (16.1%) IG3: 218 (16.6) CG: 166 (12.5) |
|
|
|
|
|
|
HPLC |
|
|
|
|
|
|
|
GI symptoms: IG1: 62 (4.6) IG2: 115 (8.8) IG3: 118 (9.0) CG: 76 (5.7) |
|
|
|
|
|
|
Renal insufficiency (creatinine >250 μmol/L): IG2: 2 (0.2) IG3: 4 (0.3) CG: 1 (0.1) |
|
|
|
|
|
|
Mortality: IG1: 217 (15.7%) IG2: 221 (16.1%) IG3: 243 (18.5%) CG: 217 (16.4%) |
|
b Includes unpublished data received from primary author |
|||||
|
Author (year) Duration (Timepoints for Toxicity Assessment) |
% Vitamin D Deficient Population Exclusion Criteria Ethnicity (country) |
Sample Size |
Intervention Compliance |
Followup Serum 25(OH)D (nmol/L) Assay |
Safety Outcomes |
|
Harwood (2004)197 |
% with 25(OH)D ≤30 nmol/L: IG1: 31( 82%) IG2:26 (72%) IG3: 26 (67%) CG: 22 (60%) |
IG1: 38 IG2: 36 IG3: 39 CG: 37 |
IG1: 300,000 IU vit D2 (IM) IG2: 300,000 IU (IM) vit D2 + 1g/d Ca (tablet/d) IG3: 800 IU vit D2 + 1 g/d Ca (tablet/d) CG: no treatment |
baseline 25(OH)D 28 - 30 nmol/L IG1: 40 IG2: 44 IG3: 50 CG: 27 |
Serum Ca (mmol/L): IG1: 2.46 IG2: 2.45 IG3: 2.42 CG: 2.40 (p=0.02) |
|
1 year |
|||||
|
|
|
Completers 84.4% |
|
||
|
|
Excluded subjects using medication affecting bone metabolism. |
|
|
Hypercalcemia: Total group: 0 |
|
|
(3, 6 and 12 mo) |
|
|
|
||
|
|
|
|
|
RIA |
Renal stones: Total group: 0 |
|
|
NR (U.K.) |
|
|
|
|
|
|
|
|
|
|
Mortality: IG1 7/32 (22%) IG2: 11/25 (44%) (calc; reported in table as 31%) IG3: 6/31 (19%) CG: 536 (14%) |
|
Jackson (2006)243 |
NR |
IG1: 18,176 CG: 18,106 |
IG1: 400 IU vit D3 + 1000 mg Ca /d CG: placebo |
levels reported for a nested case control study of fractures only |
for entire cohort renal stones: IG1:449 CG: 381 |
|
|
Subjects with hypercalcemia, renal calculi excluded as well as subjects using corticosteroids. |
|
|||
|
7 years |
|
|
|||
|
|
|
|
hip fracture group: 46.0 (22.6) controls: 48.4 (23.5) |
GI: IG1: 10.3% moderate-severe constipation, 20.4% bloating, CG: 8.9% moderate-severe constipation, 19.5% bloating, |
|
|
|
Caucasian ~83% African American ~9% Hispanic ~4%, American Indian or Native American ~0.4%, Asian or Pacific Islander ~2%, and unknown~1.2%) |
Withdrawn or lost to followup 2.7% |
|
||
|
(annual clinic visits) |
|
||||
|
|
|
|
chemiluminescent IA |
|
|
|
|
|
|
Mortality: IG1: 744 (4.1%) CG: 807 (4.5%), NS |
|
Author (year) Duration (Timepoints for Toxicity Assessment) |
% Vitamin D Deficient Population Exclusion Criteria Ethnicity (country) |
Sample Size |
Intervention Compliance |
Followup Serum 25(OH)D (nmol/L) Assay |
Safety Outcomes |
|
Honkanen (1990)202 |
Baseline mean 25(OH)D (SE): Home: IG1 42.8 (3.5); CG 36.2 (2.7) Hospital: IG1 24.0 (1.9); CG 23.9 (2.4) |
IG1: Home 30, Hospital 33 CG: Home 30, Hospital 33 |
IG1: 1,800 IU vit D3+ 1,558 mg Ca/d CG: No treatment |
mean (95% CI) Home: IG1 80.7 (75-86) CG: 10.4 (8-13) Hospital: IG1 64.4 (57-72) CG: 23.3 (18-28) |
Hypercalcemia: maximum Ca values were 2.75, 2.75 and 2.82 in CG largest individual increase in serum Ca was 0.18 mmol/L for one subject in IG1 and 0.25 mmol/L in one subject in CG. |
|
11 weeks |
|
||||
|
(pre/post intervention) |
Old community dwelling (Home) or institutionalized women (Hospital), 62-72 year |
|
|
|
|
|
|
Completed IG1: Home 25; Hospital 30 |
|
|
Serum Ca, mean (SE): Home: IG1: 2.40 (2.3-2.5) CG: 2. 41(2.3-2.6) Hospital IG1: 2.58 (2.4-2.8) CG: 2.73 (2.5-2.9) |
|
|
|
|
|
CPBA |
||
|
|
Excluded subjects with active malignant disease, renal dysfunction |
|
|
||
|
|
NR (Finland) |
|
|
|
|
|
|
|
|
|
|
Hypercalciuria: urinary Ca ND |
|
|
|
|
|
|
Increased serum Cr observed in all groups (greater in CG); 2 CG post trial Cr > 115 micromol/L |
|
|
|
|
|
|
Renal stones: IG1: 0 CG: 0 |
|
|
|
|
|
|
GI: 9/25 Home IG1 group had "mild" GI symptoms. |
|
|
|
|
|
|
WDAE: IG1: Home 2 (‘unrelated symptoms’ not specified) |
|
Author (year) Duration (Timepoints for Toxicity Assessment) |
% Vitamin D Deficient Population Exclusion Criteria Ethnicity (country) |
Sample Size |
Intervention Compliance |
Followup Serum 25(OH)D (nmol/L) Assay |
Safety Outcomes |
|
Kenny (2003)113 |
NR |
IG1: 33 CG: 32 |
IG1: I,000 IU/d vit D3 + 500 mg Ca/d CG: Placebo + 500 mg Ca/d |
baseline mean (SD) IG1: 65 (17.5) CG: 60 (17.5) 6 mo followup: significant increase in IG1 but not CG (graph) |
Hypercalcemia: 0 hypercalciuria: 0 No AE identified |
|
11 weeks |
men ≥ age 65 years |
|
|
||
|
|
|
92% completers |
Urinary Ca (mg)/Cr (g) increased similarly in both groups. IG1: baseline 96 (65) and 6 mo 134 (89) CG: baseline 95 (80) and 6 mo 129 (101) |
||
|
(baseline, 3 and 6 mo) |
excluded those with systemic disease or unresolved endocrine disorder known to affect muscle metabolism; use of androgens, estrogens, or dehydroepiandosterone (previous 12 months), use of cholecalciferol (previous 4 wks). |
|
|||
|
|
|
|
87.3 (13.8) |
WDAE: 0 |
|
|
|
|
|
|
CPBA |
|
|
|
NR (U.S.) |
|
|
|
|
|
Krieg (1999)207 |
NR |
IG1: 124 CG: 124 |
IG1: 440 IU D3 + 1,000 mg Ca carbonate/d (Ca in 2 doses) CG: No treatment |
mean (SEM): baseline IG1: 29.8 (3) CG: 29.3 (3) 1 y IG1: 74.5 (2.3) CG: 20.8 (2.8) 2 y IG1: 66.3 (4) CG: 14.3 (2.5) |
Mean serum Ca (SEM): IG1: 2.31 (0.02) CG: 2.23 (0.01) |
|
2 years |
Elderly institutionalized women |
|
|||
|
|
|
completers: IG: 50 (40.3%) CG: 53 (42.7%) |
|
||
|
|
NR |
|
Hypercalcemia: IG1: 1 (withdrew) CG: 0 |
||
|
|
|
|
|||
|
|
NR (Switzerland) |
|
compliance NR |
|
|
|
|
|
|
|
GI: IG1: 6 subjects (5%) with upper GI side effects withdrew CG: 0 withdrew due to upper GI symptoms |
|
|
|
|
|
|
CPBA |
|
|
|
|
|
|
|
Mortality: IG1: 21/124 (16.9%) CG: 26/126 (20.6%) |
|
Author (year) Duration (Timepoints for Toxicity Assessment) |
% Vitamin D Deficient Population Exclusion Criteria Ethnicity (country) |
Sample Size |
Intervention Compliance |
Followup Serum 25(OH)D (nmol/L) Assay |
Safety Outcomes |
|
Lips (1988)209 |
79 % (serum 25(OH)D <30 nmol/L) 35% < 20 nmol/L |
IG1: 70 IG2: 72 |
IG1: 400 IU vit D3/d IG2: 800 IU vit D3/d |
increased to > 40 nmol/L in all subjects (means (SD) presented in graph only) |
Hypercalcemia: IG1: 0 IG2: 1 (associated with thiazide use) |
|
1 year |
|
||||
|
(2, 3 and every 3 mo thereafter) |
Men and women living in two different levels of institutional care; mean age (SD): 81 (9) y nursing home); 84 (6) y (senior home) |
Completers: nursing home: 50/72 (69%) seniors home: 59/70 (84%) |
|
Ca/Cr ratio: fasting urinary Ca excretion increased ~ 15% unrelated to treatment in all groups, NS serum Cr: increase of ~ 4% in all groups (significant increase from baseline) |
|
|
|
Compliance NR |
|
|
||
|
|
Excluded subjects with hypercalcemia, active urolithiasis, or chronic renal failure |
|
|
CPBA |
Mortality: IG1: 223/1291 (17.2%) CG: 251/1287 (19.5%) |
|
|
NR (The Netherlands) |
|
|
|
|
|
Mastaglia (2006)212 |
NR median 36.25 (range 27.5-48.12) |
IG1 13 IG2 13 CG 12 |
IG1: D2 5,000 IU/d + Ca 500 mg IG2: D2 10,000 IU/d + Ca 500 mg CG: Ca 500 mg |
25(OH)D median (25-75th percentile): |
Hypercalcemia: IG1: 0; IG2: 0 (increase in mean serum Ca at 2 mo but WNL) CG: 0 |
|
3 mo |
Post menopausal osteopenic/osteoporotic women aged 50 - 70 y presenting for bone mass evaluation |
|
|
||
|
|
|
IG1 77.5 (66.2-156.2) IG2 97.7 (79.3-123.1) CG: 55.0 (72.5-68.0) |
|||
|
(0, 1, 2 and 3 mo) |
|
|
|
||
|
|
|
|
|
Hypercalciuria: IG1: 1 (urinary Ca excretion increased from 99.0 (69.5-147.5) to 152 (102-204) mg/24 h, p<0.05, at 3 mo); IG2: 1 (urinary calcium excretion increased from 121 (88.7-140) mg/24h to 149 (120.7-225.7) mg/24h, p<0.05, at 3 mo); CG: 1 (urinary Ca excretion not increased) |
|
|
|
|
|
Compliance (pill and drop counts): 89 (11)-92 (10)% |
||
|
|
Excluded subjects treated with vitamin D or drugs known to affect bone or vitamin D metabolism |
|
|||
|
|
|
|
RIA (Diasorin) |
||
|
|
NR (Argentina) |
|
|
|
|
|
|
|
|
|
|
no urinary Ca/Cr ratio >0.37mg/dL |
|
oral route of administration unless otherwise specified; 2 measured at 2 wks and 6 mo post dose; 3 measured at 2 wks post 1st and 2nd dose, and 3 mo after each of the three doses Ca, calcium; CG, control group; CPBA, competitive protein binding assay; Cr, creatinine; d, day; D, vitamin D, isoform not specified in publication; dL, deciliter; GI, gastrointestinal; HRT, hormonal replacement therapy; IG, intervention group; IQR, interquartile range; IU, international units: mo, month(s); mg, milligram; mo, month(S); ND, not done: NR, not reported; RIA, radioimmunoassay; WNL, within normal limits; |
|||||


