
4
Health Disparities in Great Britain and Massachusetts: Policy Solutions
Roundtable cochair Mildred Thompson introduced the session on policy solutions for health disparities in England and Massachusetts by noting that it is important that the investigation of policy solutions not be limited to reducing disparities by ignoring models that are working internationally. She emphasized that this provides the opportunity to hear about the lessons learned in different types of systems. This chapter shares information about disparities reduction efforts in England (Annette Williamson) and the state of Massachusetts (Joel Weissman). Tom Granatir provided some introductory material about the health care system in England. The United Kingdom of Great Britain and Northern Ireland (the United Kingdom) is made up of four separate countries (Wales, Scotland, England, and Ireland), and each country has its own National Health Service (NHS).
THE HEALTH CARE SYSTEM IN ENGLAND
The NHS in England is the fourth largest employer in the world, after the Chinese army, the Indian railroads, and Wal-Mart. Geographically, the entire United Kingdom (all four countries) is about the size of Oregon, with a population of just under 61 million people. The population of England alone is slightly above 50 million people. The population is also quite diverse; the NHS website is translated into 12 different languages, and 5 of them are languages from the Indian subcontinent.
The NHS was founded to meet the needs of the British people as England was coming out of World War II. Lord Beveridge, an economist who was one of the primary forces behind the creation of the NHS in 1948,
BOX 4-1
Beveridge—The Five Giants
- Want - or the need for an adequate income for all
- Disease - or the need for access to health care
- Ignorance - or the need for access to educational opportunity
- Squalor - or the need for adequate housing
- Idleness - or the need for gainful employment
described these needs as being not only health but also “want, ignorance, squalor, disease, and idleness” (Box 4-1) (Beveridge, 1942). The belief was that all of these needs had to be addressed to make any progress on any one of these needs. All hospitals and health care providers (except physicians, who remained independent) were nationalized to standardize the system.
The NHS is funded through general taxation, and care is provided free at the point of care. Every citizen is expected to register with a general practitioner. Although some treatment options are not covered because of coverage decisions by NHS’s standard-setting body, primary care is free.
Until 1997, the NHS was essentially a monopoly of care provision. Long waiting lists for services came as a result of very low funding levels for the NHS. In 1997, the Labor Party moved to modernize the system and reduce the waiting times. The new system was more patient centered and gave people more choices, but also reduced waiting times. This was what NHS termed “joined-up care,” which also included efforts to integrate services for people living with chronic health conditions.
The new system also moved control and responsibility for health outcomes from the national level to the local level. The NHS is organized into 10 different regions called “strategic health authorities.” These authorities, in turn, provide oversight to 152 primary care trusts. Each trust is responsible for health assessments and for organizing all of the health care services needed for the population in its catchment area. Each primary care trust, then, represents a local health economy of between 400,000 and 500,000 residents. Primary care trusts are thus similar to geography-based health plans in the United States. Unlike U.S. health plans, however, the trusts engage in population-based health planning (see Figure 4-1 for the NHS model).
Despite the reorganization, the system still has large health inequalities. In light of these inequalities, one of the top five reform goals of the reorganized NHS is the reduction of health inequalities, and the government is working to establish specific targets to reduce these inequalities. This is a
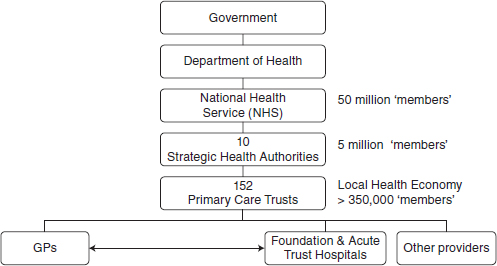
FIGURE 4-1 Organization of the NHS.
critical difference from the U.S. health system, as the United States has no way to link national goal-setting efforts with mandated actions. The NHS, in contrast, has the ability to set explicit goals and then implement efforts to meet those goals.
The target-setting process, however, has been a source of debate in England. One of the ongoing arguments is whether targets should be set nationally or devolved to the local level. This reveals another cultural difference of the system in England from the U.S. system: in the United States, much of government is already devolved to the state level.
Unlike the United States, England has a wide understanding and acceptance of the principle that health inequalities are based on social determinants. Focusing on social determinants requires working across institutional boundaries. This idea, too, is widely accepted in England.
Another component of the English health care system are the National Support Teams (NSTs), created in 2006. NSTs provide technical support to the local primary care trusts. They have targeted the key drivers of health inequalities in infant mortality, for example, and have created interventions that are potential solutions.
One example of a health inequality that can be addressed by interventions is smoking rates. Some areas in England have smoking rates above 70 percent. Use of a mix of primary and secondary prevention in those areas can affect life expectancy gaps and treat chronic diseases, such as cardiovascular disease. This is especially true if interventions target people at fairly young ages.
BOX 4-2
Spearhead Areas
- Local Authorities in bottom fifth for 3 or more of the following:
—Male life expectancy at birth
—Female life expectancy at birth
—Cancer mortality rate
—Cardiovascular disease mortality rate
—Index of Multiple Deprivation 2004 (Local Authority Summary), average score
- The Spearhead Group comprises 70 Local Authority areas mapping to 62 Primary Care Trusts
Those geographic areas with “high deprivation” (an area that has significantly worse health outcomes and/or high rates of poverty and social deprivation, such as the areas with high smoking rates described above) are called “spearheads.” Seventy local areas of high deprivation that cross 62 of the primary care trusts are spearheads (Box 4-2). These spearheads are given more resources to address health inequalities because the people in those areas have greater needs.
In short, England has the ability to set explicit health goals for its populace. The national government then gives decision-making power and technical assistance to local health authorities to meet those goals. This model is very different from that in the United States.
Granatir also discussed the use of electronic health records in the United States and England. For example, he said, although the degree of adoption of electronic records in United States is high, little interoperability or integration exists across sites. Therefore, the United States has little ability to capture and track patients across systems. England, he said, is better at blending social and commercial data (such as purchasing patterns that are tracked by Mosaic) with health data to build more specific, relevant health interventions.
NATIONAL SUPPORT TEAMS: EMERGING THEMES FROM THE INFANT MORTALITY SUPPORT TEAM VISITS
Annette Williamson is the program manager of the Department of Health National Support Team for infant mortality in England. She is a trained registered nurse, midwife, and health visitor and has worked as both an operational manager and, more recently, as a commissioner of
Children and Young People Services. She has worked within the NHS for 30 years, predominantly in Birmingham, the second largest city in the United Kingdom.
NSTs are designed to provide assistance through consultancy-style site visits to those areas experiencing the highest rates of infant mortality. A multiagency team of experts reviews the health and social care provided in a locale to provide the locale with specific, tailor-made recommendations. The team includes members of the NHS, the local government, and other sectors such as voluntary and not for profit organizations. The process is designed to be a supportive experience for the locale (see Box 4-3 for more information).
NSTs use a triangulated approach to assess demographics, health status, and access to social care (Figure 4-2). NSTs review a spectrum of areas during their visits, including housing, maternal and infant nutrition, immunizations, screenings, and rates of tobacco use and teen pregnancy.
The NST model is based on a 4-day visit to the primary care trust. At the end of the fourth day, the chief executive of the trust is provided with a comprehensive package of feedback that includes key recommendations. A series of follow-up visits by the NST also occurs. The feedback from those primary care trusts that the NST has visited has been very positive, with the trusts reporting that they value the support and recommendations that the NST gives to address challenging health inequalities.
All recommendations are evidence based and include the identification of good practices during the visit. The NST places emphasis on creating practical solutions and assisting the local team members with thinking
BOX 4-3
What Are National Support Teams?
National Support Teams (NSTs) provide consultancy-style, expert and peer tailored delivery support to health partnerships in England—Primary Care Trusts (PCTs), NHS Trusts, and Local Authorities.
Areas offered support are identified principally on performance and who would most benefit. Discussions take place with Government Offices and Strategic Health Authorities prior to offer being made to individual areas. Local areas are the clients.
Expertise drawn from the NHS, Local Government and Third Sector (voluntary and not for profit organizations) with expertise in relevant topic areas, change management, commissioning and public health. Matching expertise principle used.
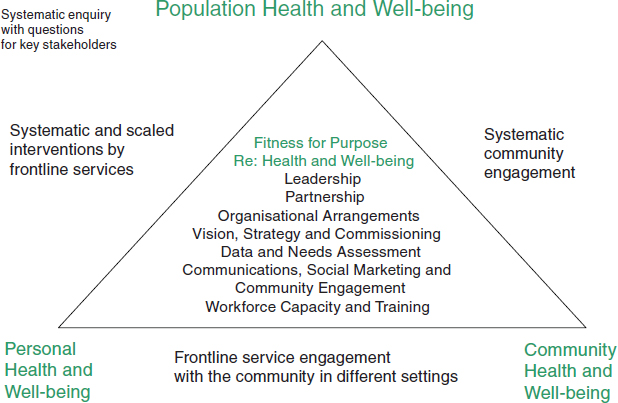
FIGURE 4-2 NST model.
through their priorities. The team also addresses means of reducing health inequalities and improving standards of care and health outcomes. Since their inception in 2006, the NSTs have made more than 200 visits to local health trusts and spearhead areas.
The infant mortality NST has an ambitious goal of reducing the infant mortality rate for the population with routine and manual occupations (which the United Kingdom Office for National Statistics defines as individuals with lower supervisory and technical occupations or semiroutine and routine occupations). At the end of 2010, that population had a 10 percent higher infant mortality rate than the general population. Nevertheless, according to Williamson, the data demonstrate that significant inroads to meeting this target are being made.
Overall, the NHS works to ensure that all resources are targeted to those with the greatest health need. The NHS reviews its investments in these areas via contracts, health impact assessments, and equity audits. For example, reducing teen pregnancy rates would yield reductions in sudden infant deaths, as the infants of teenage mothers have an increased risk of mortality. Thus, the infant mortality team takes specific interest in teenage mothers and single mothers. Ethnicity and homelessness are also considered to be critical factors affecting infant mortality. Williamson outlined five emerging strategic themes from her work with the infant mortality NST. These are outlined in Box 4-4.
BOX 4-4
Emerging Strategic Themes from Implementation Plan for Reducing Health Inequalities in Infant Mortality
Knowing the target, knowing your gap
Make the target part of everyday business
Taking responsibility and engaging communities
Matching resources to need
Focusing on what can be done
Maternal obesity has an impact on infant mortality rates as well (obesity is considered a major health problem in England). Other areas of focus include reducing child poverty rates and reducing smoking rates. Reducing overcrowding is also seen as critical because children living under overcrowded conditions are 10 times more likely to catch meningitis and 3 times more likely to develop chronic respiratory conditions. Rates of sudden infant death syndrome also increase in overcrowded environments.
Williamson outlined some emerging themes from the work of the infant mortality NST. First, she said, the target must be clear and must incorporate relevant social factors as well as health needs. In other words, a holistic approach with an overarching set of strategies is required. She noted that, in particular, housing and social care services alongside voluntary organizations have clear roles to play. Health care, social care, and voluntary organizations prepare local area agreements, which are cross-cutting plans that incorporate service delivery, and must agree to the targets and to deliver services together to affect the target. Second, social marketing is a key component in focusing the local community on meeting health targets. Regional social marketing advisors within each strategic health authority help increase community awareness and engagement. The use of social marketing strategies is growing throughout England. Such strategies include the use of tools such as Mosaic to give providers an understanding of different populations and their preferences and needs.
Innovative ways to deliver information and services are also developing. For example, call centers are being used more widely, and service delivery is occurring at nontraditional venues, such as faith centers and schools. Text messaging is also being used to contact residents. Williamson highlighted that the NHS has an infinite demand for services and finite resources; therefore, services need to be commissioned to ensure that they have an impact on those populations at the greatest risk.
The role of data cannot be underestimated, and the NHS is developing
a major information technology (IT) program that will herald an electronic health care record system. The current NHS data system is disparate, as local data sources do not always connect. It is hoped that the new IT program will create this connectivity.
Strategic partnerships are another component of the NHS. For example, health and well-being partnerships include housing departments to prioritize health and well-being priorities for local authorities. These partnerships have been developed across every local health authority within England.
Williamson concluded by outlining next steps for the infant mortality NST. Team staff members are developing a workshop based on strategies to deal with child poverty, and development of a database of “best practices” is under way. Site visits to local areas will continue to provide support in reaching and maintaining goals.
Roundtable member Tom Granatir noted that the Centers for Disease Control and Prevention do conduct social marketing campaigns in the United States. For example, public service announcements target smoking cessation. He noted that, in fact, the idea for using commercial marketing techniques to achieve social goals actually originated in the United States.
An audience member asked about the “rigid, hierarchical class system” in England and whether that affects infant mortality rates in disadvantaged populations. Annette Williamson responded that they consider quintiles of deprivation in a given population. A deeper look at the bottom quintile is then chosen to detect the factors contributing to life in the bottom quintile such as poverty, access to transportation, and so on. Age and ethnicity are also considered. Interventions are then targeted to the bottom two quintiles.
HEALTH DISPARITY-RELATED ACTIVITIES UNDER MASSACHUSETTS HEALTH CARE REFORM
Joel Weissman is the senior health policy advisor to the secretary within the Massachusetts Executive Office of Health and Human Services. His presentation focused on health disparity-related activities as a part of the health care reform law in Massachusetts, referred to as Chapter 58.
Chapter 58: Massachusetts Health Care Reform
Weissman provided an overview of Chapter 58 to lay the groundwork for the discussion of health disparities. The principle behind the law is to make coverage a shared responsibility between individuals (an individual
mandate), employers (“play or pay—), and the state government (Medicaid expansions). In 2008, after passage of the law, only 2.6 percent of the population in the state was uninsured. This is by far the lowest uninsurance rate in the country.
One of the major arguments against the health care reform bill was that costs would go up. Weissman noted that, in fact, health care costs did go up in Massachusetts. However, costs also increased in the rest of the country. In Massachusetts, costs went up proportionally for individuals, employers, and the government, indicating that the coverage mandates did not adversely affect any one group. Public support for the law has been high, with 67 percent supporting the bill in 2007, the year that it passed.
Will Universal Coverage Lead to Reductions in Disparities?
Weissman described a study by Michael McWilliams and colleagues looking at the effects of near-universal Medicare coverage on cardiovascular disease and diabetes rates using NHANES (National Health and Nutrition Examination Survey) data. They found that, “with near-universal Medicare coverage after age 65 years, differences in systolic blood pressure, hemoglobin A1c levels, or total cholesterol levels reduced substantially” (McWilliams et al., 2009, p. 510). He also noted a press release by the Commonwealth Fund stating that universal coverage could be a possible means of reducing these types of disparities in the general population. The question is, would near-universal coverage in Massachusetts lead to similar reductions in health disparities?
The first challenge is to look more closely at that 2.6 percent of the population that remains uninsured. The data show that in 2007, Hispanics had the highest levels of uninsurance, at 10.2 percent of the population. By 2009, this rate had declined to 7.2 percent. However, the decline for non-Hispanic whites was from 4.6 percent down to 2.2 percent. In other words, Hispanics still have a higher rate of uninsurance than whites.
Weissman presented data indicating that despite the near-universal coverage in Massachusetts, disparities in access to services as well as in premature or excessive mortality rates for cancer, HIV infection, diabetes, and asthma still exist between racial and ethnic groups. Blacks and Hispanics also have higher rates of hospitalization for many conditions and diseases.
Another way to look at the effects of near-universal coverage is to look at differences in emergency room (ER) visits. Figure 4-3 shows that Hispanics are far more likely to have had an ER visit for a nonemergency health issue than individuals in other racial or ethnicity groups. Similarly, blacks and Hispanics are more likely than whites to report having problems paying medical bills in the past year.
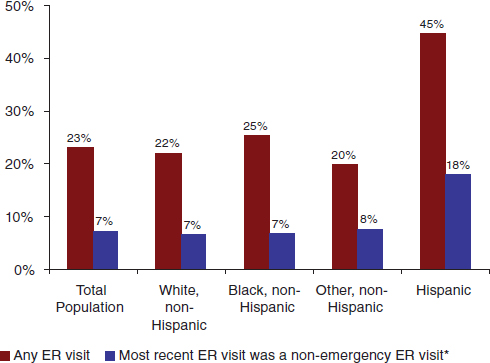
FIGURE 4-3 Non-elderly adults with ER visit in the past 12 months by race/ethnicity, 2008.
NOTE: * = A non-emergency ER visit is one that the respondent says could have been treated by a regular doctor if one had been available.
SOURCE: 2008 Massachusetts Health Insurance Survey.
Disparities Provisions in Chapter 58
Weissman explained that Chapter 58 has three sections that pertain to disparities. First, Section 16O mandates provisions for an ongoing Health Disparities Council. Second, Section 25 describes a pay-for-performance plan, specifically including “the reduction of racial and ethnic health disparities in the provision of care.” Third, Section 16L requires the formation of a Health Care Quality and Cost Council (QCC). The QCC is to make recommendations about reducing costs and improving quality of care, as well as on reducing disparities.
Section 16O mandates the development of recommendations for reducing and eliminating racial and ethnic disparities in both access to health care and outcomes. The organization responsible for these recommendations is the Massachusetts Council for the Elimination of Racial and Ethnic Disparities, and it is chaired by two state legislators.
One of the activities of this council is to create a disparities report card. This is an effort to move beyond the situation in which a report is read once and then filed away or put on a shelf. A report card allows continued action and continued accountability. It is essential that the report card be both topical and easily digestible in order to move ahead on reducing disparities. Weissman recommends no more than 20 or 30 indicators for a disparities report card.
Figure 4-4 shows how data beyond the traditional public health statistics can be used to draw attention to a health disparity. For example, although blacks are only 24 percent of the population in Boston, they account for 74 percent of gunshot victims. However, care needs to be taken so that “blaming the victim” does not occur.
The Disparities Report Card for Massachusetts covers the following outline: health status indicators; health utilization, access, and quality indicators; personal health practices and individual factors; social determinants; and laws and social policies affecting health that may disproportionately affect racial and ethnic minorities. One example of such a social policy can be seen in the original creation of the federal Social Security program. When Social Security was started, farm workers and domestic workers were excluded from eligibility. Eighty percent of farm workers and domestic workers were African American at that time. A policy that was in theory designed to be good for all people disproportionately negatively affected racial minorities.
A second example of a policy or regulation that affects minorities is state Medicaid policy. Medicaid underpays physicians for their services. At the same time, racial and ethnic minority group members are disproportionately more likely to use Medicaid. This likely affects access to care for racial and ethnic minority groups.
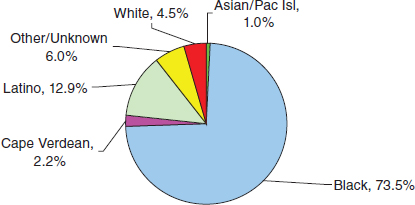
FIGURE 4-4 Nonfatal gunshot injuries by race/ethnicity, Boston, 2003–2005 combined.
Pay-for-Performance Approaches
The second component of health reform, pay for performance (P4P), rewards health care providers for scoring well on certain health indicators in their patient populations. This is another strategy that can be employed to reduce disparities.
Massachusetts uses two types of indicators for P4P. The first involves structural measures, such as culturally linguistic and appropriate services (CLAS). These standards are measured via surveys, and hospitals are rewarded for improving their performance on the CLAS standards.
The second indicator for P4P is clinical measures. Although there are measures that currently exist, the existing measures are targeted for a Medicare population, rather than a Medicaid population. At present, work groups look at measures such as maternity indicators, newborn indicators, and a pediatric asthma indicator. These measures are in the development process so that they better fit a Medicaid population.
Weissman noted that implementation of P4P faces a number of challenges around disparities reduction. The first question is, “Does the measure being used to implement CLAS standards for high-stakes purposes need to be different from the one used for prior reporting?” This can lead to a reexamination of the survey tool in use.
Second, the clinical measures currently in use are based only on Medicaid patients. Does this actually make sense in terms of disparities reduction? It may make more sense to base P4P payments on reducing disparities for all patients, as opposed to just Medicaid patients. This is an issue that will have to be decided in Massachusetts in the future.
The third challenge is the question, “Do Massachusetts hospitals have sufficient numbers of racial and ethnic minority patients for stratification purposes?” Weissman estimated that only 5 to 10 hospitals in Massachusetts actually have sufficient numbers of cases involving racial and ethnic minority patients, making the goal of disparities reduction difficult.
Fourth, Weissman described what he called the “between problem.” Disparities not only exist within a health care setting but also exist across the settings themselves. Rewarding particular hospitals, then, for reducing disparities might not actually be targeting the disparities of interest or the settings of interest.
Finally, Weissman discussed the gathering of data on a patient’s race, ethnicity, and language (both written and spoken). He emphasized that these data would be a part of the permanent eligibility file rather than included on every claim.
Noting that the collection of these data is controversial, Weissman asked David Pryor, of Aetna, about Aetna’s efforts to gather this information for all Aetna patients, as Aetna has been a pioneer in collecting these
data. Pryor said that Aetna has approximately 18.5 million members and that data on about 5.2 million of those members have been collected (via self-identification).
Weissman commented that gathering of these data encounters many barriers, including the fact that the process of surveying all health plan members is expensive. His goal was to have health plans collect race and ethnicity data on 2 percent of their members by July 1, 2010. Additionally, the hope is that health plans will begin to see these data to be useful for their own purposes, perhaps increasing the amount of data that they collect.
Indirect estimation is another technique for gauging the race and ethnicity of the target patient population. Developed by Roundtable chair Nicole Lurie and her colleagues at the Rand Corporation, indirect estimation uses the individual’s surname and where he or she lives via geocode analysis. These data provide an estimation of the individual’s race and ethnicity by providing a probability for each and every possible category. These probabilities are then aggregated. Weissman noted that although both surname analysis and geocoding are not new, it is the combination of the two that allows the estimation to have greater accuracy. For example, a person whose last name is Smith who lives in one area of the city has a different probability of being African American than a person named Smith who lives in a different part of the city.
In one experimental evaluation of the indirect estimation technique, Fremont and colleagues (2005) compared the direct method of determining race and ethnicity (by simply asking patients) with the indirect method (by looking at aggregated health plan data) and found that the indirect method is extremely accurate.
One health plan in Massachusetts used the indirect method to use data to directly affect racial and ethnic health disparities. The Harvard Vanguard health plan has used the indirect method to look at a community where many diabetic patients who were members of minority groups were not getting eye exams. When the plan looked at the community more closely, it was clear that no ophthalmologists practiced in that community. The health plan responded by sending an ophthalmologist into the community to conduct eye exams for the diabetic patients living in that community.
Weissman noted that use of the indirect estimation method sometimes causes discomfort. It is best thought of, he said, as an interim measure. Self-reported race and ethnicity is the “gold standard,” but collection of this information is not always feasible. So, in Massachusetts, indirect estimation will be used on a pilot basis with health plans, and the indirect estimation data will be used to supplement, not replace, self-reported data.
The full effects of the Massachusetts health reform plan on the reduction of racial and ethnic health disparities are still unknown. More measurements are needed and more data need to be collected. What is in place, however, is a step in the right direction:
- The Massachusetts Health Disparities Council will release a yearly report card showing the ongoing results of the efforts of the state health care reform program to reduce disparities.
- Mass Health Medicaid is revising and implementing financial incentives to reduce health disparities by race and ethnicity at the hospital level.
- The Quality and Cost Council is poised to make Massachusetts the first state in the nation to stratify HEDIS (Healthcare Effectiveness Data and Information Set) quality measures by race and ethnicity.
One workshop participant described the tendency of people to assume that a community that has no local grocery stores is, by definition, a community of color. She questioned, then, why indirect estimation needs to be used to determine this when it is already assumed to be true.
Joel Weissman responded that in large cities, large differences exist between communities within that city; in other words, as he stated, “not all minority communities are the same.” The indirect estimation technique has the advantage of allowing more detailed information about a community to be collected. For example, one community may not have adequate bus service for its residents to access health care in a neighboring community. This means that the issues can be better defined and resources can be better targeted to reflect the population of that community.
Beveridge, W. 1942. Social insurance and allied services. Presentation to the Parliament of the United Kingdom, November.
Fremont, A. M., A. Bierman, S. L. Wickstrom, C. E. Bird, M. Shah, J. J. Escarce, T. Horstman, and T. Rector. 2005. Use of geocoding in managed care settings to identify quality disparities. Health Affairs 24(2):516–526.
Massachusetts Division of Health Care Finance and Policy. 2008. 2008 Massachusetts Health Insurance Survey. Boston, MA: Author.
McWilliams, J. M., E. Meara, A. M. Zaslavsky, and J. Z. Ayanian. 2009. Differences in control of cardiovascular disease and diabetes by race, ethnicity, and education: U.S. trends from 1999 to 2006 and effects of Medicare coverage. Annals of Internal Medicine 150(8):505–515.


