
Biofuels that can be produced from renewable domestic resources offer an alternative to petroleum-based fuels. To encourage the production and consumption of biofuels in the United States, the U.S. Congress enacted the Renewable Fuel Standard (RFS) as part of the 2005 Energy Policy Act and amended it in the 2007 Energy Independence and Security Act (EISA). The RFS, as amended by EISA (referred to as RFS2 hereafter), mandated volumes of renewable fuels to be used in U.S. transportation fuel from 2008 to 2022 (Figure S-1; see Box S-1 for definitions of renewable fuels pertaining to RFS2). At the request of the U.S. Congress, the National Research Council convened a committee of 16 experts to provide an independent assessment of the economic and environmental benefits and concerns associated with achieving RFS2. The committee drew on its own expertise and solicited input from many experts in federal agencies, academia, trade associations, stakeholders’ groups, and nongovernmental organizations in a series of open meetings and in writing to fulfill the statement of task. (See complete statement of task in Appendix A.)
The committee was asked to
- Describe biofuels produced in 2010 and projected to be produced and consumed by 2022 using RFS-compliant feedstocks primarily from U.S. forests and farmland. The 2022 projections were to include per-unit cost of production.
- Review model projections and other estimates of the relative effects of increasing biofuel production as a result of RFS2 on the prices of land, food and feed, and forest products; on the imports and exports of relevant commodities; and on federal revenue and spending.
- Discuss the potential environmental harm and benefits of biofuel production and the barriers to achieving the RFS2 consumption mandate.
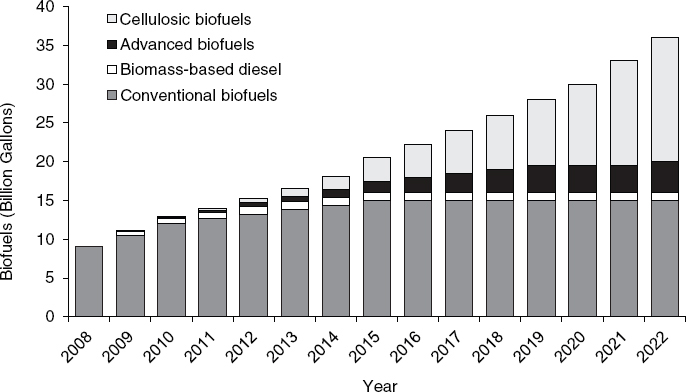
FIGURE S-1 Renewable fuel volume consumption mandated by RFS2.
NOTE: All volumes, except for volumes of biomass-based diesel, are shown in billions of gallons of ethanol-equivalent. The consumption mandate for biomass-based diesel is to be met on a biodiesel-equivalent basis.
BOX S-1
Definitions of Renewable Fuels in RFS2
RFS2 divides the total renewable fuel requirement into four categories:
• Conventional biofuel that is ethanol derived from corn starch and has a life-cycle greenhouse-gas (GHG) threshold of at least 20-percent reduction in emissions compared to petroleum-based gasoline and diesel.
![]() Biomass-based diesel that achieves life-cycle GHG reduction threshold of at least 50 percent.
Biomass-based diesel that achieves life-cycle GHG reduction threshold of at least 50 percent.
![]() Advanced biofuels that are renewable fuels other than ethanol derived from corn starch and that achieve a life-cycle GHG reduction threshold of at least 50 percent. Advanced biofuels can include cellulosic biofuels and biomass-based diesel.
Advanced biofuels that are renewable fuels other than ethanol derived from corn starch and that achieve a life-cycle GHG reduction threshold of at least 50 percent. Advanced biofuels can include cellulosic biofuels and biomass-based diesel.
![]() Cellulosic biofuels derived from any cellulose, hemicellulose, or lignin from renewable biomass that achieve a life-cycle GHG reduction threshold of at least 60 percent.
Cellulosic biofuels derived from any cellulose, hemicellulose, or lignin from renewable biomass that achieve a life-cycle GHG reduction threshold of at least 60 percent.
KEY FINDINGS
FINDING: Absent major technological innovation or policy changes, the RFS2-mandated consumption of 16 billion gallons of ethanol-equivalent cellulosic biofuels is unlikely to be met in 2022.
The United States had the capacity to produce 14.1 billion gallons of ethanol per year from corn grain and 2.7 billion gallons of biodiesel per year from soybean oil, other vegetable oils, and animal fats at the end of 2010. That year, about 13.2 billion gallons of ethanol and
311 million gallons of biodiesel were produced in the United States. Therefore, adequate volumes are likely to be produced to meet the consumption mandates of 15 billion gallons of conventional biofuel and at least 1 billion gallons of biodiesel1 by 2022. In contrast, whether and how the mandate for cellulosic biofuels will be met is uncertain. Although several studies suggested that the United States can produce adequate biomass feedstock for conversion to 16 billion gallons of ethanol-equivalent cellulosic biofuels to meet the consumption mandate, no commercially viable biorefineries exist for converting lignocellulosic biomass to fuels as of the writing of this report. Another report, Liquid Transportation Fuels from Coal and Biomass: Technological Status, Costs, and Environmental Impacts, estimated that aggressive deployment, in which the capacity build rate doubles the historic capacity build rate of corn-grain ethanol, is needed if 16 billion gallons of ethanol-equivalent cellulosic biofuels are to be produced by 2022. That estimate was based on the assumption that robust commercial-scale technology would be ready for deployment by 2015. Although the government guarantees a market for cellulosic biofuels regardless of price up to the level of the consumption mandate,2 policy uncertainty and high cost of production might deter investors from aggressive deployment. Therefore, the capacity for producing cellulosic biofuels to meet the RFS2 consumption mandate will not be available unless innovative technologies are developed that unexpectedly improve the cellulosic biofuel production process, and technologies are scaled up and undergo several commercial-scale demonstrations in the next few years to optimize capital and operating costs.
FINDING: Only in an economic environment characterized by high oil prices, technological breakthroughs, and a high implicit or actual carbon price would biofuels be cost-competitive with petroleum-based fuels.
The committee used the Biofuel Breakeven Model to evaluate the costs and feasibility of a local or regional cellulosic biomass market for a variety of potential feedstocks. The model was used to estimate the minimum price that biomass producers would be willing to accept (WTA) for a dry ton of biomass delivered to the biorefinery gate and the maximum price that biorefineries would be willing to pay (WTP) to at least break even.
The price of crude oil, which is the chief competitor with biofuels, is a key determinant in the competitiveness of cellulosic biofuel and other advanced biofuels in the marketplace. Because crude oil prices are highly volatile, the difference between the WTP and WTA was calculated for three oil prices: $52, $111, and $191 per barrel, which are the low, reference, and high price projections for 2022 from the Department of Energy’s Annual Energy Outlook in 2008$. Table S-1 shows that the price gap is positive for all potential cellulosic feedstocks if the oil price is $111 per barrel and policy incentives for biofuels do not exist. In this scenario, no cellulosic feedstock market is feasible without policy incentives.
A cellulosic feedstock market would be feasible under other circumstances, such as if the price of oil reaches $191 per barrel, if a carbon price makes the price of cellulosic biofuels more competitive, if government subsidy payments are high enough, or if government mandates are enforced at given levels of biofuel blending. Oil price affects both the processor’s WTP through fuel revenues and the supplier’s WTA through production, handling, and transport costs. The price gap is eliminated for several feedstocks when oil prices are
______________
1 The actual consumption mandate for biomass-based diesel is 1.0 billion gallons per year in 2012. Thereafter, the volume, no less than 1.0 billion gallons of biodiesel equivalent per year, is to be determined by EPA in a future rule making.
2 RFS2 mandates that the production capacity of cellulosic biofuels be used to the extent that companies build it.
| WTA | WTP | Price Gap (Per Dry Ton) | Price Gap (Per Gallon of Ethanol) | |
| Corn stover in a corn-soybean rotation | $92 | $25 | $67 | $0.96 |
| Corn stover in a 4-year corn-alfalfa rotation | $92 | $26 | $66 | $0.94 |
| Alfalfa | $118 | $26 | $92 | $1.31 |
| Switchgrass in the Midwest | $133 | $26 | $106 | $1.51 |
| Switchgrass in Appalachia | $100 | $26 | $74 | $1.06 |
| Miscanthus in the Midwest | $115 | $26 | $89 | $1.27 |
| Miscanthus in Appalachia | $105 | $27 | $79 | $1.13 |
| Wheat straw | $75 | $27 | $49 | $0.70 |
| Short-rotation woody crops | $89 | $24 | $65 | $0.93 |
| Forest residues | $78 | $24 | $54 | $0.77 |
NOTE: Conversion yield of biomass to ethanol is assumed to be 70 gallons per dry ton. These results are based on original modeling work by the committee that builds upon the work performed in Liquid Transportation Fuels from Coal and Biomass: Technological Status, Costs, and Environmental Impacts (NAS-NAE-NRC, 2009).
at or above $191 per barrel. Alternatively, a carbon price3 of $118-$138 per tonne of CO2 equivalent can close the gap between WTP and WTA at an oil price of $111 per barrel for some feedstocks given current technology. A subsidy of $1.01 per gallon of cellulosic biofuel blended with fossil fuel was established in 2008, but this payment is not sufficient to close the price gap at $111 per barrel of oil.4
RFS2 is decoupled from biofuel cost of production and economics. Although the economics may be a strong deterrent to developing capacity, cellulosic biofuels will have a government-mandated market to the extent that capacity is built. The future of RFS2 after it expires in 2022 is a source of uncertainty for investors.
FINDING: RFS2 may be an ineffective policy for reducing global GHG emissions because the effect of biofuels on GHG emissions depends on how the biofuels are produced and what land-use or land-cover changes occur in the process.
GHGs are emitted into the atmosphere or stored in soil during different stages of biofuel production—for example, CO2 storage in biomass during growth and emissions from fossil fuel combustion in the manufacturing, transport, and application of agricultural inputs, from fermentation to ethanol, and from tailpipe emissions. Processes that affect GHG emissions of biofuels also include land-use and land-cover changes. If the expanded production involves removing perennial vegetation on a piece of land and replacing it with an annual commodity crop, then the land-use change would incur a one-time GHG emission from biomass and soil that could be large enough to offset GHG benefits gained by displacing petroleum-based fuels with biofuels over subsequent years. Furthermore, such land conversion may disrupt any future potential for storing carbon in biomass and soil.
______________
3 A carbon price can be enacted through a carbon tax credit provided to the biofuel producer (or feedstock supplier) per dry ton of cellulosic feedstock refined or as the market price for carbon credits if processors are allocated marketable carbon credits for biofuel GHG reductions relative to conventional gasoline.
4 These conclusions are based on average prices for a cellulosic biofuel industry that is assumed to be commercially competitive and viable. Other studies have shown small quantities of biomass feedstocks could be available at significantly lower prices.
In contrast, planting perennial bioenergy crops in place of annual crops could potentially enhance carbon storage in that site.
Indirect land-use change occurs if land used for production of biofuel feedstocks causes new land-use changes elsewhere through market-mediated effects. The production of biofuel feedstocks can constrain the supply of commodity crops and raise prices. If agricultural growers anywhere in the world respond to the market signals (higher commodity prices) by expanding production of the displaced commodity crop, indirect land-use change occurs. This process might ultimately lead to conversion of noncropland (such as forests or grassland) to cropland. Because agricultural markets are intertwined globally, production of bioenergy feedstock in the United States will result in land-use and land-cover changes somewhere in the world, but the extent of those changes and their net effects on GHG emissions are uncertain.
Biofuels produced from residues or waste products, such as corn stover and municipal solid waste, will not contribute much GHG emissions from land-use or land-cover changes as long as adequate residue is left in the field to maintain soil carbon. However, it is not economically and environmentally feasible to produce enough biomass to meet RFS2 through crop residue or municipal solid waste. Therefore, dedicated energy crops will have to be grown to meet the mandate, which will likely require conversion of uncultivated cropland or the displacement of commodity crops and pastures. The extent of market-mediated land-use change and the associated GHG emissions as a result of increasing biofuels and dedicated bioenergy crop production in the United States are difficult to estimate and highly uncertain. Although RFS2 imposes restrictions to discourage bioenergy feedstock producers from land-clearing or land-cover change in the United States that would result in net GHG emissions, the policy cannot prevent market-mediated effects nor control land-use or land-cover changes in other countries. Therefore, the extent to which biofuel produced from dedicated energy crops will result in savings in GHG emissions compared to using petroleum is uncertain.
ECONOMIC EFFECTS OF INCREASING BIOFUEL PRODUCTION
Land Prices
FINDING: Absent major increases in agricultural yields and improvement in the efficiency of converting biomass to fuels, additional cropland will be required for cellulosic feedstock production; thus, implementation of RFS2 is expected to create competition among different land uses, raise cropland prices, and increase the cost of food and feed production.
Cropland acreage in the United States has been declining as it has in all developed countries. If the United States produces 16 billion gallons of ethanol-equivalent cellulosic biofuels by 2022, 30-60 million acres of land might be required for cellulosic biomass feedstock production, thereby creating competition among land uses. Although biofuels produced from crop and forest residues and from municipal solid wastes could reduce the amount of land needed for cellulosic feedstock production, those sources are inadequate to supply 16 billion gallons of ethanol-equivalent cellulosic biofuels, particularly if a proportion of crop and forest residues are left in the field to maintain soil quality.
Food and Feed Prices
FINDING: Food-based biofuel is one of many factors that contributed to upward price pressure on agricultural commodities, food, and livestock feed since 2007; other factors
affecting those prices included growing population overseas, crop failures in other countries, high oil prices, decline in the value of the U.S. dollar, and speculative activity in the marketplace.
To date, the agricultural commodities most affected by U.S. biofuel production are corn and soybean. The increased competition for these commodities created by an expanding biofuel market has contributed to upward pressure on their prices, but the increase has had a small effect on consumers’ food retail prices, except livestock products, because corn and soybean typically undergo some processing before reaching consumers’ food basket. The difference between the price of an unprocessed commodity and the retail price of processed food is typically large. The committee estimated that an increase of 20-40 percent in agricultural commodity prices would result in an increase in the retail price of most processed grocery food products (for example, breakfast cereal and bread) containing those commodities of only 1 to 2 percent.
Corn and soybean are used as animal feed, so the livestock market has experienced increased competition from the biofuels market. Some of this competition is alleviated by the ability of livestock producers to feed their animals dried distillers grain with solubles (DDGS), a coproduct of dry-milling corn grain into ethanol. However, there are limits to the amount of DDGS that can be used without impairing efficient production and the quality of the product. Moreover, increased commodity prices raise the production costs of livestock, and the animal producer’s ability to pass increased production costs quickly on to consumers is limited because high prices decrease demand. The reproductive pipeline involved in livestock production makes it difficult for producers to adjust herd numbers quickly in response to increased feed costs.
Price of Woody Biomass
Wood is the most widely available cellulosic bioenergy feedstock in the United States at present, and it will be an important source of supply for cellulosic biofuel refineries if they become economically viable. If a commercial woody biomass refinery is built, it would require a large supply of dry biomass to operate efficiently (1,000-2,000 dry tons per day). Residues from forest harvesting operations could provide only a modest supply of cellulosic feedstock for such an operation due to the high marginal cost of harvesting these additional materials, the limited legal definition for accessing residues, and the uncertain nature of future federal subsidies. Although there are currently large supplies of milling residues in the wood processing industry, most of these residues are already committed to electricity production (in recent years, up to 132 million dry tons of roundwood equivalent5), and thus would be costly for cellulosic biofuel producers to purchase. Pulpwood is the closest marketable commodity that could enter woody biomass markets, but it is a higher value product (and thus more costly as a feedstock) than either forest harvest residues or milling residues. As a result, RFS2 is likely to have large effects on wood product prices. Some factors could mitigate these effects, including technological breakthroughs that reduce the cost of extracting forest residues, changes in the legal definition for accessing residues, and the size of subsidies for forest residues.
______________
5 This includes industrial roundwood used directly to produce energy as well as residues, black liquor from the pulping process, and fuelwood harvested from the forest.
Imports and Exports of Relevant Commodities
A growing biofuel industry was one factor that contributed to an increase in international commodity prices. However, exports of corn, soybean, and wheat held steady or even increased largely due to a huge decline in the value of the U.S. dollar between 2002 and 2008. With a lower value for the U.S. dollar, commodity prices did not increase nearly as much in other currencies such as the euro or yen. If commodity prices had not increased as a result of biofuel production and other factors and the U.S. dollar had still depreciated, exports likely would have increased more.
Increased animal product costs (for example, prices of meat and dairy) as a result of the simultaneous implementation of RFS2 and the European Union’s biofuel mandates are expected to decrease the global value of livestock industries substantially, with one estimate being $3.7 billion between 2006 and 2015 (2006$). Most of this decrease will occur outside the United States, which will observe only a minor reduction ($0.9 billion) in its livestock and processed livestock products. The effect in the United States is buffered by the increasing availability of coproducts from corn-grain ethanol production, especially DDGS.
Current estimates suggest that the RFS2 mandate will likely increase wood imports into the United States. If wood currently used by the wood processing sector is diverted to meeting the RFS2 mandate, the shift in industrial wood from traditional uses to biofuels could cause the United States to import more industrial wood from elsewhere. The scale of this effect, however, cannot be precisely estimated at this time.
Achieving RFS2, along with increasing fuel efficiency standards in vehicles, can contribute to reducing the nation’s dependence on oil imports. If RFS2 is to be achieved, domestically produced biofuels can displace 1.6 million barrels of petroleum-based fuels each day. (Consumption of petroleum-based transportation fuels in 2010 was 13.5 million barrels per day.) Even if part of the RFS2 consumption mandate is to be met by imported ethanol, a net reduction in the volume of imported oil is expected.
Federal Budget
FINDING: Achieving RFS2 would increase the federal budget outlays mostly as a result of increased spending on payments, grants, loans, and loan guarantees to support the development of cellulosic biofuels and forgone revenue as a result of biofuel tax credits.
Federal Spending
Agricultural Commodity Payments
Federal spending on agricultural commodity payments is not expected to change as a result of increasing biofuel production in the United States. Government payments to the producers of the major agricultural commodities primarily take one of two forms: direct payments and countercyclical payments. Direct payments are fixed payments provided to crop producers regardless of the market price received by crop producers. Thus, under no circumstances would RFS2 generate savings in the budget cost of the direct payment program. Countercyclical payments are paid when the market price for a crop is less than the effective target price of that crop. The effective target price of a crop is calculated as the legislated target price of that crop minus the direct payment for that crop. U.S. agricultural commodity prices are projected to exceed effective target prices from 2011 to 2021. If these projections hold true, then no countercyclical payments will be paid.
Conservation Reserve Program
The effect of biofuel production on the federal spending for conservation programs is uncertain. The Conservation Reserve Program (CRP) is the largest federal conservation program directed at agricultural land. Its objective is to provide “technical and financial assistance to eligible farmers and ranchers to address soil, water, and related natural resource concerns on their lands in an environmentally beneficial and cost-effective manner” (http://www.nrcs.usda.gov/programs/crp/). At the time this report was written, participants in the program received an average payment of $44 an acre. Federal outlays for fiscal year 2010 were estimated to cost $1.7 billion. If land is withdrawn from CRP for biofuel feedstock production and not replaced by new enrollment, the cost of CRP will decrease. However, CRP application acreage in a given year typically exceeds the maximum program acreage. The cost of the program will increase if enrollment applications are insufficient and if per-acre payment levels are increased to keep CRP competitive with crop or biofuel feedstock production and to incentivize producers to keep the most sensitive land in the program.
Nutritional and Other Income Assistance Programs
Nutritional and other income assistance programs are often adjusted for changes in the general price level as a means of protecting the real purchasing power of program recipients; therefore, if food retail prices increase, the program payments will typically be adjusted to reflect this change. Under such circumstances, expenses will increase not only for the Supplemental Nutrition Assistance Program and the Special Supplemental Assistance Program for Women, Infants, and Children,6 but also for much larger income assistance programs, such as Social Security, military or civilian retirement programs, or Supplemental Security Income. Given that biofuels are only one of many factors affecting food retail prices, possible increases in the costs of these programs cannot be solely attributed to RFS2.
Grants, Loans, and Loan Guarantees
Grants, loans, and loan guarantees to support the production of feedstock, the cost of biofuel processing, and the development of cellulosic biofuel infrastructure have also been made. Biofuel production subsidies that reduce the cost of feedstock purchased by cellulosic biofuel refineries are typically provided in the form of payments per unit of feedstock purchased. Research into lowering the cost of biofuel processing can be aimed at many different areas in the production chain, including investment in increasing crop yields and in increasing the amount of biofuel produced per unit of biomass. Subsidies to reduce the capital investment cost of constructing cellulosic biofuel refineries are typically provided in the form of tax credits, grants, loans, or loan guarantees that provide a rate of interest below what investors could obtain from alternative financing sources.
Forgone Federal Revenue
Transportation fuels are taxed in the United States, but the structure of excise tax rates and exemptions varies by transportation mode and fuel type. Biofuel use is encouraged through a federal tax credit to fuel blenders. The 2008 farm bill set the Volumetric Ethanol Excise Tax Credit (VEETC) at $0.45 per gallon of ethanol blended with gasoline. Blenders receive a $1 per gallon tax credit for the use of biodiesel, and a $1.01 per gallon credit for the use of cellulosic biofuel. The value of payments made to blenders for the use of biodiesel
______________
6 Two nutritional assistance programs operated by the U.S. Department of Agriculture.
and cellulosic biofuel is less than $1 billion a year because these fuels are not produced in large volumes. However, forgone federal tax revenue as a result of VEETC was $5.4 billion in 2010 and is anticipated to increase to $6.75 billion in 2015 as corn-grain ethanol production approaches the mandate limit. The forgone revenue is much larger than any savings that could be gained from reduced CRP enrollment. As of the writing of this report, the biofuel subsidies were under review by Congress.
Impact with No Federal Subsidies
All biofuel tax credits will end in 2012 unless Congress takes action to extend them, but RFS2 will remain in effect. Without biofuel tax credits and with RFS2 in effect, the cost of biofuel programs is borne directly by consumers, as they are forced to pay a higher cost for the blended renewable fuel than for petroleum-based products. Otherwise, consumers bear the cost of biofuel programs indirectly through taxes paid.
ENVIRONMENTAL EFFECTS OF INCREASING BIOFUEL PRODUCTION
FINDING: The environmental effects of increasing biofuel production largely depend on feedstock type, site-specific factors (such as soil and climate), management practices used in feedstock production, land condition prior to feedstock production, and conversion yield. Some effects are local and others are regional or global. A systems approach that considers various environmental effects simultaneously and across spatial and temporal scales is necessary to provide an assessment of the overall environmental outcome of increasing biofuel production.
Although using biofuels holds potential to provide net environmental benefits compared to using petroleum-based fuels, the environmental outcome of biofuel production cannot be guaranteed because the key factors that influence environmental effects from bioenergy feedstock production are site specific and depend on the type of feedstocks produced, the management practices used to produce them, prior land use, and any land-use changes that their production might incur. In addition to GHG emissions, biofuel production affects air quality, water quality, water quantity and consumptive use, soil, and biodiversity. Thus, the environmental effects of biofuels cannot be focused on one environmental variable. Environmental effects of increasing biofuel production have to be considered across spatial scales because some effects are local and regional (for example, water quality and quantity) and others are global (for example, GHG emissions have the same global effect irrespective of where they are emitted). Planning based on landscape analysis could help integrate biofuel feedstock production into agricultural landscapes in ways that improve environmental outcomes and benefit wildlife by encouraging placement of cellulosic feedstock production in areas that can enhance soil quality or help reduce agricultural nutrient runoffs, anticipating and reducing the potential of groundwater overuse and enhancing wildlife habitats.
Air Quality
Air quality modeling suggests that production and use of ethanol as fuel to displace gasoline is likely to increase such air pollutants as particulate matter, ozone, and sulfur oxides. Published studies projected that overall production and use of ethanol will result in higher pollutant concentration for ozone and particulate matter than their gasoline counterparts on a national average. Unlike GHG effects, air-quality effects from corn-grain ethanol are largely localized. The potential extent to which the air pollutants harm human
health depends on whether the pollutants are emitted close to highly populated areas and exposure.
Water Quality
An assessment of the effects of producing biofuels to achieve the RFS2 consumption mandate on water quality requires detailed information on where the bioenergy feedstocks would be grown and how they would be integrated into the existing landscape. The increase in corn production has contributed to environmental effects on surface and ground water, including hypoxia, harmful algal blooms, and eutrophication. Additional increases in corn production under RFS2 likely will have additional negative environmental effects (though production of corn-grain ethanol in 2010 was only 1 billion gallons less than the consumption mandate for years 2015 to 2022). Perennial and short-rotation woody crops for cellulosic feedstocks with low agrichemical inputs and high nutrient uptake efficiency hold promise for improving water quality under RFS2, particularly if integrated with food-based crops. Use of residues would not require much additional inputs so that they are not likely to incur much negative effects on water quality as long as enough residues are left in field to prevent soil erosion. The site-specific details of the implementation of RFS2, and particularly the balance of feedstocks and levels of inputs, will determine whether or not RFS2 will lead to improved or diminished water quality.
Water Quantity and Consumptive Water Use
Published estimates of consumptive water use over the life cycle of corn-grain ethanol (15-1,500 gallons per gallon of gasoline equivalent) and cellulosic biofuels (2.9-1,300 gallons per gallon of gasoline equivalent) are higher than petroleum-based fuels (1.9-6.6 gallons per gallon of gasoline equivalent), but the effects of water use depend on regional availability. An individual refinery might not pose much stress on a water resource, but multiple refineries could alter the hydrology in a region. In particular, biorefineries are most likely situated close to sources of bioenergy feedstock production, both of which draw upon local water resources. Yet, regional water availability was not always taken into account in the models that project cellulosic biorefinery locations.
Soil Quality and Biodiversity
Effects of biofuel production on soil quality and biodiversity primarily result from the feedstock production and removal stages, particularly on the rates of biological inputs and outputs and the levels of removal. The effects of achieving RFS2 on biodiversity currently cannot be readily quantified or qualified largely because of the uncertainty in the future. Bioenergy feedstock production can reduce or enhance biodiversity depending on the compatibility of feedstock type, management practices, timing of harvest, and input use with plants and animals in the area of production and its surroundings. Precise regional assessments at each site of feedstock production for biofuels are needed to assess the collective effects of achieving RFS2 on biodiversity.
BARRIERS TO ACHIEVING RFS2
FINDING: Key barriers to achieving RFS2 are the high cost of producing cellulosic biofuels compared to petroleum-based fuels and uncertainties in future biofuel markets.
RFS2 guarantees a market for cellulosic biofuels produced, but market uncertainties could deter private investment. Of the three crude oil prices tested in this study, the only one for which biofuels were economic without subsidies was $191. The breakeven crude oil price would be between $111 and $191. If the biofuel is ethanol, there also are infrastructure and blend wall7 issues to surmount. Production of “drop-in”8 fuels instead of ethanol would eliminate these additional downstream costs. Although RFS2 provides a market for the biofuels produced even at costs considerably higher than fossil fuels, uncertainties in enforcement and implementation of RFS2 mandate levels affect investors’ confidence and discourage investment. EPA has the right to waive or defer enforcement of RFS2 under a variety of circumstances, and the agency is “required to set the cellulosic biofuel standard each year based on the volume projected to be available during the following year.” In 2011, the RFS level of 250 million gallons of ethanol-equivalent cellulosic biofuel was reduced to 6.6 million gallons. As of 2011, biofuel production is contingent on subsidies, RFS2, and similar policies.
Opportunities to reduce costs of biofuels include decreasing the cost of bioenergy feedstock, which constitutes a large portion of operating costs, and increasing the conversion efficiency from biomass to fuels. Research and development to improve feedstock yield through breeding and biotechnology and conversion yield could reduce costs of biofuel production and potentially reduce the environmental effects per unit of biofuel produced.
______________
7 Most ethanol in the United States is consumed as a blend of 10-percent ethanol and 90-percent gasoline. If every drop of gasoline-type fuel consumed in U.S. transportation could be blended, then a maximum of about 14 billion gallons of ethanol could be blended.
8 A nonpetroleum fuel that is compatible with existing pipelines and delivery mechanisms for petroleum-based fuels.


