
BioBreak Model: Assumptions for Willingness to Accept
This appendix provides detail on the assumptions and references used to calculate Willingness to Accept (WTA) in the BioBreak model, discussed in Box 4-2 in Chapter 4.
EQUATION
![]()
The supplier’s WTA for 1 ton of delivered cellulosic material is equal to the total economic costs the supplier incurs to deliver 1 unit of biomass to the biorefinery less the government incentives received (G) (for example, tax credits and production subsidies). Depending on the type of biomass feedstock, costs include establishment and seeding (CES), land and biomass opportunity costs (COpp), harvest and maintenance (CHM), stumpage fees (SF), nutrient replacement (CNR), biomass storage (CS), transportation fixed costs (DFC), and variable transportation costs calculated as the variable cost per mile (DVC) multiplied by the average hauling distance to the biorefinery (D). Establishment and seeding cost and land and biomass opportunity cost are most commonly reported on a per acre scale. Therefore, the biomass yield per acre (YB) is used to convert the per acre costs into per ton costs, and the equation above provides the minimum amount the supplier can accept for the last dry ton of biomass delivered to the biorefinery and still breakeven. The variables in the equation are based on the following assumptions.
WTA PARAMETERS
Nutrient Replacement (CNR)
Uncollected cellulosic material adds value to the soil through enrichment and protection against rain, wind, and radiation, thereby limiting erosion that would cause the loss of
vital soil nutrients like nitrogen, phosphorus, and potassium. Biomass suppliers will incorporate the costs of soil damage and nutrient loss from biomass collection into the minimum price they are willing to accept. Nutrient replacement cost (CNR) varies by feedstock and harvest technique. After adjusting for 2007 costs, estimates for nutrient replacement costs range from $5 to $21 per ton. Based on the model’s baseline oil price ($111 per barrel) and research estimates, nutrient replacement was assumed to have a mean (likeliest) value of $14.20 ($15.20) per ton for stover, $16.20 ($17.20) per ton for switchgrass, $9 per ton for Miscanthus, and $6.20 per ton for wheat straw.1 Alfalfa was assumed to have a 2-year stand with the first-year nutrient costs incorporated into the establishment costs discussed below and a cost of $65 per acre for second-year nutrient application. Given the yield assumptions for second-year alfalfa, this corresponds to approximately $16.25 per ton. Nutrient replacement was assumed unnecessary for woody biomass. The cost of nutrient replacement depends on the natural gas price and is therefore dependent on energy costs. EIA projected natural gas to oil price factor for 2022 was used to scale fertilizer costs at varying oil price levels. At the high oil price ($191 per barrel), nutrient replacement costs increase by about $1.35 per ton. At the low oil price ($52 per barrel), nutrient replacement costs decrease by about $1.00 per ton.
Harvest and Maintenance Costs (CHM) and Stumpage Fees (SF)
Harvest and maintenance cost (CHM) estimates for cellulosic material have varied based on harvest technique and feedstock. Noncustom harvest research estimates range from $14 to $84 per ton for corn stover (McAloon et al., 2000; Aden et al., 2002; Sokhansanj and Turhollow, 2002; Suzuki, 2006; Edwards, 2007; Hess et al., 2007; Perlack, 2007; Brechbill and Tyner, 2008a; Khanna, 2008; Huang et al., 2009), $16 to $58 per ton for switchgrass (Tiffany et al., 2006; Khanna and Dhungana, 2007; Kumar and Sokhansanj, 2007; Brechbill and Tyner, 2008a; Duffy, 2008; Khanna, 2008; Khanna et al., 2008; Perrin et al., 2008; Huang et al., 2009), and $19 to $54 per ton for Miscanthus (Khanna and Dhungana, 2007; Khanna, 2008; Khanna et al., 2008), after adjusting for 2007 costs.2 Estimates for nonspecific biomass range between $15 and $38 per ton (Mapemba et al., 2007, 2008). Woody biomass collection costs up to roadside range between $17 and $50 per ton (USFS, 2003, 2005; BRDI, 2008; Jenkins et al., 2009; Sohngen et al., 2010). Spelter and Toth (2009) find total delivered costs (including transportation) around $58, $66, $75, and $86 per dry ton3 for woody residue in the Northeast, South, North, and West regions, respectively.4
Using the timber harvesting cost simulator outlined in Fight et al. (2006), Sohngen et al. (2010) found harvest costs up to roadside about $25 per dry ton, with a high cost scenario of $34 per dry ton. Based on an oil price of $111 per barrel, the model assumed harvest and maintenance costs have mean (likeliest) values of $44.20 ($47.20), $37.20 ($39.20), $46.20 ($49.20), $33.20 ($34.20), and $27.20 for stover, switchgrass, Miscanthus, wheat straw, and
______________
1 For parameters with an assumed skewed distribution in Monte Carlo analysis, the “likeliest” value denotes the value with the highest probability density.
2 Harvest and maintenance costs were updated using USDA-NASS agricultural fuel, machinery, and labor prices from 1999-2007 (USDA-NASS, 2007a,b).
3 Based on a conversion rate of 0.59 dry tons per green tons.
4 Northeast includes Pennsylvania, New Jersey, New York, Connecticut, Massachusetts, Rhode Island, Vermont, New Hampshire, and Maine. South refers to Delaware, Maryland, West Virginia, Virginia, North Carolina, South Carolina, Kentucky, Tennessee, Florida, Georgia, Alabama, Mississippi, Louisiana, Arksansas, Texas, and Oklahoma. States in the North region are Minnesota, Wisconsin, Michigan, Iowa, Missouri, Illinois, Indiana, and Ohio. West includes South Dakota, Wyoming, Colorado, New Mexico, Arizona, Utah, Montana, Idaho, Washington, Oregon, Nevada, and California.
woody biomass. Alfalfa was assumed to be harvested once during the first year and three times during the second year at a cost of $55 per acre per harvest. In addition to harvest costs, suppliers of short-rotation woody crops (SRWC) incur a stumpage fee (SF) with an assumed mean value of $20 per ton. Energy costs affect the cost of harvest through the price of diesel. The relationship between diesel and oil prices was derived using data from 1988-2008. Harvest costs increase by approximately $2.70 per ton at the high oil price and decreases by around $2.00 per ton at the low oil price.
Transportation Costs (DVC, DFC, and D)
Previous research on transportation of biomass has provided two distinct types of cost estimates: (1) total transportation cost and (2) breakdown of variable and fixed transportation costs. Research estimates for total corn stover transportation costs range between $3 per ton and $32 per ton (Aden et al., 2002; Perlack and Turhollow, 2002; Atchison and Hettenhaus, 2003; English et al., 2006; Hess et al., 2007; Perlack, 2007; Brechbill and Tyner, 2008a; Mapemba et al., 2008; Vadas et al., 2008). Total switchgrass and Miscanthus transportation costs have been estimated between $14 and $36 per ton (Tiffany et al., 2006; Kumar and Sokhansanj, 2007; Mapemba et al., 2007; Brechbill and Tyner, 2008a; Duffy, 2008; Khanna et al., 2008; Mapemba et al., 2008; Perrin et al., 2008; Vadas et al., 2008), adjusted to 2007 costs.5 Woody biomass transportation costs are expected to range between $11 and $30 per dry ton (Summit Ridge Investments, 2007; Sohngen et al., 2010). Based on the second method, distance variable cost (DVC) estimates range between $0.09 and $0.60 per ton per mile (Kaylen et al., 2000; Kumar et al., 2003; USFS, 2003; Kumar et al., 2005; USFS, 2005; Searcy et al., 2007; Brechbill and Tyner, 2008a,b; Petrolia, 2008; Huang et al., 2009; Jenkins et al., 2009; Sohngen et al., 2010), while distance fixed cost (DFC) estimates range between $4.80 and $9.80 per ton (Kumar et al., 2003, 2005; Searcy et al., 2007; Petrolia, 2008; Huang et al., 2009), depending on feedstock type. The BioBreak model utilized the latter method of separating fixed and variable transportation costs.
The DFC for corn stover, switchgrass, Miscanthus, wheat straw, and second-year alfalfa was assumed to range from $5 to $12 per ton with a mean value of $8.50 per ton. Besides loading and unloading costs, woody biomass requires an on-site chipping fee. Therefore, the DFC for woody biomass was assumed to have a mean value of $10 per ton. The DVC was assumed to follow a skewed distribution to account for future technological progress in transportation of biomass with a mean (likeliest) value of $0.38 ($0.41) per ton per mile for stover, switchgrass, Miscanthus, wheat straw, and second-year alfalfa and $0.53 ($0.56) per ton per mile for woody biomass. Energy costs affect the DVC through the price of diesel. The 1988-2008 relationship between diesel and oil prices was used to adjust DVC to each oil price scenario. The DVC increases by approximately $0.07 per ton per mile at the high oil price ($191 per barrel) and decreases by approximately $0.05 per ton per mile at the low oil price ($52 per barrel).
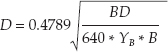
One-way transportation distance (D) has been evaluated up to around 140 miles for woody biomass (USFS, 2003, 2005; Miller and Bender, 2008; Spelter and Toth, 2009) and between 5 and 75 miles (Perlack and Turhollow, 2002, 2003; Atchison and Hettenhaus, 2003; English et al., 2006; Tiffany et al., 2006; Mapemba et al., 2007, 2008; BRDI, 2008; Brechbill and Tyner, 2008a,b; Khanna, 2008; Taheripour and Tyner, 2008; Vadas et al., 2008) for all other feedstocks. In the model, the average hauling distance was calculated using the formulation by French (1960) for a circular supply area with a square road grid provided in Equation (3)
______________
5 Transportation costs were updated using USDA-NASS agricultural fuel prices from 1999-2007 (USDA-NASS, 2007a,b).
below. 6 Average distance (D) is a function of the annual biorefinery biomass demand (BD), annual biomass yield (YB) and biomass density (B).
Annual biomass demand was assumed to be consistent with the biorefinery outlined for capital and operating cost distributions (772,000 tons per year). Biomass density was assumed to follow a normal distribution with a mean value of 0.20 for all feedstocks except alfalfa, which has a mean biomass density of 0.15 (McCarl et al., 2000; Perlack and Turhollow, 2002; Popp and Hogan Jr., 2007; Brechbill and Tyner, 2008a,b; Petrolia, 2008; Huang et al., 2009).7
Storage Costs (CS)
Due to the low density of biomass compared to traditional cash crops such as corn and soybean, biomass storage costs (CS) can vary greatly depending on the feedstock type, harvest technique, and type of storage area. Adjusted for 2007 costs, biomass storage estimates ranged between $2 and $23 per ton. For simulation, BioBreak assumed storage costs follow a skewed distribution for all feedstocks to allow for advancement in storage and densification techniques. The mean (likeliest) cost for woody biomass storage was $11.50 ($12) per ton, while corn stover, switchgrass, Miscanthus, wheat straw, and alfalfa storage costs were assumed to have mean (likeliest) values of $10.50 ($11) per ton.
Establishment and Seeding Costs (CES)
Corn stover, wheat straw, and forest residue suppliers were assumed to not incur establishment and seeding costs (CES), while all other feedstock suppliers must be compensated for their establishment and seeding costs. Costs vary by initial cost, stand length, years to maturity, and interest rate. Stand length for switchgrass ranges between 10 and 20 years with full yield maturity by the third year. Miscanthus stand length ranges from 10 to 25 years with full maturity between the second and fifth year. Interest rates used for amortization of establishment costs range between 4 and 8 percent. Amortized cost estimates for switchgrass establishment and seeding, adjusted to 2007 costs, are between $30 and $200 per acre. Miscanthus establishment and seeding cost estimates vary widely, based on the assumed level of technology and rhizome costs. James et al. (2010) reported a total rhizome cost (not including equipment and labor) of $8,194 per acre as representative of current costs and $227.61 per acre for a projected cost estimate after technological advancement (2008$). Lewandowski et al. (2003) provided a cost range of $1,206-$2,413 per acre (not updated). Jain et al. (2010) pointed out the benefit of using rhizomes over plugs where the total cost of establishment of rhizomes is about $1,200 per acre in Illinois and $1,215-$1,620 per acre for plugs. Establishment costs for wood also vary by species and location. Cubbage et al. (2010) reported establishment costs of $386-$430 and $520 per acre for yellow pine and Douglas Fir, respectively (2008$).
______________
6 The authors’ simplifying assumption of uniform density is maintained.
7 Although the biomass density for a corn-soybean rotation is assumed to be 0.20, the value used to calculate the average hauling distance for stover from a corn-soybean rotation is 0.10 since only half of the acreage is in corn at any given point in time.
Given research estimates, switchgrass establishment and seeding costs were based on a $250 per acre cost, amortized over 10 years at 10 percent to yield a mean value of $40 per acre in all regions. Miscanthus was assumed to have a mean value of $150 per acre per year mean establishment costs based on a total cost of $1,250 per acre amortized over 20 years at 10 percent. Establishment of alfalfa was assumed fixed at $165 per acre, including fertilizer application. Finally, SRWC were assumed to cost $400 per acre to establish and amortized over 15 years at 10 percent to yield a mean value of $52 per acre per year.
Opportunity Costs (COpp)
To provide a complete economic model, the opportunity costs of utilizing biomass for ethanol production were included in BioBreak. Research estimates for the opportunity cost of switchgrass and Miscanthus ranged between $70 and $318 per acre (Khanna and Dhungana, 2007; Brechbill and Tyner, 2008a; Khanna et al., 2008; Jain et al., 2010), while estimates for nonspecific biomass opportunity cost ranged between $10 and $76 per acre (Khanna et al., 2008; Mapemba et al., 2008), depending on the harvest restrictions under the Conservation Reserve Program contracts. Opportunity cost of woody biomass was estimated to range between $0 and $30 per ton (USFS, 2003, 2005; Summit Ridge Investments, 2007).
The corn stover harvest activity was developed for a corn-soybean rotation alternative and has no opportunity cost beyond the nutrient replacement cost. A continuous corn alternative, used by 10-20 percent of Corn Belt producers, was developed for corn stover harvest but not included in the BioBreak results presented in this report. The continuous corn production budgets, developed by state extension specialists, are always less profitable than corn-soybean rotation budgets with or without stover harvest. Continuous corn has an associated yield penalty or forgone profit (opportunity costs) relative to the corn-soybean rotation that occurs irrespective of stover harvest. Thus, a comparative analysis of stover harvest with corn-soybean and continuous corn may be misinterpreted.8
Given the research estimates for perennial grass opportunity cost, switchgrass, and Miscanthus grown on Midwest land were assumed to have mean opportunity costs of $150 per acre on high-quality and $100 per acre on low-quality land. Perennial grasses grown in the Appalachian and South-Central regions were assumed to have lower mean opportunity costs of $75 and $50 per acre. Wheat straw opportunity cost was assumed to follow a distribution with likeliest value of $0 per acre with a range of –$10 to $30 per acre. Negative values for the opportunity costs of wheat straw were based on the potential nuisance cost of wheat straw. Occasionally, straw is burned at harvest to avoid grain planting problems during the following crop season. Forest residue was assumed to have no value in an alternative use and therefore no opportunity cost, and the stumpage fee was assumed to account for the opportunity cost of SRWC. Finally, alfalfa is assumed to have a 2-year stand with first-year harvest sold for hay at a value of $140 per ton while second-year alfalfa was assumed to have 50-percent leaf mass sold for protein value at $160 per ton and the remaining 50 percent used as a biofuel feedstock. Alfalfa opportunity cost (that is, land cost) was assumed fixed at $175 per acre for both years.
______________
8 From the rotation calculator provided by the Iowa State University extension services with a corn price of $4 per bushel, a soybean price of $10 per bushel, and a yield penalty of 7 bushels per acre, the lost net returns to switching from a corn-soybean rotation to continuous corn is about $62 per acre (http:/www.extension.iastate.edu/agdm/crops/html/al-20.html). Previous literature that has attributed an opportunity cost to stover based on lost profits from switching from a corn-soybean rotation to continuous corn production has assumed an opportunity cost between $22 and $140 per acre (Khanna and Dhungana, 2007; Duffy, 2010).
Biomass Yield (YB)
The final parameter in the BioBreak model is biomass yield per acre of land. Biomass yield is variable in the near and distant future due to technological advancements and environmental uncertainties. Corn-stover yield per acre will vary based on the amount of corn stover that is removable, which depends on soil quality and other topographical characteristics. Harvested corn-stover yield has been estimated between 0.7 to 3.8 tons per acre (Duffy and Nanhou, 2002; Lang, 2002; Perlack and Turhollow, 2002; Sokhansanj and Turhollow, 2002; Atchison and Hettenhaus, 2003; Quick, 2003; Schechinger and Hettenhaus, 2004; Edwards, 2007; Khanna and Dhungana, 2007; Prewitt et al., 2007; BRDI, 2008; Brechbill and Tyner, 2008a; Khanna, 2008; Vadas et al., 2008; Huang et al., 2009; Chen et al., 2010). Potential switchgrass yields range between 0.89 and 17.8 tons per acre (Reynolds et al., 2000; Muir et al., 2001; Bouton, 2002; Kszos et al., 2002; McLaughlin et al., 2002; Taliaferro, 2002; Vogel et al., 2002; Lewandowski et al., 2003; Ocumpaugh et al., 2003; Parrish et al., 2003; Heaton et al., 2004b; Berdahl et al., 2005; Cassida et al., 2005; Kiniry et al., 2005; McLaughlin and Kszos, 2005; Thomason et al., 2005; Comis, 2006; Fike et al., 2006a,b; Nelson et al., 2006; Schmer et al., 2006; Shinners et al., 2006; Tiffany et al., 2006; Gibson and Barnhart, 2007; Khanna and Dhungana, 2007; Popp and Hogan, 2007; BRDI, 2008; Brechbill and Tyner, 2008a; Duffy, 2008; Khanna, 2008; Khanna et al., 2008; Perrin et al., 2008; Sanderson, 2008; Vadas et al., 2008; Walsh, 2008; Huang et al., 2009; Chen et al., 2010; Jain et al., 2010), depending on region, land quality, switchgrass variety, field versus plot trial studies, and harvest technique. On average, Miscanthus has significantly higher yield estimates that range between 3.4 and 19.6 tons per acre when yield estimates from both the United States and the European Union are considered (Lewandowski et al., 2000; Clifton-Brown et al., 2001, 2004; Kahle et al., 2001; Clifton-Brown and Lewandowski, 2002; Vargas et al., 2002; Heaton et al., 2004a,b; Khanna and Dhungana, 2007; Stampfl et al., 2007; Christian et al., 2008; Khanna, 2008; Khanna et al., 2008; Smeets et al., 2009). Estimated U.S. Miscanthus yields range between 9 and 28 tons per acre (Heaton et al., 2004a,b; Khanna and Dhungana, 2007; Khanna, 2008; Khanna et al., 2008; Chen et al., 2010; Jain et al., 2010). A wheat straw yield of 1 ton per acre was assumed by the Biomass Research and Development Initiative study (BRDI, 2008). For woody biomass, Huang et al. (2009) estimated Aspen wood yield of 0.446 dry tons per acre from a densely forested area in Minnesota, while the BRDI (2008) study assumed short-rotation woody crops yield 5 to 12 tons per acre. Using USDA Forest Service data for Mississippi, the average removal rate of wood residue in 2006 was around 1.1 tons per acre.9 In a recent study on 2008 wood production costs, Cubbage et al. (2010) estimated an annual yield of 3.6 and 4.3 tons per acre in North Carolina and the Southern United States, respectively. In the same analysis, Douglas Fir was estimated to provide 4 and 5.1 tons per acre annually in Oregon and North Carolina, respectively.
For simulation, the mean yield of corn stover was approximately 2 tons per acre. Switchgrass grown in the Midwest was assumed to have a distribution with a mean (likeliest) value around 4 (3.4) tons per acre on high quality land and 3.1 tons per acre on low quality land.10Miscanthus grown in the Midwest was assumed to have a mean (likeliest) value of 8.6 (8) tons per acre on high quality land and 7.1 (6) tons per acre on low quality land.11 Switchgrass grown in the South-Central region has a higher mean yield of about 5.7 tons per acre. For the regions analyzed, the Appalachian region provides the best climatic
______________
9 This value is a lower bound because forestry still had positive net growth over this period.
10 Plot trials were evaluated at 80 percent of their estimated yield.
11 This is a significantly lower assumed yield than previous research has assumed or simulated (Khanna and Dhungana, 2007; Khanna et al., 2008; Khanna, 2008; Heaton et al., 2004).
conditions for switchgrass and Miscanthus with assumed mean (likeliest) yields of 6 (5) and 8.8 (8) tons per acre, respectively. Wheat straw, forest residues, and SRWC were assumed to be normally distributed with mean yields of 1, 0.5, and 5 tons per acre. First-year alfalfa yield was fixed at 1.25 tons per acre (sold for hay value), while second-year yield was fixed at 4 tons per acre (50-percent leaf mass sold for protein value), resulting in 2 tons per acre of alfalfa for biomass feedstock during the second year.
Biomass Supplier Government Incentives (G)
For biomass supplier government incentives (G), the dollar for dollar matching payments provided in the Food, Conservation, and Energy Act of 2008 (that is, the 2008 Farm Bill) up to $45 per ton of feedstock for collection, harvest, storage, and transportation is used, and it is denoted as “CHST.” The CHST payment was considered in the sensitivity analysis rather than the baseline scenario since the payment is a temporary (2-year) program and might not be considered in the supplier’s long-run analysis. Although the BioBreak model is flexible enough to account for any additional biomass supply incentives, the establishment assistance program outlined in the 2008 Farm Bill is not considered because the implementation details were not finalized at the time of the model run.
REFERENCES
Aden, A., M. Ruth, K. Ibsen, J. Jechura, K. Neeves, J. Sheehan, B. Wallace, L. Montague, A. Slayton, and J. Lukas. 2002. Lignocellulosic Biomass to Ethanol Process Design and Economics Utilizing Co-Current Dilute Acid Prehydrolysis and Enzymatic Hydrolysis for Corn Stover. Golden, CO: National Renewable Energy Laboratory.
Atchison, J.E., and J.R. Hettenhaus. 2003. Innovative Methods for Corn Stover Collecting, Handling, Storing and Transporting. Golden, CO: National Renewable Energy Laboratory.
Berdahl, J.D., A.B. Frank, J.M. Krupinsky, P.M. Carr, J.D. Hanson, and H.A. Johnson. 2005. Biomass yield, phenology, and survival of diverse switchgrass cultivars and experimental strains in Western North Dakota. Agronomy Journal 97(2):549-555.
Bouton, J.H. 2002. Bioenergy Crop Breeding and Production Research in the Southeast: Final Report for 1996 to 2001. Oak Ridge, TN: Oak Ridge National Laboratory.
BRDI (Biomass Research and Development Initiative). 2008. Increasing Feedstock Production for Biofuels: Economic Drivers, Environmental Implications, and the Role of Research. Washington, DC: The Biomass Research and Development Board.
Brechbill, S.C., and W.E. Tyner. 2008a. The Economics of Biomass Collection, Transportation, and Supply to Indiana Cellulosic and Electric Utility Facilities. West Lafayette, IN: Purdue University.
Brechbill, S.C., and W.E. Tyner. 2008b. The Economics of Renewable Energy: Corn Stover and Switchgrass. West Lafayette, IN: Purdue University.
Cassida, K.A., J.P. Muir, M.A. Hussey, J.C. Read, B.C. Venuto, and W.R. Ocumpaugh. 2005. Biomass yield and stand characteristics of switchgrass in South Central U.S. environments. Crop Science 45(2):673-681.
Chen, X., H. Huang, M. Khanna, and H. Onal. 2010. Meeting the mandate for biofuels: Implications for land use and food and fuel prices. Paper read at the AAEA, CAES, and WAEA Joint Annual Meeting, July 25-27, Denver, CO.
Christian, D.G., A.B. Riche, and N.E. Yates. 2008. Growth, yield and mineral content of Miscanthus × giganteus grown as a biofuel for 14 successive harvests. Industrial Crops and Products 28(3):320-327.
Clifton-Brown, J.C., and I. Lewandowski. 2002. Screening Miscanthus genotypes in field trials to optimise biomass yield and quality in southern Germany. European Journal of Agronomy 16(2):97-110.
Clifton-Brown, J.C., S.P. Long, and U. Jørgensen. 2001. Miscanthus Productivity. Pp. 46-67 in Miscanthus for Energy and Fibre, M.B. Jones and M. Walsh, eds. London: James & James.
Clifton-Brown, J.C., P.F. Stampfl, and M.B. Jones. 2004. Miscanthus biomass production for energy in Europe and its potential contribution to decreasing fossil fuel carbon emissions. Global Change Biology 10(4):509-518.
Comis, D. 2006. Switching to switchgrass makes sense. Agricultural Research 54(7):19.
Cubbage, F., S. Koesbandana, P. Mac Donagh, R. Rubilar, G. Balmelli, V.M. Olmos, R. De La Torre, M. Murara, V.A. Hoeflich, H. Kotze, R. Gonzalez, O. Carrero, G. Frey, T. Adams, J. Turner, R. Lord, J. Huang, C. MacIntyre, K. McGinley, R. Abt, and R. Phillips. 2010. Global timber investments, wood costs, regulation, and risk. Biomass and Bioenergy 34(12):1667-1678.
Duffy, M.D. 2008. Estimated Costs for Production, Storage and Transportation of Switchgrass. Ames: Iowa State University.
Duffy, M.D., and V.Y. Nanhou. 2002. Costs of Producing Switchgrass for Biomass in Southern Iowa. Pp. 267-275 in Trends in New Crops and New Uses, J. Janick and A. Whipkey, eds. Alexandria, VA: ASHS Press.
Edwards, W. 2007. Estimating a value for corn stover. Ag Decision Maker (A1-70):4.
English, B.C., D.G. De La Torre Ugarte, K. Jensen, C. Hellwinckel, J. Menard, B. Wilson, R. Roberts, and M. Walsh. 2006. 25% Renewable Energy for the United States By 2025: Agricultural and Economic Impacts. Knoxville: University of Tennessee.
Fight, R.D., B.R. Hartsough, and P. Noordijk. 2006. Users Guide for FRCS: Fuel Reduction Cost Simulator Software. Portland, OR: U.S. Department of Agriculture - Forest Service - Pacific Northwest Research Station.
Fike, J.H., D.J. Parrish, D.D. Wolf, J.A. Balasko, J.J.T. Green, M. Rasnake, and J.H. Reynolds. 2006a. Long-term yield potential of switchgrass-for-biofuel systems. Biomass and Bioenergy 30(3):198-206.
Fike, J.H., D.J. Parrish, D.D. Wolf, J.A. Balasko, J.T. Green Jr., M. Rasnake, and J.H. Reynolds. 2006b. Switchgrass production for the upper southeastern USA: Influence of cultivar and cutting frequency on biomass yields. Biomass and Bioenergy 30(3):207-213.
French, B.C. 1960. Some considerations in estimating assembly cost functions for agricultural processing operations. Journal of Farm Economics 42(4):767-778
Gibson, L., and S. Barnhart. 2007. Switchgrass. AG 0200. Ames: Iowa State University.
Heaton, E.A., S.P. Long, T.B. Voigt, M.B. Jones, and J. Clifton-Brown. 2004a. Miscanthus for renewable energy generation: European Union experience and projections for Illinois. Mitigation and Adaptation Strategies for Global Change 9(4):433-451.
Heaton, E.A., T.B. Voigt, and S.P. Long. 2004b. A quantitative review comparing the yields of two candidate C4 perennial biomass crops in relation to nitrogen, temperature and water. Biomass and Bioenergy 27(1):21-30.
Hess, J.R., C.T. Wright, and K.L. Kenney. 2007. Cellulosic biomass feedstocks and logistics for ethanol production. Biofuels, Bioproducts and Biorefining 1(3):181-190.
Huang, H.-J., S. Ramaswamy, W. Al-Dajani, U. Tschirner, and R.A. Cairncross. 2009. Effect of biomass species and plant size on cellulosic ethanol: A comparative process and economic analysis. Biomass and Bioenergy 33(2):234-246.
Jain, A.K., M. Khanna, M. Erickson, and H. Huang. 2010. An integrated biogeochemical and economic analysis of bioenergy crops in the midwestern United States. Global Change Biology Bioenergy 2(5):217-234.
James, L.K., S.M. Swinton, and K.D. Thelen. 2010. Profitability analysis of cellulosic energy crops compared with corn. Agronomy Journal 102(2):675-687.
Jenkins, B.M., R.B. Williams, N. Parker, P. Tittmann, Q. Hart, M.C. Gildart, S. Kaffka, B.R. Hartsough, and P. Dempster. 2009. Sustainable use of California biomass resources can help meet state and national bioenergy targets. California Agriculture 63(4):168-177.
Kahle, P., S. Beuch, B. Boelcke, P. Leinweber, and H.-R. Schulten. 2001. Cropping of Miscanthus in Central Europe: Biomass production and influence on nutrients and soil organic matter. European Journal of Agronomy 15(3):171-184.
Kaylen, M., D.L. Van Dyne, Y.-S. Choi, and M. Blase. 2000. Economic feasibility of producing ethanol from lignocellulosic feedstocks. Bioresource Technology 72(1):19-32.
Khanna, M. 2008. Cellulosic biofuels: Are they economically viable and environmentally sustainable? Choices 23(3):16-23.
Khanna, M., and B. Dhungana. 2007. Economics of Alternative Feedstocks. Pp. 129-146 in Corn-Based Ethanol in Illinois and the U.S.: A Report from the Department of Agricultural and Consumer Economics, University of Illinois. Urbana-Champaign: University of Illinois.
Khanna, M., B. Dhungana, and J. Clifton-Brown. 2008. Costs of producing Miscanthus and switchgrass for bioenergy in Illinois. Biomass and Bioenergy 32(6):482-493.
Kiniry, J.R., K.A. Cassida, M.A. Hussey, J.P. Muir, W.R. Ocumpaugh, J.C. Read, R.L. Reed, M.A. Sanderson, B.C. Venuto, and J.R. Williams. 2005. Switchgrass simulation by the ALMANAC model at diverse sites in the southern U.S. Biomass and Bioenergy 29(6):419-425.
Kszos, L.A., S.B. McLaughlin, and M. Walsh. 2002. Bioenergy from switchgrass: Reducing production costs by improving yield and optimizing crop management. Paper read at the Biomass Research and Development Board’s Bioenergy 2002—Bioenergy for the Environment conference, September 22-27, Boise, ID.
Kumar, A., and S. Sokhansanj. 2007. Switchgrass (Panicum vigratum, L.) delivery to a biorefinery using integrated biomass supply analysis and logistics (IBSAL) model. Bioresource Technology 98(5):1033-1044.
Kumar, A., J.B. Cameron, and P.C. Flynn. 2003. Biomass power cost and optimum plant size in western Canada. Biomass and Bioenergy 24(6):445-464.
Kumar, A., J.B. Cameron, and P.C. Flynn. 2005. Pipeline transport and simultaneous saccharification of corn stover. Bioresource Technology 96(7):819-829.
Lang, B. 2002. Estimating the Nutrient Value in Corn and Soybean Stover. Decorah: Iowa State University.
Lewandowski, I., J.C. Clifton-Brown, J.M.O. Scurlock, and W. Huisman. 2000. Miscanthus: European experience with a novel energy crop. Biomass and Bioenergy 19(4):209-227.
Lewandowski, I., J.M.O. Scurlock, E. Lindvall, and M. Christou. 2003. The development and current status of perennial rhizomatous grasses as energy crops in the U.S. and Europe. Biomass and Bioenergy 25(4):335-361.
Mapemba, L.D., F.M. Epplin, C.M. Taliaferro, and R.L. Huhnke. 2007. Biorefinery feedstock production on conservation reserve program land. Review of Agricultural Economics 29(2):227-246.
Mapemba, L.D., F.M. Epplin, R.L. Huhnke, and C.M. Taliaferro. 2008. Herbaceous plant biomass harvest and delivery cost with harvest segmented by month and number of harvest machines endogenously determined. Biomass and Bioenergy 32(11):1016-1027.
McAloon, A., F. Taylor, W. Yee, K. Ibsen, and R. Wooley. 2000. Determining the Cost of Producing Ethanol from Corn Starch and Lignocellulosic Feedstocks. Golden, CO: National Renewable Energy Laboratory.
McCarl, B.A., D.M. Adams, R.J. Alig, and J.T. Chmelik. 2000. Competitiveness of biomass-fueled electrical power plants. Annals of Operations Research 94(1):37-55.
McLaughlin, S.B., and L.A. Kszos. 2005. Development of switchgrass (Panicum virgatum) as a bioenergy feedstock in the United States. Biomass and Bioenergy 28(6):515-535.
McLaughlin, S.B., D.G. de la Torre Ugarte, C.T. Garten, L.R. Lynd, M.A. Sanderson, V.R. Tolbert, and D.D. Wolf. 2002. High-value renewable energy from prairie grasses. Environmental Science & Technology 36(10):2122-2129.
Miller, R.O., and B.A. Bender. 2008. Growth and yield of poplar and willow hybrids in the central Upper Peninsula of Michigan. Proceedings of the Short Rotation Crops International Conference: Biofuels, Bioenergy, and Biproducts from Sustainable Agricultural and Forest Crops.
Muir, J.P., M.A. Sanderson, W.R. Ocumpaugh, R.M. Jones, and R.L. Reed. 2001. Biomass production of “Alamo” switchgrass in response to nitrogen, phosphorus, and row spacing. Agronomy Journal 93(4):896-901.
Nelson, R.G., J.C. Ascough II, and M.R. Langemeier. 2006. Environmental and economic analysis of switchgrass production for water quality improvement in northeast Kansas. Journal of Environmental Management 79(4):336-347.
Ocumpaugh, W., M. Hussey, J. Read, J. Muir, F. Hons, G. Evers, K. Cassida, B. Venuto, J. Grichar, and C. Tischler. 2003. Evaluation of Switchgrass Cultivars and Cultural Methods for Biomass Production in the South Central U.S.: Consolidated Report 2002. Oak Ridge, TN: Oak Ridge National Laboratory.
Parrish, D.J., D.D. Wolf, J.H. Fike, and W.L. Daniels. 2003. Switchgrass as a Biofuels Crop for the Upper Southeast: Variety Trials and Cultural Improvements: Final Report for 1997 to 2001. Oak Ridge, TN: Oak Ridge National Laboratory.
Perlack, R.D. 2007. Overview of Plant Feedstock Production for Biofuel: Current Technologies and Challenges, and Potential for Improvement. Presentation to the Panel on Alternative Liquid Transportation Fuels, November 19.
Perlack, R.D., and A.F. Turhollow. 2002. Assessment of Options for the Collection, Handling, and Transport of Corn Stover. Oak Ridge, TN: Oak Ridge National Laboratory.
Perlack, R.D., and A.F. Turhollow. 2003. Feedstock cost analysis of corn stover residues for further processing. Energy 28(14):1395-1403.
Perrin, R.K., K. Vogel, M. Schmer, and R. Mitchell. 2008. Farm-scale production cost of switchgrass for biomass. BioEnergy Research 1(1):91-97.
Petrolia, D.R. 2008. The economics of harvesting and transporting corn stover for conversion to fuel ethanol: A case study for Minnesota. Biomass and Bioenergy 32(7):603-612.
Popp, M., and R. Hogan, Jr. 2007. Assessment of two alternative switchgrass harvest and transport methods. Paper read at the Farm Foundation Conference, April 12-13, St. Louis, MO.
Prewitt, R.M., M.D. Montross, S.A. Shearer, T.S. Stombaugh, S.F. Higgins, S.G. McNeill, and S. Sokhansanj. 2007. Corn stover availability and collection efficiency using typical hay equipment. Transactions of the ASABE 50(3):705-711.
Quick, G.R. 2003. Single-pass corn and stover harvesters: Development and performance. Proceedings of the American Society of Agricultural and Biological Engineers’ International Conference on Crop Harvesting and Processing. St. Joseph, MI: American Society of Agricultural and Biological Engineers.
Reynolds, J.H., C.L. Walker, and M.J. Kirchner. 2000. Nitrogen removal in switchgrass biomass under two harvest systems. Biomass and Bioenergy 19(5):281-286.
Sanderson, M.A. 2008. Upland switchgrass yield, nutritive value, and soil carbon changes under grazing and clipping. Agronomy Journal 100(3):510-516.
Schechinger, T.M., and J. Hettenhaus. 2004. Corn Stover Harvesting: Grower, Custom Operator, and Processor Issues and Answers: Report on Corn Stover Harvest Experiences in Iowa and Wisconsin for the 1997-98 and 1998-99 Crop Years. Oak Ridge, TN: Oak Ridge National Laboratory.
Schmer, M.R., K.P. Vogel, R.B. Mitchell, L.E. Moser, K.M. Eskridge, and R.K. Perrin. 2006. Establishment stand thresholds for switchgrass grown as a bioenergy crop. Crop Science 46(1):157-161.
Searcy, E., P. Flynn, E. Ghafoori, and A. Kumar. 2007. The relative cost of biomass energy transport. Applied Biochemistry and Biotechnology 137-140(1):639-652.
Shinners, K.J., G.C. Boettcher, R.E. Muck, P.J. Weimer, and M.D. Casler. 2006. Drying, harvesting and storage characteristics of perennial grasses as biomass feedstocks. Paper read at the 2006 American Society of Agricultural and Biological Engineers Annual Meeting, July 9-12, Portland, OR.
Smeets, E.M.W., I.M. Lewandowski, and A.P.C. Faaij. 2009. The economical and environmental performance of Miscanthus and switchgrass production and supply chains in a European setting. Renewable & Sustainable Energy Reviews 13(6-7):1230-1245.
Sohngen, B., J. Anderson, S. Petrova, and K. Goslee. 2010. Alder Springs Biomass Removal Economic Analysis. Arlington VA: Winrock International and U.S. Department of Agriculture - Forest Service.
Sokhansanj, S., and A.F. Turhollow. 2002. Baseline cost for corn stover collection. Applied Engineering in Agriculture 18(5):525-530.
Spelter, H., and D. Toth. 2009. North America’s Wood Pellet Sector. Madison, WI: U.S. Department of Agriculture, Forest Service.
Stampfl, P.F., J.C. Clifton-Brown, and M.B. Jones. 2007. European-wide GIS-based modelling system for quantifying the feedstock from Miscanthus and the potential contribution to renewable energy targets. Global Change Biology 13(11):2283-2295.
Summit Ridge Investments. 2007. Eastern Hardwood Forest Region Woody Biomass Energy Opportunity. Granville, VT: Summit Ridge Investments, LLC.
Suzuki, Y. 2006. Estimating the Cost of Transporting Corn Stalks in the Midwest. Ames: Iowa State University College of Business, Business Partnership Development.
Taheripour, F., and W.E. Tyner. 2008. Ethanol policy analysis—What have we learned so far? Choices 23(3):6-11.
Taliaferro, C.M. 2002. Breeding and Selection of New Switchgrass Varieties for Increased Biomass Production. Oak Ridge, TN: Oak Ridge National Laboratory.
Thomason, W.E., W.R. Raun, G.V. Johnson, C.M. Taliaferro, K.W. Freeman, K.J. Wynn, and R.W. Mullen. 2005. Switchgrass response to harvest frequency and time and rate of applied nitrogen. Journal of Plant Nutrition 27(7):1199-1226.
Tiffany, D.G., B. Jordan, E. Dietrich, and B. Vargo-Daggett. 2006. Energy and Chemicals from Native Grasses: Production, Transportation and Processing Technologies Considered in the Northern Great Plains. St. Paul: University of Minnesota.
USDA-NASS (U.S. Department of Agriculture - National Agricultural Statistics Service). 2007a. Agricultural Prices 2006 Summary. Washington, DC: U.S. Department of Agriculture - National Agricultural Statistics Service.
USDA-NASS (U.S. Department of Agriculture - National Agricultural Statistics Service). 2007b. Agricultural Prices December 2007. Washington, DC: U.S. Department of Agriculture - National Agricultural Statistics Service.
USFS (U.S. Department of Agriculture - Forest Service). 2003. A Strategic Assessment of Forest Biomass and Fuel Reduction Treatments in Western States. Fort Collins, CO: U.S. Department of Agriculture - Forest Service.
USFS (U.S. Department of Agriculture - Forest Service). 2005. A Strategic Assessment of Forest Biomass and Fuel Reduction Treatments in Western States. Fort Collins, CO: U.S. Department of Agriculture - Forest Service.
Vadas, P., K. Barnett, and D. Undersander. 2008. Economics and energy of ethanol production from alfalfa, corn, and switchgrass in the Upper Midwest, USA. BioEnergy Research 1(1):44-55.
Vargas, L.A., M.N. Andersen, C.R. Jensen, and U. Jørgensen. 2002. Estimation of leaf area index, light interception and biomass accumulation of Miscanthus sinensis “Goliath” from radiation measurements. Biomass and Bioenergy 22(1):1-14.
Vogel, K.P., J.J. Brejda, D.T. Walters, and D.R. Buxton. 2002. Switchgrass biomass production in the Midwest USA. Agronomy Journal 94(3):413-420.
Walsh, M. 2008. Switchgrass. Available online at http://bioweb.sungrant.org/Technical/Biomass+Resources/Agricultural+Resources/New+Crops/Herbaceous+Crops/Switchgrass/Default.htm. Accessed September 21, 2010.


