
This chapter addresses problems of indoor environmental quality associated with the thermal environment of buildings, how climate change could induce alterations in the frequency or severity of problems, and some of the means available to mitigate adverse conditions. Thermal stress is a particular threat to certain populations whose health, economic situation, or social circumstances make them vulnerable to exposure to temperature extremes or the consequences of such exposure. The text thus focuses its discussion of health effects on these vulnerable populations.
National Academies reports note that the first decade of the 21st century was 0.8°C (1.4°F) warmer than the first decade of the 20th century (NRC, 2010). Associated with that temperature rise have been observations that heat waves have become longer and more extreme and that cold spells have become shorter and milder. Because climate models suggest that those trends will continue and intensify, much of the information presented in the chapter relates to issues involving prolonged exposure to high temperature.
The climate change research that the committee relied on is summarized in Chapter 2. Studies of building ventilation—which plays a large role in determining indoor thermal conditions—are addressed in Chapter 8.
MANAGEMENT OF THE INDOOR THERMAL ENVIRONMENT
Buildings must protect occupants against extremes in outdoor temperatures. This section addresses the management of the indoor thermal envi-
ronment, focusing on amelioration of high or prolonged heat conditions. Temperature fluctuations and prolonged exposure to low temperatures may also have health consequences. Generally, warmer conditions may lower the risk of health consequences among segments of the population that have difficulty in paying for heating during winter (Curriero et al., 2002; McGeehin and Mirabelli, 2001), but it should be noted that this benefit might be offset by circumstances in which weather extremes result in the loss of power for extended periods (MMWR, 1998).
Thermal Comfort Indoors
The American Society of Heating, Refrigerating and Air-Conditioning Engineers (ASHRAE) defines human thermal comfort as “the state of mind that expresses satisfaction with the surrounding environment” (ASHRAE, 2004). Although comfort is a subjective evaluation, survival and health are affected by temperature, humidity, and individual factors (such as clothing, air speed, metabolic rate, and health) related to the generation, dissipation, and retention of body heat. In addition to outdoor temperature, humidity, and solar radiation, comfort is influenced by whether a building has air conditioning and whether occupants have control over the temperature (Nicol and Humphreys, 2002). Acclimatization plays a role; people who live in areas where high heat and humidity are common are better able to tolerate such conditions than those who do not (de Dear and Brager, 1998). And thermal comfort is influenced by radiant heat transfer from surrounding objects: people near hot or cold surfaces feel warmer or cooler independently of the air temperature (EPA, 2009b).
“Typical” indoor temperature varies by season, locale, building type, and the economic circumstances of the occupants, although commercial spaces, such as offices, are often maintained at a more consistent year-round temperature than residences. ASHRAE’s Thermal Environmental Conditions for Human Occupancy Standard 55-2004 characterizes the indoor summer comfort range1 as about 74–83°F (23–28°C) and the winter comfort range2 as about 67–79°F (19–26°C), depending on the relative humidity. ASHRAE separately defines acceptable temperature ranges for naturally ventilated spaces as a function of outdoor temperatures spanning about 50–93°F (10–34°C).
_____________________
1 More specifically, the range when occupants are dressed in clothing typically “worn when the outdoor environment is warm” (ASHRAE, 2004).
2 When occupants are dressed in clothing typically worn when the outdoor environment is cool.
Effects of Climate Change on the Indoor Thermal Environment
Little research has addressed specifically the potential effects of climate change on the indoor thermal environment. The major issues surrounding this topic and some information addressing it are outlined below.
Indoor temperature is a function of outdoor temperature, the amount of solar radiation striking the structure, building insulation and ventilation characteristics, factors that influence the ability of the structure to dissipate stored heat, intentional sources of heat (heating, ventilating, and air-conditioning [HVAC] systems), and other indoor sources of heat (artificial lighting, cooking appliances, occupant metabolic heat, and the like). Scott and Huang (2007) found that the demand for cooling energy increases by 5–20% for every 1°C (1.8°F) increase in outdoor temperature, depending on the assumptions used.3 Greater use of air conditioning for cooling implies more electricity demand, which is likely (at least in the short term) to be met through heavier use of fossil fuels, including coal, which in turn may lead to higher emissions of air pollutants, including the greenhouse gases that have been implicated in increased outdoor temperatures (IPCC, 2007). The positive feedback loop that characterizes those relationships is depicted in Figure 7-1.
The US Climate Change Science Program’s literature review concluded that “temperature increases with global warming would increase peak demand for electricity in most regions of the country” but that research results varied and were influenced by such factors as “whether the study allows for changes in the building stock and increased market penetration of air conditioning in response to warmer conditions” (Scott and Huang, 2007). Indoor relative humidity, another component of the thermal environment, is a part of the issue. In areas of the country where hot and humid outdoor conditions become more common, air-conditioning units may run longer to restore or maintain comfortable indoor humidity.
Potential increases in the magnitude and frequency of peak electricity demand due to heat waves and in the occurrence of extreme weather events have also led to concerns over power outages that could leave building occupants without sources of conditioned air. The 1995 Chicago (Changnon et al., 1996) and 1999 New York City (USGCRP, 2009) heat waves were accompanied by extended and widespread power outages. Electric-grid infrastructure disruptions after Hurricanes Katrina and Rita left some areas of the southern United States without power for weeks during the late summer of 2005.
_____________________
3 The same study found that demand for heating energy decreases by 3–15% for every 1°C (1.8°F) increase in outdoor temperature. Cooling uses electricity almost exclusively whereas heating uses various energy sources; this complicates the evaluation of the implications of these changes on overall power-generation demands.
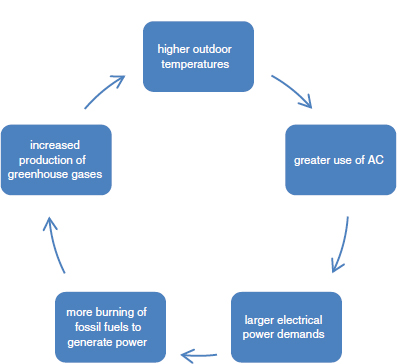
FIGURE 7-1 The relationship between outdoor temperature, air-conditioning use, electric-power demand, and greenhouse-gas generation.
Healthy people can physically adapt to changes in ambient temperature within some limits. However, when temperatures push the upper end of those limits or are combined with other factors—such as high humidity, strenuous activity, or prolonged exposure—physiologic compensation mechanisms can be overwhelmed. The National Weather Service’s (NWS’s) Heat Index—a measure of perceived temperature derived from the ambient temperature and relative humidity and based on work originally conducted by Steadman (1979)—is an imperfect but useful tool in determining potential health threats (Metzger et al., 2010). Figure 7-2 illustrates heat-index values for a range of temperature and humidity combinations and indicates the corresponding NWS health-threat level.
A 2011 review by Anderson and Bell examined the determinants of mortality in heat waves through an empirical analysis of 43 events in US cities over the years 1987–1995. Mortality increased an average of 3.74% (95% Confidence Interval [CI] 2.29–5.22%) on heat wave days versus non-heat wave days. The largest effect was observed in the Northeast and Midwest US census regions, the smallest in the South, even though the longest heat waves occurred in that region. Analyses also found that heat waves at the beginning of the warm weather months had greater mortality effects (5.04%, nationally) than those later in the season (2.65%). The investigators speculated that these results were due to behavioral and physiological acclimatization.
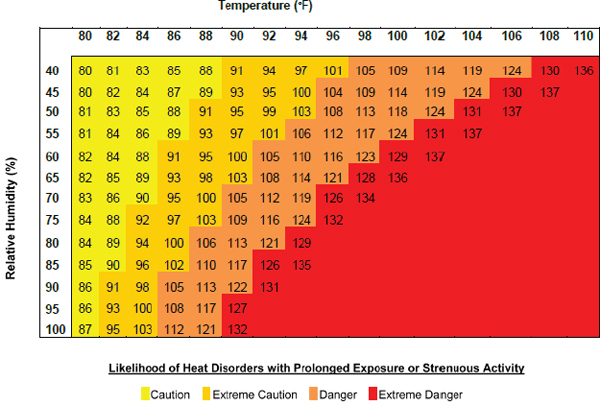
FIGURE 7-2 National Weather Service Heat-Index values and corresponding health-threat levels (NWS, 2010).
Physiologic Vulnerability to Heat Events
A number of biological factors influence the ability of people to adapt to high temperature conditions or withstand extended exposure to them. These factors are identified and discussed below.
As people age, their ability to cope with external environmental stressors decreases. That is based on both physiologic and social factors: decreased organ function, interactions between medications and heat-compensation mechanisms, overall poor health status, isolation, and decreased access to support services.
There are stark physiologic differences between younger adult and elderly populations. Decreased organ function is a major issue. The peripheral nervous system is affected by the aging process: myelin sheaths deteriorate, and myelinated and unmyelinated nerve fibers are lost. The peripheral nervous system tells the body to feel hot and cold. It also regulates internal processes, such as heart rate and contraction and expansion of blood vessels, to maintain proper blood pressure and the body’s reaction to stress. Decreased sensation may limit a person’s ability to recognize that she or he needs to take steps to decrease body temperature. Sweat produc-
tion and sweat-gland functioning, which are coping mechanisms to reduce the body’s core temperature, are also regulated by the peripheral nervous system. The number of sweat glands does not decrease with age, but sweat production does, and this makes it difficult to reduce the body’s core temperature (Verdú et al., 2000).
The overall health status of the elderly is poorer than that of other age groups. The elderly exhibit higher rates of chronic ailments, including cardiovascular diseases, diabetes, chronic obstructive pulmonary disease, diabetes, renal disease, and neoplasms (Khalaj et al., 2010; Pearlman and Uhlmann, 1988; Reid et al., 2009). Cardiovascular disease has been identified as the most important risk factor for heat stroke in the elderly (Kenney and Munca, 2003), but other chronic illnesses, such as those mentioned above, are also known to increase the risk of heat stroke (Khalaj et al., 2010).
Some medications, including over-the-counter supplements, may have adverse thermoregulatory effects. Psychotropic drugs have been associated with a higher risk of hospitalization of the elderly due to hyperthermia (Lopez and Goldoftas, 2009). Nonsteroidal anti-inflammatory drugs, such as aspirin—which is commonly taken for myocardial-infarction prevention—block prostaglandins, which aid in controlling body temperature and blood pressure (Carmichael and Shankel, 1985). Anticholinergics inhibit sweat production; younger persons also use these medications, but their sweating process is not affected, changes having been noted only in those who were about 80 years old or older (Kenney and Munca, 2003). Other medications, such as diuretics, limit cutaneous vasodilation and pose a high risk of dehydration, a particular concern during heat stress (Kenney and Munca, 2003).
Those suffering from chronic diseases are also at risk. Research indicates that obesity, hypertension, diabetes, and cardiovascular disease increase susceptibility to the effects of extreme heat.
Obesity is a recognized public-health concern. Few studies have looked specifically at obese or overweight persons and heat waves, but some information is available. Obesity was a comorbidity in the 2003 European heat wave (Vandentorren et al., 2006); this is not surprising given that fatal heat strokes occur at a rate 3.5 times higher in those who are obese or overweight than in those of normal weight (Kenny et al., 2010). That may be because of a lowered capacity of heat dissipation due to a low ratio of body surface area to body mass, which hinders sweat evaporation (Kenny et al., 2010). Adipose tissue also stores heat more efficiently than other tissues, such as muscle, and subcutaneous fat restricts conductive heat transfer (Kenny et al., 2010).
According to the Centers for Disease Control and Prevention, the prevalence of hypertension is about 30% in the United States (Fryar et al.,
2010). A study of the elderly in Baltimore, Maryland, found that 50% of those who experienced adverse heat symptoms during the summer months had a history of hypertension (Basu and Samet, 2002). Hypertension was a common comorbidity factor in those who died from heat effects during the Chicago 1995 heat wave (Dematte et al., 1998). Impairments of circulation, such as those which occur in people who have hypertension, may reduce blood flow to the dermis, and this may weaken temperature regulation by reducing heat transfer from the core to the skin (Carberry et al., 1992; Kenny et al., 2010).
Diabetes occurs in about 10% of the US population (Fryar et al., 2010), and studies have shown that those who have diabetes suffer disproportionately during extreme heat events compared with the general population (Kenny et al., 2010). Circulatory changes, such as vessel dilation and vascular reactivity, are greatly compromised in those who have diabetes (Kenny et al., 2010; Petrofsky et al., 2005; Stansberry et al., 1997). Neuropathy, which is common in diabetic people, impedes sweat responses (Fealy et al., 1989; Kenny et al., 2010). Diabetic people also may have fluid and electrolyte disturbances, which affect glucose regulation (Semenza, 1999); this was seen in a heat wave in New York and St. Louis in 1966, where those who had diabetes had increased mortality (Schuman, 1966).
Cardiovascular diseases afflict about 12% of Americans (CDC, 2010). Although there are few studies of cardiovascular disease and heat, some links have been found between increased mortality during heat waves and the presence of cardiovascular diseases (Hoffmann et al., 2008; Kenny et al. 2010; Klinenberg, 2002). Like other diseases that disrupt cardiovascular flow, cardiovascular diseases impair body-temperature regulation. Mortality in those who had cardiovascular diseases was 30% higher during the 2003 European heat wave than during other “normal” heat days (Hoffmann et al., 2008). Cardiovascular disease was prominent among the chronic diseases blamed for the excess mortality in France during the 2003 heat event (Fouillet et al., 2006; Vandentorren et al., 2006), and the same was observed during the 1995 Chicago heat wave (Klinenberg, 2002).
Economic and Social Vulnerability to Heat Events
Several studies have examined how economic and social circumstances influence vulnerability to death and disease associated with heat-wave events. Shonkoff and colleagues (2009) published a review of the literature focused on the disparate effects of climate change in California on groups of lower socioeconomic status. Heat waves in that state and others resulted in increased emergency-department visits for acute renal failure, diabetes, cardiovascular disease, electrolyte imbalance, and nephritis (Knowlton et al., 2009; Kovats and Hajat, 2008). Children 4 years old and younger and
people over 65 years old were at greatest risk. Other investigators have found that low-income black Americans are disproportionately affected (Basu and Ostro, 2008; Medina-Ramon et al., 2006; O’Neill et al., 2003). Analysis has shown that it is unlikely that this was a result of racial differences in physiology but rather a consequence of lower socioeconomic status, the physical settings that they live in, and their greater exposure to high temperatures (Basu and Ostro, 2008).
The poor are more likely to be living in homes that do not have air conditioning. According to the American Housing Survey (AHS), about half of those living below the national poverty line do not have air conditioning in their homes (USCB, 2009). The elderly may lack the financial resources to make the necessary modifications to adapt to the heat, such as installing air-conditioning units. Low socioeconomic status also has more subtle effects. Those living in lower-income areas may experience higher rates of crime. In the Chicago 1995 heat wave, some elderly people restricted ventilation in their homes by not opening windows for fear of crime (Klinenberg, 2002). Fear of crime leads people to stay in their homes, and this increases mortality in heat events (Klinenberg, 2002; Lopez and Goldoftas, 2009). People of lower socioeconomic status who have chronic health problems are disproportionately affected by medical conditions because of their lack of access to care and of the resources needed to manage their diseases effectively (Phelan et al., 2004). People of low socioeconomic status who belong to some minority groups are also less likely to have access to private transportation, so their ability to move to community sites that have air conditioning is restricted. Disparities in air-conditioning access contributed to the difference in heat-wave mortality, which was nearly twice as high in minority-group residents in Los Angeles as the average in Los Angeles (Kovats and Hajat, 2008).
Social isolation is a large factor in predicting heat morbidity, particularly among the elderly. According to the US Census Bureau, about 25% of the general population and 32% of the elderly population live alone (Klinenberg, 2002). Physical impairments and mobility restriction due to age and other limitations may prevent people—particularly those who live on upper floors—from leaving their home and reaching cooling centers set up by the community (Lopez and Goldoftas, 2009). In the 1995 Chicago heat wave, several trends due to social isolation were discovered. For example, 73% of heat-related deaths were in people over 65 years old, and those who lived alone were at additional risk for death (Klinenberg, 2002; Semenza et al., 1996); and those who did not leave their homes at least once a day and did not have access to transportation had higher mortality (Semenza et al., 1996). Similar trends were found in the 1999 Chicago heat wave (Naughton et al., 2002).
The so-called heat-island effect may also be a factor in higher heat-
related morbidity and mortality found in urban areas than in rural areas (Hajat et al., 2007; Martinez et al., 1989). It involves circumstances in which urban areas are hotter than surrounding rural areas because of the presence of large numbers of buildings, parking lots, and other infrastructure that has a great ability to store solar energy (Basu and Samet, 2002; Luber and McGeehin, 2009). It is more common in locales that have relatively few green spaces. A heat island absorbs and stores heat during the day and radiates it during the night, sustaining higher temperatures and intensifying the effects of heat waves (Luber and McGeehin, 2009). Green spaces are associated with decreased heat-related morbidity and mortality that are due to heat-island effects and the overall lack of direct shading for residents (Kilbourne et al., 1982; Reid et al., 2009; Tan et al., 2007).
Shonkoff and colleagues’ (2009) review paper describes an unpublished analysis by Morello-Frosch and Jesdale (2008), who found a positive dose–response relationship between the presence of impervious surfaces and high community poverty and a negative dose–response relationship between the amount of tree cover and the extent of community poverty in four California urban areas. That suggested the potential for a greater burden of heat-island exposure of low-income populations than of higher-income populations. The relationship was also observed by researchers in Phoenix, Arizona, who found that elderly, minority-group, and low-income residents were at the highest risk for exposure to extreme heat (Ruddell et al., 2010).
The lack of access to air conditioning thus directly influences the risk of high heat exposure and heat-related morbidity and mortality. It also plays an important role in home ventilation, which affects exposure to air pollutants and overall indoor air quality apart from temperature.
Air-Conditioning Prevalence and Use
Air conditioning has been the primary means of moderating high temperatures in buildings in the United States since the 1950s. The fraction of homes in the United States that have air conditioning has risen steadily over the past 40 years, from 46.9% of year-round units4 in 1973 to 87.4% in 2005 (Eggers and Thackeray, 2007). The type of air-conditioning unit has shifted over that time. In homes, central air-conditioning systems5 were present in 16.8% of year-round units in 1973, to 33.2% in 1985, 47.0% in 1995, and 65.4% in 2005. Only 12.6% of year-round units were without
_____________________
4 Year-round units are defined by the Census Bureau as “those intended for occupancy at any time of the year, even though they may not be in use the year round” (USCB, 2004).
5 A central air-conditioning system is one that “uses ducts to distribute cooled and/or dehumidified air to more than one room or uses pipes to distribute chilled water to heat exchangers in more than one room, and which is not plugged into an electrical convenience outlet” (266 CMR 2.00 Definitions, Massachusetts Office of Consumer Affairs & Business Regulation).
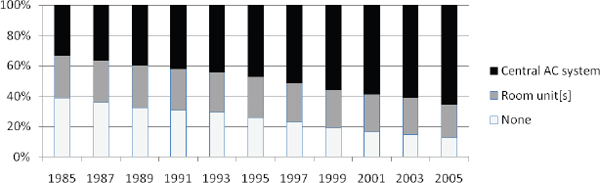
FIGURE 7-3 Percentages of year-round units in the United States with central air-conditioning systems, one or more room units, or no air conditioning, 1985–2005 (Eggers and Thackeray, 2007, derived from American Housing Survey data).
any form of air conditioning by 2005. Figure 7-3 illustrates changes in the prevalence and type of air conditioning in residences over the past 25 years.
There are substantial variations in air-conditioning system prevalence in different parts of the country. AHS data for 2005 indicate, unsurprisingly, that air-conditioning is more common in the southern and southwestern United States than elsewhere6 and in the parts of the country that typically have the most cooling degree days and the fewest heating degree days.7Figure 7-4 details those data.
The climate zone and census region that encompass California exhibit relatively lower penetration of air-conditioning units than might be expected. Many homes in California are not equipped with air conditioning, because coastal temperatures are relatively mild during summer (Basu and Ostro, 2008). The reduced use of air-conditioning equipment is also influenced by the state energy and efficiency programs that include “cool community” standards for shading (Brown and Koomey, 2003).
In addition to the increase in air-conditioning units, the hours during which air conditioning is used have increased over the years. The Depart-
_____________________
6 The southern and southwestern parts of the United States were experiencing rapid growth in new construction at this time, and this accounts in part for the greater prevalence of air conditioning.
7 Cooling degree days are used to estimate how hot the climate is and how much energy may be needed to keep buildings cool. Cooling degree days are calculated by subtracting a balance temperature from the mean daily temperature and summing only positive values over an entire year. Heating degree days are used to estimate how cold the climate is and how much energy may be needed to keep buildings warm. Heating degree days are calculated by subtracting the mean daily temperature from a balance temperature and summing only positive values over an entire year. The balance temperature used can vary but is usually set at 65°F (18°C), 68°F (20°C), or 70°F (21°C) (EPA, 2009b).
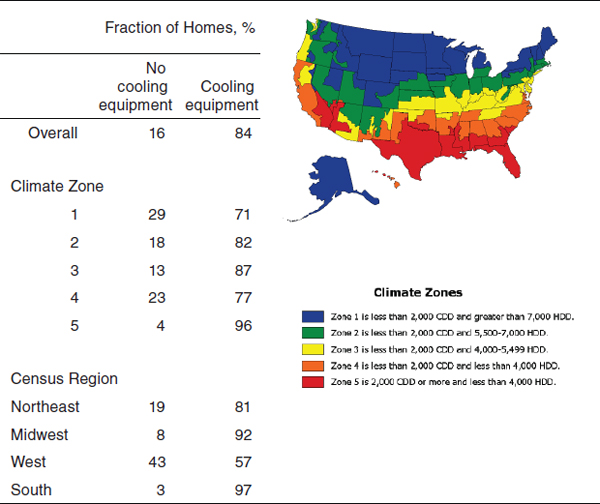
FIGURE 7-4 Percentage use of cooling equipment in US housing units by climate zone and census region, 2005 (EIA, 2010a,b for data; EIA, 2007 for figure).
NOTE: The data used in this table differ from those used to generate Figure 7-3, which were based on year-round units only.
ment of Energy’s Residential Energy Consumption Survey found that 33% of residences that had central air conditioning and 11% of residences that had window or wall units reported using an air conditioner “all summer” in 1981 (DOE, 2000). By 1997, those figures had risen to 52% and 21%, respectively (DOE, 2000), and in 2005, 61% and 30% (DOE, 2008). Collectively, 73% of residences that had any form of air conditioning reported using it either “all summer” or “quite a bit” in 2005 (DOE, 2008).
Most central air conditioners in residences have no outside air intakes, unlike the window and wall units that they sometimes supplanted. Instead, they rely on the infiltration of outdoor air through windows and doors and on loose construction. Climate change may stimulate the implementation of energy-efficiency (also called weatherization) measures that limit such infiltration and may lead to inadequate ventilation, as discussed in Chapter 8.
Most new commercial buildings have central air conditioning and mechanical ventilation (US Energy Information Administration, 2006), but the details of HVAC design and energy-use considerations vary considerably by the type (such as office and retail), size, age, and location of the structure. The presence of air conditioners in schools depends on several factors, especially geographic location. A 2005 US Department of Education survey of public-school principals found that 31% of permanent school buildings in the Northeast, 25% in the central region, 14% in the West, and 1% in the South did not have air conditioning (ED, 2007).
Epidemiologic Research on Effects of Air Conditioning on Health and Productivity
There is a small literature that examines occupant health and productivity in buildings that have air-conditioning systems vs buildings that rely on natural ventilation. Mendell and colleagues (2008) note that “the presence of central mechanical air-conditioning systems in office buildings (relative to natural ventilation) is one of the risk factors associated most consistently with increased” sick-building syndrome symptoms. In a 2004 multiple-building study of middle-aged “professional” women in France, Preziosi et al. reported that sickness absence, medical-services use (doctor visits), and hospital stays were 57%, 17%, and 35% fewer, respectively, among subjects who had natural ventilation in their workplaces than among those who had air conditioning. Hummelgaard and colleagues (2007) reported that reported building-related health symptoms were 31% fewer among occupants of nine naturally ventilated office buildings in Denmark than among occupants of mechanically ventilated offices. Sahakian et al. (2009) found that office workers who had home air conditioning were more likely to have visited a medical specialist in the previous year (prevalence ratio, 1.3; P = 0.02) than those who had naturally ventilated homes. The reasons for those outcomes are not clear and might vary by study.
A 1996 study by Aldous and colleagues found that infants exposed to home evaporative cooling systems experienced a higher risk of wheezing lower respiratory illness than those in homes without such systems (odds ratio = 1.8; 95% CI, 1.1–3.0). The authors speculated that the increased indoor humidity caused by evaporative cooling might support fungi or dust mites and associated adverse exposures. Evaporative coolers also increase the exchange of indoor with outdoor air and thus increase the levels of outdoor pollutants indoors, a concern if climate change results in higher outdoor pollutant levels.
Several potential explanations for those health outcomes have been put forward. Mendell et al. (2008) list exposures to microorganisms growing
on wet surfaces in HVAC systems (in cooling coils, drain pans, and humidifiers), chemical biocides used in some humidifier systems, and poor HVAC maintenance in general among the possibilities but note that research to test these hypotheses was lacking.
In contrast, research suggests that air conditioning may provide protection against air pollutants of outdoor origin. Bell and Dominici (2008) analyzed data on 98 urban communities derived from the National Morbidity, Mortality, and Air Pollution Study, the US Census, and the AHS. They found that an increase in households that had central air conditioning was associated with a decrease in estimates of ozone’s effect on mortality, but they cautioned that it was difficult to determine the extent to which that association was related to the presence of central air conditioning rather than something else. Bell et al. (2009) found that communities with higher percentages of households that had air conditioning had lower short-term effects of particulate matter (PM2.5) on cardiovascular hospital admissions and that the effect was greater in connection with central air conditioning than with other forms, such as window units.
A conference paper by Fisk and Seppänen (2007) summarized the results of studies of the association between temperature and productivity measures in office and school environments. They found that controlling indoor temperatures in summer and ensuring adequate ventilation rates were associated with improved work and school performance. Lan et al. (2010) drew similar conclusions in their laboratory study of performance on a variety of calculation, learning, office-support, and reasoning tasks. They cautioned, though, that the extent to which experimental studies like theirs applied to actual office environments was not clear. Cost–benefit analyses conducted by Fisk and Seppänen (2007) suggested that “measures to improve indoor temperature control and increase ventilation rates will be highly cost effective, with benefit–cost ratios as high as 80 and annual economic benefits as high as $700 per person.”
Chapter 8 summarizes the epidemiologic literature on a related issue, the health and productivity effects of ventilation.
As Chapter 2 notes, measurements of global mean temperature in recent years indicate that cold spells in the United States have become shorter and milder. Some researchers have speculated that this might result in a decrease in cold-weather mortality (Medina-Ramón and Schwartz, 2007; Patz et al., 2000) but evidence is lacking, and McGeehin and Mirabelli (2001) note that “the relationship between winter weather and mortality is difficult to interpret.” A lack of adequate heating is a concern if extreme
weather events lead to blackouts or if economic strains make fuel poverty8 more common. This may be a particular issue for elderly populations because physiological changes associated with the aging process make them more vulnerable to the effects of cold (Press, 2003).
Evidence indicates that cold weather is associated with an excess of mortality (Analitis et al., 2008; Anderson and Bell, 2009; Donaldson and Keatinge, 1997; Huynen et al., 2001; Kloner et al., 1999). Potential causes, in cases where hypothermia can be ruled out, include cardiovascular death due to higher blood pressures resulting from lower core body temperatures (Barnett, 2007; Barnett et al., 2005; Danet et al., 1999; Donaldson et al., 1997; Medina-Ramón and Schwartz, 2007; Press, 2003). An increase of plasma fibrinogen during the winter has also been found to increase instance of ischemic heart disease (Woodhouse et al., 1994). And O’Neil and colleagues (2003) found an association between cold temperatures and respiratory-disease mortality in a hierarchical model that factored geographic location and socioeconomic variables.
Cold weather is not anticipated to be a climate change issue and cold weather exposures are not further explored in this chapter. However, two other chapters of this report address issues indirectly related to climate change, cold-weather conditions and health: Chapter 4 discusses adverse exposures associated with extreme weather events, including the use of unvented space heaters, back-up electrical power generators, and biofuel stoves indoors, and Chapter 6 talks about the influence of seasonality on the availability and spread of infectious agents.
CLIMATE-CHANGE ADAPTATION AND MITIGATION MEASURES
Protection from the adverse effects of heat exposure requires the ability to lower core temperature and often involves maintaining or moving to a temperate space. Many cities, for example, have heat-emergency plans that include cooling centers where people can seek shelter. Approaches for creating or maintaining a safe thermal environment are outlined below.
Heating, Ventilating, and Air-Conditioning Approaches
Demonstration projects and research suggest that innovations in the design of mechanical systems and buildings may yield reduced HVAC-system energy use while enhancing occupant comfort, health, and productivity. They include both mature and newly developed technologies:
_____________________
8 Fuel poverty is defined as spending more than 10% of income on heating a home to an adequate level of warmth (Press, 2003)
- Mixed-mode or hybrid mechanical systems that support natural ventilation (Axley, 2001; WHO, 2009).
- Economizer-cycle HVAC (Fisk and Seppänen, 2007).
- Water-based cooling systems, including fan-coil, radiant, and induction systems (Costelloe and Finn, 2003).
- High efficiency, low-pressure–drop filtration (Fisk, 2009).
- Displacement ventilation (Schiavon, 2009).
- Passive stack and solar chimney systems (Russell et al., 2005).
- Geothermal heat exchangers (Eicker and Vorschulze, 2009).
- Earth-tube exchangers (Darkwa et al., 2011; Zmeureanu and Wu, 2007).
Mudarri’s Environmental Protection Agency white paper (2010) notes that HVAC approaches like those vary in their ease of implementation: some constitute straightforward upgrades of existing systems, and others can be achieved only through building renovation or are feasible only for new construction. The cost effectiveness of the measures is strongly linked to the price of energy.
Building-Design and Setting Approaches
Architects, builders, and city planners have several tools at their disposal for influencing the amount of heat absorbed by buildings and the amount dissipated by them. Some are ancient and of established efficacy. Traditional construction in warm climates—including the American Southwest, southern Europe, and the Middle East—has long used light, reflective colors for exteriors. Synnefa et al. (2007) estimated that increasing roof reflectivity from its current 10–20% to 60% through the use of cool-colored materials and coatings could reduce cooling-energy use by more than 20%. Models developed by Akbari and colleagues (2001) suggest that introducing additional trees and reflective or light-colored building and road surfaces to urban environments would not only lower energy use but would lessen heat-island effect. Installation of green roofs composed of soil substrate and plants (Oberndorfer, et al. 2007) and regionally and seasonally appropriate use of landscape elements and trees to block summer sunlight but permit winter solar heating have also been shown to reduce cooling and heating loads and peak energy demands (Akbari, 2002) and to lower concentrations of air pollutants (Nowak et al., 2006; Yang et al., 2008).
Building-performance simulation (BPS) tools constitute another approach to managing heat through passive, low-energy means. BPS models estimate energy and mass flows in buildings as functions of the characteristics of a building and the space around it. Reinhart et al. (2010), in a presentation before the committee, noted the utility of such simulations in
understanding how neighboring buildings may affect heating loads and local wind patterns and thus influence whether natural ventilation can be used successfully. Climate-change projections can be married to BPS models to estimate the benefits of particular building or site modifications in mitigating the effects of climate change.
Passive Survivability
Passive survivability is a term coined by Alex Wilson (2005) to describe “a building’s ability to maintain critical life-support conditions in the event of extended loss of power, heating fuel, or water, or in the event of extraordinary heat spells.” Interest in the concept may have been stimulated in part by reports of deaths in sealed buildings that were left without power in the wake of Hurricane Katrina. The elements of passive survivability include provision for natural ventilation even if a building was designed to operate with a mechanical HVAC system; resilience in the face of extreme weather; high levels of insulation and other high-performance building-envelope features; minimization of cooling loads through building geometry, landscaping, and thermal mass; passive solar heating; and natural daylight (GSA, 2010; Wilson, 2006). Santamouris et al. (2007) note that such features are especially important in low-income housing, where residents are more likely to suffer from heat stress and poor indoor environmental quality.
Passive survivability has gained currency in the General Services Administration (GSA), which manages buildings for the federal government. Testimony from its administrator in 2007 indicated that GSA was undertaking initiatives to address facility passive survivability (Doan, 2007), and its 2010 Facilities Standards for the Public Buildings Service identified it as a best-practice strategy (GSA, 2010).
Synthesis
A number of techniques for reducing the health risks and productivity costs associated with uncomfortable or unsafe indoor thermal environments are available. They include both well-established low-technology passive strategies and cutting-edge design and technology innovations. Many of the approaches identified above yield additional benefits, including lower energy use and costs (with concomitantly reduced generation of greenhouse gases) and better building ventilation, which is associated with lower incidence of respiratory and other health problems. The best passive approaches for a given building will depend on its age, location, and use and on the resources available to implement changes.
Warmer outdoor conditions and more frequent and severe weather
events will stimulate greater interest in using those techniques to mitigate effects or adapt to changing conditions. Climate change may also affect the economics of implementation as the price of energy increases and as the human and social costs of inaction become untenable.
On the basis of its review of the papers, reports, and other information presented in this chapter, the committee has reached the following conclusions regarding the health effects of alterations in indoor environmental quality due to thermal conditions:
- Thermal stress has well-documented adverse health effects, and is responsible for excess mortality among exposed persons.
- Health, economic, and social factors make certain populations particularly vulnerable to exposure to temperature extremes and to the adverse consequences of such exposure, and may limit their ability to mitigate or seek shelter from health-threatening conditions. The elderly, those in poor health, and the poor are especially at risk. Those populations experience temperature extremes almost exclusively in indoor environments.
- Air conditioning provides protection from the heat, and some types also offer protection from high concentrations of outdoor pollutants. However air conditioning is associated with higher reported prevalences of some ailments, perhaps because of contaminants in HVAC systems. No general conclusion can thus be drawn about the effect of air conditioning on adverse biologic or chemical exposures indoors.
- Little research has addressed the effects of climate change on building energy use and occupant health. Available information indicates that changing conditions may have the following effects:
- Buildings that are currently ventilated naturally will need to use some form of air conditioning.
- Buildings that have air conditioning will need to use it more often, reducing natural ventilation.
- People in buildings that do not have air conditioning will be exposed to extreme heat conditions more often.
- Many buildings in warm zones of the United States already have air conditioning. However, there is concern that peak energy demands during extreme heat events and an increased frequency of extreme weather events may result in more frequent power outages that expose large numbers of persons to potentially dangerous conditions indoors.
- Temperate indoor conditions (70–72°F or 21–22°C) are associated with higher office and school productivity than colder or warmer environments.
- Several technologies and building-design and -siting approaches can provide control of the indoor environment with lower energy costs and greater health benefits than systems typically in use today. No approach will work in all circumstances; the best strategies will depend on building use and on local and occupant circumstances.
- No matter which approach is used to maintain safe indoor environmental conditions, it is important to ensure that the conditions are sustained when failures in building systems or power outages disable mechanical ventilation—something that may happen more often if climate change leads to more instances of extreme weather conditions or unsustainable loads on the electric grid due to extreme outdoor temperatures
Akbari H, Pomerantz M, Taha H. 2001. Cool surfaces and shade trees to reduce energy use and improve air quality in urban areas. Solar Energy 70(3): 295-310.
Akbari H. 2002. Shade trees reduce building energy use and CO2 emissions from power plants. Environmental Pollution 116(1S):S119-S126.
Aldous MB, Holberg CJ, Wright AL, Martinez FD, Taussig LM, Group Health Medical Associates. 1996. Evaporative cooling and other home factors and lower respiratory tract illness during the first year of life. American Journal of Epidemiology 143(5):423-430.
Analitis A, Katsouyanni K, Biggeri A, Baccini M, Forsberg B, Bisanti L, Kirchmayer U, Ballester F, Cadum E, Goodman PG, Hois A, Sunyer J, Tjittanen P, Michelozzi P. 2008. Effects of cold weather on mortality: Results from 15 European cities within the PHEWE project. American Journal of Epidemiology 168(12):1397-408.
Anderson BG, Bell ML. 2009. Weather-related mortality: How heat, cold, and heat waves affect mortality in the United States. Epidemiology 20(2):205-213.
ASHRAE (American Society of Heating, Refrigerating and Air-Conditioning Engineers). 2004. ANSI/ASHRA Standard 55-2004: Thermal environmental conditions for human occupancy. Atlanta, GA: ASHRAE.
Axley JW. 2001. Application of natural ventilation for U.S. commercial buildings—Climate suitability design strategies & methods modeling studies. Gaithersburg, MD: National Institute of Standards and Technology.
Barnett AG, Dobson AJ, McElduff P, Salomaa V, Kuulasmaa K, Sans S. 2005. Cold periods and coronary events: An analysis of populations worldwide. Journal of Epidemiology & Community Health 59(7):551-557.
Barnett AG. 2007. Temperature and cardiovascular deaths in the US elderly: Changes over time. Epidemiology 18(3):369-372.
Basu R, Samet JM. 2002. Relation between elevated ambient temperature and mortality: A review of the epidemiologic evidence. Epidemiologic Reviews 24(2):190-202.
Basu R, Ostro BD. 2008. A multicounty analysis identifying the populations vulnerable to mortality associated with high ambient temperature in California. American Journal of Epidemiology 168(6):632-637.
Bell ML, Dominici F. 2008. Effect modification by community characteristics on the short-term effects of ozone exposure and mortality in 98 US communities. American Journal of Epidemiology 167(8):986-997.
Bell ML, Ebisu K, Peng RD, Dominici F. 2009. Adverse health effects of particulate air pollution modification by air conditioning. Epidemiology 20(5):682-686.
Brown, RE, Koomey JG. 2003. Electricity use in California: Past trends and present usage patterns. Energy Policy 31(9):849-864.
Carberry PA, Shepherd AM, Johnson JM. 1992. Resting and maximal forearm skin of blood flow are reduced in hypertension. Hypertension 20:349-355.
Carmichael J, Shankel SW. 1985. Effects of non-steroidal anti-inflammatory drugs on prostaglandins and renal function. The American Journal of Medicine (6 Pt 1):992-1000.
CDC (Centers for Disease Control and Prevention). 2010. Heart disease. http://www.cdc.gov/nchs/fastats/heart.htm (accessed January 6, 2011).
Changnon SA, Kunkel KE, Reinke BC. 1996. Impacts and responses to the 1995 heat wave: A call to action. Bulletin of the American Meteorological Society 77:1497-1506.
Costelloe B, Finn D. 2003. Indirect evaporative cooling potential in air–water systems in temperate climates. Energy and Buildings 35(6):573-591.
Curriero FC, Heiner KS, Samet JS, Zeger S, Patz JA. 2002. Temperature and mortality in eleven cities of the eastern United States. American Journal of Epidemiology 155:80-87.
Danet S, Richard F, Montaye M, Beauchant S, Lemaire B, Grauz C, Cottel D, Marécaux N, Amouyel P. 1999. Unhealthy effects of atmospheric temperature and pressure on the occurrence of myocardial infarction and coronary deaths. A 10-year survey: The Lille-World Health Organization MONICA project (Monitoring trends and determinants in cardiovascular disease). Circulation 100(1):E1-E7.
Darkwa J, Kokogiannakis G, Magadzire CL, Yuan K. 2011. Theoretical and practical evaluation of an earth-tube (E-tube) ventilation system. Energy and Buildings 43(2-3):728-736.
de Dear R, Brager GS. 1998. Developing an adaptive model of thermal comfort and preference. ASHRAE Transactions 104(1):145-167.
Dematte JE, O’Mara K, Buescher J, Whitmey CG, Forsythe S, McNamee T, Adiga RB, Ndukwu IM. 1998. Near-fatal heat stroke during the 1995 heat wave in Chicago. Annals of Internal Medicine 129(3):173-181.
Doan L. 2007. Administration’s response to climate change and energy independence. Statement of Lurita Doan, Administrator, U.S. General Services Administration, Before the Committee on Transportation and Infrastructure, U.S. House of Representatives, May 11, 2007. http://www.gsa.gov/portal/content/102626 (accessed February 24, 2011).
DOE (Department of Energy). 2000. Trends in residential air-conditioning usage from 1978 to 1997. http://www.eia.doe.gov/emeu/consumptionbriefs/recs/actrends/recs_ac_trends.html (accessed February 8, 2011).
DOE. 2008. 2005 Residential energy consumption survey Table HC2.7 Air conditioning usage indicators by type of housing unit, 2005. http://www.eia.doe.gov/emeu/recs/recs2005/hc2005_tables/hc7airconditioningindicators/excel/tablehc2.7.xls (accessed February 8, 2011).
Donaldson G, Robinson D, Allaway S. 1997. An analysis of arterial disease mortality and BUPA health screening data in men, in relation to outdoor temperature. Clinical Science 92:261-268.
Donaldson GC, Keatinge WR. 1997. Early increases in ischaemic heart disease mortality dissociated from and later changes associated with respiratory mortality after cold weather in south east England. Journal of Epidemiology & Community Health 51(6):643-648.
ED (Department of Education). 2007. Public school principals report on their school facilities: Fall 2005 statistical analysis report. National Center for Education Statistics. http://nces.ed.gov/pubs2007/2007007.pdf (accessed February 9, 2011).
Eggers FJ, Thackeray A. 2007. 32 Years of housing data. Report prepared for US Department of Housing and Urban Development, Office of Policy Development and Research. Bethesda, MD: Econometrica, Inc.
EIA (US Energy Information Administration) 2007. Commercial buildings energy consumption survey. Washington, DC: EIA.
EIA. 2010a. Air conditioning characteristics by climate-zone, 2005. http://www.eia.gov/emeu/recs/recs2005/hc2005_tables/hc6airconditioningchar/pdf/tablehc9.6.pdf (accessed July 18, 2011).
EIA. 2010b. Air conditioning characteristics by type of housing unit, 2005. http://www.eia.gov/emeu/recs/recs2005/hc2005_tables/hc6airconditioningchar/pdf/alltables.pdf (accessed July 18, 2011).
Eicker U, Vorschultze C. 2009. Potential of geothermal heat exchangers for office building climatisation. Renewable Energy 34:1126-1133.
EPA (US Environmental Protection Agency). 2009a. Heat island effect: Glossary. http://www.epa.gov/hiri/resources/glossary.htm (accessed February 24, 2011).
EPA. 2009b. Indoor air quality tools for schools reference guide. Washington, DC: EPA.
Fealy RD, Low PA, Thomas JE. 1989. Thermoregulatory sweating abnormalities in diabetes mellitus. Mayo Clinic Proceedings 64:617-628.
Fisk WJ, Seppänen OA. 2007. Providing better indoor environmental quality brings economic benefits. Published in Proceedings of Climate 2007. Well Being Indoors, June 10–14, 2007, Helsinki. Paper A01. http://eetd.lbl.gov/ied/sfrb/pdfs/performance-1.pdf (accessed February 9, 2011).
Fisk WJ. 2009. Climate change, energy efficiency, and IEQ: Challenges and opportunities for ASHRAE. Berkeley, CA: Lawrence Berkeley National Laboratory.
Fouillet A, Rey G, Laurent F, Pavillon G, Bellec S, Guihenneue-Jouyaux C, Clavel J, Jougla E, Hémon D. 2006. Excess mortality related to the August 2003 heat wave in France. International Archives of Occupational and Environmental Health 80:16-24.
Fryar CD, Hirsch R, Eberhardt MS, Yoon SS, Wright JD. 2010. Hypertension, high serum total cholesterol, and diabetes: Racial and ethnic prevalence differences in U.S. adults, 1999-2006. NCHS Data Brief (36):1-8.
GSA (US General Services Administration). 2010. Facilities standards for the public service buildings P100. Washington, DC: GSA.
Hajat S, Kovats RS, Lachowycz K. 2007. Heat-related and cold-related deaths in England and Wales: Who is at risk? Occupational and Environmental Medicine 64(2):93-100.
Hoffmann B, Hertel S, Boes T, Weiland D, Jockel, KH. 2008. Increased cause-specific mortality associated with 2003 heat wave in Essen, Germany. Journal of Toxicology and Environmental Health A 71:759-765.
Hummelgaard J, Juhl P, Sæbjörnsson KO, Clausen G, Toftum J, Langkilde G. 2007. Indoor air quality and occupant satisfaction in five mechanically and four naturally ventilated open-plan office buildings. Building and Environment 42(12):4051-4058.
Huynen MM, Martens P, Schram D, Weijenberg MP, Kunst AE. 2001. The impact of heat waves and cold spells on mortality rates in the Dutch population. Environmental Health Perspectives 109(5):463-470.
IPCC (International Panel on Climate Change). 2007. Chapter 9. Understanding and attributing climate change. In Climate change 2007—The physical science basis. Contribution of Working Group I to the Fourth Assessment Report of the Intergovernmental Panel on Climate Change, edited by Solomon S, Qin D, Manning M, Chen Z, Marquis M, Averyt KB, Tignor M, Miller HL. Cambridge, United Kingdom and New York, NY, USA: Cambridge University Press. http://www.ipcc.ch/pdf/assessment-report/ar4/wg1/ar4-wg1chapter9.pdf (accessed February 9, 2011).
Kenney WL, Munce TA. 2003. Invited review: Aging and human temperature regulation. Journal of Applied Physiology 95(6):2598-2603.
Kenny GP, Yardley J, Brown C, Sigal R, Jay O. 2010. Heat stress in older individuals and patients with common chronic diseases. CMAJ: Canadian Medical Association Journal 182(10):1053-1060.
Khalaj B, Lloyd G, Sheppeard V, Dear K. 2010. The health impacts of heat waves in five regions of New South Wales, Australia: A case-only analysis. International Archives of Occupational and Environmental Health 83(7):833-842.
Kilbourne EM, Choi K, Jones S, Thacker SB. 1982. Risk factors for heatstroke. A case-control study. Journal of the American Medical Association 247(24):3332-3336.
Klinenberg E. 2002. Heat wave: A social autopsy of disaster in Chicago (Illinois). Chicago: The University of Chicago Press.
Kloner RA, Poole WK, Perritt RL. 1999. When throughout the year is coronary death most likely to occur? A 12-year population-based analysis of more than 220 000 cases. Circulation 100(15):1630-1634.
Knowlton K, Rotkin-Ellman M, King G, Margolis HG, Smith D, Solomon G, Trent R, English P. 2009. The 2006 California heat wave: Impacts on hospitalizations and emergency department visits. Environmental Health Perspectives 117(1):61-67.
Kovats RS, Hajat S. 2008. Heat stress and public health: A critical review. Annual Review of Public Health 29:41-55.
Lan L, Wargocki P, Lain Z. 2010. Quantitative measurement of productivity loss due to thermal discomfort. Energy and Buildings 43(5):1057-1062.
Lopez R., Goldoftas, B. 2009. The urban elderly in the United States: Health status and the environment. Reviews on Environmental Health 24:47-57.
Luber G, McGeehin M. 2009. Climate change and extreme heat events. American Journal of Preventative Medicine 35(5):429-435.
Martinez BF, Annest JL, Kilbourne EM, Kirk ML, Lui K-J, Smith ZM. 1989. Geographic distribution of heat-related deaths among elderly persons. Use of county-level dot maps for injury surveillance and epidemiologic research. Journal of the American Medical Association 262(16):2246-2250.
McGeehin MA, Mirabelli M. 2001. The potential impacts of climate variability and change on temperature-related morbidity and mortality in the United States. Environmental Health Perspectives 109(2):185-189.
Medina-Ramón M, Schwartz J. 2007. Temperature, temperature extremes, and mortality: A study of acclimatization and effect modification in 50 United States cities. Occupational & Environmental Medicine 67:827-833.
Mendell MJ, Lei-Gomez Q, Mirer AG, Seppänen O, Brunner G. 2008. Risk factors in heating, ventilating, and AC systems for occupant symptoms. Indoor Air 18:301-316.
Metzger KB, Ito K, Matte TD. 2010. Summer heat and mortality in New York City: How hot is too hot? Environmental Health Perspectives 118(1):80-86. Comment in 118(1):A35.
MMWR (Morbidity and Mortality Weekly Report). 1998. Community needs assessment and morbidity surveillance following an ice storm—Maine, January 1998. MMWR 47:351-354.
Morello-Frosch R, Jesdale B. 2008. Unpublished impervious surface and tree cover data. Data for this analysis were derived from: US Geological Survey’s National Land Cover Data-set 2001. http://www.mrlc.gov/nlcd.php (accessed June 20, 2007); and ESRI’s ArcMap census boundary files http://www.census.gov/geo/www/cob/bdy_files.html (accessed June 6, 2008).
Mudarri D. 2010. Public health consequences and cost of climate change impacts on indoor environments. Washington, DC: US Environmental Protection Agency.
Naughton MP, Henderson A, Mirabelli MC, Kaiser R, Wilhelm JL, Kieszak SM, et al. 2002. Heat-related mortality during a 1999 heat wave in Chicago. American Journal of Preventative Medicine 22(4):221-227.
Nicol JF, Humphreys MA. 2002. Adaptive thermal comfort and sustainable thermal standards for buildings. Energy and Buildings 34(6):563-572.
Nowak D, Crane D, Stevens J. 2006. Air pollution removal by urban trees and shrubs in the United States. Urban Forestry and Urban Greening 4:115-123.
NRC (National Research Council). 2010. America’s climate choices: Advancing the science of climate change. Washington, DC: The National Academies Press.
NWS (National Weather Service). 2010. NOAA’s National Weather Service heat index. http://www.nws.noaa.gov/om/heat/heatindex.shtml (accessed January 25, 2011).
Oberndorfer E, Lundholm J, Bass B, Coffman RR, Doshi H, Dunnett N, Gaffin S, Kohler M, Liu KKY, Rowe B. 2007. Green roofs as urban ecosystems: Ecological structures, functions, and services. BioScience 57(10):823-833.
O’Neill MS, Zanobetti A, Schwartz J. 2003. Modifiers of the temperature and mortality association in seven US cities. American Journal of Epidemiology 157:1074-1082.
Patz JA, McGeehin MA, Bernard SM, Ebi KL, Epstein PR, Grambsch A, Gubler DJ, Reiter P, Romieu I, Rose JB, Samet JM, Trtanj J. 2000. The potential health impacts of climate variability and change for the United States: Executive summary of the report of the Health Sector of the U.S. National Assessment. Environmental Health Perspectives 108(4):367-376.
Pearlman RA, Uhlmann RF. 1988. Quality of life in chronic diseases: Perceptions of elderly patients. Journal of Gerontology 43(2):M25-M30.
Petrofsky JS, Lee S, Patterson C, Cole M, Stewart B. 2005. Sweat production during global heating and during isometric exercise in people with diabetes. Medical Science Monitor 11:CR515-CR521.
Phelan, JC, Link BG, Diez-Roux A, Kawachi I, Levin B. 2004. Fundamental causes of social inequalities in mortality: A test of the theory. Journal of Health and Social Behavior 45(3):265-285.
Press V. 2003. Fuel poverty and health. London, UK: National Heart Forum.
Preziosi P, Czernichow S, Gehanno P, Hercberg S. 2004. Workplace air-conditioning and health services attendance among French middle-aged women: A prospective cohort study. International Journal of Epidemiology 33:1120-1123.
Reid CE, O’Neill MS, Gronlund CJ, Brines SJ, Brown DG, Diez-Roux AV, Schwartz J. 2009. Mapping community determinants of heat vulnerability. Environmental Health Perspectives 177(11):1730-1736.
Reinhart C, Holmes S, Park C. 2010. Climate change & (solar) architecture. Presentation before the Committee on the Effect of Climate Change on Indoor Air Quality and Public Health on June 7, 2010.
Ruddell DM, Harlan SL, Grossman-Clarke S, Buyantuyev A. 2010. Risk and exposure to extreme heat in microclimates of Phoenix, AZ. In Geospatial contributions to urban hazard and disaster analysis, edited by Showalter PS, Lu Y. London, NY: Springer Dordrecht Heidelberg.
Russell M, Sherman M, Rudd A. 2005. Review of residential ventilation technologies. Berkeley, CA: Ernest Orlando Lawrence Berkeley National Laboratory.
Sahakian N, Park J, Cox-Ganser J. 2009. Respiratory morbidity and medical visits associated with dampness and air-conditioning in offices and homes. Indoor Air 19(1):58-67.
Santamouris M, Pavloua K, Synnefaa A, Niachoua K, Kolokotsab D. 2007 Recent progress on passive cooling techniques—Advanced technological developments to improve survivability levels in low-income households. Energy and Buildings 39(Special Issue S1):859-866.
Schiavon S. 2009. Energy saving with personalized ventilation and cooling fan. Doctoral dissertation, Padua: University of Padua Department of Applied Physics.
Schuman SH. 1967. Patterns of urban heat wave deaths and implications for prevention: Data from New York and St Louis during July, 1966. Environmental Research 5:59-75.
Scott MJ, Huang YJ. 2007. Effects of climate change on energy use in the United States. In Effects of climate change on energy production and use in the United States, edited by Wilbanks TJ, Bhatt V, Bilello DE, Bull SR, Ekmann J, Horak WC, Huang YJ, Levine MD, Sale MJ, Schmalzer DK, Scott MJ. Synthesis and Assessment Product 4.5. U.S. Climate Change Science Program, Washington, DC, pp. 8-44.
Semenza J. 1999. Excess hospital admissions during the July 1995 heat wave in Chicago. American Journal of Preventative Medicine 16(4):269-277.
Semenza JC, Rubin CH, Falter KH, Selanikio JD, Flanders WD, Howe HL, Wilhelm JL. 1996. Heat-related deaths during the July 1995 heat wave in Chicago. New England Journal of Medicine 335(2):84-90.
Shonkoff SB, Morello-Frosch R, Pastor M, Sadd J. 2009. Draft Paper: Environmental health and equity impacts from climate change and mitigation policies in California: A review of the literature. California Climate Change Center.
Stansberry KB, Hill MA, Shapiro SA, McNitt PM, Bhatt BA, Vinik AI. 1997. Impairment of peripheral blood flow responses in diabetes resembles an enhanced aging effect. Diabetes Care 20:1711-1716.
Steadman RG. 1979. The assessment of sultriness. Part I: A temperature-humidity index based on human physiology and clothing science. Journal of Applied Meteorology 18:861-873.
Synnefa A, Santamouris M, Akbari H. 2007. Estimating the effect of using cool coatings on energy loads and thermal comfort in residential buildings in various climatic conditions. Energy and Buildings 39(11):1167-1174.
Tan J, Zheng Y, Song G, Kalkstein LS, Kalkstein AJ, Tang X. 2007. Heat wave impacts on mortality in Shanghai, 1998 and 2003. International Journal of Biometeorology 51(3):193-200.
USCB (US Census Bureau). 2004. Housing vacancies and home ownership (CPS/HVS). http://www.census.gov/hhes/www/housing/hvs/annual97/ann97def.html (accessed February 24, 2011).
USCB. 2009. American Housing Survey (AHS). http://www.census.gov/hhes/www/housing/ahs/ahs09/ahs09.html (accessed February 24, 2011).
USGCRP (US Global Change Research Program). 2009. Global climate change impacts in the United States. New York: Cambridge University Press.
Vandentorren S, Bretin P, Zeghnoun A, Mandereau-Bruno L, Croisier A, Cochet C, Ribéron J, Siberan I, Declercq B, Ledrans M. 2006. August 2003 heat wave in France: Risk factors for death of elderly people living at home. European Journal of Public Health 16:583-591.
Verdú E, Ceballos D, Vilches JJ, Navarro X. 2000. Influence of aging on peripheral nerve function and regeneration. Journal of the Peripheral Nervous System 5(4):191-208.
WHO (World Health Organization). 2009. Natural ventilation for infection control in health-care settings. Geneva: WHO Press.
Wilson A. 2005. Passive survivability. Environmental Building News. December 1. http://www.buildinggreen.com/auth/article.cfm/2005/12/1/Passive-Survivability/ (accessed February 23, 2011).
Wilson A. 2006. Passive survivability: A new design criterion for buildings. Environmental Building News. May 1. http://www.buildinggreen.com/auth/article.cfm/2006/5/3/PassiveSurvivability-A-New-Design-Criterion-for-Buildings/ (accessed February 23, 2011).
Woodhouse PR, Khaw KT, Plummer M, Foley A, Meade TW. 1994. Seasonal variations of plasma fibrinogen and factor VII activity in the elderly: Winter infections and death from cardiovascular disease. Lancet 343(8895):435-439.
Yang J, Yu Q, Gong P. 2008. Quantifying air pollution removal by green roofs in Chicago. Atmospheric Environment 42(31):7266-7273.
Zmeureanu R, Wu X. 2007. Energy and exergy performance of residential heating systems with separate mechanical ventilation. Energy 32:187-195.


