
8
Building Ventilation, Weatherization, and Energy Use
High energy costs and climate-change mitigation efforts are creating pressures to decrease ventilation rates in buildings as a means of reducing the energy used to cool or warm indoor air. This chapter concentrates on the interrelated issues of building energy use, emissions from building materials, weatherization, and ventilation and on how they affect occupants. It addresses energy consumption in buildings, the means used to tighten buildings, programs to enhance the energy efficiency of buildings and reduce harmful emissions from building components, the training of personnel who implement weatherization programs, and the effect of tightening on ventilation, indoor environmental quality, and occupant health and productivity. The chapter concludes with the committee’s observations regarding those issues.
Ventilation affects indoor levels of air pollutants, indoor moisture levels, exposures to biologic agents, and the thermal environment of homes. Research on those topics as opposed to ventilation itself is addressed in Chapters 4–7.
Energy use in buildings has been a concern in the United States since the oil embargoes of the 1970s but has gained new currency in recent years as a result of rising costs and an interest in limiting greenhouse-gas emissions. The Department of Energy (DOE) tracks trends in energy use. Its 2009 Buildings Energy Data Book, which has data through 2006, notes that the
dominant uses vary between residential and commercial structures1 (DOE, 2009). As noted in Table 8-1, the dominant uses of energy in the residential sector are ambient space heating (about 26%) and cooling, water heating, and lighting (each about 12–13%). In commercial buildings, lighting is the dominant category at about 25%, but space heating, cooling, and mechanical ventilation together account for more than 31%. DOE also estimates emissions of carbon dioxide (CO2), a greenhouse gas, from burning fossil fuels to generate energy (mainly natural gas on site and natural gas and coal for electricity production). Those figures are listed in Table 8-1, and they track the energy-use numbers closely. All told, building CO2 emissions in 2006 accounted for 38% of total US CO2 emissions—20% contributed by residential buildings, 18% by commercial structures.
Weatherization describes the steps taken during building design or retrofit to increase energy efficiency by limiting unintended air and heat exchange between the indoor and outdoor environments. Because those steps generally entail closing gaps in the building envelope, the process is also referred to as tightening. This section describes some of the means typically used to tighten buildings and the effect of tightening on ventilation.
Strategies for Tightening Buildings
There are four common methods for reducing unplanned air leakage in buildings.
Air-tighten the enclosure. Sealing cracks, gaps, and holes in the building envelope with vapor barriers, and other construction changes reduce the amount of air that accidentally leaks in or out. In many US climates, this saves substantial amounts of energy. Sherman and McWilliams (2007) determined that around one-third of the energy used for heating and cooling is due to accidental air leakage. There are far fewer measurement data on accidental air leakage in commercial buildings, but it is reported to be around 20–30% (range, 0–58%) of the heating or cooling energy used (Edwards and Hamilton, 1993; Emmerich, 2005; Shaw, 1995). In a study of several California buildings, Mowris and Fisk (1988) observed that accidental air leakage made up 0–30% of the total air-exchange rate. Persily and Norford (1987) found leakage of 31–58% in a three-story office building. About 20–40% of the air leakage can be sealed in existing residential
_____________________
1 There is, of course, great variation among buildings in these general categories; building age, material, size, location, and predominant use are important factors.
TABLE 8-1 Percentage of Total Energy Use and Carbon Dioxide Emissions Attributable to Specific Applications in US Buildings in 2006 (DOE, 2010)
| Energy Use | Carbon Dioxide Emissions | |||||
| All | Residential | Commercial | All | Residential | Commercial | |
| Space heating | 19.8 | 26.4 | 12.1 | 18.8 | 24.6 | 12.2 |
| Lighting | 17.7 | 11.6 | 24.8 | 18.1 | 12.0 | 25.2 |
| Space cooling | 12.7 | 13.0 | 12.6 | 13.0 | 13.4 | 12.5 |
| Water heating | 9.6 | 12.5 | 6.3 | 9.4 | 12.4 | 6.0 |
| Electronics | 7.8 | 8.1 | 7.5 | 8.0 | 8.4 | 7.6 |
| Refrigeration | 5.8 | 7.2 | 4.1 | 5.9 | 7.4 | 4.2 |
| Cooking | 3.4 | 4.7 | 2.0 | 3.4 | 4.7 | 1.9 |
| Wet cleaninga | 3.3 | 6.2 | — | 3.4 | 6.4 | — |
| Mechanical ventilation | 2.8 | — | 6.7 | 2.9 | — | 6.2 |
| Computers | 2.3 | 1.0 | 3.8 | 2.4 | 1.0 | 3.9 |
| Other | 8.5 | 3.6 | 13.2 | 8.4 | 3.8 | 12.6 |
| Attributable to buildings but not directly to specific end uses | 6.3 | 5.7 | 6.9 | 6.4 | 5.9 | 7.9 |
a Primarily automatic washers, dryers, and dishwashers.
and commercial buildings; in new construction, it is feasible to seal about 90% of potential leakage in typical stock (Spengler, 2010).
Seal air-distribution systems. Holes and gaps in air handlers, supply and return ducts, and plenums2 lead to leakage in buildings. If the air-handling system is off, then they behave like any other leak. When an air handler is on, leaks are exacerbated by the greater pressure difference across holes or gaps. Cummings et al. (1996) reported that measured duct leakage in commercial buildings averaged about 80 ft3/min at 25 pascals/100 ft2 of duct surface area; the largest outdoor-air infiltration rates were in vented spaces, such as attics, crawlspaces, mechanical closets, and wall cavities. Indoor relative humidity may increase if hot and humid outdoor air infiltrates these spaces. In response, air-conditioning units may have longer run times to correct the imbalance and thus waste energy.
Manage indoor–outdoor air-pressure differences. If airflow through heating, ventilating, and air-conditioning (HVAC) equipment results in excessively pressurized or depressurized zones, rooms, or building cavities, then indoor air may be forced out or drawn in through the building enclosure. The most common example is return air plenums. Any air leak in exterior walls that bound a return plenum becomes an accidental outdoor-air intake when the air handler is operating. If a mechanical room is used as a mixing chamber for return and outdoor air, the room is likely to be depressurized by 10–30 pascals and may be depressurized by as much as 90 pascals (Spengler, 2010). Another example common in residential and small commercial buildings is a duct layout that includes supply diffusers in every room and air returns in corridors. When doors to the corridor are closed, the rooms are pressurized, and the corridors are depressurized. The combination of that dynamic and duct leakage to the outside can greatly increase the air-exchange rate in a building. In a study of unplanned airflows in 70 commercial buildings, 8 had air-exchange rates of 2 to 10 air changes per hour (ACH) when the air handlers were running (Cummings et al., 1996). Similar results have been reported for residential buildings. A research project on 91 Florida homes found that the average air-exchange rate went from 0.21 ACH with air handlers off to 0.91 ACH with air handlers on (Cummings and Tooley, 1989). Depending on the circumstances, poorly managed pressure differences may decrease desired circulation of outdoor air indoors or increase energy costs through excessive intrusion of outdoor air.
Replace atmospherically vented combustion equipment with high-efficiency combustion equipment in residential buildings. Atmospherically vented combustion equipment typically vents through a chimney. The
_____________________
2 A plenum is a space in which a building’s supply or return air is mixed or moves; it can be a duct, a joist space, an attic, a crawlspace, or a wall cavity (EPA, 2011b).
chimney ventilates the equipment room and, when the equipment is not running, exhausts air. When the equipment is running, it ventilates at a much higher rate because of the high flue-gas temperature. Measurements made in the 1980s found typical flows of air through chimneys of 50–100 ft3/min (Spengler, 2010). High-efficiency combustion equipment, such as condensing furnaces, does not have a chimney—it vents to the outdoors through pipes in a side wall. The combustion gases are vented to the outside through a small fan, which typically runs at about 25 ft3/min. When such furnaces are not firing, the flows are essentially zero. That dynamic affects single-family buildings, some low-rise multifamily buildings, and small commercial buildings that are constructed with residential methods. If the equipment is in a basement or crawlspace in a climate that has a substantial heating season, ventilation through the chimney is often controlling humidity that enters through the foundation. That does not, however, apply to sealed combustion units (which draw no air from the mechanical space) and heat pumps (which need no vents, because there is no combustion).
Effects of Tightening on Ventilation
Lawrence Berkeley National Laboratory (LBNL) investigators compiled a dataset on blower-door tests used to assess air leakage from homes across the country (Chan et al., 2003). Figure 8-1 illustrates the results of the home air-tightness tests expressed as whole-house air exchange vs the year when a home was built. The solid line represents the smoothed fit through the data. It shows that the air-exchange rate—as extrapolated from a blower-door pressurization test of air leakage—has been decreasing in homes built over the past 40 years. The trend in tighter house construction coincides with a housing boom in the United States in warm-climate areas, such as Atlanta, Las Vegas, and Phoenix, where air conditioning often reduced the dependence on natural ventilation.
An evaluation of air-tightness measurements in 201 commercial and institutional buildings in the United States by Emmerich and Persily (2005) found that the structures were tighter than the overall average for residential buildings but leakier than new residential construction. The authors state that “unlike the residential air tightness data, the database of US commercial building air tightness shows no indication of a trend toward tightness for newer buildings” (Persily and Emmerich, 2009).
ENERGY-EFFICIENCY PROGRAMS FOR BUILDINGS
Several government and private initiatives are aimed at reducing energy use in residences and commercial structures. Depending on the program, they may include energy audits, general or building-specific recommenda-
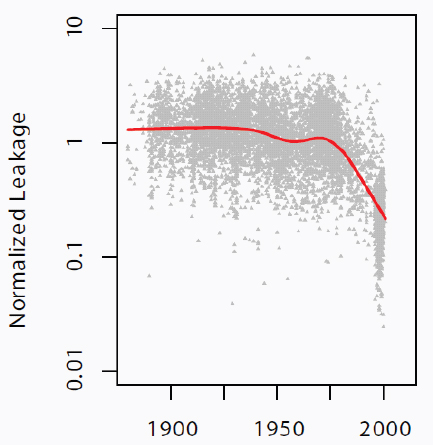
FIGURE 8-1 Normalized air leakage in a sample of homes (measured as air changes per hour) vs year when a home was built (Chan et al., 2003).
tions for action, and assistance in identifying or hiring contractors trained to perform remediations and upgrades. Improvements can include such weatherization measures as envelope and duct sealing, caulking, replacement of leaky windows, and increased insulation and such conservation steps as replacement of incandescent with compact fluorescent or LED lighting and appliance and HVAC upgrades. Information on some of the programs is summarized below.
National Weatherization Assistance Program
The national Weatherization Assistance Program (WAP) was launched in 1976 to help Americans with limited financial means to respond to rapidly increasing fuel prices during the oil embargoes of the 1970s. WAP weatherizes existing homes. Over the past 33 years, it has provided weatherization services to more than 6.4 million low-income households. Major funding comes from DOE, and additional support from a variety of sources, including the Low Income Home Energy Assistance Program block grants and energy utility programs (WAP, 2009b).
WAP conducts energy audits and selects appropriate energy-conserving measures that can be implemented for costs that do not exceed a capped
dollar amount. In 2008, WAP provided services to around 100,000 households at a cap figure of $3,500 per unit. In 2009, that rose to 171,000 units. The target number of units weatherized for 2010 was 200,000 with a cap of $6,500 per unit (WAP, 2010).
WAP grantees and subgrantees use professionally trained staff and contractors. They make their own decisions on how training is provided. Although that creates some variability across the country, protocols for building assessment, weatherization measures, and quality-assurance procedures have evolved into a fairly consistent industry set of practices (WAP, 2009a). Training may be provided by independent weatherization trainers, inhouse technical trainers, or local or regional weatherization training centers. Typically, it is supplied by a mixture of the three. In 2009, 90% of states used state-agency staff for training, 75% used local-agency peers for training, and 70% used independent trainers (WAP, 2009a). Grantees also make their own decisions about certification. Some require certification by a national organization, such as the Residential Energy Services Network (RESNET) or the Building Performance Institute (BPI). Others provide their own certification, and 17 states do not require certification (WAP, 2009a).
Many of the training facilities for WAP also provide instruction to private-sector building-performance contractors. Twelve weatherization training centers in 11 states offer training that reaches beyond the WAP community. BPI supplies education through a network of training affiliate organizations, individual certifications, company accreditations, and quality-assurance programs. RESNET develops standards and certification for home-energy raters (WAP, 2009a). DOE is also planning to provide additional training for new workers in the weatherization field (WAP, 2009a).
In 1992, the US Environmental Protection Agency (EPA) introduced ENERGY STAR as a voluntary labeling program designed to identify and promote energy-efficient products to reduce greenhouse-gas emissions. Computers and monitors were the first labeled products. However, in 1996, EPA partnered with DOE for some product categories, and the ENERGY STAR label was extended to new homes and commercial and industrial buildings (EPA, 2010b). In 1999, EPA, DOE, and the Department of Housing and Urban Development started Home Performance with ENERGY STAR, an energy-performance program for existing homes. The initiative provides guidelines and support for programs—often partnerships of government agencies, building-science technical-support organizations, building-performance contractors, and utility programs—to provide training and quality assurance for contractors who help homeowners to bring their properties up to ENERGY STAR standards for new construction. To
receive an ENERGY STAR label, a home must be tested to demonstrate performance. More than 75,000 homes have been improved through the program (EPA, 2010b). More than a million US homes had received the ENERGY STAR label as of 2009, and 20% of the roughly 500,000 new homes constructed in 2009 were ENERGY STAR–labeled.
The ENERGY STAR Indoor Air Package is a label that adds items that address a broader array of indoor environmental quality issues—including moisture control, pest management, combustion safety, ventilation, emissions from building materials, and radon control—to the baseline ENERGY STAR program (EPA, 2010b). It was initiated in 2005 and intended to contribute to improved indoor air quality in new homes compared with code-built homes.
Other Programs
Nongovernment “green and affordable” housing programs are under way at the local and national levels. One example is the Enterprise Community Partnership, which serves low-income people in communities across the country and provides funds and expertise to enable developers to build and rehabilitate homes to be healthier, more energy-efficient, and consistent with sustainability criteria. The program started in 2004 and by 2009 had produced 17,500 new and renovated affordable homes (Enterprise Community Partners, 2010).
Many energy utility companies have energy-efficiency programs that aid residential, commercial, and institutional customers. The amount of money spent each year on such programs is large, totaling $5.3 billion in 2009 (Nevius et al., 2010). Program budgets vary widely by US Census region: states in the West account for 45% of the national total; in the Northeast, 25%; in the South, 17%; and in the Midwest, 13%. Utilities in California alone reported combined budgets of about $1.6 billion—30% of the national total. Programs were most likely to address energy-efficiency improvements in residential furnaces and boilers and in commercial and industrial lighting.
Commissioning and retrocommisioning are terms used to describe the usually independent evaluation of newly constructed or existing buildings (respectively) to determine whether they operate as designed or intended and whether they can be improved. It is more typically performed on commercial and public buildings. Examination of the energy efficiency of HVAC, lighting, plumbing, and other mechanical systems is a typical component of the process.
Effects of Programs on Energy Use and Employment
A 2010 LBNL case study of 14 energy-efficiency programs undertaken by state and local governments, utility companies, and nonprofit organizations found a wide range of participation and a maximum energy saving of about 15% for an individual home (Fuller et al., 2010). EPA reported that newly built homes implementing ENERGY STAR upgrades can realize up to 20% energy savings compared with conventional construction practice (EPA, 2007).
Effinger and Friedman (2010) summarized the findings of an LBNL report on retrocommissioning. The study—which comprised 112 buildings, including offices, hospitals, hotels, a retail space, and a school—found that measures to improve energy efficiency resulted in savings of 8–31% (median, 16%). The equipment affected included air-handling units, pumps, chillers, cooling towers, outside air-temperature sensors, and heat exchangers. The cost of the implemented measures and the retrocommissioning itself had a simple payback of 0.5–2.5 years (median, 1.1 years). The LBNL report itself (Mills, 2009) concluded that “these findings demonstrate that commissioning is arguably the single-most cost-effective strategy for reducing energy, costs, and greenhouse gas emissions in buildings today.”
Residential energy upgrade programs through DOE, state energy offices, and mandated service of public utilities are expected to grow substantially over the next decade. California has committed to reducing energy use in existing homes by 40% by 2020 (CPUC, 2008). Nationally, jobs in the sector are expected to grow from around 114,000 person-years of employment (PYE) in 2008 to 200,000–380,000 PYE by 2020 (Goldman et al., 2010).
PRODUCT-LABELING AND BUILDING-CERTIFICATION PROGRAMS
Well before the green-building movement gained currency in the 1990s, indoor air quality concerns were recognized as more sealed buildings were constructed, ventilation rates were reduced, and new equipment, materials, coatings, and furnishings were introduced. In response to those concerns, governments and private organizations developed product-labeling, emission-testing, and building-certification systems to distinguish and market3 healthier and more environmentally conscious products and buildings.
The following sections summarize and evaluate some features of the green-building movement related to indoor environmental quality, includ-
_____________________
3 The US Federal Trade Commission maintains Guides for the Use of Environmental Marketing Claims (also known as the Green Guides), which are intended to help marketers to make truthful and substantiated claims about “green” products. The guides were under review and revision when the present report was completed at the end of 2010 (FTC, 2010).
ing the process of materials testing and labeling, building-certification programs, and research needed to address knowledge gaps and uncertainties about the effect of the processes as they are related to building design, construction, and operation under future climate scenarios.
There is little peer-reviewed literature on this topic, and the committee’s work was informed in part by white papers on building materials and product-testing regimens (Levin, 2010) and green-building rating systems (Srebric, 2010) commissioned by EPA in support of the present study. A 2010 National Research Council workshop report addressed the broader topic of third-party certification systems for products and services labeled as sustainable (NRC, 2010).
Materials Testing and Labeling Systems
There are numerous green-product labeling and whole-building certification systems: a World Resources Institute report indicated that there were more than 340 such systems in November 2009 (WRI, 2010), and a Web site created to compile “ecolabel” information listed nearly 380 in February 2011, including 85 related to building products and 64 to buildings (Ecolabel Index, 2011).
Green-product labeling systems are intended to promote the use of materials that have low or lower problematic emissions as established through uniform laboratory testing at fixed temperatures and airflow rates (Willem and Singer, 2010). Initial protocols for developing voluntary materials-labeling standards through emissions testing were developed in northern Europe—most notably in Germany, Finland, and Denmark—but have since spread around the world. The Levin (2010) and Srebric (2010) white papers and Willem and Singer (2010) and WRI (2010) reviews contain information on the major initiatives; information on some specific programs is highlighted below. International standards and certification programs are addressed because these may affect products used in the United States through imports of certified products, US manufacturers designing for international sales, or competitive pressures for US companies to manufacture green products.
Denmark’s DICL4 system, which was the first to test materials in emission chambers, was developed to address the most common building-related complaints: the evaluation of odors and sensory irritation, particularly irritation of the eyes and upper respiratory tract. It assesses how a standardized exposure to a material or product irritates mucous membranes or is detected by people (Wolkoff and Nielsen, 1995), but it may also incorporate data from animal studies (Wolkoff et al., 1991). Products are labeled in terms of
_____________________
4 Danish Indoor Climate Label; also known as the Danish Indeklima Mærke (DIM).
the time that it takes either to achieve no (or a minor) change in breathing frequency in a mouse assay or to drop below odor or irritation thresholds in humans (Kephalopoulos et al., 2005; Wolkoff and Nielson, 1995; Wolkoff et al., 1991). Indoor environment “comfort thresholds” are based on the time required for the VOC emissions to decay to the point where their room concentrations are below their indoor-relevant threshold, which is half the value of either the odor threshold or the sensory-irritation estimate (whichever is lower) for each individual VOC cited in the VOCBASE database (Jensen and Wolkoff, 1996; Kephalopoulos et al., 2005). In most cases, the odor threshold drives the determination of the time value for a specific VOC because sensory-irritation estimates are typically at least an order of magnitude higher than odor thresholds. In practice, use of half the odor threshold is a public-health protective safety factor to account for the presence of the same VOC from other outdoor or other indoor sources in the building. With its focus on irritation and odor thresholds, the DICL test protocol does not address other potential health effects of exposure to hazardous chemicals, such as carcinogenic, allergenic, or endocrine-disrupting properties (Kephalopoulos et al., 2005; Levin, 2010).
REACH (Registration, Evaluation, Authorization, and Restriction of CHemical substances) is the name used for the European Community’s (EC’s) legislation regarding chemical substances (European Commission Environment, 2011). In contrast to the other programs mentioned here, it has regulatory force with the European Union. The regulation includes provisions regarding emissions from building materials. In 2011, the EC announced that six toxic chemicals, three of which are widely used as plasticizers in flooring, adhesives, and textiles, were being phased out under the authority of REACH (European Commission Environment, 2011).
In 1988, the Canadian government founded EcoLogo—an International Organization for Standards (ISO) Type 1 ecolabel that takes toxicity, recycled content, and renewable energy percentage into consideration but does not consider impacts such as raw material extraction (EcoLogo Program, 2011). It certifies building and construction materials such as adhesives, heating and cooling systems, and paints.
The most well known of the building-materials and furnishing testing systems in the United States may be the certification process promulgated by the GREENGUARD Environmental Institute, an industry-independent nonprofit organization established in 2001 (AQS, 2009b). GREENGUARD’s certification processes put building materials and building-related products (such as carpets) into chambers for a fixed period to measure emissions of VOCs, organic acids, formaldehyde, respirable particles, and other compounds. Green Seal is a nonprofit certification organization seeking to reduce the environmental impact of residential and commercial buildings and materials (Green Seal, 2010). It follows guidelines for labeling set by
the US government, specifically the Environmental Protection Agency and Federal Trade Commission, awarding a Green Seal to those products that meet its standards. Much of its focus for construction materials is on low VOCs emissions in paints, coatings, and adhesives.
Levin’s white paper (2010), which reviews a number of product labeling and certification systems in place in the United States, Europe, and Asia, identifies some weaknesses in their emission testing schemes:
- They measure emissions on a small number of products and test emissions from limited number of samples.
- Results of testing individual products may be used to represent the results of similar products from the same or other manufacturers.
- Tests are performed over a short period that is probably a small fraction of the total service life of many products.
- The focus on building materials, surfaces, and coatings means that other known strong sources, such as consumer products or liquid surface treatments (paints, sealers, and so on), are not systematically tested.
It suggests research and policy initiatives that would help resolve them.
In addition to those issues, a small number of chemicals are measured in the emissions tests, and there are few data on health effects of many of the emitted chemicals in animals or humans with which to assess hazards or develop health-based indoor environmental quality standards (Willem and Singer, 2010). None of the existing or proposed labeling systems includes information on chemical emissions in the text of the labels themselves (Willem and Singer, 2010).
Most important, the testing regimens focus on emissions under “normal” environmental conditions and do not assess the array of potential product-use scenarios, environmental conditions, or air-exchange rates in connection with which building materials or consumer products might be used. For example, the emissions of a mattress in a test chamber held at 50% relative humidity and 72°F (22°C) with one air change per hour will not represent the breathing-zone concentrations experienced by a person sleeping on the mattress where temperatures and humidities are likely to be different. Such an approach also limits the range of interventions that might be undertaken to address problems.
Nonetheless, such testing systems represent an important source of information on product emissions and a driving force in lowering emissions. These will become more important if climate change mitigation and energy conservation measures that encourage tighter buildings become more widespread.
Building Certification
There are numerous green-building or sustainable-building certification systems, including BREEAM (Building Research Establishment’s Environmental Assessment Method) in the UK and Canada; CASBEE (Comprehensive Assessment System for Building Environmental Efficiency) in Japan; Green Star in Australia; and Green Globe, GreenPoint, and LEED in the United States (AQS, 2009a; Srebric 2010). Many of them were spawned by green building councils (GBCs), which exist in a number of developed or rapidly developing countries. The World Green Building Council Web site lists 82 nations that have established, associated, emerging, or prospective organizations in early February 2011 (WGBC, 2011). The standards and certifications that the bodies promulgate collectively promote design practices that, in theory, reduce environmental impacts and costs over time, although the evidence base for this assertion is thin (Srebric, 2010).
The US-based GBC’s LEED (Leadership in Energy and Environmental Design) certification is a voluntary standard that has become widely accepted for certification of energy efficiency and perceived “greenness” of US buildings (EHHI, 2010; Srebric, 2010). It was one of the first and is among the most widespread standards in the United States. As of September 2010, the organization counted 442 cities, towns, or counties in 45 states; 35 state or territorial governments; and 14 federal agencies or departments that incorporated various LEED initiatives into their regulatory or policy frameworks (LEED, 2010).
The goal of LEED and other rating systems is to provide guidance in the process of building or renovating “green” through a certification or voluntary compliance system. The LEED tiered scoring system for new construction and major renovations awards up to 110 points toward attaining certification at one of four levels: Certified (40–49 points), Silver (50–59), Gold (60–79), and Platinum (80 and above) (LEED, 2011). Seven categories are evaluated:
- Energy and atmosphere (up to 35 points).
- Sustainable sites (26).
- Indoor environmental quality (15).
- Materials and resources (14).
- Water efficiency (10).
- Innovation in design (6).
- Regional “priority” credits (bonus points for water efficiency in the southwestern United States or use of insulation in colder regions, for example) (4).
Those categories are similar to standards employed by GBCs in other countries.
The Srebric white paper (2010) notes that both of LEED’s indoor environmental quality prerequisites and 12 of the 15 available points in the category address indoor air quality. The first prerequisite, “minimum indoor air quality performance,” is based on compliance with American Society of Heating, Refrigerating and Air-Conditioning Engineers (ASHRAE) building ventilation standards, while the second, “environmental tobacco smoke (ETS) control,” is generally achieved by banning smoking in or near the building. Points are also awarded for using low-emitting materials—adhesives and sealants, paints and coatings, flooring systems, and composite wood and agrifiber products—in construction, for indoor chemical and pollutant source control, and for designing for maintaining the thermal comfort of occupants.
From a public-health standpoint, one of the primary criticisms of LEED is that it is possible to receive the highest level of certification without earning any points in indoor environmental quality. Because the system was developed by various stakeholders in the design, materials, and construction industries with little input from the indoor-environment and public-health research communities, point values are weighted more heavily toward the built environment and less toward human exposure and health. The nonprofit organization Environment and Human Health, Inc. (EHHI), published a report in 2010 that offered a number of recommendations for improving the LEED scoring system. They include adding health and environmental-science expertise to the GBC LEED board, simplifying the scoring system and specifying a minimum level of building performance within each of the rating categories, awarding points for the use of known safe products and deducting points for the use of known hazardous substances, and performing postoccupancy indoor air quality testing (EHHI, 2010). The organization also recommended that the GBC take an advocacy role in encouraging federal testing of chemicals used in building products. LEED responded to the EHHI report by acknowledging gaps in its standard but noting that that the criticism discounted the health benefits of buildings’ using less energy (Fisher, 2010).
Numerous other organizations also promote standards for various building sectors or in particular regions. The Ecolabel Index lists a number of these (Ecolabel Index, 2011). One such example is Build It Green, a California-based nonprofit organization that developed a “GreenPoint” system that rates buildings on resource conservation, indoor air quality, water conservation, community, and energy efficiency (Build It Green, 2011). The system includes consideration of off-gassing of VOCs from building materials and the adequacy of ventilation.
Observations and Synthesis
Product-labeling, emissions-testing, and building-certification systems have the potential to foster the development and use of products and designs that promote environmental stewardship. However, weaknesses in current testing regimens and in the information base on the effectiveness of the systems limit the conclusions that can be drawn about their usefulness in protecting occupant health.
The large number of materials-labeling systems creates confusion because of the lack of standardization, and steps are being taken to address this issue. The European Union is pursuing harmonization among the various European rating systems now in place to ensure consistency within their borders (ECA, 2010). Standardization of protocols for airflow rates and other experimental measures will help foster a milieu where information generated by the testing regimens can more easily be used to predict indoor air concentrations resulting from the use of materials in buildings or consumer products.
Product-labeling systems help to identify products that can contribute to higher scores in green-building certification processes, but the lack of data on types and rates of chemical emissions from materials after installation hampers scientific evaluation of the effect of labeling on indoor environmental quality. That uncertainty also hinders the development of health-based indoor environmental quality standards, as does the lack of research on links to human health and comfort in these buildings.
More specifically, a number of research and information needs are related to emissions testing of materials and consumer products, including development of methods or product-sampling schemes that account for the variability and representativeness of tested building materials; data on source strength of wet-applied products,5 cleaning products, and air fresheners; and more health-based standards that explore the wide array of potential health effects associated with the products and compounds (Levin, 2010). In addition, because of the current focus on laboratory testing, there have been few studies that validate the utility of testing systems in the real-world environments where materials are used or that recognize that buildings are complex operational units that must simultaneously manage ventilation, moisture, thermal conditions, and other characteristics that affect source strength and exposure. It will thus be necessary to conduct well-designed long-term studies to determine the extent to which emission-testing and building-certification programs and standards achieve improvements in indoor environmental quality.
Buildings are not static: furnishings, equipment, and maintenance prac-
_____________________
5 For example, paints, adhesives, sealants, and caulks.
tices change, and structures may be refurbished several times over their operational life. As a result, the contaminants in an extant building may be quite different from the ones that were present when the structure was new. It would be desirable to develop cleaning and maintenance data on the rate of introduction of new materials and furnishings or finishes after occupancy in buildings.
Building ventilation rates vary by season and location, so longitudinal studies that evaluate the variability in emissions over time would be useful. Accurate characterization of indoor chemical concentrations requires numerous samples of a variety of materials, rigorous measurement methods, and accepted quality-assurance and quality-control procedures. Those need to be linked to quantitative work on the effect of LEED and other certification programs on resident health and productivity over time.
Climate change complicates all the problems identified here by introducing more unaccounted-for variables and greater uncertainties. Currently, no building-rating system addresses the effect of changes in future climate conditions even though these changes will certainly affect performance over the lifetime of a structure. To provide clues about performance in a variety of climate change scenarios, future research needs to focus on minimum ventilation rates and room sizes and on scenarios in which to measure emissions. An integrated understanding of the interplay among those factors is crucial for understanding the minimally necessary conditions to maintain healthy indoor environmental quality in a changing climate (Levin, 2010). Reports of respiratory symptoms associated with wallboard from China offer an example of a circumstance in which particular use conditions may have contributed to product breakdown and health problems (Babich et al., 2010; Hooper et al., 2010).
As already noted, material testing and labeling systems represent an important source of information on product emissions and a driving force in lowering emissions. Private sector, federal, and state government efforts are already yielding results as manufacturers seek the advantages that accrue from being able to sell green products. Promoting the use of testing and labeling systems by standards-setting organizations and in the marketplace will accelerate this process, helping to produce healthier indoor environments that are more resilient to the effects of climate change.
HEALTH ISSUES RELATED TO WEATHERIZATION
Energy-efficiency upgrades and weatherization programs have the potential for altering indoor environments of homes. Such measures as sealing ducts, caulking, replacing windows, and increasing insulation may reduce energy consumption, but they may also change airflow patterns, reduce ventilation, and increase moisture and air pollution in a structure.
Effects on Indoor Environmental Quality
Box 8-1 provides examples of potential indoor environmental quality problems resulting from energy-conservation measures in buildings. Additional health or safety issues may arise as new applications are implemented by the home-remodeling industry and the emerging energy-performance industry. Even with the best intentions, indoor environmental quality issues may emerge with interventions that have not been sufficiently well screened for their effects on occupant safety and health.
Researchers have examined the effects of poor ventilation on indoor air quality. Offermann (2010) simultaneously measured indoor and outdoor VOCs, aldehyde, CO2, and PM2.5 levels, and air-exchange rates in 108 newly constructed homes in California. Of the 108 homes, 26 had intermittently operating outside makeup-air systems6 or continuously operating air-to-air heat exchangers.7 Some 57% of the homes had 24-h air-exchange rates below the 0.3 ACH recommended in ASHRAE Standard 62.28 for residential buildings, and 25% had below 0.18 ACH (Offermann, 2010). The California Office of Environmental Health Hazard Assessment (COEHHA) chronic 8-h reference exposure level (REL) for formaldehyde of 9 µg/m3 was exceeded in 98% of the homes (Offermann, 2009). COEHHA’s acute-irritation REL of 55 µg/m3 was exceeded in 28% of the homes (Wolkoff and Nielson, 2010). Of homes with less than 0.3 ACH, 37% exceeded the 55 µg/m3 acute-irritation REL for formaldehyde, and 14% of homes with more than 0.3 ACH exceeded that acute-irritation REL (Offermann, 2010). There was a significant inverse relationship (p > 0.0001) between air-exchange rate and formaldehyde concentration. ASHRAE Standard 62.2 allows the use of intermittently operating mechanical ventilation systems. In Offermann’s study, homes that had ducted outside-air systems operating intermittently when the heating or cooling systems were on could not maintain sufficient outside air to achieve the minimum ventilation recommendations (Offermann, 2010). All the homes that had continuously operating air-to-air exchangers met ASHRAE Standard 62.2 recommendations.
Offermann (2010) concluded that homes with intermittent outside ducted air did not adequately safeguard occupants against poor indoor air quality, because the homes’ coupled fresh-air makeup systems were not operated for long enough periods. That suggested that it would be appropriate to
_____________________
6 A makeup-air system replaces indoor air exhausted through an HVAC system with outdoor air.
7 Air-to-air exchangers place indoor air being exhausted from a building and outdoor air being drawn into the building in side-by-side chambers to allow the outdoor air to warm or cool to indoor levels through heat exchange.
8 ANSI/ASHRAE Standard 62.2-2010, Ventilation and Acceptable Indoor Air Quality in Low-Rise Residential Buildings.
BOX 8-1
Examples of Potential Indoor Environmental Quality Problems Resulting from Energy-Conservation Measures in Buildings
Air sealing. Steps taken to make buildings more airtight may lower ventilation rates and, in the absence of source control or the introduction of mechanical ventilation, increase both indoor-air contaminant concentrations and indoor-air humidity. Sealing also has the potential to modify internal air pressure and thus create other problems, such as deficiencies in the makeup air for combustion appliances and exhaust fans. Changing the pressure dynamics in a house can cause depressurization of the foundation or slab and lead to intrusion of soil gases and radon.
Increased insulation. Heavily insulated foundation, wall, and roof systems are more vulnerable to water intrusion, air leakage, and water-vapor migration than more traditional assemblies. Adding insulation to foundations, walls, and roof systems that currently have subacute rain seepage or condensation problems can lead to decay, mold growth, or corrosion problems. Adding insulation to the bottom side of some roof decks or to the inside of brick walls in cold and mixed climates may result in moisture problems.
Some insulation materials may contain irritating chemical compounds, such as formaldehyde in UFFI and some fiberglass insulation and hexabromocyclododecanes (HBCD) in polystyrene insulation (Harrad et al., 2010; Roosens et al., 2009). The long-term durability of spray-on polyurethane foams is of concern because their thermal degradation can generate and release hydrogen cyanide, carbon monoxide, amines, and isocyanates (Carter, 2010).
Building codes in high-risk termite areas often prohibit the use of foam-board insulation on the exterior of a foundation because it interferes with the application of soil pesticide treatments. Foam board on either the interior or exterior of a foundation also makes it difficult to inspect for signs of termite invasion, such as mud tubes (Ogg, 2006). If changes in climatic conditions lead to termites’ becoming endemic in areas of the country where they were not previously a problem, then structures that have this form of insulation could be more susceptible to infestation.
High-efficiency combustion equipment. Replacing atmospherically vented combustion equipment (such as furnaces, boilers, and water heaters) in single-family and low-rise multifamily residential buildings with at least 90% efficient combustion or electric equipment lowers the ventilation rate in basements and crawlspaces. In some buildings, that may change the indoor moisture balance and result in cold-weather condensation in the building enclosure. The lowered ventilation rate may also result in increased radon exposure.
Appearance of “legacy hazards.” Older homes may have materials that, if disturbed during renovations for energy improvements, can cause health hazards for renovation personnel and occupants. Those materials include asbestos in insulation and tiles and polychlorinated biphenyls (PCBs) in caulking. PCB-containing caulking materials—commonly used in the late 1950s though the 1970s—also pose a liability for owners of buildings constructed during that period, including schools and other public structures.
require airtight energy-efficient homes to have mechanical outdoor-air ventilation that reliably meets or exceeds ASHRAE Standard 62.2. Offermann (2010) calculated that the additional cost for fan power and heating, cooling, and dehumidification for a typical 1,764-ft2 (164-m2) home would be $100–300/year, depending on climate region and utility rates.
Epidemiologic Research on Effects of Ventilation on Health and Productivity
As Chapter 4 notes, many studies have examined the relationship between indoor air quality and occupant health, and some of these have considered ventilation—or a proxy for it—among the possible influences. A few studies have directly examined the relationship between ventilation and particular health outcomes or productivity. Mendell (1993), Godish and Spengler (1996), and Seppänen et al. (1999) have all published reviews of the literature. Most recently, Sundell and colleagues (2011) conducted a detailed evaluation of studies of ventilation rate and health or occupant productivity that have appeared in peer-reviewed journals. Table 8-2 summarizes the results of the papers that they reviewed.
The researchers concluded that an association between ventilation rates and health outcomes is biologically plausible. They found that the literature supported links between low ventilation rates and increased risk of allergies, symptoms of sick-building syndrome, and respiratory infections and suggested that “higher rates than are currently common may be health-protective in many instances” (Sundell et al., 2011). However, they noted their conclusions were based on limited data derived primary from colder climates and that there was a great need to collect information from buildings in hot and humid environments.
Several potential explanations of those health outcomes have been put forward. One possibility is that conventional HVAC-system design in air-conditioned buildings—which involves frequently wet surfaces on cooling coils, drain pans, and sometimes humidifiers—may lead to as yet uncharacterized microbiologic exposures and consequent illness (Mendell et al., 2008; Menzies et al., 2003). Poor system condition and poor maintenance increase the risk of such problems. Accumulated dust and dirt and moisture in HVAC systems provide a nutrient source and growth medium for microorganisms (Morey et al., 2009; West and Hanson, 1989).
Ventilation-system hygiene is thus a factor in ensuring good indoor air quality. A 2003 study investigated the health effects of biologic contamination of HVAC systems by examining the association between ultraviolet germicidal irradiation (UVGI) of drip pans and cooling coils in building ventilation systems and indoor microbial concentrations and self-reported symptoms in occupants (Menzies et al., 2003). The researchers system-
TABLE 8-2 Health and Productivity Outcomes Associated with Low Ventilation Rates in Buildings (Adapted from Sundell et al., 2011)
| Homes | |
|
Increased allergy symptoms |
Bornehag et al., 2005 |
|
Increased asthma symptoms |
Emenius et al., 2004; Norbäck et al., 1995 |
|
Increased bronchial obstruction |
Øie et al., 1999 |
| High-occupancy buildings | |
|
Higher rates of respiratory illnessesa |
Brundage et al., 1988; Hoge et al., 1994; Menzies et al., 2000 |
| Schools | |
|
Degraded perceptions of indoor air quality |
Wargocki et al., 2000 |
|
Increased symptoms of sick-building syndromeb |
Wargocki et al., 2002 |
|
Increased absences |
Milton et al., 2000; Shendell et al., 2004 |
|
Decreased performance in school work |
Wargocki and Wyon, 2007a,b |
|
Possible reduction in test scores |
Shaughnessey et al., 2006 |
|
Increased allergy symptoms |
Harving et al., 1993; Norbäck et al., 1995; Smedje and Norbäck, 2000; Sundell et al., 1995 |
|
Increased asthma symptoms |
Smedje and Norbäck, 2000 |
|
Increased nasal symptoms |
Wålinder et al., 1997a,b, 1998 |
| Office buildings | |
|
Degraded perceptions of indoor air quality |
Wargocki et al., 2000 |
|
Increased symptoms of sick-building Syndromec |
Apte et al., 2000; Erdmann and Apte, 2004; Jaakkola and Miettinen, 1995; Mendell et al., 2005; Stenberg et al., 1994; Sundell et al., 1994a,b; Wargocki et al., 2002 |
|
Increased absences |
Milton et al., 2000; Shendell et al., 2004 |
|
Decreased performance and productivity |
Wargocki et al., 2002a, 2004 |
|
Increased rhinovirus prevalence |
Myatt et al., 2004 |
a Evidence supporting higher rates of respiratory illness in high-occupancy buildings may be the result of confounding factors in addition to low ventilation rates.
b Sick-building syndrome (SBS) refers to a combination of nonspecific symptoms related to residence or work in a particular building. Core symptoms may include irritation of the eyes, nose, and throat; cough; dry skin; fatigue; headache; lack of concentration; and high frequency of respiratory tract infections (IOM, 2004). There is no generally agreed-on definition of SBS, and differences in the symptom lists used in various studies make it difficult to draw summary conclusions.
atically turned UVGI lamps installed in the HVAC systems of three office buildings on and off over the course of a year and collected environmental and occupant data. Fungi, bacteria, and endotoxin concentrations were measured, and building occupants who were unaware of the operating condition of the UVGI lamps filled out questionnaires on their health. Other-
environmental data (temperature, humidity, air velocity, HVAC recirculation, and concentrations of CO2, nitrogen oxides, ozone, formaldehyde, and total VOCs) and occupant data (participants’ assessment of thermal, physical, and air quality and demographic, personal, medical, and work characteristics) were also collected. Occupants reported significantly fewer work-related mucosal symptoms (adjusted odds ratio [OR], 0.7; 95% Confidence Interval [CI], 0.6–0.9) and respiratory symptoms (adjusted OR, 0.6; 95% CI, 0.4–0.9) when the UVGI lamps were on. Reports of musculoskeletal symptoms (0.8; 0.6–1.1) and systemic symptoms (headache, fatigue, or difficulty in concentrating) (1.1; 0.9–1.3) were not significantly different. Although median concentrations of viable microorganisms and endotoxins were reduced by 99% (CI, 67–100%) on surfaces exposed to UVGI, there were no significant decreases in airborne concentrations. The results suggested that limiting microbial contamination of HVAC systems might yield health benefits.
Memarzadeh and colleagues (2010), who studied health-care facilities, cautioned that UVGI disinfection of HVAC systems should not be relied on as the sole intervention used to minimize microbial contamination. The authors stated that
other factors, such as careful design of the built environment, installation and effective operation of the HVAC system, and a high level of attention to traditional cleaning and disinfection, must be assessed before a health care facility can decide to rely solely on UVGI to meet indoor air quality requirements for health care facilities.
Ventilation effectiveness, the ability of a system to provide supply air that reaches the occupants’ breathing zone and distributes conditioned air within occupied spaces to dilute and remove air contaminants (Levin, 1996; NRC, 2006), is one of those factors. The 2006 National Research Council report Green Schools: Attributes for Health and Learning found that ventilation effectiveness was—in combination with ventilation rate; filter efficiency; the control of temperature, humidity, and excess moisture; and HVAC operations, maintenance, and cleaning practices—a key factor in good indoor air quality. Experiments by Nielsen (2009) determined that air-distribution patterns with high ventilation effectiveness played an important role in minimizing airborne cross-infection in a hospital setting.
Weatherization Workforce Training in Considerations of Indoor Environmental Quality and Health
As awareness of the potential of weatherization programs to engender problems of indoor environmental quality and health has grown, initiatives have been undertaken to train the weatherization-industry workforce
to perform high-quality building retrofits that improve energy efficiency while maintaining or enhancing the health and safety of occupants. These are summarized briefly below.
In January 2011, DOE issued revised guidance for WAP participants aimed at ensuring the health and safety of weatherization workers and recipients of weatherization services (DOE, 2011). The nonprofit National Center for Healthy Housing has developed training programs for a variety of stakeholders, including designers, builders, owners, code inspectors, and public-health workers. Instruction covers new and existing single-family and multifamily buildings and includes ventilation, moisture control, dust control, integrated pest management, material emissions, and management of air-pressure relationships (NCHH, 2008). The American Lung Association of the Upper Midwest’s Healthy House program produces guidance for builders and maintains a “Preferred Products” program that lists general cleaning products, stains, finishes, and interior paints that meet standards for low end-use emissions of harmful pollutants and irritants (American Lung Association, 2011).
The Indoor Air Quality Guide: Best Practices for Design, Construction, and Commissioning was developed by ASHRAE, the American Institute of Architects, Building Owners and Managers Association International, the Sheet Metal and Air Conditioning Contractors’ Association, EPA, and the US Green Building Council. The Guide “presents best practices for design, construction and commissioning” and “provides information and tools architects and design engineers can use to achieve an IAQ-sensitive building that integrates IAQ into the design and construction process” (ASHRAE, 2009, p. XII). Its objectives for achieving good indoor air quality comprise the following:
- Manage the design and construction process to achieve good indoor air quality.
- Control moisture in building assemblies.
- Limit entry of outdoor contaminants.
- Control moisture and contaminants related to mechanical systems.
- Limit contaminants from indoor sources.
- Capture and exhaust contaminants from building equipment and activities.
- Reduce contaminant concentrations through ventilation, filtration, and air-cleaning.
- Apply more advanced ventilation approaches.
EPA developed voluntary “Healthy Indoor Environment Protocols for Home Energy Upgrades” and released a draft for public comment in late 2010 (EPA, 2010a). It focuses on indoor environmental quality issues and
identifies actions intended to “promote improved occupant health through home energy retrofits” (EPA, 2011a). DOE released a companion draft titled “Workforce Guidelines for Home Energy Upgrades,” which details work specifications for high-quality retrofits. Together, the documents are intended to help homeowners, energy auditors, and contractors perform home-energy retrofits that remediate or prevent indoor environmental health problems (EPA, 2010a). If made final and widely adopted, the documents have the potential to define future training efforts.
Buildings are complicated to operate and, to date, operating measures and guidance have been based largely on occupant comfort rather than occupant health or productivity (Sundell et al., 2011). ASHRAE Standards 62.1 and 62.2, for example, offer some guidance for ventilating buildings properly, but these are minimum levels derived from a consensus process based in the engineering, building, and equipment-manufacturing industries. Among the limitations of the current approach are the lack of integration with material-emissions data and the lag between health-science research and guideline or standards-setting processes of government, industry, and consensus groups. There is inadequate understanding of the appropriate indoor air quality design standards or the range of susceptibility inherent in the populations that work in buildings or attend schools. Persily (2010) points out that high-performance guidelines for buildings need to do a better job of addressing the issue of moisture control. Although code requirements and other documents address moisture management, many serious moisture problems persist and—as noted elsewhere in this report—climate change may well exacerbate them.
New building materials and equipment arrive on the market every day, and experience suggests that some may bring unforeseen problems of indoor environmental quality with them. Many such problems might be identified and avoided if the current process of designing and constructing buildings took a more integrated approach that included consideration of the links between indoor environmental quality and indoor and outdoor sources, ventilation, occupant comfort, and energy efficiency.
Material testing and labeling systems represent an important source of information on product emissions and a driving force in lowering emissions. Private sector, federal, and state government efforts are already yielding results as manufacturers seek the advantages that accrue from being able to sell green products. Promoting the use of testing and labeling systems by standards-setting organizations and in the marketplace will accelerate this process, helping to produce healthier indoor environments that are more resilient to the effects of climate change.
Research aimed at developing guidance is needed to address these situations. In addition, weatherization programs should incorporate tracking mechanisms to identify problems of indoor environmental quality problems as they arise and solutions as they are developed and implemented.
On the basis of its review of the papers, reports, and other information presented in this chapter, the committee has reached the following conclusions regarding building ventilation, weatherization, and energy-use issues:
- Research indicates that poor ventilation in homes, offices, and schools is associated with occupant health problems and lower productivity. However, the information base is inadequate, and studies in hot and humid climates are lacking.
- Proper design, operation, hygiene, and maintenance of HVAC systems contribute to lower microbial contamination, decreased disease incidence, and increased occupant productivity.
- Climate change may make ventilation problems more common or more severe in the future by stimulating the implementation of energy-efficiency (weatherization) measures that limit the exchange of indoor air with outdoor air.
- Government and consensus organizations are beginning to recognize the importance of this issue and have established or are establishing voluntary guidelines and codes that account for the links between energy efficiency, indoor environmental quality, ventilation, and occupant health and productivity. Problems will persist until the weatherization workforce is properly trained to recognize and avoid problems of indoor environmental quality, the efficacy of guidelines and codes is validated, and they are widely implemented.
- Introduction of new materials and weatherization techniques may lead to unexpected exposures and health risks. Energy-efficiency programs must therefore take emissions of building materials and products into account and incorporate tracking mechanisms to identify problems of indoor environmental quality as they arise and solutions as they are developed and implemented.
AQS. 2009a. Building rating systems (certification programs): A comparison of key programs. http://www.aerias.org/uploads/2009.12.09_Green_Building_Programs_Comparison_PUBLISHED.pdf (accessed February 17, 2011).
AQS (Air Quality Sciences, Inc.) 2009b. Primary green product standards and certification programs: A comparison. http://www.aerias.org/uploads/2009.03.WP.GreenProdCertProgCompare.pdf (accessed February 17, 2011).
American Lung Association. 2011. Healthy house program. http://www.alaw.org/air_quality/healthy_house_programs (accessed January 19, 2011).
Apte MG, Fisk WJ, Daisey JM. 2000. Associations between indoor CO2 concentrations and sick building syndrome symptoms in US office buildings: An analysis of the 1994-1996 BASE study data. Indoor Air 10:246-257.
ASHRAE (American Society of Heating, Refrigerating and Air-Conditioning Engineers). 2009. Indoor air quality guide: The best practices for design, construction and commissioning. Atlanta, GA: ASHRAE.
Babich M, Danello MA, Hatlelid K, Matheson J, Saltzman L, Thomas T. 2010. CPSC staff preliminary evaluation of drywall chamber test results. US Consumer Product Safety Commission. http://citeseerx.ist.psu.edu/viewdoc/download?doi=10.1.1.161.6951&rep=rep1&type=pdf (accessed February 17, 2011).
Bornehag CG, Sundell J, Hägerhed-Engman L, Sigsgaard T. 2005 Association between ventilation rates in 390 Swedish homes and allergic symptoms in children. Indoor Air 15:275-280.
Brundage JF, Scott RM, Lednar WM, Smith DQ, Miller RN. 1988. Building-associated risk of febrile acute respiratory diseases in Army trainees. Journal of the American Medical Association 259(14):2108-2112.
Build It Green. 2011. GreenPoint rated: Your assurance of a better place to live. http://www.builditgreen.org/greenpoint-rated/ (accessed May 4, 2011).
Carter J. 2010. Making green jobs safe jobs: A case study—The safe use of spray polyurethane foam (SPF). PowerPoint presented at the Good Jobs Green Jobs Conference, Washington, DC. http://www.osha.gov/dep/greenjobs/osha_greenjobs_conference_may2010.ppt (accessed March 4, 2011).
Chan WR, Price PN, Sohn MD, Gadgil AJ. 2003. Analysis of US Residential Air Leakage Database. Berkeley, CA: Lawrence Berkeley National Laboratory.
CPUC (California Public Utilities Commission). 2008. California long term energy efficiency strategic plan: Achieving maximum energy savings for 2009 and beyond. San Francisco, CA: CPUC.
Cummings JB, Tooley JJ, Jr. 1989. Infiltration rates and pressure differences in Florida homes caused by closed interior doors when the central air handler is on. In Proceedings of the 14th Passive Solar Conference. Denver, Colorado: American Solar Energy Society.
Cummings JB, Withers CR, Moyer N, Fairey P, McKendry B. 1996. Uncontrolled air flow in non-residential buildings. Orlando, FL: Florida Solar Energy Center.
DOE (Department of Energy). 2009. 2009 buildings energy data book. Washington, DC: DOE.
DOE. 2010. Workforce guidelines for home energy upgrades. http://www1.eere.energy.gov/wip/pdfs/workforce_guidelines_home_energy_upgrades.pdf (accessed January 11, 2011).
DOE. 2011. Weatherization program notice 11-6. Washington, DC: DOE.
ECA (European Collaborative Action, Urban Air, Indoor Environment and Human Exposure). 2010. Harmonisation framework for indoor material labeling schemes in the EU. Luxembourg: Office for Official Publications of the European. Report No. 27. http://www.eurofins.com/media/1744366/ECA_report_no_27_final%20draft.pdf (accessed February 18, 2011).
Ecolabel Index. 2011. Ecolabel index: Who’s deciding what’s green? http://www.ecolabelindex.com/ (accessed February 17, 2011).
EcoLogo Program. 2011. EcoLogo Program: Third party certification of environmentally-preferred products. http://www.environmentalchoice.com/en/ (accessed May 3, 2011).
Edwards JO, Hamilton RI. 1993. Leaks in copper tubing from cooling coils of a large air-conditioning unit. ASM International, Handbook of Case Histories in Failure Analysis 2:204-206.
Effinger J, Friedman H. 2010. Right measures. ASHRAE Journal 52(10):84, 86, 88-89.
EHHI (Environment and Human Health) Inc. 2010. The green building debate: LEED certification. where energy efficiency collides with human health. North Haven, CT: Environment & Human Health, Inc. http://www.ehhi.org/reports/leed/LEED_report_0510.pdf (accessed February 18, 2011).
Emenius G, Svartengren M, Korsgaard J, Nordvall L, Pershagen G, Wickman M. 2004. Building characteristics, indoor air quality and recurrent wheezing in very young children (BAMSE). Indoor Air 14:34-42.
Emmerich HJ, McDowell T, Anis W. 2005. Investigation of the impact of commercial building envelope airtightness on HVAC energy use. Gaithersburg, MD: National Institute of Standards and Technology.
Emmerich SJ, Persily AK. 2005. Airtightness of commercial buildings in the U.S. Gaithersburg, MD: National Institute of Standards and Technology.
Enterprise Community Partners. 2010. Enterprise green communities. http://www.greencommunitiesonline.org/about/documents/green_next_gen_fact_sheet.pdf (accessed January 11, 2011).
EPA (Environmental Protection Agency). 2007. 2006 annual report: ENERGY STAR® and other climate protection partnerships. Washington, DC: EPA.
EPA. 2010a. Healthy indoor environment protocols for home energy upgrades. http://www.epa.gov/iaq/pdfs/epa_retrofit_protocols_draft_110910.pdf (accessed January 11, 2011).
EPA. 2010b. ENERGY STAR. http://www.energystar.gov/index.cfm?c=about.ab_history (accessed January 11, 2011).
EPA. 2011a. Draft protocols for home energy upgrades. http://www.epa.gov/iaq/homes/retrofits.html (accessed January 30, 2011).
EPA. 2011b. Should you have the air ducts in your home cleaned? http://www.epa.gov/iaq/pubs/airduct.html (accessed February 28, 2011).
Erdmann CA, Apte MG. 2004. Mucous membrane and lower respiratory building related symptoms in relation to indoor carbon dioxide concentrations in the 100-building BASE dataset. Indoor Air 14(Suppl 8):127-134.
European Commission Environment. 2011. REACH. http://ec.europa.eu/environment/chemicals/reach/reach_intro.htm (accessed May 4, 2011).
Fischer D. 2010. Do green building standards minimize health concerns? Scientific American online, June 7, 2010. http://www.scientificamerican.com/article.cfm?id=do-green-building-standards-minimize-health-cooncerns [sic] (accessed February 18, 2011).
FTC (US Federal Trade Commission). 2010. Request for public comment on proposed, revised guides for the use of environmental marketing claims. http://www.ftc.gov/os/fedreg/2010/october/101006greenguidesfrn.pdf (accessed February 19, 2011).
Fuller M, Kunkel C, Zimring M, Hoffman I, Soroye KL, Goldman C. 2010. Driving demand for home energy improvements. Berkeley, CA: Lawrence Berkeley National Laboratory (LBNL).
Godish T, Spengler JD. 1996. Relationships between ventilation and indoor air quality: A review. Indoor Air 6:135-145.
Goldman CA, Fuller MC, Stuart E. 2010. Energy efficiency services sector: Workforce size and expectations for growth. Berkeley, CA: Lawrence Berkeley National Laboratory.
Green Seal. 2010. The original Green Seal of approval since 1989. http://www.greenseal.org/Home.aspx (accessed May 3, 2011).
Harrad S, de Wit CA, Abdallah MA, Bergh C, Björklund JA, Covaci A, Darnerud PO, de Boer J, Diamond M, Huber S, Leonards P, Mandalakis M, Ostman C, Haug LS, Thomsen C, Webster TF. 2010. Indoor contamination with hexabromocyclododecanes, polybrominated diphenyl ethers, and perfluoroalkyl compounds: An important exposure pathway for people? Environmental Science & Technology 34(9):3221-3231.
Harving H, Korsgaard J, Dahl R. 1993. House-dust mites and associated environmental conditions in Danish homes. Allergy 48:106-109.
Hoge CW, Reichler MR, Dominguez EA, Bremer JC, Mastro TD, Hendricks KA, Musher DM, Elliott JA, Facklam RR, Breiman RF. 1994. An epidemic of pneumococcal disease in an overcrowded, inadequately ventilated jail. New England Journal of Medicine 331(10):643-648.
Hooper DG, Shane J, Straus DC, Kilburn KH, Bolton V, Sutton JS, Guilford FT. 2010. Isolation of sulfur reducing and oxidizing bacteria found in contaminated drywall. International Journal of Molecular Sciences 11(2):647-655.
IOM (Institute of Medicine). 2004. Damp indoor spaces and health. Washington, DC: The National Academies Press.
Jaakkola JJK, Miettinen P. 1995. Ventilation rate in office buildings and sick building syndrome. Occupational Environmental Medicine 52:709-714.
Jensen B, Wolkoff P. 1996. VOCBASE. Denmark: National Institution of Occupational Health.
Kephalopoulos S, Koistinen K, Kotzias D. 2005. Urban air, indoor environment and human exposure. environment and quality of life report No 24: Harmonisation of indoor material emissions labeling systems in the EU. Inventory of existing schemes. Italy: European Commission. http://www.inive.org/medias/ECA/ECA_Report24.pdf (accessed February 18, 2011).
LEED (Leadership in Energy and Environmental Design). 2010. LEED public policies. Updated: 09/24/10. https://www.usgbc.org/ShowFile.aspx?DocumentID=7922 (accessed February 17, 2011).
LEED. 2011. LEED 2009 for new construction and major renovations. Updated February 2011. http://www.usgbc.org/ShowFile.aspx?DocumentID=8868 (accessed February 17, 2011).
Levin H. 1996. Best sustainable indoor air quality practices in commercial buildings. November 19, 1996, presentation at the Third Annual Green Buildings Conference and Exhibition. San Diego, CA. http://www.buildingecology.com/articles/best-sustainableindoor-air-quality-practices-in-commercial-buildings/ (accessed March 9, 2011).
Levin H. 2010. National programs to assess IEQ effects of building material and products. Washington, DC: EPA Indoor Environments Division. http://www.epa.gov/iaq/pdfs/hal_levin_paper.pdf (accessed February 18, 2011).
Memarzadeh F, Olmsted RN, Bartley JM. 2010. Applications of ultraviolet germicidal irradiation disinfection in health care facilities—Effective adjunct, but not stand-alone technology. American Journal of Infection Control 38(5 Suppl 1):S13-S24.
Mendell MJ. 1993. Non-specific symptoms in office workers: A review and summary of the epidemiologic literature. Indoor Air 3:227-236.
Mendell MJ, Lei Q, Apte MG, Fisk WJ. 2005. Outdoor air ventilation and work-related symptoms in U.S. office buildings—Results from the BASE study. Berkeley, CA: Lawrence Berkeley National Laboratories.
Mendell MJ, Lei-Gomez Q, Mirer AG, Seppänen O, Brunner G. 2008. Risk factors in heating, ventilating, and air-conditioning systems for occupant symptoms in US office buildings: The US EPA BASE study. Indoor Air 18(4):301-316.
Menzies D, Fanning A, Yuan L, FitzGerald JM; Canadian Collaborative Group in Nosocomial Transmission of TB. 2000. Hospital ventilation and risk for tuberculous infection in Canadian health care workers. Annals of Internal Medicine 133:779-789.
Menzies D, Popa J, Hanley JA, Rand T, Milton DK. 2003. Effect of ultraviolet germicidal lights installed in office ventilation systems on workers’ health and wellbeing: Double-blind multiple crossover trial. Lancet 362(9398):1785-1791.
Mills E. 2009. Building commissioning: A golden opportunity for reducing energy costs and greenhouse gas emissions. Berkeley, CA: Lawrence Berkeley National Laboratory.
Milton DK, Glencross PM, Walters MD. 2000. Risk of sick leave associated with outdoor air supply rate, humidification, and occupant complaints. Indoor Air 10(4):212-221.
Morey PR, Rand T, Phoenix T. 2009. On the penetration of mold into the fiberboard used in HVAC ductwork. Healthy Buildings, page 4. Syracuse, NY.
Morey PR. 2010. Climate change and potential effects on microbial air quality in the built environment. Washington, DC: EPA.
Mowris RJ, Fisk WJ. 1988. Modeling the effects of exhaust ventilation on radon entry rates and indoor radon concentrations. Health Physics 54(5):491-501.
Myatt TA, Johnston SL, Zuo Z, Wand M, Kebadze T, Rudnick S, Milton DK. 2004. Detection of airborne rhinovirus and its relation to outdoor air supply in office environments. American Journal of Respiratory and Critical Care Medicine 169:1187-1190.
NCHH (National Center for Healthy Housing). 2008. National Center for Healthy Housing. http://www.nchh.org/LinkClick.aspx?fileticket=rs1iUR2e%2F%2FA%3D&tabid=298 (accessed January 19, 2011).
Nielsen PV. 2009. Control of airborne infectious diseases in ventilated spaces. Journal of the Royal Society–Interface 6(Suppl 6):S747-S755.
NRC (National Research Council). 2006. Green schools: Attributes for health and learning. Washington, DC: The National Academies Press.
NRC. 2010. Certifiably sustainable?: The role of third-party certification systems: Report of a workshop. Washington DC: The National Academies Press.
Nevius M, Eldridge R, Krouk J. 2010. The state of the efficiency program industry: Budgets, expenditures, and impacts 2009. Boston MA: Consortium for Energy Efficiency.
Norbäck D, Björnsson E, Janson C, Widström J, Boman G. 1995. Asthmatic symptoms and volatile organic compounds, formaldehyde, and carbon dioxide in dwellings. Occupational and Environmental Medicine 52:388-395.
Offermann FJ. 2009. Ventilation and indoor air quality in new homes. Collaborative Report. CEC-500-2009-085. PIER Energy-Related Environmental Research Program. Sacramento, CA: California Air Resources Board and California Energy Commission.
Offermann FJ. 2010. IAQ in airtight homes. ASHRAE Journal 52(11):58-60.
Ogg NJ. 2006. Use of foam insulation below grade may provide access to subterranean termites. Pendleton, SC: Clemson University.
Øie L, Nafstad P, Botten G, Magnus P, Jaakkola JJK. 1999. Ventilation in homes and bronchial obstruction in young children. Epidemiology 10:294-299.
Persily AK, Norford LK. 1987. Simultaneous measurements of infiltration and intake in an office building. ASHRAE Transaction 93(2):942-956.
Persily AK, Emmerich SJ. 2009. Effects of air infiltration and ventilation. In Moisture control in buildings: The key factor in mold prevention—2nd edition, edited by Trechsel HR, Bomberg MT. West Conshohocken, PA: ASTM International.
Persily AK. 2010. Indoor air quality guide—Best practices for design, construction and commissioning. May 14, 2009, presentation to the Federal Interagency Committee on Indoor Air Quality. Washington, DC.
Preziosi P, Czernichow S, Gehanno P, Hercberg S. 2004. Workplace airconditioning and health services attendance among French middle-aged women: A prospective cohort study. International Journal of Epidemiology 33:1120-1123.
Rim D, Novoselac A. 2010. Ventilation effectiveness as an indicator of occupant exposure to particles from indoor sources. Building and Environment 45(5):1214-1224.
Roosens L, Abdallah MA, Harrad S, Neels H, Covaci A. 2009. Exposure to hexabromocyclododecanes (HBCDs) via dust ingestion, but not diet, correlates with concentration in human serum—Preliminary results. Environmental Health Perspectives 117(11):1707-1712.
Seppänen OA, Fisk WJ, Mendell MJ. 1999. Association of ventilation rates and CO2 concentrations with health and other responses in commercial and institutional buildings. Indoor Air 9:226-252.
Shaughnessy RJ, Haverinen-Shaughnessy U, Nevalainen A, Moschandreas D. 2006. A preliminary study on the association between ventilation rates in classrooms and student performance. Indoor Air 16(6):465-468.
Shaw CY. 1995. Maintaining acceptable air quality in office buildings through ventilation. Ottawa, Ontario: National Research Council Canada Institute for Research in Construction.
Shendell DG, Prill R, Fisk WJ, Apte MG, Blake D, Faulkner, D. 2004. Associations between classroom CO2 concentrations and student attendance in Washington and Idaho. Indoor Air 14(5):333-341.
Sherman MH, McWilliams J. 2007. Air leakage of US homes: Model prediction. Orlando, FL: Lawrence Berkeley National Laboratory.
Smedje G, Norbäck D. 2000. New ventilation systems at select schools in Sweden—Effects on asthma and exposure. Archives of Environmental Health 55:18-25.
Spengler JD. 2010. Personal communication.
Srebric J. 2010. Opportunities for green building (GB) grating systems to improve indoor air quality credits and to address changing climatic conditions. Washington, DC: EPA Indoor Environments Division. http://www.epa.gov/iaq/pdfs/jelena_draft_paper_11-4-10.pdf (accessed February 18, 2011).
Stenberg B, Eriksson M, Hoog J, Sundell J, Wall S. 1994. The sick building syndrome (SBS) in office workers. A case-referent study of personal, psychosocial and building-related risk indicators. International Journal of Epidemiology 23(6):1190-1197.
Sundell J, Lindvall T, Stenberg B, Wall S. 1994b. Sick building syndrome (SBS) in office workers and facial skin symptoms among VDT-workers in relation to building and room characteristics: Two case-referent studies. Indoor Air 4:83-94.
Sundell J, Lindvall T, Stenberg B. 1994a. Associations between type of ventilation and air flow rates in office buildings and the risk of SBS-symptoms among occupants. Environmental International 20:239-251.
Sundell J, Wickman M, Pershagen G, Nordvall SL. 1995. Ventilation in homes infested by house-dust mites. Allergy 50:106-112.
Sundell J, Levin H, Nazaroff WW, Cain WS, Fisk WJ, Grimsrud DT, Gyntelberg F, Li Y, Persily AK, Pickering AC, Samet JM, Spengler JD, Taylor ST, Weschler CJ. 2011. Ventilation rates and health: Multidisciplinary review of the scientific literature. Indoor Air 21(3):191-204.
Wålinder R, Norbäck D, Wieslander G, Smedje G, Erwall C. 1997a. Nasal congestion in relation to low air exchange rate in schools. Acta Oto-laryngologica 117:724-727.
Wålinder R, Norbäck D, Wieslander G, Smedje G, Erwall C. 1997b. Nasal mucosal swelling in relation to low air exchange rate in schools. Indoor Air 7:198-205.
Wålinder R, Norbäck D, Wieslander G, Smedje G, Erwall C, Venge P. 1998. Nasal patency and biomarkers in nasal lavage—The significance of air exchange rate and type of ventilation in schools. International Archives of Occupational and Environmental Health 71:479-486.
WAP (Weatherization Assistance Program). 2009a. Plans, implementation, and results. http://www1.eere.energy.gov/wip/plans_implementation_results.html (accessed January 11, 2011).
WAP. 2009b. Weatherization assistance program. http://www1.eere.energy.gov/wip/wap.html (accessed January 11, 2011).
WAP. 2010. The American Recovery and Reinvestment Act and the weatherization assistance program. http://www.waptac.org/WAP-Basics/Recovery-Act.aspx (accessed January 11, 2011).
Wargocki P, Wyon DP, Ole Fanger P. 2000. Productivity is affected by the air quality in offices. Proceedings of Healthy Buildings 2000 1:635-640.
Wargocki P, Lagercrantz L, Witterseh T, Sundell J, Wyon DP, Fanger PO. 2002a. Subjective perceptions, symptom intensity, and performance: A comparison of two independent studies, both changing similarly the pollution load in an office. Indoor Air 12(2):74-80.
Wargocki P, Sundell J, Bischof W, Brundrett G, Fanger PO, Gyntelberg F, Hanssen SO, Harrison P, Pickering A, Seppänen O, Wouters P. 2002b. Ventilation and health in nonindustrial indoor environments: Report from a European multidisciplinary scientific consensus meeting (EUROVEN). Indoor Air 12:113-128.
Wargocki P, Wyon DP, Fanger PO. 2004. The performance and subjective responses of call-center operators with new and used supply air filters at two outdoor air supply rates. Indoor Air 14(Suppl 8):7-16.
Wargocki P, Wyon DP. 2007a. The effect of moderately raised classroom temperatures and classroom ventilation rate on the performance of schoolwork by children. HVAC&R Research 13(2):193-220.
Wargocki P, Wyon DP. 2007b. The effects of outdoor air supply rate and supply air filter condition in classrooms on the performance of schoolwork by children. HVAC&R Research 13(2):165-191.
West M, Hansen E. 1989. Determination of material hygroscopic properties that affect indoor air quality. In IAQ 89, the human equation: Health and comfort, ASHRAE. Atlanta, GA: ASHRAE.
WGBC (World Green Building Council). 2011. Directory of councils. http://www.mt.worldgbc.org/green-building-councils/gbc-directory (accessed February 17, 2011).
Willem H, Singer BC. 2010. Chemical emissions of residential materials and products: Review of available information. Berkeley, CA: Lawrence Berkeley National Laboratory. http://epb.lbl.gov/publications/lbnl-3938E.pdf (accessed February 18, 2011).
Wolkoff P, Nielsen GD, Hansen LF, Albrechtsen O, Johnsen CR, Heinig JH, Franck C, Nielsen PA. 1991. Study of human reactions to emissions from building materials in climate chambers. Part II: VOC measurements, mouse bioassay, and decipol evaluation in the 1–2 mg/m3 TVOC range. Indoor Air 1(4):389-403.
Wolkoff P, Nielsen PA. 1995. A new approach for indoor climate labeling of building materials—Emission testing, modeling, and comfort evaluation. Atmospheric Environment 30(15):2679-2689.
Wolkoff P, Nielson GD. 2010. Non-cancer effects of formaldehyde and relevance for setting an indoor air guideline. Environment International 36(7):788-799.
WRI (World Resources Institute). 2010. 2010 global ecolabel monitor. http://www.ecolabelindex.com/downloads/Global_Ecolabel_Monitor2010.pdf (accessed February 17, 2011).


