Below are the first 10 and last 10 pages of uncorrected machine-read text (when available) of this chapter, followed by the top 30 algorithmically extracted key phrases from the chapter as a whole.
Intended to provide our own search engines and external engines with highly rich, chapter-representative searchable text on the opening pages of each chapter.
Because it is UNCORRECTED material, please consider the following text as a useful but insufficient proxy for the authoritative book pages.
Do not use for reproduction, copying, pasting, or reading; exclusively for search engines.
OCR for page 331
Appendix C
Cost and Technical Evaluation of Priority Missions
BACKGROUND
Concerns have been voiced for some time about the accuracy of the mission cost estimates used in past decadal
studies. A National Research Council (NRC) report published in 2006 concluded that “major missions in space and
Earth science are being executed at costs well in excess of the costs estimated at the time when the missions were
recommended in the National Research Council’s decadal surveys for their disciplines. Consequently, the orderly
planning process that has served the space and Earth science communities well has been disrupted, and balance
among large, medium, and small missions has been difficult to maintain.”1 In response to this concern, the same
report recommended that “NASA should undertake independent, systematic, and comprehensive evaluations of
the cost-to-complete of each of its space and Earth science missions that are under development, for the purpose
of determining the adequacy of budget and schedule.”2
An extended discussion of cost estimates and of the technology readiness of candidate missions took place
during a subsequent NRC workshop concerning lessons learned from past decadal surveys. Workshop participants
found that cost and technology readiness evaluations that were conducted independently of NASA estimates would
add value to the surveys. They also suggested that uniform cost-estimating methods should be used within a given
survey to facilitate cost comparisons among initiatives.3
With this guidance in hand, NASA called for an independent evaluation of cost and technology readiness in the
statement of task for the NRC assessment of the agency’s Beyond Einstein program. 4 Finally, in an act codifying
the decadal surveys, Congress mandated that the NRC “include independent estimates of the life cycle costs and
technical readiness of missions assessed in the decadal survey wherever possible.”5 Therefore, the statements of task
for the most recent astronomy decadal survey,6 for this study (see Appendix A), and for the heliophysics decadal
survey currently in progress all call for independent cost and technical evaluations of recommended initiatives.
THE CHALLENGE OF COST, SCHEDULE, AND TECHNICAL ESTIMATES
The mission concepts used in decadal surveys are typically in preliminary stages of development. In NASA
parlance these are “pre-Phase A concepts.” Experience shows that the cost of a space mission is usually not well
understood until its preliminary design review (PDR) has been completed. Even then, unexpected growth of mass,
cost, and schedule can occur during the later phases of design and development. Further challenging costing is the
fact that some pre-Phase A concepts are more mature than others because more resources have been devoted to
331
OCR for page 332
332 VISION AND VOYAGES FOR PLANETARY SCIENCE
their formulation. Accordingly, ensuring that a costing exercise is level and fair requires that the relative maturity
of concepts be taken into account.
Several different types of cost, schedule, and technical risk evaluations are used when discussing spacecraft
missions. The best known are the so-called independent cost estimates (ICEs) and NASA’s technical, management,
and cost (TMC) estimates. Less well known is the cost and technical evaluation (CATE) process. Each has its own
strengths and weaknesses (Table C.1).
ICEs are typically done late in the life cycle of a project after it has matured. ICEs often do not consider certain
aspects of cost growth associated with design evolution in the earliest phases of a project. The objective of the
CATE process is to perform a cost and technical risk analysis for a set of concepts that may have a broad range
of maturity, and to ensure that the analysis is consistent, fair, and informed by historical data. Typically, a concept
evaluated using the CATE process is early in its life cycle and therefore likely to undergo significant subsequent
design changes. Historically, such changes have resulted in cost growth. Therefore, a robust process is required
that fairly treats a concept of low maturity relative to one that has undergone several iterations and review. CATEs
take into account several components of risk assessment (see Table C.1).
Because the CATE is best suited to the comparative evaluation of a family of pre-Phase A concepts, it is the
methodology used in this decadal survey.
OVERVIEW OF THE CATE PROCESS
The NRC engaged the services of the Aerospace Corporation to perform independent CATEs of mission
concepts identified by the committee’s steering group during this study. Aerospace’s CATE team consisted of
technical, cost, and schedule experts.
The committee’s five panels identified a total of 26 missions (see the list in Appendix G) that could address
key science questions within their respective purviews. To ensure that the mission concepts were sufficiently mature
for subsequent evaluation by the CATE team, the committee commissioned technical studies at leading design
centers, including the Jet Propulsion Laboratory, Goddard Space Flight Center, the Johns Hopkins University
Applied Physics Laboratory, and Marshall Space Flight Center. The committee’s steering group selected concepts
to be studied from among those recommended by the panels. One or more “science champions” drawn from the
ranks of the panels were attached to each of the centers’ study teams to ensure that the concepts remained true to
the scientific and measurement objectives of the originating panel.
The design centers conducted two different types of studies: rapid mission architecture (RMA) studies and
full mission studies. The RMA studies were conducted for immature but promising concepts for which a broad
array of mission types could be evaluated in order to choose the one most promising approach. The resulting
TABLE C.1 Similarities and Differences in Three Methodologies for Assessing the Technical, Cost, and Risk
Characteristics of Spacecraft Missions
Approach
TMC ICE CATE
Is approach used consistently to compare several concepts? Yes No Yes
Concept cost is evaluated with respect to what? Cost cap Project budget Budget wedge
Maturity of concept occurs when? Phase A-B Phase B-D Pre-Phase A
Does the evaluation process include:
Quantified schedule growth cost threat? No Typically Yes
Quantified design growth cost threat? No No Yes
Cost threat for increase in launch vehicle capability? No No Yes
Independent estimates for non-U.S. contributions? No No Yes
Reconciliation performed with project team? No Yes No
Technical and cost risk rating (low, medium, high)? Yes No Yes
NOTE: TMC, technical, management, and cost; ICE, independent cost estimate; CATE, cost and technical evaluation.
OCR for page 333
333
APPENDIX C
“point design” could then be subjected to a full mission study along with more mature concepts. Not all missions
receiving RMA studies were selected by the steering group for full mission studies. Nor were all full mission
studies selected for CATEs.
Prior to concepts being submitted to the CATE contractor, significant evaluations of trade-offs were conducted,
led by panel science champions, to initially determine the science value or science return for an initial cost estimate
as determined by the relevant design center. It was understood that these numbers were rough orders of magnitude.
In some cases, a down-selection was made between two planetary bodies (Uranus and Neptune as an example), and
then more detailed work was performed prior to submission of the concept to the CATE contractor for evaluation.
A key aspect of the CATE process is that there were multiple interactions between the committee and the
CATE contractor. For at least four concepts, the CATE contractor was redirected to consider alternative solutions,
as defined by the committee, that would lower cost and risk but maintain science return. This last step or itera-
tion was considered confidential to the committee; it was deemed unnecessary for NASA to participate in these
iterations in view of the experience of the committee members and the experience and knowledge of the CATE
contractor. The committee believes that this iterative process ensured a tighter correspondence between science
priorities and prioritized missions.
The 13 most promising full mission studies were identified by the steering group and passed to the CATE team
for detailed technical, cost, and schedule assessments. These “priority missions” are listed below in the section titled
“CATE Results for Priority Missions.” When follow-up was required, the CATE team worked with the appropriate
science champion to request additional information. The members of the CATE team worked interactively to deter-
mine an initial assessment of technical risk and cost and schedule estimates for each of the 13 priority missions.
(Two of these 13 missions have a two-part assessment: Mars Astrobiology Explorer-Cacher and Mars Astrobiology
Explorer-Cacher Descope, and Uranus Orbiter and Probe with Solar-Electric Propulsion [SEP] and Uranus Orbiter
and Probe with No SEP.) The CATE team strove, to the greatest extent possible, to be consistent across all concepts
presented. In particular, recognizing that the design center that studied the mission might not be the one that ulti-
mately implements it, the CATE process made no assumptions about what would be the implementing organization.
Following an initial internal review within the Aerospace Corporation to ensure that the 13 assessments were
mutually consistent, the results were presented to the committee. The committee provided feedback to the CATE
team, which in turn, incorporated this feedback into revised technical, cost, and schedule risk assessments.
The CATE team’s approach (Figure C.1) is based on the following principles:
• Use multiple methods and databases relating to past space systems so that no one model or database biases
the results. The CATE team used proprietary Aerospace Corporation models (e.g., the Small Satellite Cost Model)
and space-industry standards (e.g., the NASA/Air Force Cost Model [NAFCOM]).
• Use analogy-based estimating; tie costs and schedule estimates to NASA systems that have already been
built and that thus have a known cost and schedule.
• Use both system-level estimates as well as build-up-to-system-level estimates by appropriately summing
subsystem data so as not to underestimate system cost and complexity.
• Use cross-checking tools, such as Complexity Based Risk Assessment (CoBRA), to cross-check cost and
schedule estimates for internal consistency and risk assessment.
• In an integrated fashion, quantify the total threats to costs from schedule growth, the costs of maturing
technology, and the threat of costs owing to mass growth resulting in the need for a larger, more costly launch
vehicle.
In summary, an analogy-based methodology ties the estimated costs of future systems to the known cost of
systems that have been built. In other words, it provides an independent estimate of the cost and complexity of new
concepts anchored with respect to previously built hardware. The use of multiple methods such as analogies and
standard cost models ensures that no one model or database biases the estimate. The use of system-level estimates
and arriving at total estimated costs by statistically summing the costs of all individual work breakdown structure
elements ensures that elements are not omitted and that the system-level complexity is properly represented in
the cost estimate.
OCR for page 334
334 VISION AND VOYAGES FOR PLANETARY SCIENCE
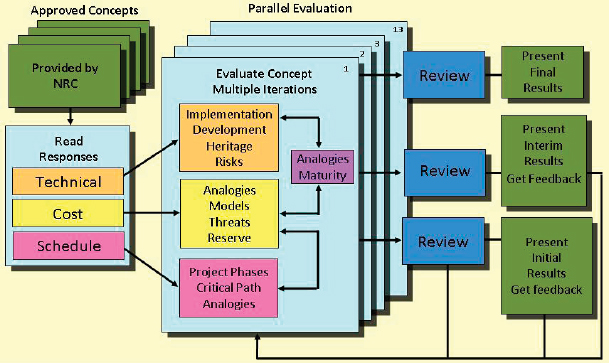
FIGURE C.1 Schematic illustration of the flow of the Aerospace Corporation’s cost and technical evaluation (CATE) process.
The blocks in green indicate interaction by the CATE team with the committee.
The assessments of technology, cost, and schedule are inextricably intertwined. However, it is easier to describe
each element of the overall assessment (e.g., technical, schedule, and cost) separately, noting in each instance the
linkages to the overall CATE assessment.
Technical Assessment
The evaluation of technical risk and maturity in the CATE process focuses on the identification of the technical
risks most important to achieving the required mission performance and stated science objectives. The assessment
is limited to top-level technical maturity and risk discussions. Deviations from the current state of the art as well as
system complexity, operational complexity, and integration concerns associated with the use of heritage components
are identified. Technical maturity and the need for specific technology development, including readiness levels
of key technologies and hardware, are evaluated by the CATE technical subgroup. During the assessment of the
technical risk areas and concept maturity, the technical subgroup interacted with the cost and schedule subgroups
so that technical risks could be translated into schedule and cost risk.
The CATE technical evaluation is limited to high-level technical risks that potentially impact schedule and cost.
The CATE process places no cost cap on mission concepts, and hence risk as a function of cost is not considered.
Concept maturity and technical risk are evaluated in terms of the ability of a concept to meet performance goals
within proposed launch dates with adequate mass, power, and performance margins.
CATEs also evaluate proposed mass and power contingencies with respect to technical maturity. If the CATE
technical subgroup concludes that these contingencies are insufficient, the contingencies are increased on the basis
of historical data on mass and power growth. In some cases, growth in mass and power requirements necessitate
the use of larger launch vehicles to execute the scientific mission. The assessments of required mass and power
OCR for page 335
335
APPENDIX C
increases—and the potential needs for more capable launch vehicles—are provided to the CATE cost and schedule
experts for incorporation in their estimates.
Schedule Estimates
To aid in the assessment of concept risk, independent schedule estimates are incorporated as part of the CATE
cost estimate. This is especially true for the assessment of risk with respect to proposed mission development
and execution timelines. Like the CATE assessment of cost risk, schedule risk is also derived from analogies in
the historical NASA record. Historical data from past analogous NASA missions, properly adjusted, are used to
gauge the realism of the proposed durations of the development phases. Similarly, the time to critical mission
reviews (e.g., PDR and critical design review [CDR]) and the time required for integration and testing are evalu-
ated for each mission concept and contrasted with appropriate historical experience. Statistical analysis is utilized
to create a schedule probability “S curve”—that is, a curve of the probability that a development time will exceed
some value as a function of that value. The overall schedule, as proposed, is then adjusted with the historical data
in mind. The independent schedule estimates are not tied to specific launch windows because the start dates for
the concepts can be adjusted and because launch dates can usually be met by additional application of resources
(e.g., double-shifting). If the schedule estimate predicted a launch date between launch windows, the cost of
additional resources is used in the independent cost estimate. However, for concepts at this early stage of formu-
lation, adding to the schedule in order to accommodate a future available launch window is not warranted. Costs
incurred because the original schedule cannot be met are then added to the total cost of the mission. The committee
requested that the CATE team use the 70th percentile value in its schedule estimate—i.e., there is a 70 percent
probability that the schedule will be shorter than indicated and a 30 percent probability that it will be longer.
Cost Appraisal
The primary goal of the CATE cost appraisal is to provide independent estimates (in fiscal year [FY] 2015
dollars) that can be used to prioritize various concepts within the context of the expected NASA budgetary con-
straints for the coming decade (see Appendix E). The CATE team developed high-level cost estimates based on
the information provided by the various mission study teams with a focus on treating all projects equally. To be
consistent for all concepts, the CATE cost process allows an increase in cost resulting from increased contingency
mass and power, increased schedule, increased required launch vehicle capability, and other cost threats depending
on the concept maturity and specific risk assessment of a particular concept.
All cost appraisals for the CATE process are probabilistic in nature and are based on the NASA historical
record and documented project life-cycle growth studies. Traditional S curves of cost probability versus cost are
provided for each concept, with both the design center’s estimate and the CATE estimate at the 70th percentile
requested by the committee indicated.
The focus of the CATE costing process is to estimate the cost of conceptual hardware—for example, instru-
ments, spacecraft bus, landers—using multiple analogies and cost models based on historical data. A probabi-
listic cost-risk analysis is employed to estimate appropriate cost reserves. Ensuring consistency across the range
of concepts—from those that are immature to those that are significantly more mature—the cost estimates are
updated and adjusted with information from the CATE team’s technical subgroup with respect to mass and power
contingencies, and potentially required additional launch vehicle capability. Using independent schedule estimates,
costs are adjusted using appropriate “burn rates” to properly reflect the impact of schedule changes.
Finally, the results are integrated, cross-checked with other independent cost- and schedule-estimating capa-
bilities, and verified for consistency before being presented to the committee (Figure C.2).
Complexity-Based Risk Assessment Comparisons
The cost and schedule estimates for the committee’s priority missions are compared to historical experience
by plotting cost and schedule as a function of the estimated complexity of the mission—resulting in a CoBRA
OCR for page 336
336 VISION AND VOYAGES FOR PLANETARY SCIENCE
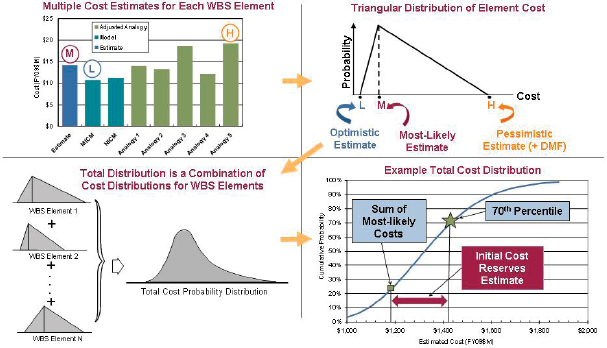
FIGURE C.2 Schematic illustration of the process of developing cost versus cumulative risk probability S curve for a notional
mission. The terms MICM and NICM in the upper-left quadrant refer to NASA-developed instrument cost models.
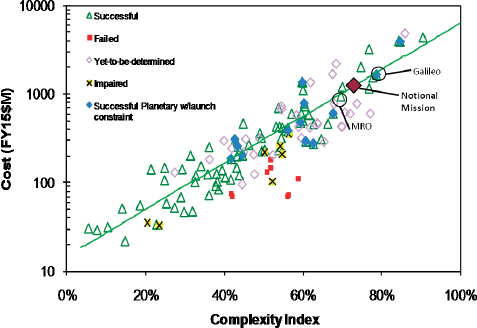
FIGURE C.3 Complexity Based Risk Assessment cost analysis superimposing the cost of a notional mission on historical data
of cost versus complexity. A similar analysis can be performed plotting a schedule against complexity.
OCR for page 337
337
APPENDIX C
plot (Figure C.3). Such an analysis shows the locus of a notional mission compared to the historical experience
of complexity versus cost for other missions. The expectation is that a proposed mission is on the road to success
if the locus of the cost (and schedule) versus complexity point lies in the vicinity of the data for successful mis-
sions in the past.
CATE RESULTS FOR PRIORITY MISSIONS
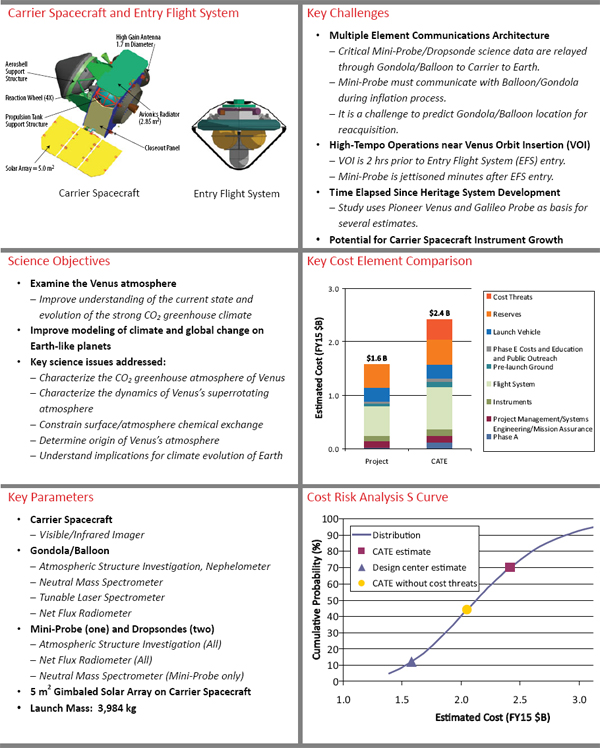
Results for the priority missions selected by the committee and analyzed using the Aerospace Corporation’s
CATE methodology are presented in Boxes C.1 through C.15 (in approximate order of the target object’s distance
from the Sun). The full text of the studies for each of the missions is provided on the CD included with this report.
Acronyms used in Boxes C.1 through C.15 are defined in Appendix F. Images of the missions were obtained from
the respective mission studies. The missions are as follows:
• Venus Climate Mission (Box C.1);
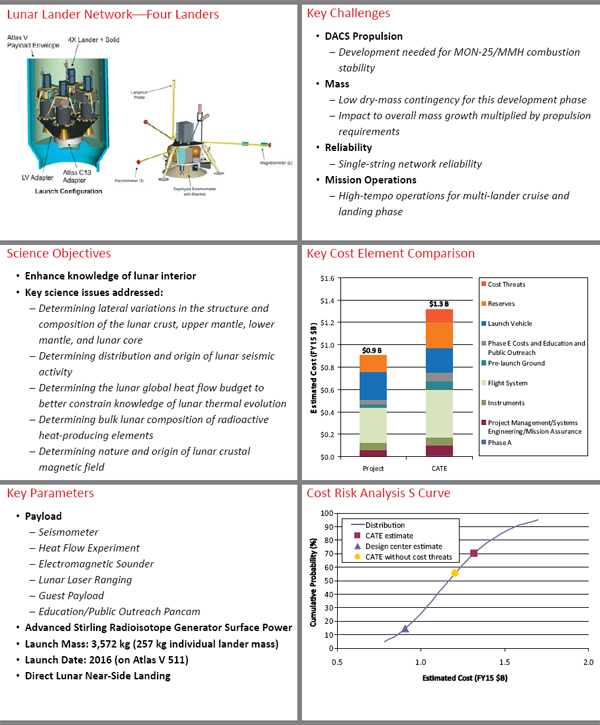
• Lunar Geophysical Network (Box C.2);
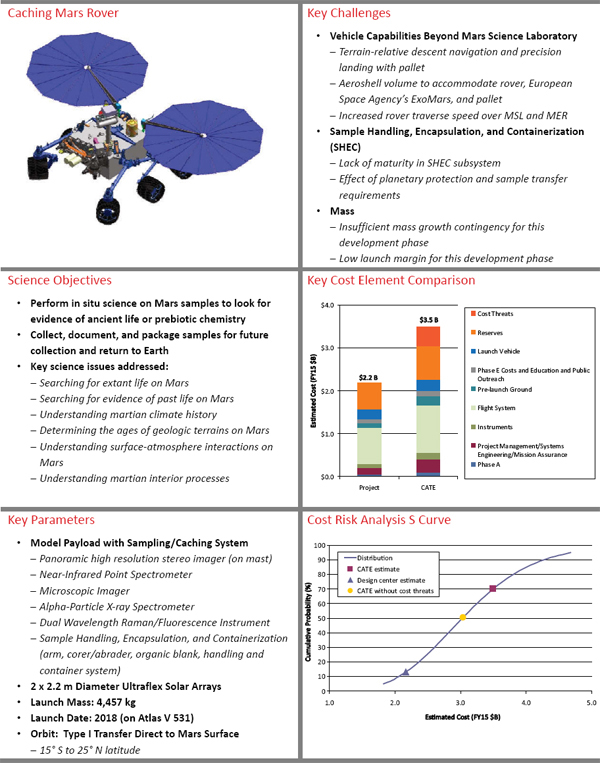
• Mars Astrobiology Explorer-Cacher (Box C.3);
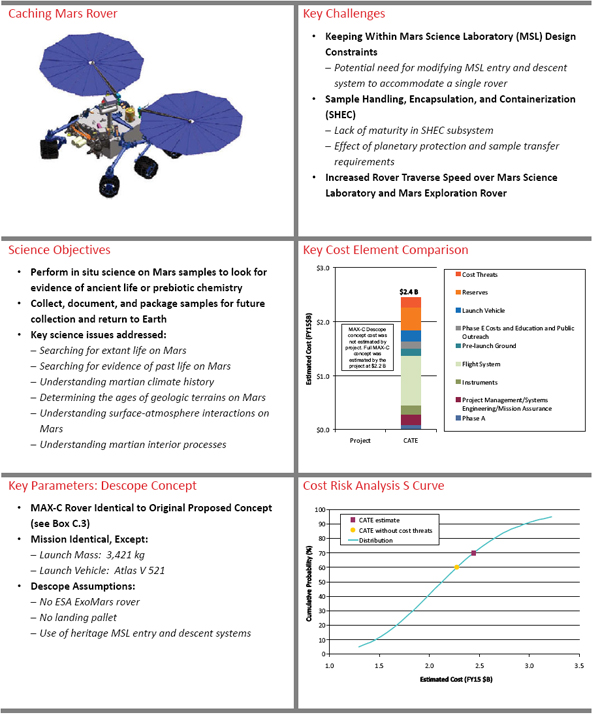
• Mars Astrobiology Explorer-Cacher Descope (Box C.4);
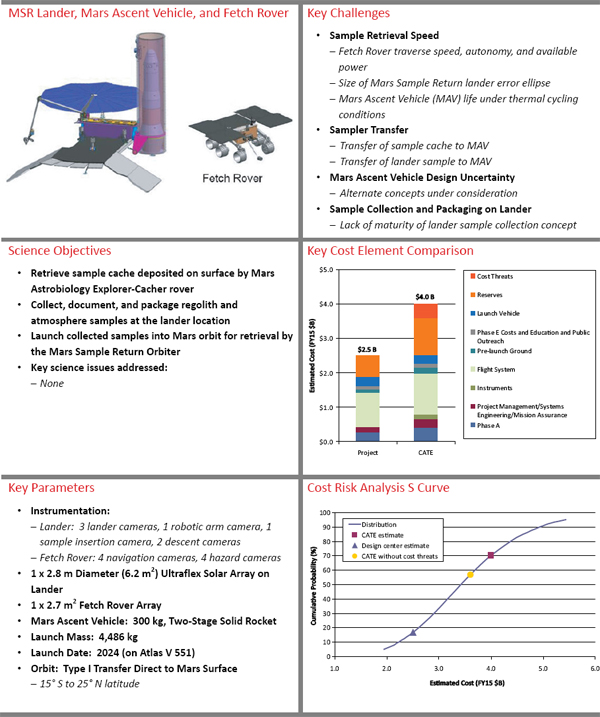
Mars Sample Return Lander and Mars Ascent Vehicle (Box C.5);7
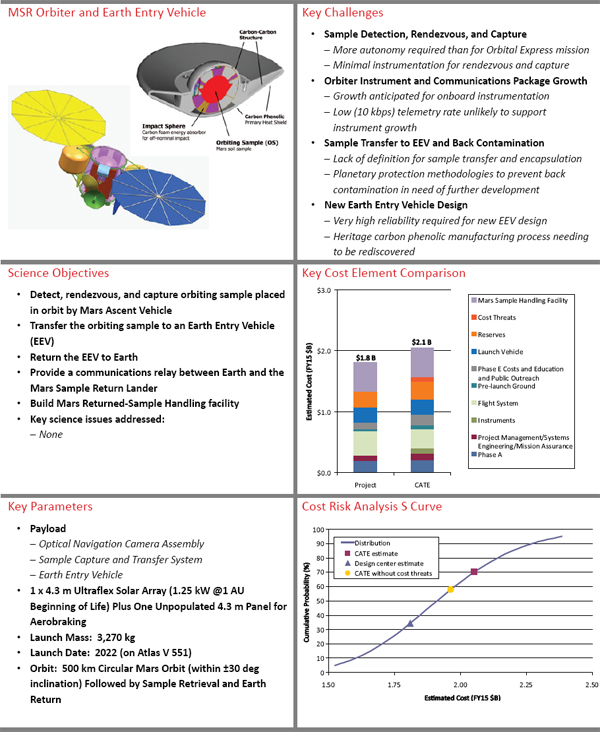
•
Mars Sample Return Orbiter and Earth Entry Vehicle (Box C.6);8
•
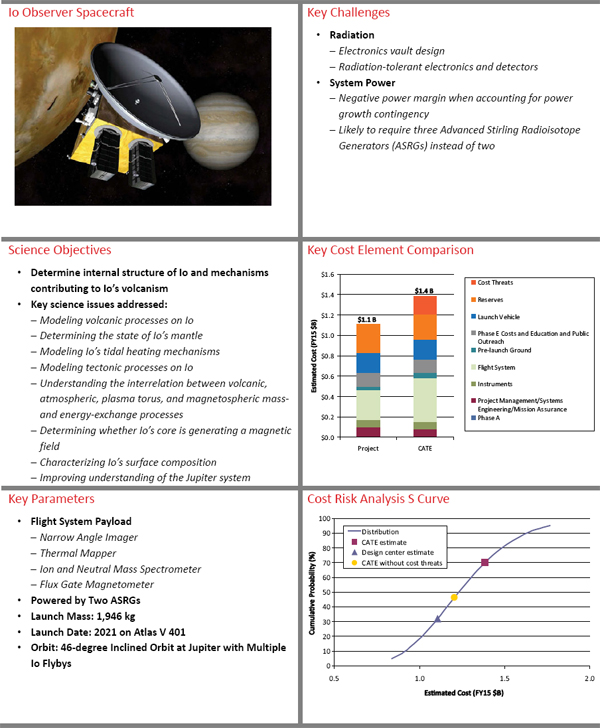
• Io Observer (Box C.7);
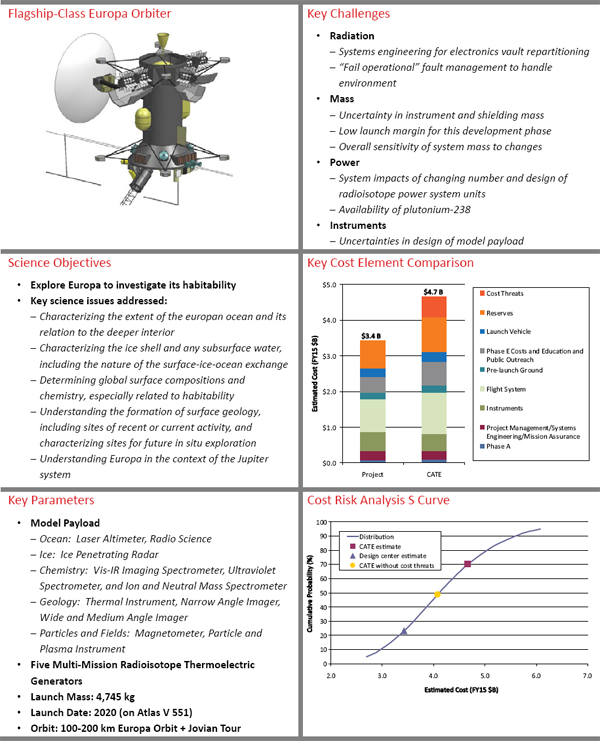
• Jupiter Europa Orbiter (Box C.8);
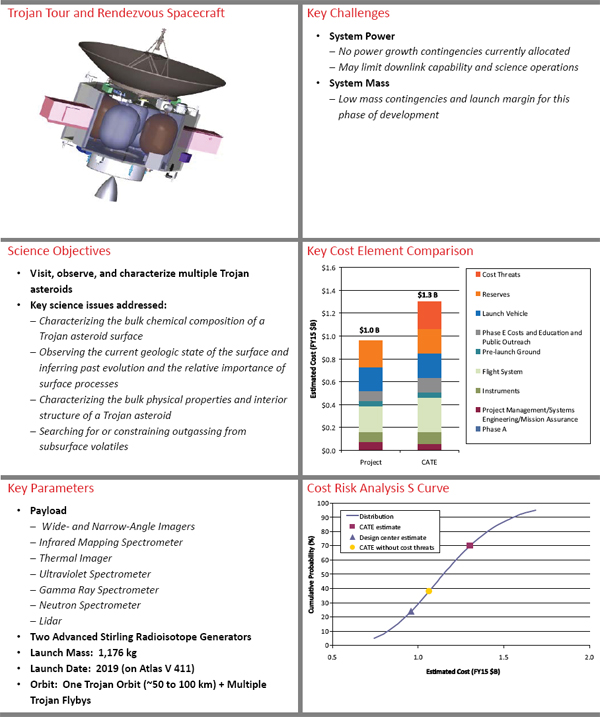
• Trojan Tour and Rendezvous (Box C.9);
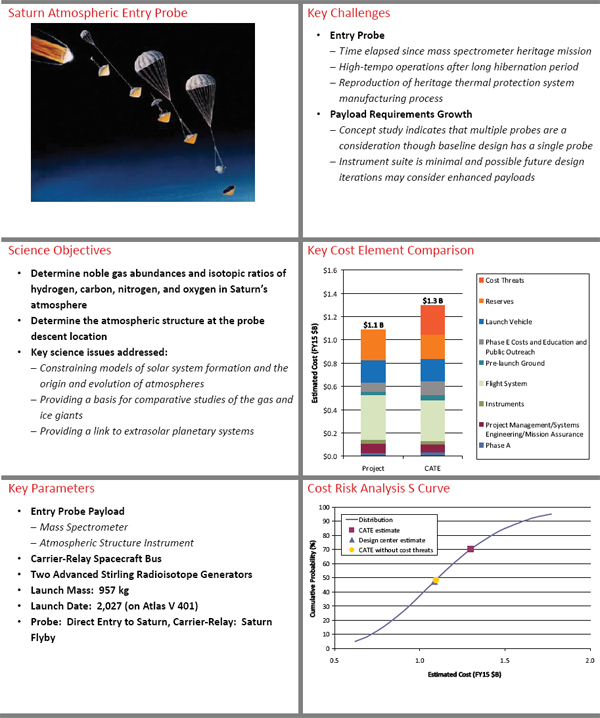
• Saturn Probe (Box C.10);
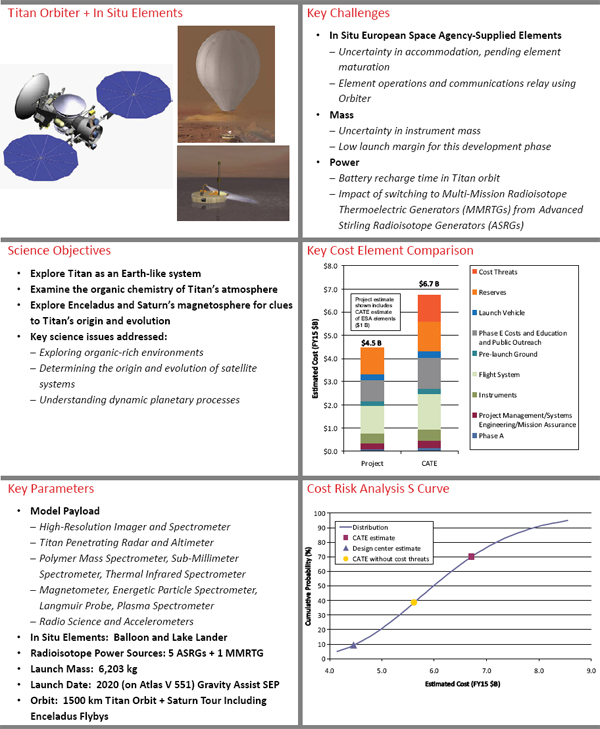
• Titan Saturn System Mission (Box C.11);
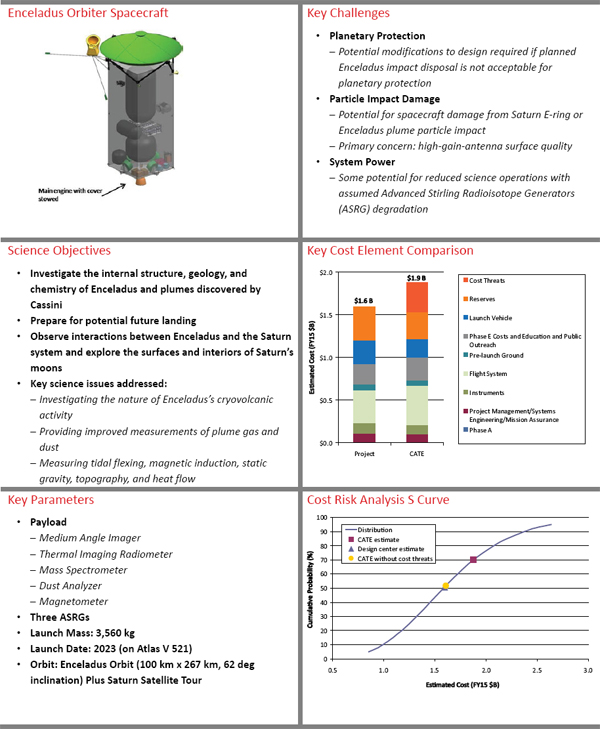
• Enceladus Orbiter (Box C.12);
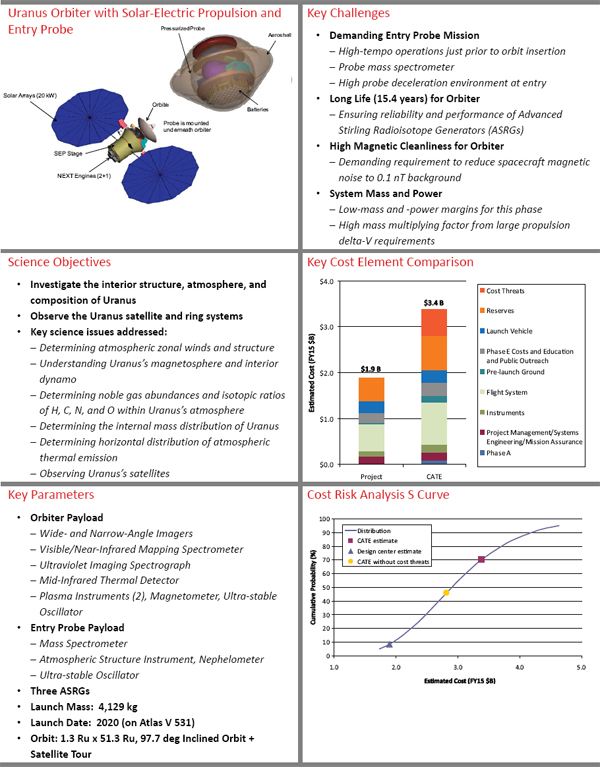
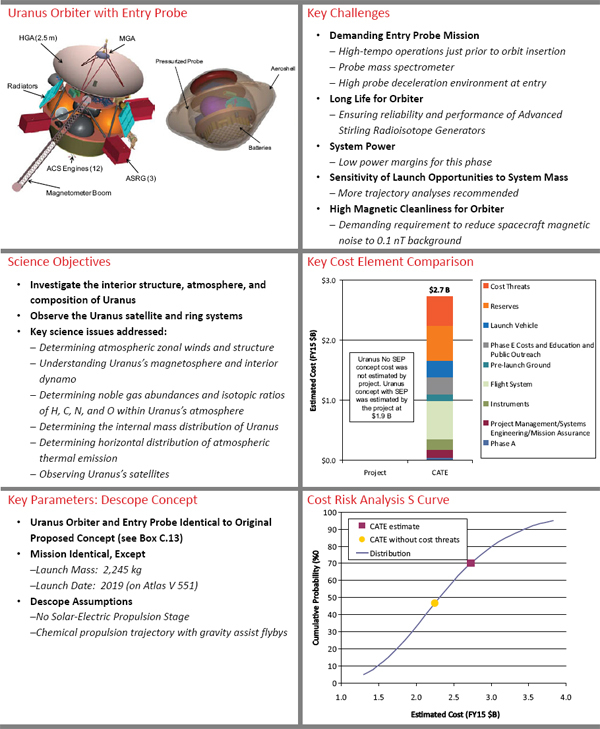
• Uranus Orbiter with Solar-Electric Propulsion and Probe (Box C.13);
• Uranus Orbiter and Probe (No Solar-Electric Propulsion) (Box C.14); and
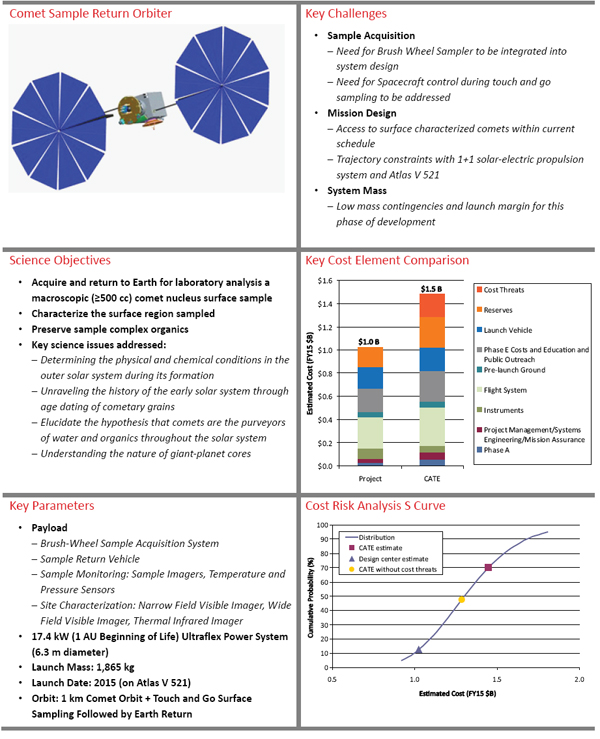
• Comet Surface Sample Return (Box C.15).
These missions were chosen by the committee on the basis of their strong science return and their potential
technical readiness.
OCR for page 338
338 VISION AND VOYAGES FOR PLANETARY SCIENCE
BOX C.1
Venus Climate Mission
Carrier Spacecraft and Entry Flight System Key Challenges
• Multiple Element Communications Architecture
High Gain Antenna
1.7 m Diameter
– Critical Mini‐Probe/Dropsonde science data are relayed
Aeroshell through Gondola/Balloon to Carrier to Earth.
Support
Structure
– Mini‐Probe must communicate with Balloon/Gondola
during inflation process.
Reaction Wheel (4X)
– It is a challenge to predict Gondola/Balloon location for
Avionics Radiator
Propulsion Tank
(2.85 m2)
Support Structure
reacquisition.
• High‐Tempo Operations near Venus Orbit Insertion (VOI)
Closeout Panel
– VOI is 2 hrs prior to Entry Flight System (EFS) entry.
Solar Array = 5.0 m2
– Mini‐Probe is jettisoned minutes after EFS entry.
• T ime Elapsed Since Heritage System Development
Carrier Spacecraft Entry Flight System
– Study uses Pioneer Venus and Galileo Probe as basis for
several estimates.
• Potential for Carrier Spacecraft Instrument Growth
Science Objectives Key Cost Element Comparison
• Examine the Venus atmosphere 3.0
– Improve understanding of the current state and Cost Threats
evolution of the strong CO2 greenhouse climate $ 2 .4 B Reserves
Es�m ated Cost ( FY 15 $B)
• Improve modeling of climate and global change on Launch Vehicle
2.0
Earth‐like planets Phase E Costs and Educa�on
$ 1 .6 B and Public Outreach
• Key science issues addressed: Pre-launch Ground
– Characterize the CO2 greenhouse atmosphere of Venus
Flight System
– Characterize the dynamics of Venus’s superrotating 1.0
Instruments
atmosphere
Project Management/Systems
– Constrain surface/atmosphere chemical exchange Engineering/Mission Assurance
Phase A
– Determine origin of Venus’s atmosphere
0.0
– Understand implications for climate evolution of Earth Project CATE
Key Parameters Cost Risk Analysis S Curve
• Carrier Spacecraft 100
– V isible/Infrared Imager 90 Distribu�on
Cumula�ve Probability (%)
• Gondola/Balloon 80 CATE es�mate
– Atmospheric Structure Investigation, Nephelometer 70 Design center es�mate
– Neutral Mass Spectrometer CATE without cost threats
60
– Tunable Laser Spectrometer 50
– Net Flux Radiometer 40
• Mini‐Probe (one) and Dropsondes (two) 30
– Atmospheric Structure Investigation (All) 20
– Net Flux Radiometer (All) 10
– Neutral Mass Spectrometer (Mini‐Probe only)
0
2
• 5 m Gimbaled Solar Array on Carrier Spacecraft
1.0 1.5 2.0 2.5 3.0
• Launch Mass: 3,984 kg
Es�mated Cost ( FY 15 $B)
OCR for page 339
339
APPENDIX C
BOX C.2
Lunar Geophysical Network
Key Challenges
Lunar Lander Network⎯Four Landers
• DACS Propulsion
– Development needed for MON‐25/MMH combustion
stability
• Mass
– Low dry‐mass contingency for this development phase
– Impact to overall mass growth multiplied by propulsion
requirements
• Reliability
– Single‐string network reliability
• Mission Operations
– High‐tempo operations for multi‐lander cruise and
landing phase
Science Objectives Key Cost Element Comparison
• Enhance knowledge of lunar interior
$1.6
Cost Threats
• Key science issues addressed:
$1.4 $ 1 .3 B Reserves
– Determining lateral variations in the structure and
composition of the lunar crust, upper mantle, lower $1.2 Launch Vehicle
E s tim a te d C o s t ( F Y 1 5 $ B )
mantle, and lunar core Phase E Costs and Educa�on and
$1.0
$ 0 .9 B Public Outreach
– Determining distribution and origin of lunar seismic
Pre-launch Ground
$0.8
activity
Flight System
– Determining the lunar global heat flow budget to $0.6
better constrain knowledge of lunar thermal evolution Instruments
$0.4
– Determining bulk lunar composition of radioactive Project Management/Systems
Engineering/Mission Assurance
heat‐producing elements $0.2
Phase A
– Determining nature and origin of lunar crustal $0.0
magnetic field Project CATE
Key Parameters Cost Risk Analysis S Curve
100
• Payload
Distribu�on
90
– Seismometer CATE es�mate
80
Cumula�ve Probability (%)
– Heat Flow Experiment Design center es�mate
70 CATE without cost threats
– Electromagnetic Sounder 60
– Lunar Laser Ranging 50
– Guest Payload 40
30
– Education/Public Outreach Pancam
20
• Advanced Stirling Radioisotope Generator Surface Power
10
• Launch Mass: 3,572 kg (257 kg individual lander mass) 0
• Launch Date: 2016 (on Atlas V 511) 0.5 1.0 1.5 2.0
• Direct Lunar Near‐Side Landing Es�mated Cost ( FY 15 $B)
OCR for page 340
340 VISION AND VOYAGES FOR PLANETARY SCIENCE
BOX C.3
Mars Astrobiology Explorer‐Cacher
Caching Mars Rover Key Challenges
• Vehicle Capabilities Beyond Mars Science Laboratory
– Terrain‐relative descent navigation and precision
landing with pallet
– Aeroshell volume to accommodate rover, European
Space Agency’s ExoMars, and pallet
– Increased rover traverse speed over MSL and MER
• Sample Handling, Encapsulation, and Containerization
(SHEC)
– Lack of maturity in SHEC subsystem
– Effect of planetary protection and sample transfer
requirements
• Mass
– Insufficient mass growth contingency for this
development phase
– Low launch margin for this development phase
Science Objectives Key Cost Element Comparison
• Perform in situ science on Mars samples to look for $4.0
Cost Threats
evidence of ancient life or prebiotic chemistry $ 3 .5 B
• Collect, document, and package samples for future Reserves
collection and return to Earth $3.0 Launch Vehicle
Es� mat ed Cost (FY 15 $B )
• Key science issues addressed: Phase E Costs and Educa�on and Public
$ 2 .2 B Outreach
– Searching for extant life on Mars Pre-launch Ground
$2.0
– Searching for evidence of past life on Mars
Flight System
– Understanding martian climate history
– Determining the ages of geologic terrains on Mars Instruments
$1.0
– Understanding surface‐atmosphere interactions on Project Management/Systems
Engineering/Mission Assurance
Mars Phase A
– Understanding martian interior processes $0.0
Project CATE
Key Parameters Cost Risk Analysis S Curve
• Model Payload with Sampling/Caching System 100
– Panoramic high resolution stereo imager (on mast) Distribu�on
90
CATE es�mate
– Near‐Infrared Point Spectrometer 80
Design center es�mate
Cumula�ve Probability (%)
– Microscopic Imager 70 CATE without cost threats
– Alpha‐Particle X‐ray Spectrometer 60
50
– Dual Wavelength Raman/Fluorescence Instrument
40
– Sample Handling, Encapsulation, and Containerization
30
(arm, corer/abrader, organic blank, handling and
20
container system) 10
• 2 x 2.2 m Diameter Ultraflex Solar Arrays 0
• Launch Mass: 4,457 kg 1.0 2.0 3.0 4.0 5.0
• Launch Date: 2018 (on Atlas V 531) Es�mated Cost ( FY 15 $B)
• Orbit: Type I Transfer Direct to Mars Surface
– 15° S to 25° N latitude
OCR for page 341
341
APPENDIX C
BOX C.4
Mars Astrobiology Explorer‐Cacher Descope
Key Challenges
Caching Mars Rover
• Keeping Within Mars Science Laboratory (MSL) Design
Constraints
– Potential need for modifying MSL entry and descent
system to accommodate a single rover
• Sample Handling, Encapsulation, and Containerization
(SHEC)
– Lack of maturity in SHEC subsystem
– Effect of planetary protection and sample transfer
requirements
• Increased Rover Traverse Speed over Mars Science
Laboratory and Mars Exploration Rover
Science Objectives Key Cost Element Comparison
$3.0
• Perform in situ science on Mars samples to look for Cost Threats
evidence of ancient life or prebiotic chemistry
$ 2 .4 B Reserves
• Collect, document, and package samples for future
Launch Vehicle
collection and return to Earth
Es� mat ed Cost (FY 15$B )
$2.0
Phase E Costs and Educa�on and Public
MAX-C Descope
• Key science issues addressed: concept cost was Outreach
not estimated by
Pre-launch Ground
– Searching for extant life on Mars project. Full MAX-C
concept was
estimated by the
– Searching for evidence of past life on Mars Flight System
project at $2.2 B
$1.0
– Understanding martian climate history Instruments
– Determining the ages of geologic terrains on Mars Project Management/Systems
Engineering/Mission Assurance
– Understanding surface‐atmosphere interactions on Phase A
Mars $0.0
Project CATE
– Understanding martian interior processes
Key Parameters: Descope Concept Cost Risk Analysis S Curve
• MAX‐C Rover Identical to Original Proposed Concept 100
CATE es�mate
(see Box C.3) 90
CATE without cost threats
• Mission Identical, Except: 80 Distribu�on
Cumula�ve Probability (%)
– Launch Mass: 3,421 kg 70
– Launch Vehicle: Atlas V 521 60
50
• Descope Assumptions:
40
– No ESA ExoMars rover
30
– No landing pallet
20
– Use of heritage MSL entry and descent systems 10
0
1.0 1.5 2.0 2.5 3.0 3.5
Es�mated Cost ( FY 15 $B)
OCR for page 344
344 VISION AND VOYAGES FOR PLANETARY SCIENCE
BOX C.7
Io Observer
Io Observer Spacecraft Key Challenges
• Radiation
– Electronics vault design
– Radiation‐tolerant electronics and detectors
• System Power
– Negative power margin when accounting for power
growth contingency
– Likely to require three Advanced Stirling Radioisotope
Generators (ASRGs) instead of two
Science Objectives Key Cost Element Comparison
• Determine internal structure of Io and mechanisms $1.6
Cost Threats
contributing to Io’s volcanism $ 1 .4 B
$1.4
Reserves
• Key science issues addressed:
$1.2 Launch Vehicle
– Modeling volcanic processes on Io $ 1 .1 B
Es� mat ed Cost (FY 15 $B )
– Determining the state of Io’s mantle Phase E Costs and Educa�on and Public
$1.0
Outreach
– Modeling Io’s tidal heating mechanisms Pre-launch Ground
$0.8
– Modeling tectonic processes on Io Flight System
$0.6
– Understanding the interrelation between volcanic, Instruments
atmospheric, plasma torus, and magnetospheric mass‐ $0.4
Project Management/Systems
Engineering/Mission Assurance
and energy‐exchange processes $0.2 Phase A
– Determining whether Io’s core is generating a magnetic
$0.0
field Project CATE
– Characterizing Io’s surface composition
– Improving understanding of the Jupiter system
Key Parameters Cost Risk Analysis S Curve
100
• Flight System Payload Distribu�on
90
– Narrow Angle Imager CATE es�mate
80
– Thermal Mapper Design center es�mate
Cumula�ve Probability (%)
70 CATE without cost threats
– Ion and Neutral Mass Spectrometer
60
– Flux Gate Magnetometer
50
• Powered by Two ASRGs 40
• Launch Mass: 1,946 kg 30
• Launch Date: 2021 on Atlas V 401 20
• Orbit: 46‐degree Inclined Orbit at Jupiter with Multiple 10
Io Flybys 0
0.5 1.0 1.5 2.0
Es�mated Cost ( FY 15 $B)
OCR for page 345
345
APPENDIX C
BOX C.8
Jupiter Europa Orbiter
Flagship‐Class Europa Orbiter Key Challenges
• Radiation
– Systems engineering for electronics vault repartitioning
– “Fail operational” fault management to handle
environment
• Mass
– Uncertainty in instrument and shielding mass
– Low launch margin for this development phase
– Overall sensitivity of system mass to changes
• Power
– System impacts of changing number and design of
radioisotope power system units
– Availability of plutonium‐238
• Instruments
– Uncertainties in design of model payload
Science Objectives Key Cost Element Comparison
• Explore Europa to investigate its habitability $5.0
$ 4 .7 B Cost Threats
• Key science issues addressed:
Reserves
– Characterizing the extent of the europan ocean and its $4.0
relation to the deeper interior Launch Vehicle
$ 3 .4 B
Es� mat ed Cost (FY 15 $B )
– Characterizing the ice shell and any subsurface water, Phase E Costs and Educa�on and
$3.0
Public Outreach
including the nature of the surface‐ice‐ocean exchange Pre-launch Ground
– Determining global surface compositions and
Flight System
$2.0
chemistry, especially related to habitability
Instruments
– Understanding the formation of surface geology,
including sites of recent or current activity, and $1.0 Project Management/Systems
Engineering/Mission Assurance
characterizing sites for future in situ exploration Phase A
– Understanding Europa in the context of the Jupiter $0.0
system Project CATE
Key Parameters Cost Risk Analysis S Curve
• Model Payload 100
– Ocean: Laser Altimeter, Radio Science 90 Distribu�on
CATE es�mate
80
– Ice: Ice Penetrating Radar Design center es�mate
Cumula�ve Probability (%)
70 CATE without cost threats
– Chemistry: Vis‐IR Imaging Spectrometer, Ultraviolet
60
Spectrometer, and Ion and Neutral Mass Spectrometer
50
– Geology: Thermal Instrument, Narrow Angle Imager, 40
Wide and Medium Angle Imager 30
– Particles and Fields: Magnetometer, Particle and 20
Plasma Instrument 10
• F ive Multi‐Mission Radioisotope Thermoelectric 0
2.0 3.0 4.0 5.0 6.0 7.0
Generators
Es�mated Cost ( FY 15 $B)
• Launch Mass: 4,745 kg
• Launch Date: 2020 (on Atlas V 551)
• Orbit: 100‐200 km Europa Orbit + Jovian Tour
OCR for page 346
346 VISION AND VOYAGES FOR PLANETARY SCIENCE
BOX C.9
Trojan Tour and Rendezvous
Trojan Tour and Rendezvous Spacecraft Key Challenges
• System Power
– No power growth contingencies currently allocated
– May limit downlink capability and science operations
• System Mass
– Low mass contingencies and launch margin for this
phase of development
Science Objectives Key Cost Element Comparison
$1.6
• V isit, observe, and characterize multiple Trojan Cost Threats
asteroids $1.4 Reserves
$ 1 .3 B
• Key science issues addressed:
$1.2 Launch Vehicle
– Characterizing the bulk chemical composition of a
Es� mat ed Cost (FY 15 $B )
$ 1 .0 B Phase E Costs and Educa�on and
Trojan asteroid surface $1.0
Public Outreach
– Observing the current geologic state of the surface and Pre-launch Ground
$0.8
inferring past evolution and the relative importance of Flight System
surface processes $0.6
Instruments
– Characterizing the bulk physical properties and interior $0.4
Project Management/Systems
structure of a Trojan asteroid Engineering/Mission Assurance
$0.2
– Searching for or constraining outgassing from Phase A
subsurface volatiles $0.0
Project CATE
Key Parameters Cost Risk Analysis S Curve
100
• Payload Distribu�on
90
– Wide‐ and Narrow‐Angle Imagers CATE es�mate
80
Design center es�mate
– Infrared Mapping Spectrometer
Cumula�ve Probability (%)
70 CATE without cost threats
– Thermal Imager 60
– Ultraviolet Spectrometer 50
– Gamma Ray Spectrometer 40
– Neutron Spectrometer 30
20
– Lidar
10
• Two Advanced Stirling Radioisotope Generators
0
• Launch Mass: 1,176 kg 0.5 1.0 1.5 2.0
• Launch Date: 2019 (on Atlas V 411) Es�mated Cost ( FY 15 $B)
• Orbit: One Trojan Orbit (~50 to 100 km) + Multiple
Trojan Flybys
OCR for page 347
347
APPENDIX C
BOX C.10
Saturn Probe
Saturn Atmospheric Entry Probe Key Challenges
• Entry Probe
– T ime elapsed since mass spectrometer heritage mission
– High‐tempo operations after long hibernation period
– Reproduction of heritage thermal protection system
manufacturing process
• Payload Requirements Growth
– Concept study indicates that multiple probes are a
consideration though baseline design has a single probe
– Instrument suite is minimal and possible future design
iterations may consider enhanced payloads
Science Objectives Key Cost Element Comparison
• Determine noble gas abundances and isotopic ratios of $1.6
Cost Threats
hydrogen, carbon, nitrogen, and oxygen in Saturn’s $1.4
$ 1 .3 B Reserves
atmosphere
$1.2
• Determine the atmospheric structure at the probe Launch Vehicle
$ 1 .1 B
Es� mat ed Cost (FY 15 $B )
descent location $1.0 Phase E Costs and Educa�on and
• Key science issues addressed: Public Outreach
Pre-launch Ground
$0.8
– Constraining models of solar system formation and the
origin and evolution of atmospheres Flight System
$0.6
– Providing a basis for comparative studies of the gas and Instruments
$0.4
ice giants
Project Management/Systems
– Providing a link to extrasolar planetary systems $0.2 Engineering/Mission Assurance
Phase A
$0.0
Project CATE
Key Parameters Cost Risk Analysis S Curve
100
• Entry Probe Payload Distribu�on
90
– Mass Spectrometer CATE es�mate
80
– Atmospheric Structure Instrument Design center es�mate
Cumula�ve Probability (%)
70 CATE without cost threats
• Carrier‐Relay Spacecraft Bus 60
• Two Advanced Stirling Radioisotope Generators 50
• Launch Mass: 957 kg 40
• Launch Date: 2,027 (on Atlas V 401) 30
• Probe: Direct Entry to Saturn, Carrier‐Relay: Saturn 20
10
Flyby
0
0.5 1.0 1.5 2.0
Es�mated Cost ( FY 15 $B)
OCR for page 348
348 VISION AND VOYAGES FOR PLANETARY SCIENCE
BOX C.11
Titan Saturn System Mission
Titan Orbiter + In Situ Elements Key Challenges
• In Situ European Space Agency‐Supplied Elements
– Uncertainty in accommodation, pending element
maturation
– Element operations and communications relay using
Orbiter
• Mass
– Uncertainty in instrument mass
– Low launch margin for this development phase
• Power
– Battery recharge time in Titan orbit
– Impact of switching to Multi‐Mission Radioisotope
Thermoelectric Generators (MMRTGs) from Advanced
Stirling Radioisotope Generators (ASRGs)
Science Objectives Key Cost Element Comparison
$8.0
• Explore Titan as an Earth‐like system Cost Threats
$ 6 .7 B
• Examine the organic chemistry of Titan’s atmosphere $7.0 Reserves
Project estimate
• Explore Enceladus and Saturn’s magnetosphere for clues shown includes
$6.0 Launch Vehicle
CATE estimate
to Titan’s origin and evolution of ESA elements
Es� mat ed Cost (FY 15 $B )
($1 B)
Phase E Costs and Educa�on
• Key science issues addressed: $5.0
and Public Outreach
$ 4 .5 B
– Exploring organic‐rich environments Pre-launch Ground
$4.0
– Determining the origin and evolution of satellite Flight System
systems $3.0
Instruments
– Understanding dynamic planetary processes $2.0
Project Management/Systems
Engineering/Mission Assurance
$1.0
Phase A
$0.0
Project CATE
Key Parameters Cost Risk Analysis S Curve
• Model Payload 100
– High‐Resolution Imager and Spectrometer Distribu�on
90
CATE es�mate
– T itan Penetrating Radar and Altimeter 80
Design center es�mate
Cumula�ve Probability (%)
– Polymer Mass Spectrometer, Sub‐Millimeter 70 CATE without cost threats
60
Spectrometer, Thermal Infrared Spectrometer
50
– Magnetometer, Energetic Particle Spectrometer,
40
Langmuir Probe, Plasma Spectrometer
30
– Radio Science and Accelerometers
20
• In Situ Elements: Balloon and Lake Lander 10
• Radioisotope Power Sources: 5 ASRGs + 1 MMRTG 0
• Launch Mass: 6,203 kg 4.0 5.0 6.0 7.0 8.0 9.0
• Launch Date: 2020 (on Atlas V 551) Gravity Assist SEP Es�mated Cost ( FY 15 $B)
• Orbit: 1500 km Titan Orbit + Saturn Tour Including
Enceladus Flybys
OCR for page 349
349
APPENDIX C
BOX C.12
Enceladus Orbiter
Enceladus Orbiter Spacecraft Key Challenges
• Planetary Protection
– Potential modifications to design required if planned
Enceladus impact disposal is not acceptable for
planetary protection
• Particle Impact Damage
– Potential for spacecraft damage from Saturn E‐ring or
Enceladus plume particle impact
– Primary concern: high‐gain‐antenna surface quality
• System Power
– Some potential for reduced science operations with
assumed Advanced Stirling Radioisotope Generators
(ASRG) degradation
Science Objectives Key Cost Element Comparison
• Investigate the internal structure, geology, and $2.0
$ 1 .9 B Cost Threats
chemistry of Enceladus and plumes discovered by
Reserves
$ 1 .6 B
Cassini
$1.5
• Prepare for potential future landing Launch Vehicle
Es� mat ed Cost (FY 15 $B )
• Observe interactions between Enceladus and the Saturn Phase E Costs and Educa�on and Public
Outreach
system and explore the surfaces and interiors of Saturn’s Pre-launch Ground
$1.0
moons Flight System
• Key science issues addressed:
Instruments
– Investigating the nature of Enceladus’s cryovolcanic $0.5
Project Management/Systems
activity Engineering/Mission Assurance
– Providing improved measurements of plume gas and Phase A
$0.0
dust
Project CATE
– Measuring tidal flexing, magnetic induction, static
gravity, topography, and heat flow
Key Parameters Cost Risk Analysis S Curve
100
• Payload Distribu�on
90
– Medium Angle Imager CATE es�mate
80 Design center es�mate
– Thermal Imaging Radiometer
Cumula�ve Probability (%)
CATE without cost threats
70
– Mass Spectrometer 60
– Dust Analyzer 50
– Magnetometer 40
• Three ASRGs 30
• Launch Mass: 3,560 kg 20
10
• Launch Date: 2023 (on Atlas V 521)
0
• Orbit: Enceladus Orbit (100 km x 267 km, 62 deg 0.5 1.0 1.5 2.0 2.5 3.0
inclination) Plus Saturn Satellite Tour Es�mated Cost ( FY 15 $B)
OCR for page 350
350 VISION AND VOYAGES FOR PLANETARY SCIENCE
BOX C.13
Uranus Orbiter with Solar‐Electric Propulsion and Probe
Uranus Orbiter with Solar‐Electric Propulsion and Key Challenges
Entry Probe Pressurized Probe
• Demanding Entry Probe Mission
Aeroshell
– High‐tempo operations just prior to orbit insertion
– Probe mass spectrometer
– High probe deceleration environment at entry
• Long Life (15.4 years) for Orbiter
Solar Arrays (20 kW)
Orbiter
Batteries
– Ensuring reliability and performance of Advanced
Probe is mounted
Stirling Radioisotope Generators (ASRGs)
underneath orbiter
• High Magnetic Cleanliness for Orbiter
SEP Stage
– Demanding requirement to reduce spacecraft magnetic
noise to 0.1 nT background
NEXT Engines (2+1)
• System Mass and Power
– Low‐mass and ‐power margins for this phase
– High mass multiplying factor from large propulsion
delta‐V requirements
Science Objectives Key Cost Element Comparison
$4.0
• Investigate the interior structure, atmosphere, and Cost Threats
composition of Uranus $ 3 .4 B
Reserves
• Observe the Uranus satellite and ring systems
$3.0
• Key science issues addressed: Launch Vehicle
Es� mat ed Cost (FY 15 $B )
– Determining atmospheric zonal winds and structure Phase E Costs and Educa�on
– Understanding Uranus’s magnetosphere and interior and Public Outreach
$ 1 .9 B Pre-launch Ground
$2.0
dynamo
– Determining noble gas abundances and isotopic ratios Flight System
of H, C, N, and O within Uranus’s atmosphere Instruments
$1.0
– Determining the internal mass distribution of Uranus Project Management/Systems
– Determining horizontal distribution of atmospheric Engineering/Mission Assurance
Phase A
thermal emission
$0.0
– Observing Uranus’s satellites Project CATE
Key Parameters Cost Risk Analysis S Curve
• Orbiter Payload 100
– W ide‐ and Narrow‐Angle Imagers Distribu�on
90
CATE es�mate
– V isible/Near‐Infrared Mapping Spectrometer 80
Design center es�mate
Cumula�ve Probability (%)
70
– Ultraviolet Imaging Spectrograph CATE without cost threats
60
– Mid‐Infrared Thermal Detector 50
– Plasma Instruments (2), Magnetometer, Ultra‐stable 40
Oscillator 30
• Entry Probe Payload 20
– Mass Spectrometer 10
0
– Atmospheric Structure Instrument, Nephelometer
1.0 2.0 3.0 4.0 5.0
– Ultra‐stable Oscillator Es�mated Cost ( FY 15 $B)
• Three ASRGs
• Launch Mass: 4,129 kg
• Launch Date: 2020 (on Atlas V 531)
• Orbit: 1.3 Ru x 51.3 Ru, 97.7 deg Inclined Orbit +
Satellite Tour
OCR for page 351
351
APPENDIX C
BOX C.14
Uranus Orbiter and Probe (No Solar‐Electric Propulsion)
Uranus Orbiter with Entry Probe Key Challenges
HGA (2.5 m) • Demanding Entry Probe Mission
MGA
– High‐tempo operations just prior to orbit insertion
Pressurized Probe
– Probe mass spectrometer
Aeroshell
– High probe deceleration environment at entry
Radiators
• Long Life for Orbiter
– Ensuring reliability and performance of Advanced
Stirling Radioisotope Generators
• System Power
Batteries
– Low power margins for this phase
ACS Engines (12)
• Sensitivity of Launch Opportunities to System Mass
ASRG (3)
– More trajectory analyses recommended
Magnetometer Boom
• High Magnetic Cleanliness for Orbiter
– Demanding requirement to reduce spacecraft magnetic
noise to 0.1 nT background
Science Objectives Key Cost Element Comparison
$3.0
• Investigate the interior structure, atmosphere, and Cost Threats
$ 2 .7 B
composition of Uranus Reserves
• Observe the Uranus satellite and ring systems
Launch Vehicle
• Key science issues addressed:
Es� mat ed Cost (FY 15 $B )
$2.0
– Determining atmospheric zonal winds and structure Phase E Costs and Educa�on and
Public Outreach
Uranus No SEP
– Understanding Uranus’s magnetosphere and interior Pre-launch Ground
concept cost was
not estimated by
dynamo project. Uranus Flight System
concept with SEP
– Determining noble gas abundances and isotopic ratios was estimated by
$1.0 Instruments
the project at
of H, C, N, and O within Uranus’s atmosphere $1.9 B
Project Management/Systems
– Determining the internal mass distribution of Uranus Engineering/Mission Assurance
– Determining horizontal distribution of atmospheric Phase A
thermal emission $0.0
– Observing Uranus’s satellites Project CATE
Key Parameters: Descope Concept Cost Risk Analysis S Curve
100
• Uranus Orbiter and Entry Probe Identical to Original CATE es�mate
90
Proposed Concept (see Box C.13) CATE without cost threats
80
• Mission Identical, Except Distribu�on
Cumula�ve Probability (%0
70
–Launch Mass: 2,245 kg
60
–Launch Date: 2019 (on Atlas V 551)
50
• Descope Assumptions
–No Solar‐Electric Propulsion Stage 40
–Chemical propulsion trajectory with gravity assist flybys 30
20
10
0
1.0 1.5 2.0 2.5 3.0 3.5 4.0
Es�mated Cost ( FY 15 $B)
OCR for page 352
352 VISION AND VOYAGES FOR PLANETARY SCIENCE
BOX C.15
Comet Surface Sample Return
Comet Sample Return Orbiter Key Challenges
• Sample Acquisition
– Need for Brush Wheel Sampler to be integrated into
system design
– Need for Spacecraft control during touch and go
sampling to be addressed
• Mission Design
– Access to surface characterized comets within current
schedule
– Trajectory constraints with 1+1 solar‐electric propulsion
system and Atlas V 521
• System Mass
– Low mass contingencies and launch margin for this
phase of development
Science Objectives Key Cost Element Comparison
• Acquire and return to Earth for laboratory analysis a $1.6
$ 1 .5 B Cost Threats
macroscopic (≥500 cc) comet nucleus surface sample $1.4
Reserves
• Characterize the surface region sampled
• Preserve sample complex organics $1.2 Launch Vehicle
Es� mat ed Cost (FY 15 $B )
$ 1 .0 B
• Key science issues addressed: Phase E Costs and Educa�on and
$1.0
– Determining the physical and chemical conditions in the Public Outreach
Pre-launch Ground
$0.8
outer solar system during its formation
– Unraveling the history of the early solar system through Flight System
$0.6
age dating of cometary grains Instruments
– Elucidate the hypothesis that comets are the purveyors $0.4
Project Management/Systems
of water and organics throughout the solar system Engineering/Mission Assurance
$0.2
Phase A
– Understanding the nature of giant‐planet cores
$0.0
Project CATE
Key Parameters Cost Risk Analysis S Curve
• Payload 100
Distribu�on
90
– Brush‐Wheel Sample Acquisition System CATE es�mate
80
– Sample Return Vehicle Design center es�mate
Cumula�ve Probability (%)
70 CATE without cost threats
– Sample Monitoring: Sample Imagers, Temperature and
60
Pressure Sensors 50
– Site Characterization: Narrow Field Visible Imager, Wide 40
Field Visible Imager, Thermal Infrared Imager 30
• 17.4 kW (1 AU Beginning of Life) Ultraflex Power System 20
(6.3 m diameter) 10
• Launch Mass: 1,865 kg 0
0.5 1.0 1.5 2.0
• Launch Date: 2015 (on Atlas V 521)
Es�mated Cost ( FY 15 $B)
• Orbit: 1 km Comet Orbit + Touch and Go Surface
Sampling Followed by Earth Return
OCR for page 353
353
APPENDIX C
SUMMARY
Linked technical, cost, and schedule estimates were developed for each of the priority mission concepts
selected by the committee. The use of historical experience databases and evaluation of the technical risk, cost, and
schedule histories of analogous space systems that had already flown plus the extensive interaction of technical,
cost, and schedule experts with the proposing teams provide, in toto, a high degree of confidence that the resulting
assessments are realistic and credible.
The CATE process estimated mission costs that are considerably higher than the cost estimates provided by
the design center study teams. The reason is that project-derived cost estimates are typically done using a bottom-
up or so-called grass roots approach, and beyond standard contingencies they do not include probabilities of risk
incurred by necessary redesigns, schedule slips, or launch vehicle growth. In other words, project estimates typically
do not account for the “unpleasant surprises” that historically happen in nearly all space mission developments.
CATEs include a probabilistic assessment of required reserves assuming that the concept achieves the mass
and power as allocated or constrained by the respective stated project contingencies within the schedule as stated
by the project. In addition to these reserves, additional cost threats are also included that quantify potential cost
growth based on design maturity (mass and power growth) and schedule growth. Potential cost threats for larger
required launch vehicle capability are also included. It is the combination of these reserves and cost threats that are
often the main reason for the large differences between the CATE appraisal and the project estimate. Differences
in the estimates for hardware costs (instruments and flight systems) can also be a contributing factor.
As noted in several places in this report, the planetary program has been plagued for many years by use of
cost estimates that, in retrospect, turn out to have been too optimistic. The result has been cost overruns that can
be highly disruptive to the program. The CATE process, which uses history as its guide, has been designed and is
used in this decadal survey to prevent this problem.
NOTES AND REFERENCES
1 . National Research Council. 2006. An Assessment of Balance in NASA’s Science Programs. The National Academies
Press, Washington, D.C., p. 32.
2 . National Research Council. 2006. An Assessment of Balance in NASA’s Science Programs. The National Academies
Press, Washington, D.C., p. 33.
3 . National Research Council. 2007. Decadal Science Strategy Surveys: Report of a Workshop. The National Academies
Press, Washington, D.C., pp. 21-30.
4 . National Research Council. 2007. NASA’s Beyond Einstein Program: An Architecture for Implementation. The National
Academies Press, Washington, D.C., pp. 66-114.
5 . Congress of the United States. 2008. National Aeronautics and Space Administration Authorization Act of 2008. Public
Law 110-422, Section 1104b, October 15.
6 . National Research Council. 2010. New Worlds, New Horizons in Astronomy and Astrophysics. The National Academies
Press, Washington, D.C., Appendix C.
7 . As described in Chapter 9, the Mars Sample Return Lander mission is expected to be carried out jointly with the European
Space Agency (ESA). Because the details of this collaboration have not been negotiated yet, however, the cost calculated
for this mission does not include any ESA contribution.
8 . As described in Chapter 9, the Mars Sample Return Orbiter mission is expected to be carried out jointly with the European
Space Agency (ESA). Because the details of this collaboration have not been negotiated yet, however, the cost calculated
for this mission does not include any ESA contribution.
OCR for page 354