
2
Tracking and Accounting
The term “tracking,” as applied in the Chesapeake Bay Program (CBP), describes approaches to document the implementation of nutrient and sediment reduction practices and treatment technology upgrades and the basic associated practice characteristics needed to estimate resulting changes in nutrient and sediment loads. The term “accounting” describes the process of analyzing and reporting the practice information and quantifying the estimated load reductions. Reliable tracking and accounting of point and nonpoint nutrient reduction efforts are essential for program managers and policy makers to determine if current strategies are sufficient or if new strategies are necessary to meet established milestones. In addition, accurate and transparent tracking and accounting are key to maintaining public confidence that funds for Bay restoration are being wisely invested and that CBP partners are fulfilling their commitments to reduce nutrient and sediment loads.
By examining the strengths and weaknesses of current jurisdictional tracking and accounting practices, the committee provides insights into their reliability, accuracy, and consistency. In this chapter, the committee reviews and critiques the tracking and accounting practices for nutrient and sediment reduction efforts in the Chesapeake Bay.
TRACKING AND ACCOUNTING FRAMEWORKS
Diverse activities have been implemented within the Bay watershed to reduce nutrient and sediment loads, and many more are planned for the years ahead. The six states and the District of Columbia (i.e., the Bay
jurisdictions) have developed separate and distinct strategies within their regulatory and nonregulatory programs to identify, quantify, and attempt to control point and nonpoint sources of nutrients. In addition, state and federal agencies fund wastewater infrastructure improvements through the federal Clean Water Act State Revolving Funds and other programs designed to improve land management and reduce nutrient and sediment pollution. Finally, there are voluntary efforts that are not cost-shared by any particular state or federal agency. Ideally, tracking and accounting in the Bay watershed would account for all of these activities consistently and accurately, without duplication, and in a centralized framework.
The Bay jurisdictions bear the primary responsibility for tracking nutrient and sediment control efforts and reporting them to the CBP. Through a variety of state and local agencies, each jurisdiction compiles information about the nutrient and sediment control practices implemented in the Bay watershed to address point and nonpoint sources of pollution. The CBP has approved more than 60 agricultural and urban best management practices (BMPs) for credit in the Chesapeake Bay Watershed Model (see Appendix B) and has used a peer-review process to assign pollutant load-reduction effectiveness estimates to each BMP.
Any practice approved by the CBP and implemented since 1985 is included in the tracking and accounting of nutrient and sediment reduction strategies. In 1987, the CBP partners agreed to specific goals for pollution control (see Chapter 1), including a goal to reduce nitrogen and phosphorus discharges by 40 percent below 1985 levels by the year 2000. All nutrient reduction that has taken place since 1985 is, therefore, credited toward the achievement of those CBP goals and tracked in the Watershed Model.
All of the Bay jurisdictions report annually to the U.S. Environmental Protection Agency (EPA) data concerning compliance with National Pollutant Discharge Elimination System (NPDES) permits associated with point-source discharges, including for entities such as wastewater treatment plants and urban and suburban Municipal Separate Storm Sewer Systems (MS4s). All Bay jurisdictions have been delegated authority from the EPA to implement the NPDES program and, therefore, assume that regulatory responsibility. As part of that responsibility, the Bay jurisdictions check the quality and completeness of permit compliance and monitoring data in accordance with EPA-approved quality assurance plans and programmatic requirements before submitting the data to the CBP for incorporation into the Chesapeake Bay Model and tracking and accounting systems. Data from NPDES compliance monitoring are used in the tracking and accounting of significant wastewater treatment facilities. However, water quality monitoring is largely not part of the tracking and accounting process for nonpoint-source pollution control measures.
National permitting programs do not exist for nonpoint sources of pollution, which include general agricultural and forestry land uses, stormwater runoff from small communities that do not exceed population thresholds, and stormwater runoff from undeveloped native forested uplands and wetlands, including both privately and publically owned properties. Because national data collecting and reporting standards do not exist for nonpoint sources, individual Bay jurisdictions and the CBP have faced many challenges in their efforts to accurately account for the implementation of nutrient reduction practices. Activities can be especially difficult to track when BMPs are implemented on a voluntary basis rather than under a more formal governmental program.
Each of the Bay jurisdictions submits data to the CBP at least annually on the nonpoint source nutrient and sediment pollution control programs implemented in the watershed. In past years, the CBP struggled to handle the wide variety of data formats and spent a large amount of staff time incorporating these data into the Chesapeake Bay Model. However, since 2003, the CBP and Bay jurisdictions have devoted substantial efforts and resources to standardize data formats and develop approaches for electronic submission of both permit compliance and BMP data. The EPA provided grants to Virginia, Pennsylvania, and Maryland to develop templates for submitting nonpoint source and stormwater BMP data to a statewide database, which would then facilitate transferral to the CBP via the National Environmental Information Exchange Network (NEIEN) schema (see Figure 2-1). Data can be submitted using one or more of the following types of information to identify BMP locations: (1) latitude and longitude, (2) watershed code, (3) county name, or (4) national hydrography dataset (stream reach) codes. Data are then translated for use in the Watershed Model and related tools (see Figure 1-3) to assess progress toward program goals, based on nitrogen, phosphorus, and sediment load reduction efficiencies assigned to each practice. The usefulness of the NEIEN-exchanged data is highly dependent on the quality of the data entered into the system. NEIEN was completed in late 2010, and by December 2010 all agencies were required to submit their BMP implementation data through NEIEN (B. Burch, EPA CBPO, personal communication, 2010).
Tracking changes in atmospheric deposition of nitrogen to the Bay watershed is the responsibility of the EPA, which uses data from several national monitoring networks. These networks provide a good estimate of wet deposition of nitrate and ammonium, a fair estimate of dry deposition of nitric acid, nitrate, and ammonium, and poor estimates of ammonia dry deposition (see Box 2-1 for details).
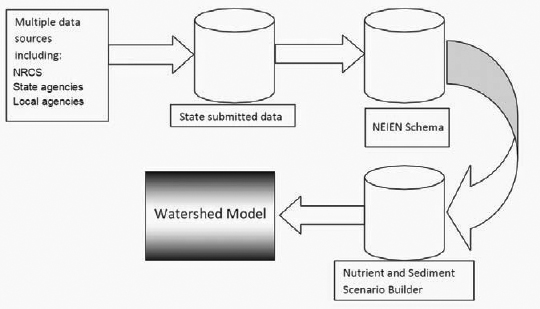
FIGURE 2-1 Role of NEIEN in data transmission to the Watershed Model.
SOURCE: Modified from Devereux (2009).
ASSESSMENT OF TRACKING AND ACCOUNTING
The committee was tasked to evaluate whether the tracking for implementation of nutrient and sediment control BMPs appears to be reliable, accurate, and consistent and to assess what is working and not working in each Bay jurisdiction and at the federal level (Tasks 1 and 2, Box S-1). To complete these tasks, the committee reviewed two main sources of information from each of the Bay jurisdictions: (1) a committee-generated questionnaire submitted to each of the Bay jurisdictions and the EPA and (2) relevant information submitted in the draft (September 1, 2010) and final (November 29, 2010) watershed implementation plans (WIPs). In this section, the committee provides a general assessment of tracking and accounting efforts and identifies key issues that affect multiple states. Jurisdiction-specific strengths and weaknesses in tracking and accounting are discussed briefly at the end of the section, summarized in Table 2-1, and detailed in Appendix C.
Jurisdiction-wide Issues in Tracking and Accounting
In general, the Bay jurisdictions responded that they have a good understanding of wastewater discharges and state cost-shared BMP data. However, key issues affecting the reliability, accuracy, and consistency of
BOX 2-1
Tracking Nitrogen Deposition in the Bay Watershed
Tracking of nitrogen deposition is dependent upon measurements for specific locations and calibration/validation of models for regional assessments. A complete understanding of nitrogen loadings from the atmosphere requires information on the wet deposition of nitrate, ammonium, and organic nitrogen and on dry deposition of the gases nitric acid and ammonia and the aerosols nitrate and ammonium.
The most intensive coverage for atmospheric nitrogen loadings exists for wet deposition of nitrate and ammonium through the National Trends Network of the National Atmospheric Deposition Program (NADP); within the Chesapeake Bay watersheds, there are 16 sites, 5 of which have been in place since 1987. There is no systematic program to determine the deposition of organic nitrogen to the Bay watershed, which probably leads to underestimates of nitrogen deposition by up to 25 percent (Neff et al., 2002).
The next most detailed coverage is provided by the Clean Air Status and Trends Network (CASTNET) program, established in 1991, which measures the concentrations of nitric acid, ammonium, and nitrate and then uses the Multi-Layer Model (MLM) to estimate the dry deposition flux. Within the Chesapeake Bay watershed, there are six measurement sites across three states—in Maryland (BEL116, BWR139), Pennsylvania (ARE128, PSU106), and Virginia (PED108, SHN418), with starting dates from 1991 to 1995.
Estimates of the dry deposition of ammonia, an important source of nitrogen loadings to the Bay watershed, are not made within CASTNET. A new program, the Ammonia Monitoring Network (AMON), was initiated in 2010 as part of the NADP to provide this information. Unfortunately, only three sites (PA00, MD08, and MD99) are in the Bay watershed.
In summary, monitoring data exist to provide good estimates of wet deposition and fair estimates of dry deposition of nitric acid, nitrate, and ammonium; however, understanding of ammonia dry deposition is poor and deposition estimates are, therefore, weak. Importantly, funding for the NADP and CASTNET sites has declined in real terms, leading to a reduction in the number of sites. Static funding over the past decade, combined with increasing operational and maintenance costs, means further loss of sites is likely. A decline in monitoring sites and funding seriously limits the ability to understand and track changes in atmospheric nitrogen loadings in response to management actions.
|
TABLE 2-1 Summary of Tracking and Verification Efforts for Land-based BMPs by Bay Jurisdiction |
||||
| Jurisdiction | Who Collects Information for Nonpoint Source BMPs? (federal agencies not included) |
Verification Process | ||
| Delaware |
Multiple agencies, including: • Dept. of Natural Resources and Environmental Control • Dept. of Agriculture • local government agencies for stormwater BMPs |
Field verifications are completed by each of the partner agencies. Aerial photography is used to verify the establishment of new agricultural BMPs annually. Cost-share reporting data is used to verify practice implementation. Stormwater BMPs field verified. | ||
| District of Columbia |
|
Dept. of the Environment (DOE) |
|
DOE conducts maintenance inspections of all stormwater management facilities. Inspections of wetland mitigation projects and recent tree plantings are also conducted. |
| Maryland |
Multiple agencies including:
• Dept. of Agriculture • Dept. of Environment (MDE) • Dept. of Natural Resources • Dept. of Planning • local government agencies Data compiled by MDE. |
Field verification for all sectors. See Appendix C for details. | ||
| New York | The Upper Susquehanna Coalition (USC) collects and reports all nonpoint source data. | USC field checks agricultural and wetland-related practices. Only field verified practices are reported. Frequency of verification not reported. | ||
| Process for Removing BMPs from the Database When Expired or Not Functioning? | Processes to Protect Against Double Counting? | Point Locations Provided? | Underreported Practices | |||
| NO | YES for ag. BMPs In development for stormwater BMPs | SOME (mostly in development) |
• Non-cost-shared practices • Stormwater and septic practices where databases are lacking |
|||
| No information provided. However, permitted facilities have maintenance plans. | YES, through Plan Review Database | YES, for most practices |
• Street sweeping • Practices on private lands with no permit • Forest conservation |
|||
| YES | YES for ag BMPs In development for stormwater BMPs | YES, for most practices |
• Stream restoration • Septic upgrades funded by local govt. • Innovative BMPs not yet approved by the CBP |
|||
| No information provided | No information provided | YES for ag. practices | Urban and septic practices are generally not reported | |||
| Jurisdiction | Who Collects Information for Nonpoint Source BMPs? (federal agencies not included) | Verification Process | ||
| Pennsylvania |
Dept. of Environmental Protection tracks and collects BMP data for most sectors, with assistance from other agencies, including:
• Bureau of Forestry • State Conservation Districts • Department of Agriculture • Infrastructure Investment Authority (PennVest) |
Verification and quality assurance of implemented agricultural BMPs are considered to be the responsibility of the federal and state agencies and the nongovernmental organizations providing the information. It is beyond the capacity or responsibility of PA’s Water Planning Office to complete such tasks. No information is provided about state agency-level verification. Construction-related stormwater BMPs are permitted and verified. | ||
| Virginia |
Many agencies including:
• Dept. of Health • Dept. of Environmental Quality • Dept. of Forestry • Dept. of Conservation and Recreation • Dept. of Agriculture and Consumer Services |
Permitted CAFOs currently inspected annually, after 7/1/2011 on a risk-based inspection schedule at least once every 5 years Inspections on land-disturbing activities for stormwater pollution prevention Up to 5% installed agricultural BMPs annually BMPs that are also alternative onsite sewage systems inspected at least annually. | ||
| West Virginia |
Dept. of Environmental Protection tracks and collects BMP data for most sectors, with assistance from:
• Dept. of Agriculture • Conservation Agency |
No current field verification process in place, although WV plans to develop verification protocols for stormwater and agricultural BMPs. | ||
NOTE: This table summarizes the more detailed data provided by each Bay jurisdiction on tracking and accounting (see Appendix C).
| Process for Removing BMPs from the Database When Expired or Not Functioning? | Processes to Protect Against Double Counting? | Point Locations Provided? | Underreported Practices | |||
| No information provided | NO (No additional processes beyond those used by all states to track BMPs by funding sources) |
NO |
• Cover crops • No-till cultivation • Manure storage • Stream fencing • Rotational grazing • Precision feeding • Septic tank hook-ups to central sewer |
|||
| No tracking of construction-related stormwater BMPs (an estimate of practices is instead provided) | ||||||
| No practice life reported, but BMPs can be removed if found on random inspections to be insufficient | YES for ag BMPs | YES for costshared ag. practices (others in development) | Septic systems connections Non-cost shared practices Urban stormwater BMPs over past 20 years Practices not approved by CBP | |||
| No information provided | YES | YES for stormwater practices | Non-cost-shared practices Practices missed because of poor tracking | |||
BMP tracking and accounting data include: (1) data privacy restrictions, (2) the challenge of accounting for voluntary practices, (3) limitations in staff resources for data management and quality assurance/quality control (QA/QC), (4) limitations in staff resources for field verification of practices, and (5) uncertainty in BMP load reduction effectiveness.
Data Privacy Restrictions
Much information regarding agricultural point and nonpoint source nutrient and sediment reduction activities within the Bay watershed resides within the U.S. Department of Agriculture (USDA), but privacy requirements associated with Section 1619 of the 2008 Farm Bill create challenges for accurately tracking agricultural BMPs. Under Farm Bill privacy requirements, federal and state agencies may not publicly release the addresses (or location data) for Farm Service Agency (FSA) or National Resources Conservation Service (NRCS) grant recipients. To comply with these privacy restrictions, these data previously have been submitted to the CBP aggregated at the county level, which reduces the spatial accuracy of calculated nutrient and sediment loads in the Watershed Model. However, a recent data sharing project between the U.S. Geological Survey (USGS), the FSA, and the NRCS in all Bay states allows the USGS to receive the point location data in confidence and aggregate these data at a watershed scale (hydrologic unit code [HUC] 8 or 11), for improved BMP location attributes in the Watershed Model, before submitting these data to the CBP. Aggregated data that do not divulge individual landowner information is not confidential.
This data sharing project has the potential to fill many of the information gaps about distribution of Farm Bill–funded BMPs implemented across the landscape. Additional opportunities to access aggregated data that do not violate the confidentiality provision of the Farm Bill could be used by the CBP. For example, records of nutrient management plans developed under Farm Bill programs could be compiled and reported in such a way that Bay jurisdiction administrators would at least know how many agricultural acres in each watershed county were being managed under an NRCS-developed or NRCS-approved nutrient management plan. However, some nutrient management plans are developed by state-certified plan writers. Because these plans are paid for by the land owners, they are proprietary. Thus, important nutrient management information may not be available to the USDA-USGS data sharing effort and to the CBP.
Non-cost-shared (Voluntary) Practices
Every Bay jurisdiction reports that there is little to no accounting for the implementation of BMPs that are installed without the support of federal or state cost-shared programs, sometimes called “voluntary practices.” Many agricultural and other BMPs are voluntarily implemented because of their inherent benefits to landowners. For example, significant acreage is farmed within no-till and other conservation tillage practices without regard to the CBP because they are good agronomic practices that permit double cropping and increase economic returns. The underreporting of non-cost-shared practices also affects the accounting of suburban and urban practices (e.g., stream restoration efforts by nonprofit organizations, non-cost-shared sewer line hook-ups). See Table 2-1 for examples of practices described by each jurisdiction as underreported.
Pennsylvania recently conducted several regional studies to document this data gap, focusing on key subsets of agricultural conservation practices. A pilot study that surveyed 17 percent of the farmland in Bradford County in northeastern Pennsylvania reported that up to 88 percent of the nutrient-control practices being used were not reported to the CBP because they were not cost-shared (PA DEP, 2010; see Table 2-2). However, the study did not attempt to quantify the effect of this under-reporting on the county’s (or the state’s) reported nutrient or sediment loads. The Pennsylvania study suggests that key practices may be significantly under-reported in some areas. Overall, available data are insufficient for the committee to assess the implications of non-cost-shared practices for accuracy of current BMP reporting in the various states or to evaluate the relative magnitude of this error against other potential accounting errors.
Maryland has recently implemented an aggressive inventory strategy to track and verify non-cost-shared practices and in 2009 launched the Conservation Tracker database, which can be used to track both cost-shared and non-cost-shared BMPs (MDE et al., 2010). However, as of fall 2010,
TABLE 2-2 Surveyed Agricultural BMPs in Bradford County, Pennsylvania
| Practice | Data Reported | Percent Not Cost-Shared |
| No till | 6,039 acres | 85 |
| Cover crop | 3,335 acres | 74 |
| Manure storage | 81 units | 43 |
| Stream fencing | 79 farms/339 acres | 51 |
| Rotational grazing | 74 farms/4,679 acres | 88 |
SOURCE: PA DEP (2010).
Conservation Tracker was only being used to track cost-shared practices (MD DNR, 2010b). In November 2010, Virginia outlined a multi-phased strategy to collect, store, and report non-cost-shared agricultural and forestry BMP data, although it acknowledged that better accounting for non-cost-shared practices alone would not enable the state to reach its milestone goals (VA DNR, 2010). Delaware developed a BMP survey form through a pilot study in the Choptank River watershed that could be used in the future to collect data on non-cost-shared practices (DE DNREC, 2010).
If voluntary BMP implementation is not significant in a particular state, then federal or state cost-shared practice information will by necessity have to suffice. However, if states find that non-cost-shared practices significantly affect their total loads, then rigorous state-level programs would be of value to facilitate data collection, verification, and quality control and to assess progress towards management goals. President Obama’s 2009 Executive Order 13508 pledged: “By July 2012, mechanisms for tracking and reporting of voluntary conservation practices and other best management practices installed on agricultural lands will be developed and implemented.” As of early 2011, the CBP partners, with USDA and state leadership, were still considering how they will implement non-cost-shared BMP tracking while ensuring that data meet CBP expectations for reliability, accuracy, and verification. The EPA has explained its expectations for non-cost-shared BMP data, including procedures to prevent double counting, to allow for field verification, and to ensure that the datasets are updated over time to reflect land conversions or maintenance failures (EPA, 2010c,d; K. Shenk, CBP, personal communication, 2011). The CBP will also need to consider that current models have been calibrated with many of these uncounted practices in place. Therefore, if these non-cost-shared practices are eventually added to the model even though they were in place during the model calibration period, their load reductions may effectively be double counted.
Data Management
Currently, CBP data management and quality control efforts are staff-and resource-intensive endeavors, especially as the program transitions to electronic BMP reporting. Tracking BMP data from multiple data sources requires rigorous QA/QC efforts, and weaknesses in state-level programs combined with resource limitations will contribute to reduced accuracy and reliability. For example, double counting can occur when a specific BMP receives both state and federal funding. USDA privacy restrictions may also limit the capacity to cross-check state- and federally funded BMPs and other conservation efforts to minimize double counting. Other errors that affect data quality include incorrect entry of BMP data from stormwater permit reporting or failure by states to remove from the database BMPs
that are no longer in operation, perhaps because they have exceeded their reasonable lifespan or because the land use has changed since the BMP was implemented.
Of the seven Bay jurisdictions, only Maryland, the District of Columbia, Virginia, and Delaware reported specific practices to reduce double counting, and those practices were sometimes limited only to certain sectors (see Appendix C). Additionally, only Maryland reported that BMPs were assigned specific lifespans, after which those BMPs would be removed from the database. Many states expressed optimism that electronic reporting via NEIEN would significantly reduce double counting of cost-shared BMPs. NEIEN, however, may simply transfer this problem from the states to the CBP if the cost-share data are not first screened for double-counting at the state level prior to electronic submissions. Cost-share privacy issues would need to be addressed to fully resolve this problem as each BMP would require a unique identifier such as a specific location to facilitate cross-checking of activities between state and federal databases.
In addition to improving data quality, electronic submissions of local and state BMP data should also significantly reduce the data management burden on state staff, particularly for those states that previously had to compile data from paper files. Nevertheless, there appears to be unequal progress toward improving data management among the Bay jurisdictions. Those jurisdictions with greater resources can devote more attention to data management and electronic data submissions. Those with greater resources are also more likely to invest in training for local agency staff on how to manage data effectively and accurately and how to use available tools for nutrient accounting.
Resources not only affect the staffing levels for data management and QA/QC, they also affect the ability to record precise locations of practices (i.e., geo-referencing), which is under way in some states (see Table 2-1). The precise location of a BMP within a watershed (e.g., distance from a stream) will affect its performance; thus, geo-referencing BMPs is critical to improving the Watershed Model’s predictions of nutrient load reductions (Djojic et al, 2002). States with limited resources would, understandably, prefer to spend available funding on BMP implementation rather than on tracking and accounting efforts, perhaps sacrificing some level of reporting accuracy for greater load reductions in the long run.
Field Verification
The extent of field verification of urban and agricultural nutrient and sediment BMPs varies widely with state resources. Field verification ensures that the BMP implementation data are reliable and accurate and that the installed practices meet the definitions and design standards used by the
CBP to estimate efficiency and performance. However, the necessary staff and travel expenses make field verification extremely costly. Field inspections ideally should occur when BMPs are actually performing (e.g., during or shortly after rain events). Timing field inspections in this way would significantly improve the reliability of verification results. Virginia, the District of Columbia, Maryland, and New York reported that they have programs in place to field verify BMP implementation and maintenance. However, at most, these programs field verify approximately 8-10 percent of agricultural BMPs per year; most programs verify far fewer or do not report the number of verified sites. Details on these verification programs are provided in Appendix C. Because of staffing and financial limitations, adequate state or federal funding to visit every participating landowner to verify recordkeeping and other implementation-related data seems unlikely. Also, in many cases, agencies charged with implementing BMPs are the same as those conducting the tracking and accounting, sometimes leading to a perception of a biased verification system. Random verification programs by agencies/personnel independent of those advising installation help to build confidence that reported data are accurate and reliable and can be sized to available resources.
Ultimately, a reasonable balance of implementation and verification is necessary to optimize resources while maintaining the CBP’s credibility. The EPA has indicated that jurisdications will need to develop programs to verify that BMPs are properly designed, installed or implemented, and maintained to get full credit in the Watershed Model (EPA, 2010c). Additional EPA guidance on the extent of verification in relation to expected benefits would be useful. As a surrogate for field verification, grower and developer survey questionnaires could be mailed to gauge participation, followed by some percentage of field visits to confirm the reliability of the survey data. For example, available trends in county-level fertilizer sales data could be used to gauge the extent of nutrient management related BMP implementation. Remote sensing also might offer lower cost verification of some practices. Early verification is important to determine whether practices have been implemented according to recommended standards, but some level of periodic verification is also needed to determine whether practices are still in place and are being maintained properly. Developing ways to optimize field verification efforts will ultimately enhance the reliability of the BMP data sets, perhaps through some combination of remote sensing data, written surveys, phone calls, and site visits.
BMP Efficiencies
Data on BMP implementation are converted into load reductions by the Watershed Model using load reduction efficiencies established by the
Water Quality Goal Implementation Team (WQGIT) of the CBP. Thus, load reduction efficiencies are critical components of both goal-setting and implementation progress accounting.
The efficiencies of municipal and industrial wastewater nutrient control technologies are well understood because of the high level of process control at centralized wastewater treatment facilities. In addition, NPDES permitting requires monitoring at centralized treatment facilities, so results of management actions accurately reflect nutrient and sediment load reductions in the field.
In contrast, the BMP efficiencies for diffuse sources, such as suburban, urban, and agricultural nonpoint sources, are less predictable and vary widely with local site conditions. Many factors affect the pollutant removal efficiency of BMPs and create challenges for establishing BMP efficiencies for the Watershed Model. Field monitoring of BMPs on a comprehensive basis is neither practical nor affordable.
Performance of BMPs in the field may vary with age and level of maintenance. The lack of adequate maintenance and life-cycle replacement can reduce intrinsic pollutant removal design capabilities and negatively affect performance. BMP efficiency can also change as treatment systems age; those systems that rely on natural biological features may improve with maturity but act as a sink during the growing season and a source of nutrients during the non-growing season even after they mature. Technology-based BMPs (e.g., storm drain filter inserts) may lose effectiveness with time due to clogging and general wear and tear.
BMP efficiency is also a function of location and site conditions, which vary widely. BMP efficiency is heavily influenced by rainfall amount, intensity, and duration; soil type and slope; land use; and proximity to the receiving water body. Implementation, operation, and maintenance of agricultural BMPs also may vary widely from the NRCS Conservation Practice Standard. For instance, cover crops can vary by type of crop used, extent of ground cover achieved, whether manure is applied, and whether the cover crop is harvested, plowed in, or left as protective cover on the field, each of which affects the overall practice efficiency. Thus, as noted previously, it is important to verify that the installed practices meet the definitions used by the CBP to establish efficiency estimates.
BMP efficiency in a field situation can be difficult to study because of the costs and challenges associated with monitoring, especially when pollutant loading is driven by weather events that can be erratically distributed in time and space. As a result, BMP efficiencies are often derived from limited research or small-scale, intensive, field-monitoring studies in which they may perform better than they would in aggregate in larger applications, particularly at the watershed scale. Thus, estimates of load reduction efficiencies are subject to a high degree of uncertainty.
Concerns about the accuracy of BMP load reduction efficiencies used in the Watershed Model led to a detailed review of currently available science for both urban and agricultural practices (Simpson and Weammert, 2009). The EPA (2010e) also provided extensive land management guidance that is applicable to federal and non-federal lands and that addresses agriculture, urban and suburban areas, forestry, riparian areas, decentralized wastewater treatment systems, and hydromodification. Simpson and Weammert (2009) and the EPA (2010e) provide detailed assessments of BMP applications and efficiencies, including offsets for land use changes. A review of the Simpson and Weammert (2009) efficiencies acknowledges a predictably high degree of spatial and temporal variability and uncertainty depending on hydrogeomorphic region, land use, and to a certain extent type of BMP (Table 2-3). Because of the variety of factors affecting BMP efficiency, including maintenance and longevity effects, Simpson and Weammert (2009) were conservative in their efficiency estimates.
The committee did not undertake a separate detailed review of BMP load reduction efficiencies, although the original documentation by Simpson and Weammert (2009) and the EPA (2010e) were thoroughly peer-reviewed prior to publication. In addition, BMP efficiencies have been the subject of numerous studies, especially by the Center for Watershed Protection
|
TABLE 2-3 Range in Load Reduction Efficiency (percent decrease) Estimates for Select Best Management Practices implemented in the Chesapeake Bay Watershed |
|||
|
Best Management Practice |
Total N | Total P | Sediment |
| Conservation plans | 3–8 | 5-15 | 8-25 |
| Conservation tillage | 8 | 22 | 30 |
| Forest buffer | 19-65 | 30-45 | 48-60 |
| Grass buffer | 13-46 | 30-45 | 40-60 |
| Wetland creation and restoration | 7-25 | 12-50 | 15 |
| Cover crops | |||
|
Coastal plains/ Piedmont—crystalline |
11-45 | 0-15 | 0-20 |
| Mesozoic lowlands/Ridge and Valley—siliciclastic | 9-34 | 0-15 | 0-20 |
| Ammonia emission reduction | 15-60 | NA | NA |
| Dairy feed management | 24 | 25 | 0 |
| Mortality composting | 40 | 10 | 0 |
SOURCE: Adapted from Simpson and Weammert (2009).
(CWP), the Water Environment Research Foundation (WERF), and the EPA.1 Although unable to review and assess the technical aspects of BMPs and their efficiencies, the committee endorses the approach taken by the CBP to develop research-based BMP efficiencies and concludes that the general approach and associated conservative assumptions are reasonable given currently available science.
Despite this endorsement, the committee acknowledges the need to continuously assess and improve upon the current understanding of BMP efficiencies. Therefore, targeted monitoring programs in representative urban and agricultural streams are needed to evaluate associated water quality changes over time and to validate or improve model predictions, particularly at the watershed scale.
As new field research becomes available, BMP efficiencies for the Watershed Model should be updated. The CBP WQGIT recently developed a protocol by which estimates of BMP efficiencies can be revised or additional BMPs can be accepted for use in the Watershed Model (CBP WQGIT, 2010). This protocol provides an adaptive approach to reducing the high levels of uncertainty in estimates of BMP efficiencies. The protocol requires a six-person panel composed of experts in water quality and experts in the proposed BMP to work with the relevant source-sector workgroup to develop a report that includes:
• Detailed definition of the land use or practice,
• Estimates of recommended nitrogen, phosphorus, and sediment loading or efficiency, and justification for the selected efficiency estimates,
• Locations in the watershed and land uses to which the BMP is applicable,
• Conditions under which the BMP works and does not work,
• Temporal performance,
• Useful life and effectiveness over time, and
• Operation and maintenance requirements (and impacts of neglect).
The relevant source sector workgroups, the Watershed Technical Workgroup, and the WQGIT review the panel’s recommendations before the BMP is adopted for use in the Watershed Model. This strategy appears to be a reasonable, consensus-based mechanism to assign pollutant removal efficiencies to new practices not currently represented in the model (e.g., low-impact design, state-of-the-art stormwater controls) and update BMP efficiencies or offsets from land-use conversions with new data, while main-
_____________________
1 For details and references, see CWP—http://cwp.org/; WERF—http://www.werf.org//AM/Template.cfm?Section=Home; and EPA water programs—http://www.epa.gov/owow_keep/nps/chesbay502/downloads.html.
taining rigorous review standards. Past experience, however, has shown that credited BMP efficiencies have more commonly been decreased rather than increased in the light of new field information.
What Is Working and Not Working in Each
Jurisdiction and in the Federal Agencies
As previously described, the Bay jurisdictions’ tracking and accounting approaches vary substantially. Programmatic components are summarized in Table 2-1, and full details are provided in Appendix C. Ideally, each Bay jurisdiction would have a clear organizational framework for BMP reporting, geo-located data for accurate conversion of the data into the Watershed Model, a rigorous QA/QC process that includes some level of field verification, a process for removing BMPs when they have expired or are not functioning, processes to prevent double counting, and few unreported practices. In reality, most jurisdictions are still working through these challenges, and there are significant disparities between the human and financial resources applied to tracking and accounting across the states. All of the Bay jurisdictions are working to improve their practices, but resources remain the primary limiting factor.
BMP Reporting and Transparency
All Bay jurisdictions have identified an organizational reporting structure for tracking and accounting among various state and local agencies, although the complexity of these structures varies widely. The District of Columbia reports all data through a single agency, which simplifies data collection, quality control, and reporting, but most states have more complex multi-agency reporting responsibilities. Some Bay jurisdictions suggested communication would improve if each jurisdiction and the CBP had a single point of contact for tracking and reporting issues.
Most Bay jurisdictions report BMP implementation on an annual basis to the CBP (on December 31, for the prior July-June period), and all jurisdictions are required to submit these data through NEIEN. Although the recent conversion to the NEIEN schema promises to improve data management, the system appears to have made the data less accessible to some jurisdictions. Whereas, previously, states compiled their BMP data from multiple agencies on an annual basis, now many state and local agencies submit their data separately. Thus, a jurisdiction may now only see its overall annual progress update after it has been compiled by the CBP, unless it has procedures in place to separately compile the data. Because of the time it takes for the CBP to compile the data and run the models to convert the BMP data into load reductions, significant delays (currently a minimum of
9 months) occur between BMP implementation and progress assessments, which hinder the application of adaptive management (see Chapter 4). Only Maryland reports its implementation progress more frequently via its own BayStat website, which it uses to make frequent adjustments to its BMP program to ensure achievement of its milestone goals.2
In January 2011, the CBP launched a new tracking and accounting system (Bay TMDL Tracking and Accounting System [BayTAS]) to track all of the Bay jurisdictions’ progress toward meeting the TMDL requirements. BayTAS will be used to track progress for both point and nonpoint sources using geographic information system (GIS) technologies and the Watershed Model, and data will be displayed by state, segment, or facility on the CBP’s new ChesapeakeStat website.3 Among the questions the EPA expects to answer with BayTAS are:
• What is the status of BMP practice implementation and programmatic activities?
• What is the status of two-year milestone achievement?
• Are point source wasteload allocations being achieved? Are non-point source load allocations being achieved?
• Are states on target to achieve the Bay TMDL?
Because the forum is publicly accessible, BayTAS also improves the transparency of implementation data (P. Rana, EPA, personal communication, 2011). It remains unclear whether the system could be used for more frequent reporting by Bay jurisdictions to provide them with a tool to assess their progress toward the two-year milestones.
All Bay jurisdictions reported challenges in counting and reporting voluntary practices, as discussed earlier in the chapter. Only Maryland has developed a process to report voluntary practices, although it has not yet been implemented. Virginia and Delaware are actively developing and other states are considering such a process. Some jurisdictions also mentioned that they do not report some practices because of insufficient databases (e.g., septic system upgrades or hook-ups, stormwater practices) or challenges in converting the data into the format expected by the CBP (e.g., street sweeping). The EPA is working to overlay wastewater service areas to identify those areas served by septic systems in Phase 5.3 of the Watershed Model.
_____________________
Geo-referencing
Three Bay jurisdictions geo-reference all or most BMPs that are tracked (i.e., New York, Maryland, District of Columbia); three states provide point locations for at least some BMPs (Virginia, West Virginia, Delaware; see Appendix C for details). Pennsylvania does not provide point locations for BMPs but instead reports them by county. Those locations that are not geo-referenced are typically reported by county, although some are reported by watershed or stream reach. Even Bay jurisdictions that collect location data for all new practices face challenges in siting historical BMPs that remain in the database. If BMPs are reported by county, then the EPA must make assumptions regarding the locations of these practices within specific watersheds. Proximity of the land use and BMPs to a water body is one of the major factors that affect the delivery of pollutants (Djojic et al., 2002). Thus, without accurate geo-location of urban and agricultural BMPs, there will be errors in accounting for BMP impacts on pollutant loads.
Quality Assurance and Quality Control
Field verification of agricultural BMPs is limited for some Bay jurisdictions (e.g., West Virginia, Pennsylvania), while other jurisdictions have implemented structured field verification programs (e.g., Virginia verifies up to 5 percent of agricultural BMPs annually, Maryland verifies 7-8 percent of agricultural BMPs annually, and New York verifies all reported practices). Most states reported some level of field verification for permitted stormwater management practices.
QA/QC of BMP data varies across the states. Maryland, the District of Columbia, Virginia, West Virginia, and Delaware reported specific strategies in their WIPs to reduce double counting of BMPs (DDOE, 2010; DE DNREC, 2010; MDE et al., 2010). Virginia reported that privacy agreements have only recently allowed its agencies to examine FSA or NRCS data to check for double counting in a manner that is consistent with Farm Bill privacy-related restrictions. Only Maryland and Virginia reported processes to remove BMPs when they are no longer functioning or have expired. As a result, “legacy” BMPs and double-counted BMPs from some jurisdictions will result in overestimating the extent of nutrient load reductions.
Despite inconsistencies in philosophy and approach, a great deal of information is available, and good faith efforts are under way to resolve some of the hindrances to data access, collection, and standardization (see Appendix C). The Bay jurisdictions are not likely to modify their respective programs to bring them into perfect alignment, but they are developing their own tailored programs based on their own circumstances and
priorities. Although statewide programs are unlikely to be identical to one another in process or in fiscal and personnel allocations, the CBP has recently made strides toward common reporting goals and data requirements, in part because of the WIP process. The Bay jurisdictions are adapting to these data quality expectations, and some jurisdictions are much closer to meeting these expectations than others. However, electronic data management, new databases, and data transfer schema should ultimately reduce the BMP tracking and accounting burden for all jurisdictions.
How Do Gaps and Inconsistencies in Tracking
Affect Reported Program Results?
As described above, the current tracking and accounting of BMPs is not consistent across the Bay jurisdictions. The committee was also tasked to evaluate the accuracy and reliability of the BMP tracking data and assess how gaps and inconsistencies appear to impact reported program results (Tasks 1 and 3, Box S-1). Thus, the committee attempted to estimate the extent of error in the BMP implementation data. On the one hand, the CBP could under-count BMP implementation rates and levels because state-reported data do not include non-cost-shared practices. Given that at least some of these practices were in place when the model was calibrated, the extent of error that these uncounted practices introduce into the overall simulations is unclear. Even recent pilot studies to quantify these differences at a county scale (e.g., Table 2-2) did not extrapolate the findings to nutrient load estimates. On the other hand, the model could over-count BMP implementation rates and levels, because few states account for the loss of BMPs when they are no longer in place or no longer effective or for known double-counting problems. State quality assurance project plans (QAPPs) generally do not specify procedures to evaluate differences between quantities of activities reported to the CBP and actual on-the-ground implementation, despite the EPA’s request that jurisdictions include such information in the QAPPs (J. Winters, EPA, personal communication, 2010).
The nonuniformity of BMP efficiencies can lead to inaccuracies in Watershed Model simulations. Any error in accounting for the areal extent of implemented BMPs will have direct impact on the load simulations. Such errors can cause either under- or over-estimation of loads by the Watershed Model. Furthermore, there are several discrepancies between a state’s and CBP’s definitions of BMP management that affect the accuracy of the calculated nutrient load reductions. For example, states allow application of manure to cover crops, while the CBP definition for cover crops assumes no manure is applied.4
_____________________
4 No manure is applied except on commodity cover crops after March 1.
BOX 2-2
Florida Agricultural Nonpoint Source Best Management
Practices Summary
The Florida agricultural BMP program was formalized in state law with the passage of the Watershed Restoration Act (WRA) (Ch. 403.067 F.S.) in 1999. The WRA is Florida’s blueprint for development and implementation of TMDL provisions of the Clean Water Act primarily focused on achieving nutrient load reductions to impaired water bodies. Implementation of a TMDL through adoption of a Basin Management Action Plan requires agricultural landowners to either implement BMPs or monitor water quality. The WRA charges the Florida Department of Agriculture and Consumer Services (FDACS) with the responsibility for agricultural BMP development.
The WRA mandates that agricultural BMPs be: (1) based on sound science (generally using University of Florida expertise); (2) adopted by administrative rule into the Florida Administrative Code; (3) verified as effective by the Florida Department of Environmental Protection initially using best professional judgment followed by water quality monitoring; and (4) revised accordingly, with revisions implemented by participating landowners, if BMPs are found ineffective in meeting water quality goals. All FDACS BMP programs mandate the implementation of nutrient management plans.
The WRA also requires that FDACS develop and adopt by Rule a formal procedure for agricultural landowners to enroll their lands in the BMP program. This procedure requires landowners to submit name and contact information, land parcel tax identification number(s), crops be-
Based on the information provided, the overall accounting of BMPs in the Bay watershed cannot be viewed as accurate. However, the committee was not able to determine the magnitude or the likely direction of the overall reporting error (that is, whether the actual load reductions of currently implemented practices are likely to be greater or less than the current modeled output based on the practices counted). Some of these errors will likely cancel each other out, but there is substantial room for improvement. Additionally, the committee was unable to determine whether the actual data reported by each jurisdiction are reliable and accurate. The only way to truly assess the reliability and accuracy of the reported data would be through independent (third-party) auditing of the tracking and reporting at state and local levels.
ing produced, and specific BMPs being implemented. Landowners who enroll in the BMP program and implement all applicable BMPs receive a “presumption of compliance” with nutrient water quality standards and become eligible for state cost-share funding. Eighty-three percent (1.5 million acres) of statewide irrigated agricultural acreage is enrolled. An additional 6.6 million acres of nonirrigated land is also enrolled. The current total of 8.1 million acres will expand dramatically over the next year as the focus for enrollment will be on the largest agricultural land use in Florida: improved and unimproved pasture land for beef cattle production. FDACS BMP programs now cover forestry, citrus, vegetables and row crops, sod, containerized nurseries, specialty crops (tropical fruit, blueberries, pecans, etc.), and beef cattle. BMP programs are under development for the equine and field-grown nursery industries.
FDACS has also developed a quality assurance program to follow up with enrolled landowners to verify that they are implementing the BMPs identified on their submitted documentation. On a statewide basis, the quality assurance program consists of grower surveys and site visits to verify survey results for a fraction of the respondents. In high-priority watersheds (the Suwannee River and Lake Okeechobee Basins) participating landowners are visited in greater proportion and frequency.
Since the inception of the program, Florida has spent $75.5 million on developing, implementing, and evaluating agricultural BMPs. This state money has leveraged in excess of $200 million in USDA/NRCS Environmental Quality Incentives Program (EQIP) funding over the same period of time. FDACS estimates that landowners have contributed at least $60 million in capital costs, not including long-term operation and maintenance.
HOW CAN THE TRACKING SYSTEM BE
STRATEGICALLY IMPROVED?
Although many programs are actively in place to improve the tracking and accounting system, in this section the committee proposes additional strategies that could improve BMP tracking in the CBP.
A Consolidated Chesapeake Bay Region Agricultural BMP Program
All Bay jurisdictions lack the ability to reliably and consistently document agricultural nonpoint source BMPs that are implemented without the assistance of federal or state cost-share programs. These shortcomings could be overcome by the development and implementation of BMP
programs similar to those that exist elsewhere in the nation whereby agricultural producers report voluntary conservation practices that would otherwise be unaccounted for (see Florida example in Box 2-2).
The establishment of a regional BMP program, perhaps coordinated by an independent organization or alliance of organizations (e.g., the American Farm Bureau Federation, the National Association of Conservation Districts) with close coordination with the Bay jurisdictions’ respective Departments of Agriculture, would lay the foundation for a more formal program to track and account for voluntary BMPs. This BMP program could include record keeping and reporting requirements, including reporting of geo-locations for BMP data. Verification of BMP implementation could occur through random field inspections of a percentage of program participants. The BMP efficiencies could be assessed through representative site water quality monitoring coupled with watershed or sub-watershed-scale monitoring, which would serve to document a range of nutrient load reduction estimates for prioritized conservation practices. Initially, financial and human resources for this program could be focused on the regions of each state that are within the Bay watershed, although state TMDL initiatives would likely benefit from such programs implemented statewide. Coupling cost-share eligibility (for those states that allocate cost-share funds) to BMP program participation is an effective mechanism to entice landowners to participate. Structured properly, a state program can also leverage USDA cost-share funds and further reduce landowner costs for BMP implementation. Reducing property taxes for participating agricultural landowners would likely be an effective incentive, although local governments would suffer lost revenues. Finally, disincentives are possible tools, such as requiring parcel-scale water quality monitoring if landowners choose not to implement BMPs. Providing agricultural producers who implement, report, and maintain BMPs with a presumption of compliance with water quality standards has proven to be a powerful incentive for landowners in Florida and has contributed to successful long-term operation and maintenance of implemented BMPs (Box 2-2). USDA has recently begun discussions with EPA and Bay jurisdictions about developing a similar such program in the Chesapeake Bay, where farmers would agree to implement certain practices in exchange for presumptive compliance with regulations (A. Mills, USDA, personal communication, 2011).
Expanded Geo-location Data
Although some states are working toward geo-referencing all BMPs, most states are far from this goal. Geo-referencing will improve the tracking of implemented BMPs with time, allowing easier quality control checks for double counting and improving the accuracy of siting in the Watershed
Model, thereby improving the accuracy of the modeled loads. Once accurately geo-located, the information can be used in increasingly finer scale models. Geo-referenced data can also help to assign proper pollutant delivery ratios in the Watershed Model and to prioritize BMP inspections based on the proximity of BMP implementation to the receiving water body, as described by Djojic et al. (2002).
CONCLUSIONS AND RECOMMENDATIONS
Accurate tracking of BMPs is of paramount importance because the CBP relies upon the resulting data to estimate current and future nutrient and sediment loads to the Bay. However, many Bay jurisdictions and localities are struggling with limited resources, complex and rapidly changing data reporting mechanisms, data privacy constraints, and QA/QC needs. Verifying the continued functioning and effectiveness of historical activities presents a significant challenge. Although state tracking and accounting programs are unlikely to be identical, the CBP has recently made strides toward common reporting goals and data requirements through the watershed implementation plan (WIP) process, the NEIEN, and the recent launch of BayTAS.
The current accounting of BMPs is not consistent across the Bay jurisdictions. Additionally, given that some source-sector BMPs are not tracked in all jurisdictions, the current accounting cannot on the whole be viewed as accurate. Although the Bay jurisdictions have a good understanding of point-source (i.e., wastewater) discharges, numerous issues affect the accuracy, reliability, and consistency of BMP reporting to the CBP. Only five of the seven Bay jurisdictions conduct any level of field verification of agricultural practices, and there are known problems with double counting that agencies are working to resolve. Only one Bay jurisdiction specifies a lifespan for practices recorded in the database, and few jurisdictions have mechanisms to identify and remove from the database practices that are no longer functioning or even in place. Current tracking systems do not account for agricultural practices that are not cost-shared by a government agency. Given these limitations, current accounting can be considered, at best, an estimate.
The committee was unable to determine the reliability and accuracy of the BMP data reported by the Bay jurisdictions. Independent (third-party) auditing of the tracking and accounting at state and local levels would be necessary to ensure the reliability and accuracy of the data reported.
The committee was not able to quantify the magnitude or the likely direction of the error introduced by BMP reporting issues. On the one hand, there is under-counting of BMPs because the jurisdictions do not currently report non-cost-shared practices, although the model calibration
may include the effects of some of these practices. On the other hand, there is over-counting of BMPs because few states account for the loss of BMPs when they are no longer properly maintained, functioning, or in place. Furthermore, there are errors introduced by site-level variability in BMP effectiveness, insufficient data on the location of BMPs, and discrepancies between state and CBP definitions of BMP management.
A consolidated regional BMP program to account for voluntary practices and increase geo-referencing of BMPs presents opportunities to improve the tracking and accounting process. A regional BMP program with incentives for participation as well as penalties for lack of participation has been effectively used in Florida to increase participation and improve data quality. Geo-referencing enables managers and modelers to identify the parcel-level location of BMPs, which would aid in inspecting, tracking, and assigning proper delivery ratios and BMP efficiencies, thereby improving the accuracy of the modeled estimates of nutrient and sediment loads delivered to the Bay.
Targeted monitoring programs in representative urban and agricultural watersheds and subwatersheds would provide valuable data to refine BMP efficiency estimates, particularly at the watershed scale, and thereby improve Watershed Model predictions. Current BMP load reduction efficiency estimates used in the Watershed Model are reasonable estimates of the short- to intermediate-term reduction efficiencies of newly installed BMPs at the field scale and gross representations of the same at the watershed scale. These estimates contain significant uncertainties caused by site-specific factors, practice design, extent of maintenance, and challenges in scaling up the data from the plot or field scale. Pilot studies in several subwatersheds should be conducted to quantify BMP performance, particularly for the most common practices with the greatest uncertainty in their efficiency estimates. The CBP has recently implemented a review process to refine BMP efficiencies used in the Watershed Model based on emerging research findings.
Additional guidance from the EPA on the optimal extent of field verification of practices in relation to expected benefits would improve tracking and accounting of both cost-shared and voluntary practices. Field verification is costly, and several states have questioned its value given the resource constraints that limit BMP implementation. Although independent random or probabilistic verification programs increase public confidence that reported data are accurate and reliable, attention should be given to developing ways to optimize field verification efforts that enhance the reliability of the BMP data sets, perhaps through the combined use of remote sensing data, written surveys, phone calls, and in-person visits.
Electronic tracking and data transfer systems are likely to improve the quality of reporting and reduce the jurisdictions’ tracking and account-
ing burden but may currently be contributing to delayed assessments of implementation progress. Despite the concerns in tracking and accounting noted above, a great deal of information is available, and a plausible and collective effort seems to be under way to resolve some of the hindrances to data access, collection, and standardization. However, because implementation data are now reported electronically, several jurisdictions noted that the data are less accessible for assessments of statewide progress. Some Bay jurisdictions have mechanisms in place to compile progress updates as needed, but others have to wait approximately 9 months after the end of the reporting period for a summary of BMP implementation progress from the CBP. The recently launched tracking and accountability system for the TMDL (BayTAS) and ChesapeakeStat, which documents each jurisdiction’s progress in a publicly accessible website, should incorporate mechanisms for more timely reporting and consolidation of federal and state data submissions.
This page intentionally left blank


