
B
Federal Funding of Tick-Borne Diseases
The Committee on Lyme disease and Other Tick-Borne Diseases surveyed federal agencies in the summer of 2010 to request information about the funding for tick-borne diseases to understand how the funding was distributed across agencies, across types of tick-borne diseases, and across study types. The following analysis is the result of the responses from the agencies, and while every effort was made to include all agencies, the Committee recognizes that some agencies may be missing and that it wasn’t always possible to break out programs or dollar amounts. The analysis of this data was done by Andrea Bankoski, a graduate student at George Mason University, as an individually authored report to the Committee.
TICK-BORNE DISEASE FUNDING
Figures B-1 and B-2, and Table B-1 report the funding for tick-borne disease studies1 in the United States, which has totaled 369,61,539 from 2006 to 2010. Nine United States agencies2 have allocated this funding
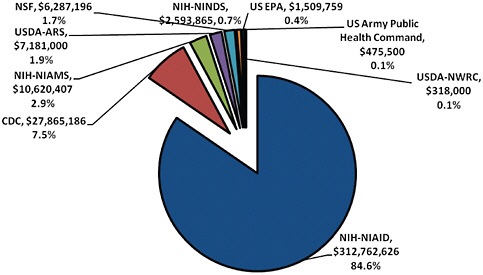
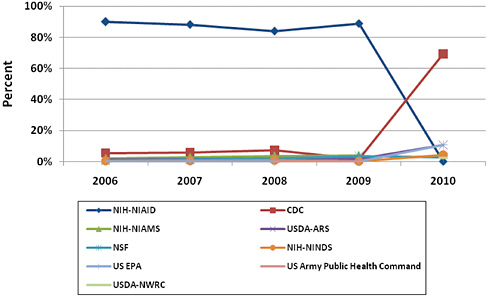
TABLE B-1 Annual Funding of Tick-Borne Disease Studies by Agency/Organization, 2006–2010
|
Agency/Org (#) |
2006 |
2007 |
2008 |
2009 |
2010 |
Average |
|
NIH-NIAID (404) |
$91,765,324 |
$83,686,260 |
$63,747,787 |
$73,563,255 |
— |
$62,552,525 |
|
CDC (19) |
$5,706,765 |
$5,631,765 |
$5,614,765 |
$1,226,765 |
$9,685,126 |
$5,573,037 |
|
NIH-NIAMS (15) |
$2,051,376 |
$2,579,209 |
$2,758,608 |
$3,231,214 |
— |
$2,655,102 |
|
US-EPA (6) |
— |
— |
— |
— |
$1,509,759 |
$1,509,759 |
|
USDA-ARS (5) |
$1,424,000 |
$1,428,000 |
$1,447,000 |
$1,376,000 |
$1,506,000 |
$1,436,200 |
|
NSF (5) |
$390,196 |
$1,093,733 |
$1,436,180 |
$2,990,954 |
$376,133 |
$1,256,439 |
|
NIH-NINDS (4) |
$662,366 |
$458,834 |
$654,163 |
$220,625 |
$597,877 |
$518,776 |
|
US Army PHC (1) |
$237,750 |
$237,750 |
$243,500 |
$232,000 |
$237,750 |
$237,750 |
|
USDA-NWRC (2) |
— |
— |
— |
— |
$318,000 |
$318,000 |
|
YEARLY TOTAL |
$102,000,027 |
$94,877,801 |
$75,902,003 |
$82,840,813 |
$12,483,136 |
$73,620,756 |
to 45 studies. Tick-borne disease studies were grouped into six study type categories.
Figure B-1 shows the total allocation of funding by agency/organization for all studies between 2006 and 2010. The NIH-NIAID has funded the greatest amount of tick-borne disease studies—a total of 404 studies comprising 85% of the funding from all agencies and organizations. The CDC has funded 19 tick-borne disease studies from 2006 to 2010, 7% of the funding from all agencies and organizations. NIH-NIAMS has funded 15 tick-borne disease studies all between 2006 and 2009.The remaining agencies—USDA-ARS, NSF, NIH-NINDS, US Army Public Health Command, Environmental Protection Agency, and USDA-NWRS—have each funded six or less studies between 2006 and 2010.
Table B-1 shows the annual funding of tick-borne disease studies for each agency and organization from 2006 to 2010. Next to each agency name is the total number of studies funded for 2006 to 2010. Note that the annual total of funding had a significant drop ($12.4m) in 2010 since the provided data for analysis did not list any 2010 studies funded by the NIH-NIAID. The NIH-NIAID has allocated the most amount of funding, followed by the CDC and NIH-NIAMS. The US Army Public Health Command has funded just one study that spanned from 2008 to 2009, while the USDA-NWRC has granted funding only in 2010 for two studies that totaled $318,000.
The proportion of annual agency/organization funding for tick-borne disease studies by year is displayed in Figure B-2. All agencies and organizations allocated a steady proportion of funding until 2010. The NIH-NIAID contributed to the greatest proportion of funding for tick-borne disease studies until 2010. The CDC had the next greatest contribution to tick-borne disease funding until 2009, when they had a decline in their allocated funding; then, in 2010, the CDC increased their funding of tick-borne disease studies so significantly that it almost doubled their funding from previous years. In 2009, NIH-NIAMS and NSF had an increase in funding of tick-borne disease studies. In 2010, the NSF had a decrease in funding which was significantly lower than their funding from previous years, but was more closely aligned with the 2010 funding for the US EPA, USDA-ARS, USDA-NWRC, and NIH-NINDS.
Tick-Borne Disease Funding by Study Type (Biological, Surveillance, Environmental)
Allocation of funding for tick-borne disease studies by study type is examined in this report. Tick-borne disease studies were grouped into six study type categories: Biological/Laboratory, Environmental, Surveillance (including human and animal surveillance), Treatment, Education/
Prevention, and Combination (the Combination study falls into at least two or more of the five other study type categories). Figure B-3 shows the total allocation of funding by study type for all studies between 2006 and 2010. Microbiological studies totaled $210m, which was 57% of the funding from all tick-borne disease studies. Prevention/Education studies were allocated $84.0m in funding (23%), followed by studies on a Combination of study types at $47.2m (13%), Treatment at $17.1m (4%), Environmental at $7.2m (2%), and Surveillance at $3.5m (1%).
Table B-2 shows the annual funding of tick-borne disease studies by study type from 2006 to 2010. Next to each agency name is the total number of studies funded for 2006 to 2010 (#). Note that the annual total of funding had a significant drop ($12.4m) in 2010 since the provided data for analysis did not list any 2010 studies funded by the NIH-NIAID. There were 304 Microbiological studies between 2006 and 2010 averaging $42m for annual funding, while Prevention/Education totaled 77 studies and averaged $16.8m for annual funding between 2006 and 2010. All other study types had between 10 to 39 studies and averaged between $711k and $9.4m for annual funding.
The proportion of annual funding for tick-borne diseases study types by year is displayed in Figure B-4. There was a steady allocation of funding for all study types until 2009 (last complete year for all agencies). Microbiological studies contributed to the greatest proportion of funding
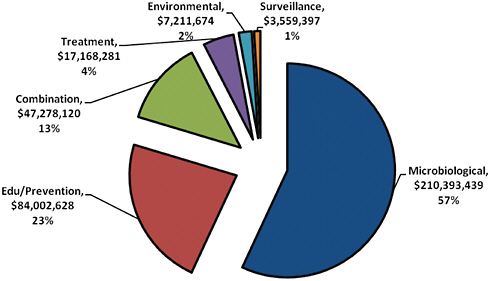
FIGURE B-3 Total allocation of funding for tick-borne disease studies by study type, 2006–2010.
TABLE B-2 Annual Funding of Tick-Borne Disease Studies by Study Type, 2006–2010
|
Study Type (#) |
2006 |
2007 |
2008 |
2009 |
2010 |
Average |
|
Microbiological (304) |
$53,895,938 |
$50,119,167 |
$48,780,509 |
$56,059,948 |
$1,537,877 |
$42,078,688 |
|
Prevention/Edu (77) |
$30,072,837 |
$30,782,779 |
$9,179,903 |
$13,137,663 |
$199,446 |
$16,800,526 |
|
Combination (39) |
$11,989,868 |
$9,348,166 |
$11,696,074 |
$4,229,879 |
$10,014,133 |
$9,455,624 |
|
Treatment (16) |
$3,975,791 |
$3,433,126 |
$4,820,748 |
$4,938,616 |
— |
$3,433,656 |
|
Environmental (14) |
$1,030,142 |
$995,563 |
$453,989 |
$3,206,541 |
$1,525,439 |
$1,442,335 |
|
Surveillance (11) |
$405,451 |
$199,000 |
$970,780 |
$1,268,166 |
$716,000 |
$711,879 |
|
YEARLY TOTAL |
$102,000,027 |
$94,877,801 |
$75,907,003 |
$82,840,813 |
$12,483,136 |
$73,620,756 |
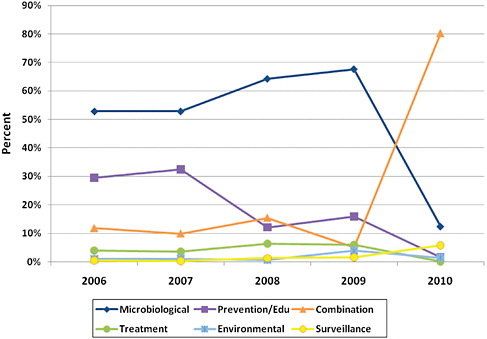
FIGURE B-4 Annual proportion of funding for tick-borne disease study types by year, 2006–2010.
from 2006 to 2009. Combination studies had the greatest proportion of funding in 2010. There was a slight downward trend in funding of Prevention/Education studies from 2006 to 2010. Treatment, Environmental, and Surveillance, studies were all low in proportion to the other study types, but all three remained relatively stable from 2006 to 2010.
Tick-Borne Disease by Study Topic (Pathogen, Tick, Host)
A further allocation of funding for tick-borne disease studies by study topic was examined. Tick-borne disease studies were grouped into five study topic categories—Pathogen, Tick, Host (including both humans and animals), Clinical Impact, and All Inclusive (the All Inclusive study falls into all four of other study topic categories).
Figure B-5 shows the total allocation of funding by study topic for all studies between 2006 and 2010. Pathogen studies have been allotted the greatest amount of funding at a total of $247m (67%). Clinical Impact studies were the next highest funding study topic with a total of $71.6m (20%). The other categories of study topics were Inclusive studies at $30.8m (8%), Tick studies at $11.9m (3%), and Host studies at $8.1m (2%).
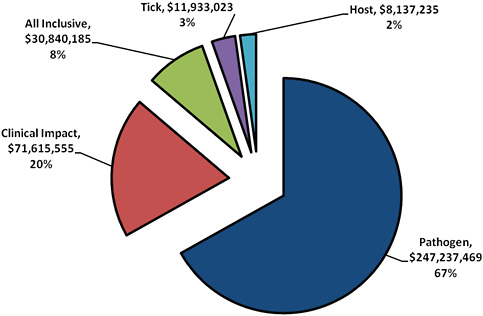
FIGURE B-5 Total allocation of funding for tick-borne disease studies by study topic, 2006–2010.
Table B-3 shows the annual funding of tick-borne disease studies by study topic from 2006 to 2010. Next to each agency name is the total number of studies funded for 2006 to 2010 (#). Note that the annual total of funding had a significant drop ($12.4m) in 2010 since the provided data for analysis did not list any 2010 studies funded by the NIH-NIAID. There were 343 Pathogen studies between 2006 and 2010 averaging $49m for annual funding, while Clinical Impact studies totaled 64 and averaged $14.3m. Inclusive, Tick, and Host study topics had between 17 to 19 studies and averaged between $1.6m and $6.1m for average annual funding.
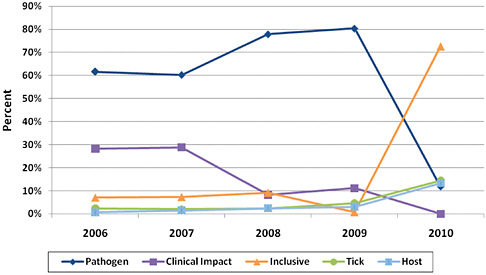
The proportion of annual funding for tick-borne diseases study topics by year is displayed in Figure B-6. The Pathogen studies contributed to the greatest proportion of funding until 2010 when Inclusive studies had a significant increase in funding. Clinical Impact studies slowly decreased in funding from 2006 to 2010 while Tick and Host studies remained low but stable in funding.
Tick-Borne Disease by Tick Pathogen
Allocation of funding for tick-borne disease studies by pathogen type was examined in this report. Tick-borne disease studies were grouped into
TABLE B-3 Annual Funding of Tick-Borne Disease Studies by Study Topic, 2006–2010
|
Study Topic (#) |
2006 |
2007 |
2008 |
2009 |
2010 |
Average |
|
Pathogen (343) |
$62,863,944 |
$57,183,511 |
$59,127,804 |
$66,593,207 |
$1,469,003 |
$49,447,494 |
|
Clinical Impact (64) |
$28,775,092 |
$27,390,105 |
$6,225,497 |
$9,224,861 |
|
$14,329,111 |
|
Inclusive (17) |
$7,215,128 |
$6,943,735 |
$7,001,369 |
$611,953 |
$9,068,000 |
$6,168,037 |
|
Tick (19) |
$2,495,035 |
$1,938,727 |
$1,848,631 |
$3,854,871 |
$1,795,759 |
$2,386,605 |
|
Host (18) |
$650,827 |
$1,421,723 |
$1,848,631 |
$2,555,921 |
$910,133 |
$1,627,447 |
|
YEARLY TOTAL |
$102,000,026 |
$94,877,801 |
$75,902,003 |
$82,840,813 |
$12,483,136 |
$73,620,756 |
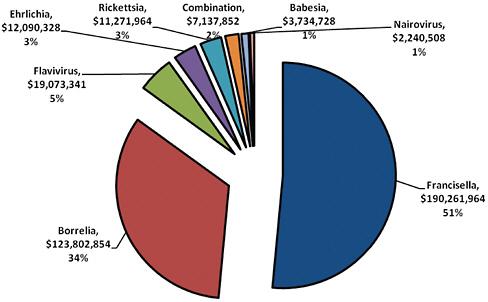
five types of tick-borne pathogens—Borrelia, Rickettsia, Babesia, Ehrlichia, and Combination (study focuses on at least two or more pathogens).
Figure B-7 shows the total allocation of funding by pathogen type for all studies between 2006 and 2010. Francisella studies have received the most funding at $190m (51%) followed by Borrelia studies at $123m (34%). Funding for Flavivirus totaled $19m (5%) and all other pathogens (Ehrlichia, Rickettsia, Combination, Babesia, and Nairovirus) were 3% or less of the total funding.
Table B-4 shows the annual funding of tick-borne disease studies by pathogen type from 2006 to 2010. Next to each agency name is the total number of studies funded for 2006 to 2010 (#). Note that the annual total of funding had a significant drop ($12.4m) in 2010 since the provided data for analysis did not list any 2010 studies funded by the NIH-NIAID. Francisella studies received the most funding, followed by Borrelia studies. A significant amount of Francisella and Borrelia studies were conducted (218 and 147) compared to other studies (all 26 or less).
The proportion of annual funding for tick-borne diseases pathogen studies by year is displayed in Figure B-8. The figure shows that Francisella studies received the highest proportion of funding from 2006 to 2009, followed by Borrelia studies. In 2010, Borrelia studies had a significant increase in funding taking the lead of the highest proportion of funding for tick-borne diseases, a likely artifact without the study allocation from NIH-NIAID for this year.
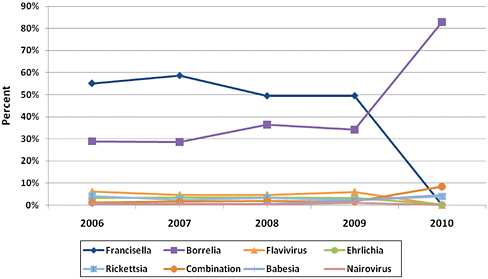
FIGURE B-8 Annual proportion of funding for tick-borne disease pathogen studies by year, 2006–2010.
TABLE B-4 Annual Funding of Tick-Borne Disease Pathogen Studies by Year, 2006–2010
|
Study Topic (#) |
2006 |
2007 |
2008 |
2009 |
2010 |
Average |
|
Francisella (218) |
$56,234,585 |
$55,565,617 |
$37,493,378 |
$40,968,384 |
— |
$38,052,393 |
|
Borrelia (147) |
$29,476,671 |
$27,047,516 |
$27,645,414 |
$28,267,376 |
$11,365,877 |
$25,398,126 |
|
Flavivirus (26) |
$6,207,170 |
$4,361,255 |
$3,540,803 |
$4,964,113 |
— |
$3,814,668 |
|
Ehrlichia (18) |
$3,384,192 |
$3,282,096 |
$2,650,076 |
$2,748,964 |
$25,000 |
$2,418,066 |
|
Rickettsia (18) |
$4,136,723 |
$2,299,654 |
$2,503,017 |
$1,840,737 |
$491,833 |
$2,254,393 |
|
Combination (14) |
$1,245,961 |
$1,494,676 |
$1,473,265 |
$1,390,765 |
$1,533,185 |
$1,427,570 |
|
Babesia (15) |
$502,237 |
$410,216 |
$419,291 |
$1,825,984 |
$577,000 |
$746,946 |
|
Nairovirus (5) |
$812,488 |
$416,771 |
$176,759 |
$834,490 |
— |
$448,102 |
|
YEARLY TOTAL |
$102,000,027 |
$94,877,801 |
$75,907,003 |
$82,840,813 |
$12,483,136 |
$73,620,756 |


