
Workshop Summary
With more than one-third of the U.S. adult population considered obese,1 a figure that has more than doubled since the mid-1970s (Flegal et al., 2010), obesity has emerged as a major public health challenge. Among children, obesity rates have more than tripled over the same period. Not only is obesity associated with numerous medical complications, but also it incurs significant economic cost. Although at its simplest, obesity is a result of an energy imbalance, with obese (and overweight2) people consuming more energy (calories3) than they are expending, in reality it is very difficult for many people to balance calories consumed with calories expended. Human eating behavior is inordinately complex, with multiple layers of influence. Eating is impacted not only by the biological responses that occur when the presence of food or even the smell of food triggers physiological
____________
1 For adults, obesity is defined as having a body mass index (BMI) of 30 or greater. For children, obesity is defined as a BMI at or above the 95th percentile for children of the same age and sex. For both adults and children, BMI is calculated from a person’s weight and height (weight [kg] / height [m]2).
2 For adults, overweight is defined as having a BMI between 25 and 29.9.
3 In this report, calorie (cal) is used synonymously with kilocalorie as a unit of measure for energy obtained from food and beverages. A kilocalorie (kcal) is defined as the amount of heat required to change the temperature of 1 g of water from 14.5°C (degrees Celsius) to 15.5°C.
chain reactions but also by societal norms and values around portion size and other eating behaviors.
Behavioral scientists have made significant progress over the last 10–20 years toward building an evidence base for understanding what drives energy imbalance in overweight and obese individuals. Meanwhile, food scientists have been tapping into this growing evidence base to improve existing technologies and create new technologies that can be applied to alter the food supply in ways that reduce the obesity burden on the American population. As just one example, chemists at the Agricultural Research Service (ARS) of the U.S. Department of Agriculture (USDA) developed a novel, low-oil-uptake rice batter that absorbs 50 percent less oil than regular wheat batter and can be used for coating chicken, fish, vegetables, and other foods. Food scientists have developed a range of other fat-reducing technologies as well, including new processing technologies for multiple grain doughs, new baking technologies, and technologies that incorporate fiber as a fat replacement. Reducing fat content might seem like the most obvious way to reduce the energy density of a food, given the high caloric value of fat,4 but there are other ways. For example, food scientists in the beverage industry have developed reduced-calorie sweetened beverages by replacing sucrose using various zero- and low-calorie sweetener technologies.
Reducing the energy density of foods is by no means the only or best way to leverage food technologies in the effort to reduce and prevent obesity. Other technologies being leveraged for obesity prevention and reduction efforts include ready-to-eat portion-controlled frozen meals, which have been shown to be associated with reduced energy intake and increased short-term weight loss; a variety of fruit- and vegetable-based technologies, based on the association between fruit and vegetable intake and maintenance of a healthy weight (when substituted for more energy dense foods) and reduced risk of many chronic diseases; and technologies that enhance micronutrient density, developed on evidence suggesting that micronutrient deficiencies may contribute to overeating.
On November 2 and 3, 2010, the Institute of Medicine’s (IOM’s) Food Forum convened a public workshop in Washington, DC, to examine the complexity of human eating behavior and explore ways in which the food industry can continue to leverage modern food processing technologies to influence energy intake as one population-based change of the many
____________
4 Fat contains 9 cal/g, compared to alcohol (7 cal/g), protein and most carbohydrates (4 cal/g), fiber (1.5–2.5 cal/g), and water (0 cal/g).
multifaceted societal changes that will help to reduce and prevent obesity. Through invited presentations and discussions, behavioral scientists, food scientists, and other experts from multiple sectors discussed evidence-based associations between various eating behaviors and weight gain and considered the opportunities and challenges of altering the food supply—both at home and outside the home (e.g., in restaurants)—to alleviate overeating and help consumers with long-term weight maintenance. The workshop agenda and biographies for speakers and moderators are included in Appendixes A and B, respectively.
This workshop summary was prepared by the rapporteurs for the Forum’s members and is organized into sections as a topic-by-topic description of the presentations and discussions that took place during the workshop. The main topics covered include, in order, the following: trends in overweight and obesity over the past 30 years; the complexity of eating behaviors; lessons learned and best practices; major challenges; and potential for innovation: next steps. These proceedings are not intended to be an exhaustive exploration of the subject matter. They summarize only statements made and information presented by participants at the workshop. Although participants made several suggestions for moving forward with respect to leveraging technologies in obesity reduction and prevention efforts, the goal of this workshop was not to reach consensus on any issue(s). As such, the statements summarized here represent individual beliefs; they do not represent the findings, conclusions, or recommendations of a consensus committee process.
TRENDS IN OVERWEIGHT AND OBESITY: FROM THE MID-1970s TO THE PRESENT5
In addition to 33.8 percent of the U.S. population aged 20 and over that is considered obese, another 34.2 percent is considered overweight, according to the most recently available National Health and Nutrition Examination Survey (NHANES) data (2007–2008) (Flegal et al., 2010). This makes for a staggering 68 percent of American adults who carry excess body weight, according to U.S. standards. Not only are all organ systems adversely affected by excess body weight, causing significant medical complications, but these medical complications in turn incur significant
____________
5 This section summarizes the material presented during Gary Foster’s keynote presentation.
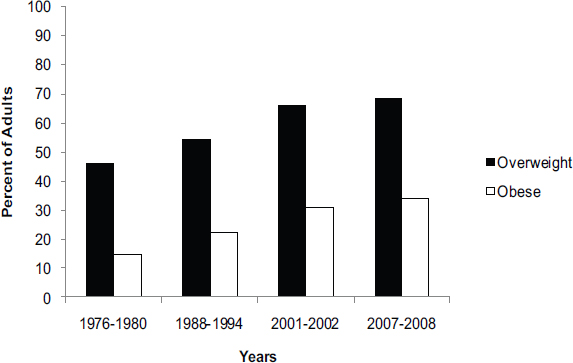
FIGURE 1 Prevalence of overweight and obesity in adults aged 20 years or older, 1976–2008. Among U.S. adults, the prevalence of both overweight and obesity has been steadily increasing since the mid-1970s. Today, approximately 70 percent of American adults are either overweight or obese.
SOURCE: Data adapted from Flegal et al., 1998, 2010; Ogden et al., 2006.
economic cost. Between 1998 and 2006, the annual medical burden of obesity increased from 6.5 to 9.1 percent of annual medical spending,6 with per capita medical spending for obese persons being more than 40 percent greater than it is for persons of healthy weight (Finkelstein et al., 2009).
Among adults, the prevalence of both overweight and obesity has been increasing steadily since the mid-1970s (Figure 1) (Flegal et al., 1998, 2010; Ogden et al., 2006). Likewise among children, the prevalence of obesity more than tripled between the early 1970s and mid-2000s (Figure 2) (Ogden and Carroll, 2010). As Gary Foster, professor and director of the Center for Obesity Research and Education at Temple University, remarked, childhood obesity is especially worrisome because obese children risk developing adult conditions such as hypertension, increased cholesterol, and type 2 diabetes at a much younger age; also, obese children are more likely than normal-weight children to experience psychosocial complications such as
____________
6 The main driver of the increase in obesity-attributable costs was the 37 percent increase in obesity prevalence from 1998 to 2006, not increases in per capita costs.
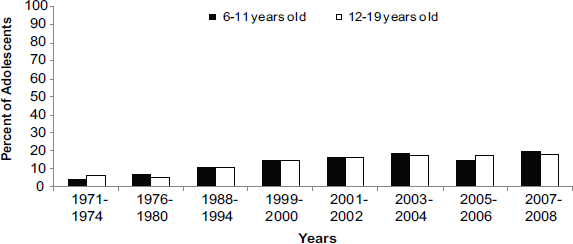
FIGURE 2 Prevalence of obesity in children (6–11 years) and adolescents (12–19 years), 1971–2008. The prevalence of obesity among children and adolescents has tripled since the mid-1970s, with an estimated 18 percent of today’s 6–19 year olds considered obese. SOURCE: Foster presentation (November 2, 2010); data adapted from Ogden and Carroll, 2010.
peer rejection, bullying, and impaired academic performance. Additionally, obese adults who were overweight as children have a greater prevalence of medical conditions than obese adults who were not overweight as children (Baker et al., 2005; Must and Anderson, 2003; Wearing et al., 2006).
According to 2007–2008 NHANES data (Flegal et al., 2010), non-Hispanic blacks are disproportionately burdened by obesity. Non-Hispanic blacks not only have a higher prevalence of obesity than other ethnic groups (i.e., non-Hispanic whites, Hispanics, and Mexican Americans), they also have a higher prevalence of class II and class III obesity.7 Increasing trends in class II and III obesity are particularly alarming because they are associated with greater impairment of quality of life, greater co-morbidity, and greater medical cost compared to the other classifications of overweight and obesity. Non-Hispanic blacks have also shown a slightly greater increase in the prevalence of obesity over time, since the mid-1970s, compared to non-Hispanic whites and Mexican Americans (Flegal et al., 1998; Ogden et al., 2006), with most of the divergence being among women.
According to Foster, the fact that non-Hispanic blacks are disproportionately impacted by obesity raises questions about the extent to which
____________
7 There are three classes of obesity: class I (BMI of 30–34), class II (BMI of 35–39), and class III (BMI of 40 and greater).
variation among different segments of the American population should be considered when exploring ways to leverage food technology for obesity prevention and reduction efforts. For example, are there certain types of food products that non-Hispanic blacks buy more frequently? If so, are there ways to aim interventions toward those products? Later in the workshop, other participants identified poverty as another important socioeconomic factor to consider when exploring the possibilities for intervention. For example, speaker Brendan Boyle, partner and chief invention officer at IDEO, suggested that product distribution is as important to consider as product innovation when devising technology-based strategies for obesity intervention, with a major challenge being the distribution of novel food products to lower-income neighborhoods where people would otherwise not have access to such products.
Arguably one of the first and most obvious variables to consider when exploring possible causes of the obesity crisis is the amount of energy in food available for human consumption, as measured by calories per capita per day. Indeed, available daily dietary energy in the U.S. food supply increased from about 3,300–3,400 calories per capita to more than 4,000 calories between 1980 and 2004 (Hiza and Bente, 2007). As Foster explained, by assuming that energy expenditure remained constant during that time, an increase in daily energy per capita of that magnitude would be enough to account for the increased prevalence of obesity in the U.S. population. However, on closer examination, macronutrient contribution to the dietary energy supply changed very little over the same time. Although the share of the daily energy supply coming from carbohydrates increased slightly in the 1980s, it has since plateaued; none of the other macronutrient profiles have changed much. One might expect to see an increase in energy availability from fat, if anything, given the high caloric density of fat, but this is not the case. Nor has there been much change in the proportion of available energy coming from any particular major food group (i.e., grains; fats and oils; sugars; meat, poultry, fish; dairy; vegetable; fruit; eggs; nuts, soy; miscellaneous). The only increases, and they have been slight (less than 5 percent change in share of total daily available calories derived from each), have been with grains and fats or oils, the latter slightly more than the former. In short, Foster concluded, while there have been slight increases in the proportion of available dietary energy coming from carbohydrates and fats or oils, the evidence does not implicate increased consumption of any particular macronutrient or food group as a primary driver of the obesity crisis.
Changes in Eating Behavior Since the Mid-1970s: Three Illustrative Trends
If it is not any particular macronutrient or major food group, then what is driving the increasing prevalence of obesity among U.S. adults and children? Rather than providing a comprehensive account of every change that has occurred in behavior over the past 30 years, Foster highlighted three trends by way of illustration: (1) increases in portion size; (2) increases in snacking frequency among adolescents; and (3) increases in meals eaten outside the home (i.e., at restaurants). He identified portion size as a promising target for intervention, that is, through portion-controlled dieting, based on evidence from several studies comparing portion-controlled dieting to other diet methods.
Portion Size
The fact that available calories are increasing but without any major changes in the proportion of available energy coming from any particular macronutrient or major food group suggests that people are simply eating more (of everything). Indeed, Nielsen and Popkin (2003) reported increases in portion sizes between 1977 and 1998 for many foods, including salty snacks, desserts, soft drinks, fruit drinks, French fries, hamburgers, cheeseburgers, pizza, and Mexican food. The most dramatic increases were with soft drinks and fruit drinks. In 1977–1978, the average portion size was 13.1 ounces (oz) for soft drinks and 11.3 ounces for fruit drinks; in 1989–1991, those figures jumped approximately 28 percent and 11 percent to 16.8 and 12.6 ounces, respectively; in 1994–1996, they jumped again by approximately 51 percent and 33 percent, to 19.9 and 15.1 ounces, respectively (Figure 3). Foster remarked that these data point to beverage consumption as a possible target for intervention, a strategy that Marge Leahy, director of health and wellness at the Coca-Cola Company, revisited during her presentation on zero-calorie and reduced-calorie sugar substitutes for beverages and other products. In another presentation, Jennifer Fisher, associate professor and research scientist at Temple University, explored in more detail the growing body of evidence showing that increased portion sizes are associated with increased energy intake. (Summaries of the information presented by Leahy and Fisher are provided later in this report.)
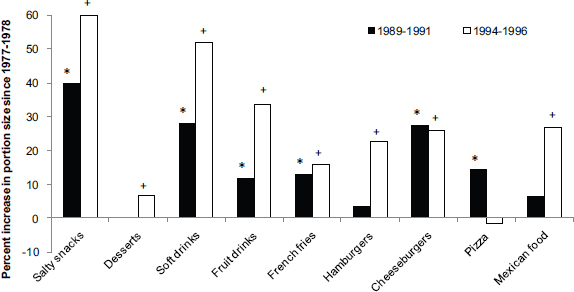
FIGURE 3 Changes in portion sizes, 1977–1998. Average portion sizes have increased since the mid-1970s, with the most dramatic increases for soft drinks and fruit drinks, pointing to beverage consumption as a possible target for obesity prevention and reduction interventions.
* Significant difference between 1977–1978 and 1989–1991 (p < 0.01).
+ Significant difference between 1977–1978 and 1994–1996 (p < 0.01).
Note that no statistical inferences were drawn between 1989–1991 and 1994–1996 data.
SOURCE: Data adapted from Nielsen and Popkin, 2003.
In Foster’s opinion, one of the most promising obesity treatments is portion control.8 Several studies have shown that providing patients with portion-controlled meals is a more effective weight loss strategy than telling patients to maintain a restricted-energy diet by keeping track of calories. Ditschuneit and colleagues (1999) reported significantly greater weight loss among individuals who ate four portion-controlled meal or snack replacements daily, compared to individuals on an energy-restricted diet with conventional foods (with both diets totaling 1,200–1,500 calories daily).
____________
8 Foster explained that there are several different approaches to obesity treatment, ranging from surgery (recommended for individuals with BMIs between 35 and 39.9 with co-morbidities and for individuals with BMIs greater than 39.9 regardless of co-morbidities), to pharmacotherapy (recommended for individuals with BMI between 27 and 29.9 with co-morbidities and for individuals with BMIs greater than 29.9 regardless of co-morbidities), to diet, exercise, and behavioral treatments (recommended for all individuals with BMIs of 25 and above) (NHLBI, 2000). Foster said that although surgery is the most effective obesity treatment, less than 1 percent of individuals eligible for surgery actually undergo surgery. He pointed to the Diabetes Prevention Program and Look AHEAD as examples of effective diet, exercise, and behavioral modification (or “lifestyle intervention”) programs.
The individuals were placed on their respective diets for three months and then placed on the same weight maintenance diet (energy restricted with two portion-controlled meals or snacks daily) for 24 months. Total weight loss over the entire 27 months, as a percentage of initial weight, was 5.9 kg for the energy-restricted group and 11.3 kg for the portion-controlled group. Similar results were observed in a four-year study comparing energy restriction and portion control (Flechtner-Mors et al., 2000). Finally, a meta-analysis of reduced-calorie diets versus partial meal replacement diets concluded that partial meal replacement diets resulted in significantly greater mean weight loss over both 3-month and 12-month periods (Heymsfield et al., 2003).
Foster opined that part of the reason portion control works is its simplicity. The mountain of evidence and advice on how to eat is overwhelming. By cultivating a “one-and-done” way of thinking, portion-controlled meals with fixed calorie amounts reduce much of the cognitive burden that is often placed on patients in nutrition-based obesity treatment programs. People do not need to weigh, measure, or calculate calories, fat, or any other component of what they are eating because that information is readily available on the package. Fixed-portion meals also reduce contact with “problem” food and are convenient to use because of their ready-to-eat nature. Portion control as a potentially effective target for intervention was revisited several times during the course of the workshop.
Snacking Behavior Among Adolescents
According to USDA data, snacking behavior among adolescents (12–19 years old) has changed dramatically over the past 30 years (ARS, 2010a; Hiza and Bente, 2007). In 1977, 40 percent of adolescents were not consuming any snacks at all. By 2005–2006, that figure had decreased by more than 50 percent, with only less than 20 percent of adolescents not consuming any snacks. Conversely, the percentage of adolescents consuming two or more snacks a day increased. About 15–17 percent of adolescents consumed two snacks a day in 1977, compared to nearly 30 percent in 2005–2006, and about 5 percent of adolescents consumed three snacks a day in 1977, compared to about 17 percent in 2005–2006. Not only has snacking frequency increased, but adolescents are also obtaining a greater percentage of their daily nutrients from snacks than they did in the past. In 1977–1978, adolescents obtained 14 percent of their daily nutrients (300 calories) from snacks, compared to 23 percent (a little more than 500 calories) in 2005–2006. In sum, Foster explained, adolescents are snacking
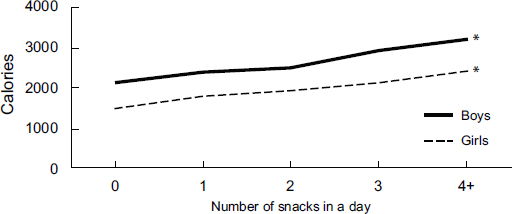
FIGURE 4 Mean calorie intake by snacking frequency, adolescents aged 12–19, 2005–2006.
* indicates a statistically significant trend.
SOURCE: ARS, 2010a.
more frequently and obtaining more absolute calories and a greater percentage of their daily calories from snacks.9
Foster remarked that increases in snacking frequency and snacking-related energy intake do not reveal much about obesity unless they are associated with increases in total energy intake. If adolescents are simply distributing the same number of calories throughout the day in the form of snacks instead of meals, an increase in snacking frequency would not have an impact on obesity, but this is not the case. The same USDA data indicate that adolescents who consume more snacks also have higher total energy intakes (Figure 4).10 Although adolescents comprise only a small proportion of the population, these data point to snacking as another potential target for intervention.
Food Consumption Outside the Home
Foster observed that often when people think about the products that the food industry manufactures they have in mind foods that are
____________
9 According to a recent study by Piernas and colleagues (2010b) on snacking trends from 1977–2006 among U.S. children, the largest increases in consumption have been in salty snacks and candy. The primary contributors of snacking calories are desserts and sweetened beverages.
10 Although the data indicate no significant variation in mean BMI among adolescents who snack more or less frequently, or not at all, Foster suggested that the self-reported nature of the data could be creating a bias in the results; the stigma of being obese may have prevented obese adolescents from being forthright about the number of times they snack.
being purchased in grocery stores and consumed in the home. In fact, a significant portion of the food supply is consumed outside the home. Kant and Graubard (2004) reported that the percentage of adults not eating out decreased from 28 percent in 1987 to 24 percent in 1999–2000 (p < 0.0001). Not only are more people eating outside the home, but also they are eating outside the home more frequently. Kant and colleagues (2004) also reported that the percentage of adults eating three or more meals per week outside the home increased from 36 percent in 1987 to 41 percent in 1999–2000 (p < 0.0005). Even more compelling, Foster noted, are data showing that restaurant sales increased from $42.8 billion in 1970 to a forecasted $580.1 billion in 2010 (National Restaurant Association, 2010). Foster remarked that while these data do not in any way point to eating outside the home as the primary driver of the obesity crisis in America, they do suggest that commercially prepared meals that are eaten outside the home serve as another potential target for intervention.
IDENTIFICATION OF TARGETS FOR INTERVENTION: EVIDENCE FROM BEHAVIOR STUDIES
Individuals make 200 to 300 food-related decisions a day (Wansink and Sobal, 2007). Multiple factors come into play when these decisions are made, creating several behavioral challenges for food scientists to tease apart when innovating technologies for the purpose of obesity prevention and reduction. This section summarizes the workshop presentations and discussions that revolved around those behavioral challenges, with a focus on portion size (and the challenge of moving the public toward eating more healthful portions); energy density (and the challenge of providing the public with less energy dense foods that taste as good or better than their counterparts); satiety (and the challenge of providing consumers with less energy dense foods that satisfy the appetite as much as their more energy dense counterparts do); and consumer perception of labels and pricing (and the challenge of providing the food industry with incentives to develop innovative technologies when faced with unpredictable consumer response).
As much progress as behavioral scientists have made over the past 10–20 years toward building an evidence base for understanding what drives energy imbalance in overweight and obese individuals, there is still a great deal to learn. Richard Mattes, distinguished professor at Purdue University, argued that it is not even clear, at a fundamental level, whether eating is controlled by an internal biological system (i.e., homeostatically)
or by external environmental factors (i.e., non-homeostatically), or both. This section begins with a summary of Mattes’ reflections on regulation of eating behavior—what is known and what is not known—and implications for intervention. Understanding what drives dysfunctional energy balance is critical to developing effective strategies to prevent or reduce overweight and obesity.
Regulation of Eating Behavior: Theoretical Considerations
Mattes proposed four theoretical scenarios, or hypotheses, to explain why people are consuming more energy than they are expending. He then suggested the potential target of intervention for each theoretical scenario:
- Eating is regulated through external environmental (non-homeostatic) factors, with meal patterning (e.g., how frequently and when people eat) being the most appropriate target of intervention. Obesity is not a new problem. There are data indicating that body mass index (BMI) has been steadily increasing in a French cohort for about 300 years (Fogel, 1994); in U.S. artisans, laborers, farmers, and proprietors since the mid-1800s (Costa and Steckel, 1997); and in Danish children born between 1930 and 1980 (Bua et al., 2007). According to Mattes, these and similar historic trends suggest that weight stability may be neither common, necessary, nor desirable for optimal health and longevity (Dugdale and Payne, 1987). Instead, eating behavior may be guided primarily through external environmental mechanisms, with the amount of food being eaten having less to do with short-term bodily energy requirements and more to do with altered eating patterns. Indeed, accumulating evidence suggests that eating patterns, such as holiday eating, can play a significant role in cumulative weight gain (Yanovski et al., 2000). Mattes stated that if this is the case—that is, if overeating is regulated through external environmental mechanisms—then meal patterns would be the most appropriate target for intervention (e.g., how frequently people eat, when they eat).
- Eating is regulated through a functional internal (homeostatic) control mechanism, with accessibility to food being the most appropriate target for intervention. If, on the other hand, eating behavior is internal and functioning appropriately under evolutionary precedent, Mattes
stated that it would make more sense to target food accessibility (i.e., access to a superabundant food supply, not access to nutritious and affordable foods). In traditional agricultural populations, cyclical patterns in weight gain and loss are clearly documented that offset each other, leading to stable body weight over the long term. For example, Prentice and Jebb (2004) reported a cyclical pattern in Gambian women, with annual cycles of weight loss and regain; the severity of weight loss depended on the adequacy of the previous year’s harvest. Over time, the women maintained stable weights. As another example, Corvalan and colleagues (2008) showed significant seasonal fluctuations in obesity among children (i.e., higher during fall and winter than spring and summer). Again, weight status remained the same over time. These cyclical patterns suggest that there is a functional role for eating in excess of need for a period of time because this would provide an energy reserve when external energy resources may be scarce. If this is true, Mattes remarked, the reason we have an obesity epidemic is that excess intake has not been balanced by an externally imposed food restriction (e.g., food shortage, famine). If this is the case, then according to Mattes, food accessibility (again, access to overconsumption, not access to nutritious and affordable foods) would be the most appropriate target for intervention.
3. Eating is regulated through a dysfunctional internal control mechanism, with diet and lifestyle being the most appropriate target for intervention. Alternatively, eating behavior could be internally regulated but with something having become dysfunctional in the United States in the 1970s such that people’s internal biological systems are no longer sensitive enough to monitor, or strong enough to modify, energy intake in order to achieve energy balance. For example, perhaps changes in the proportion of energy from different macronutrients or food sources (e.g., beverages vs. solid foods) or decreases in daily energy expenditure have altered the functionality of regulatory systems for energy balance. Regarding the latter, studies have shown that exercise is an effective way to control appetite. Racette and colleagues (1995) reported that individuals who exercised demonstrated better compliance to an energy-restricted diet and took in less excess energy than individuals who did not exercise. If this is the case—that is, if a dysfunctional internal biological regulatory system is driving the current obesity epidemic in the United States—then
according to Mattes, the most appropriate target for intervention would be diet and lifestyle.
4. Eating is regulated through both internal and external mechanisms, with palatability being the most appropriate target for intervention. A fourth scenario and one receiving considerable attention in the current scientific literature (Zheng et al., 2009) is that eating behavior is regulated by both internal and external systems. That is, appetite is internally controlled, but the body’s reward (hedonic) system is not; foods available today are so palatable that the positive feedback individuals receive from eating those foods overwhelms any biologically based appetite control. According to Mattes, if this is the case, then palatability would be the most appropriate target for intervention.
Mattes remarked that it is not clear which of these four theoretical eating regulation scenarios most accurately explains what is driving the current obesity epidemic in the United States. Thus, it is not clear where interventions to reduce obesity should be targeted—meal patterning, accessibility, diet and lifestyle, or palatability. In Mattes’ opinion, until such clarity is reached, it is difficult to know how best to intervene to effectively stop the spread of the obesity epidemic in the United States. Moreover, Mattes argued that fixing the magnitude of overconsumption that is driving the increase in overweight and obesity prevalence in the United States will require more than minor interventions. He pointed out the logical error in the often-cited example where a 10-calorie daily increase in energy intake over a five-year period should lead to a weight gain of 2.37 kg (Veerman et al., 2007). This would hold only if 10 calories more than needed was consumed every day, not just a fixed 10-calorie increment relative to the first day of the theoretical experiment. Thus, as weight is gained, the increment would continually rise and after five years, the required increase in energy intake to maintain body weight would be substantive. Note that the population is consuming several hundred calories more daily compared to the late 1970s, not 10 calories more. Small increments in energy will lead to small increases in body weight (other factors being held constant), and small decreases in energy intake will lead to small reductions of body weight before a new plateau is reached. Incremental reductions of energy intake may be a useful approach for some individuals, but to achieve marked weight reduction will require multiple successive adjustments.
Although there may be no “best” intervention, this does not mean that there are no known effective interventions to reduce overeating. As already
mentioned, in Foster’s opinion, one of the most promising obesity treatments is portion control, based on available evidence comparing portion control to other diet plans. As discussed in a later section of this report, Al Bolles, executive vice president of research, quality, and innovation at ConAgra Foods, effectively concurred, arguing that ready-to-eat, frozen, portion-controlled meals in particular are an underutilized resource in obesity reduction and prevention efforts. The remainder of this section explores the behavioral science evidence base from which these and similar claims are drawn.
Portion Size, Energy Intake, and Obesity
Fisher reviewed evidence on the relationship between portion size, energy intake, and overweight and obesity; identified major challenges to reversing the recent trend in increasing portion size; and suggested potential solutions to “normalizing” portion sizes in a way that promotes more healthful eating. This section summarizes Fisher’s presentation and the discussion that followed.
Trends in Portion Size
Fisher reiterated what Foster had mentioned in his keynote presentation—that Americans have been consuming increasingly larger portions over the past several decades, with the introduction of larger portions into the marketplace coinciding with increases in overweight and obesity in the United States (Young and Nestle, 2002, 2007). Portion size increases have been observed over a range of food types, particularly beverages, and portion size increases have been observed both inside and outside the home (Nielsen and Popkin, 2003) and among both children and adults (Popkin and Duffey, 2010). Moreover, people are eating larger portions more frequently, and snacking has increased in recent decades with increases seen in both grams and calories per snacking occasion (Piernas and Popkin, 2010a,b).
Relationship Between Portion Size and Energy Intake
Most of the research on the effects of portion size on energy intake has been conducted only since the early 2000s. Fisher highlighted the most salient evidence, with studies on both amorphous and unit foods (i.e.,
foods with distinct shapes) showing a strong association between increasing portion size and increasing energy intake among both adults and children. For example, in a study of 51 adults who were served a range of amorphous portion sizes of macaroni and cheese (500–1,000 g), Rolls and colleagues (2002) demonstrated a 30 percent increase in energy intake (cal/g) from the smallest to the largest portion sizes, with no observed differences in hunger or fullness. The same is true of children, with studies showing that food intake increases by about 25–60 percent, depending on the study, when children are served larger portions (2–2.5 times larger) of macaroni and cheese; energy intake of other foods served alongside the larger portions does not compensate for the extra energy intake associated with the larger portions, leading to an overall increased energy intake of 13–39 percent, again depending on the study (Fisher, 2007; Fisher et al., 2003, 2007c; Rolls et al., 2000).
The effect of portion size on energy intake is independent of the effects of energy density on energy intake, in both adults and children, with the effects of portion size exacerbated when the foods are energy dense. For example, Fisher and colleagues (2007c) reported that serving children larger portion sizes of macaroni and cheese (within the 250–500 g range) led to a 30 percent increase in energy or calorie intake on average; serving portions with increased energy density (within the 1.3 to 1.8 cal/g range) led to a 40 percent increase in energy intake; and serving larger portions of more energy dense macaroni and cheese led to a 75 percent increase in energy intake from the entrée. Again, the children did not compensate for their increased energy intake of macaroni and cheese with other foods served as part of the same meal, leading to an overall increased energy intake of about 30 percent on average.
Similar effects have been seen when either adults or children are served larger portions of unit foods (Fisher et al., 2007c; Geier et al., 2006; Rolls et al., 2004a,c), beverages (Flood et al., 2006; Rolls et al., 2007), snacks (Raynor and Wing, 2007; Rolls et al., 2004a; Wansink and Kim, 2005; Wansink et al., 2006), and fruits and vegetables (Kral et al., 2010; Mathias et al., 2009; Rolls et al., 2004b, 2010).
These data raise the question: Why do people eat more food when served larger portions? Fisher observed that the answer is unclear. Data have shown that among both children and adults, large portions lead to larger bite sizes (Fisher, 2007; Fisher et al., 2003). Bite size even increases when participants are blindfolded during eating, provided the participants are allowed to see the meal portions before the blindfold is put in place. In
a study of 30 adults, 14 of whom were overweight, Burger and colleagues (2011) reported that bite size increased by 2.4 g per bite—a small but significant amount—when the participants were blindfolded and served larger portions of macaroni and cheese (820 g compared to 410 g). Bite size and energy intake similarly increased when participants were allowed to view the food while eating. A study with children yielded similar findings: when served larger portions, the children took larger spoonfuls of food (Mathias et al., 2009). Fisher explained that although it is difficult to fully interpret the findings, given that adults normally do not eat when blindfolded, these data suggest that visual cues may trigger the increase in bite size. However, it is still unclear which particular visual elements impact behavior.
Although most of the portion size studies over the past 10 years have been laboratory studies, data collected in more naturalistic settings (e.g., child care setting, movie theater) show the same effects, with some research indicating an even greater magnitude outside of controlled settings (Diliberti et al., 2004; Fisher et al., 2003; Wansink, 2004; Wansink and Kim, 2005).
Long-Term Effects of Portion Size on Energy Intake and Weight Status
A recurring theme throughout the course of the two-day workshop was the need for more long-term studies on the effects of various eating behaviors and interventions targeting those behaviors in terms of cumulative energy intake and, more importantly, weight status. Regarding cumulative energy intake, Fisher noted that one of the longest studies conducted to date examining the impact of portion size on energy intake was an 11-day crossover study showing that the effect of portion size on energy intake was sustained over the entire study period (Figure 5), with adults served 150 percent portion sizes daily demonstrating a significantly greater cumulative energy intake (4,928 calories) compared to the same adult participants when they were served 100 percent portions daily (Rolls et al., 2007). The 4,928 calories hypothetically translates into a weight gain of about 1.25 pounds.
A handful of cross-sectional studies have evaluated associations between portion sizes consumed and actual weight status (Burger et al., 2007), but it is unclear whether trends in increasing portion size are contributing to the increasing prevalence of overweight and obesity in the United States. For example, in one of the largest studies on the association between portion and weight status, involving 3,610 Swedish adults, participants were asked
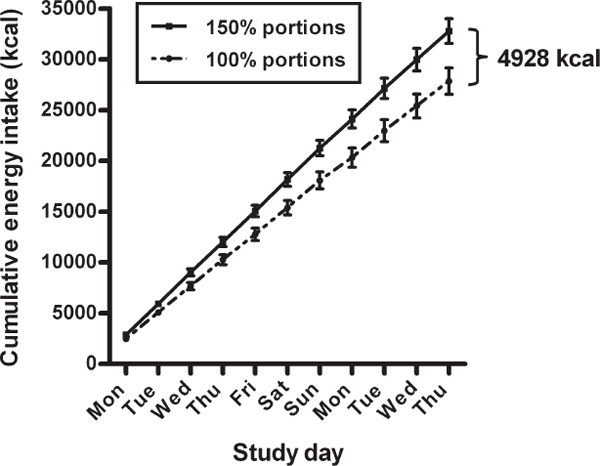
FIGURE 5 Mean cumulative energy intake for 10 women and 13 men served baseline portions (100 percent) and large portions (150 percent) of all foods over 11 days. Serving large portion sizes led to a significant increase in cumulative energy intake (p < 0.0001) for both sexes.
SOURCE: Fisher presentation (November 2, 2010); data adapted from Rolls et al., 2007.
to identify what they considered to be a typical portion size from a set of nine different sizes (Berg et al., 2009). The researchers observed a 13 percent increased risk of obesity for each increase in typical portion size—that is, participants who perceived increasingly larger portion sizes as being typical were increasingly more likely to be obese. Fisher emphasized that these and similar data are associational only, with no clarity around whether there is any causal relationship. Additionally, if there is direct causation, it is unclear which factor is driving the other—that is, whether larger individuals are drawn to larger portion sizes or larger portions are driving weight gain. The same is true of children. Although data show that heavier toddlers consume larger portions, the relationship is associational only (McConahy et al., 2002). Most experimental studies of child and adult portion sizes have not found evidence of an association between the susceptibility to overconsume large portions and weight status (Fisher, 2007; Fisher et al., 2007a,b,c; Flood et al., 2006; Rolls et al., 2000, 2004c, 2006a,b, 2007). These studies suggest that the intake-promoting effects of large portions are not specific to overweight individuals.
Opportunities to Reverse the Negative Effect of Increasing Portion Sizes
Given that portion sizes are increasing and that increased portion sizes are associated with increased energy intake, the question becomes: How can the trend in increasing portion size be reversed? Steenhuis and Vermeer (2009) identified seven ways that technology can potentially be used to reverse the negative influence of increasing portion size: (1) improve front-of-package labeling; (2) improve point-of-purchase labeling; (3) use proportional pricing; (4) reduce energy density; (5) offer a wider range of sizes; (6) decrease portion sizes; and (7) use portion-controlled packaging. Fisher elaborated on three of these strategies (1, 2, and 7).
Fisher remarked that there are a number of opportunities to improve front-of-package labeling such that the labels provide consumers with clearer guidance on portion size, including both calories per serving and servings per package (Kessler et al., 2003; Lupton et al., 2010). Likewise, point-of-purchase labeling, such as menu labeling in restaurants, is another area in which portion size information could be communicated to consumers in a useful way. The question is: What is useful? According to Fisher, part of the challenge with providing serving size information on labels is the lack of a standard definition of serving size (Ball and Friedman, 2010). Many adults generally have a difficult time estimating portion size based on the numerical information provided. The requirement for abstract reasoning can be difficult for low-literacy populations in particular (Jae and Delvecchio, 2004). Fisher opined that it would be helpful to move away from numbers and toward visual cues that help consumers see how large a portion size is on a plate and in a package to be able to clearly delineate portion size with minimal cognition. Studies have shown that portion size aids (e.g., communicating to consumers that a portion of meat is similar in size to a deck of cards) can improve estimation (Byrd-Bredbenner and Schwartz, 2004).
With respect to leveraging technology to provide portion-controlled packaging, single-serving portion-controlled foods have been shown to aid in weight loss (Hannum et al., 2004; Jeffery et al., 1993), with 100-calorie snack packs reducing daily energy intake among frequent snackers (Raynor et al., 2009). Other types of unit reductions include separating multiple servings into single-serve packages (Vermeer et al., 2010a) and reducing the size of unit foods (Geier et al., 2006). Fisher also pointed to the work of Brian Wansink (Bruton et al., 2010) and her own work on children’s eating behavior showing that the size of eating implements can influence the amount of food requested and consumed by young children as well as
the amount adults serve to themselves. Smaller bowls and dishes may, therefore, help consumers select smaller portions in situations where portion-controlled packaging is not an option, such as when families are eating at home (Wansink et al., 2006, 2008).
As far as which of the seven technology-based intervention strategies identified by Steenhuis and Vermeer (2009) are most likely to be effective in “real-world” settings, data on merchant and consumer perspectives indicate that of the seven technology opportunities identified above, only improved labeling and reduced energy density are viewed as win-win strategies (i.e., win-win for both merchants and consumers) (Vermeer et al., 2009, 2010b). Improved labeling is viewed by merchants as a way to provide valuable information, despite difficulties with definitions, and is viewed by consumers as a way to obtain readable, visible information. Reduced energy density is viewed by both merchants and consumers as a potential strategy for addressing price value issues. The other strategies are viewed as potentially not being as helpful. For example, simply reducing portion size is viewed as patronizing and freedom-limiting.
However, implementing even the interventions considered most desirable from both a consumer and a merchant perspective in a way that results in positive change will not be an easy task. Fisher described four major challenges to reducing portion size:
1. Portion size norms are inflated. In a survey of 300 chefs, while 76 percent surveyed said that they served “regular” portions, in actuality 83 percent served portion sizes exceeding the USDA standard (Condrasky et al., 2007). Interestingly, Fisher said, the larger portions were more likely to be served by younger chefs (under the age of 51 years), with 90 percent of chefs aged 50 or younger serving portions that exceeded the USDA standard. Fisher remarked that these findings are consistent with other findings showing generational shifts in perception of overweight status, with younger individuals less likely to perceive themselves as overweight (Burke et al., 2010).
3. Consumer information on portion size is difficult to understand. The most recently available NHANES data (2005–2006) show that only 47.2 percent of Americans use serving size information on labels (Ollberding et al., 2010), with those using the information consuming less energy, sugar, and fat. A significant portion of the population has difficulty interpreting consumer information on portion
size (Rothman et al., 2006). Although individuals with low literacy or numeracy appear to have the most trouble, even individuals with higher literacy or numeracy sometimes find the information difficult to interpret. Anecdotally, Fisher remarked that about 19 percent of students failed to correctly answer test questions on portion and serving size in one of her university courses.
4. Asking consumers to exert self-control is not enough. Along the lines of the fourth hypothesis that Mattes put forth during his presentation to explain the current dysregulation of energy balance that seems to be driving the increasing prevalence of obesity in the United States (see discussion in preceding section of this report), Fisher remarked that humans have a relatively weak defense against energy surfeit. Accumulating evidence suggests that environmental cues (e.g., portion size, dishware size) can overwhelm the internal biological signals that indicate nutrient sufficiency (Lowe, 2003; Zheng et al., 2009). Given that this may be the case—environmental cues may overwhelm internal hunger or satiety signals—an audience member questioned whether an intuitive eating approach to weight loss, whereby individuals are taught to use hunger and full signals to guide them in consuming the appropriate amounts of food, is therefore an ineffective strategy. Mattes replied that relying on these internal signals is probably the worst way to regulate energy intake; the data show that if food is available and palatable, people will eat more of it than they should based on their energy needs. Barbara Rolls, professor and chair of the nutrition department at the Pennsylvania State University, added that there has been limited research to evaluate whether children can be taught to be more in tune with their satiety cues but that similar studies have not been conducted in adults and more data have to be collected before it can be determined whether the intuitive eating approach is effective or not (Johnson, 2000).
Energy Density, Energy Intake, and Obesity
Although portion size clearly has a powerful effect on energy intake, Rolls put forth the argument that energy density has an even greater effect. In fact, several recent U.S. policy documents, such as the Report of the Dietary Guidelines Advisory Committee on the Dietary Guidelines
for Americans 201011 and The Surgeon General’s Vision for a Healthy and Fit Nation,12 emphasize the importance of energy density. Additionally, the American Institute for Cancer Research, the U.S. Centers for Disease Control and Prevention (CDC), and other organizations have published materials noting the importance of energy density and its role in weight management. Rolls highlighted key evidence serving as the basis for these and other policy claims around energy density, and she discussed strategies for reducing energy density. This section summarizes her presentation and the discussion that followed.
Effect of Energy Density on Energy Intake
There are two general approaches to studying the effects of energy density manipulation on energy intake: (1) satiety studies involve giving study participants a compulsory first course with a fixed amount of food (the “preload”) and then evaluating the impact on subsequent hunger or fullness and food intake in the next course (the “test meal”); and (2) satiation studies involve evaluating food intake when participants eat as little or as much as they want of the offered foods. Rolls discussed how evidence from both types of studies demonstrates that when palatability is controlled, people tend to eat a similar weight of food regardless of energy density; therefore, when energy density is reduced, for example by incorporating water into a food, energy intake decreases. This is true for both children and adults.
Satiety Studies on the Effect on Energy Intake of Reducing Energy Density
One of the first studies conducted on the effect of reduced energy density on energy intake involved simply increasing the water content of foods. Specifically, Rolls and colleagues (1999) reported that adding water to a casserole preload to make a soup significantly reduced energy intake during a test meal served 17 minutes later. Not only did individuals consume fewer calories after eating the soup preload than after the casserole preload, but they also consumed fewer calories than when they drank 10 ounces of water with their casserole. Rolls explained that it was not just the water that
____________
11 Available online: http://www.cnpp.usda.gov/DGAs2010-DGACReport.htm (accessed May 13, 2011).
12 Available online: http://www.surgeongeneral.gov/library/obesityvision/obesityvision2010.pdf (accessed May 13, 2011).
reduced subsequent intake; rather it was the incorporation of water into the food that made a difference.
In addition to water incorporation, another way to reduce energy density is through aeration. Rolls and colleagues (2000) examined the effect of aerating the preload on subsequent intake and found that increased aeration of blended smoothies (ranging from 300 to 600 mL) was correlated with decreased energy intake in the test meal. In a subsequent study, Bell and colleagues (2003) compared the effects of volume versus calories in order to determine which factor had a greater impact on what is known as sensory-specific satiety, that is, the termination of a meal as a result of food tasting less pleasant as more of it is consumed. When individuals consumed shakes that were increased in volume by the incorporation of water (600 mL), they reported greater reductions in sensory-specific satiety regardless of energy content (either 494 calories or 988 calories) than when they consumed smaller-volume shakes (300 mL, 494 calories). In other words, it was the larger size of the shake—not its calorie content—that made a difference.
An audience member asked about the role of aeration in decreasing the energy density of snacks in particular. Rolls reiterated that several studies with different types of snacks, such as cheese puffs, have shown that aeration leads to lower energy intake. Consumers often adjust their intake somewhat to make up for the aeration but not to a point where they are consuming the same number of calories. However, there are not enough long-term data indicating whether increasing the volume of snacks or any other foods via aeration has any effect on body weight. Mattes added that when manipulating for volume, there may be a potential benefit to simultaneously manipulating foods in ways that affect gastric distention. Otherwise, what looks big on the plate is not so big after it is swallowed. He speculated that if the cognitive response to a larger volume of food could be coupled with the biological volume detector in the body, the effect on energy intake (and possibly long-term body weight) might be more pronounced.
To gain a better understanding of how reductions in energy density impact energy intake in typical eating situations, Rolls and colleagues (2004b) examined the combined effect of reducing energy density and decreasing portion size by serving a salad preload in three different energy densities (0.33 cal/g, 0.67 cal/g, 1.33 cal/g) and two different portion sizes (150 g, or about 1.5 cups; 300 g, or about 3 cups). All combinations of energy density and portion size were tested, enabling the researchers to examine the effect of salads that were sized differently but had the same number of calories (i.e., a 100-calorie, 150 g salad vs. a 100-calorie, 300 g
salad; a 200-calorie, 150 g salad vs. a 200-calorie, 300 g salad). The salad conditions were compared to a condition in which no salad was served before the test meal. The researchers found that energy intake was influenced by both energy density and portion size, with the greatest reduction in intake observed when individuals ate the large low-energy-dense salad (300 g, 0.33 cal/g); they consumed 12 percent fewer calories at the meal than when they ate no salad (p < 0.001). So bigger can be better, Rolls said, with consumption of a large portion of a low-energy-dense food (e.g., a salad or soup) at the beginning of a meal reducing overall meal energy intake. Eating a high-energy-dense salad as a first course, on the other hand, can backfire as an energy intake reduction strategy. When people ate high-energy-dense salads, regardless of size (i.e., either 150 or 300 g salads at 1.33 cal/g), they consumed significantly more calories overall than when they ate no salad with the meal (p < 0.05 for the 150 g salad, p < 0.0001 for the 300 g salad). So large portion sizes alone are not the problem; rather, large portions of high-energy-dense foods are the problem. Rolls observed that although the implications of this finding for weight loss are unknown, the use of large, low-energy-dense salads as a first course is being used as a calorie reduction strategy in weight loss clinics nationwide and is reportedly going very well (i.e., according to anecdotal reports).
Satiation Studies on the Effect on Energy Intake of Reducing Energy Density
Unlike satiety studies, which involve serving a preload and then assessing the effect of the preload on fullness and intake during a subsequent course, satiation studies involve serving test foods and letting people eat as much or as little as they like and then evaluating energy intake. Rolls observed that satiation studies are more difficult to conduct than satiety studies because of the necessity of ensuring that foods in different experimental conditions are matched in terms of taste so that differences in palatability do not confound the results. One of the first satiation studies on the effect of reduced energy density on energy intake involved serving meals with varied energy densities but with the same macronutrient composition (Bell et al., 1998). The researchers reported that increasing the proportion of water-rich vegetables led to a reduction in energy density and that adults ate significantly fewer calories when energy density was reduced, with about a 25 percent difference in energy intake between the low- and high-energy-density groups after two days. There were no reported differences in hunger
or fullness ratings and no evidence of compensation for the reduction in energy intake by an increase in food intake.
Curious about whether the same is true of children, particularly because children are thought to compensate more than adults do, Leahy and colleagues (2008) conducted a similar two-day study in 3- to 5-year-olds involving two different levels of energy density at test meals. However, unlike studies in adults, where all meals were manipulated, the researchers manipulated only breakfast, lunch, and daytime snack (i.e., leaving dinner and evening snack unmanipulated). They reduced the energy density in several ways, such as increasing the proportion of fruits and vegetables (e.g., pureeing vegetables into the pasta sauce), reducing fat, and reducing sugar. The researchers found that reducing energy density did not affect the weight of the food consumed over the course of the two days, which meant that the children were not compensating for the reduced energy intake, and that reducing energy density significantly reduced energy intake by 14 percent (389 calories) by the end of the two days. Although it remains unclear whether this effect would be sustained over a longer period of time, these findings nonetheless suggest to Rolls that reducing energy density in foods served to children is a potentially very powerful way to reduce energy intake. The challenge, she said, is to reach those children who need this type of intervention the most.
Satiation studies have also been used to examine the combined effect of energy density and portion size. Rolls and colleagues (2006b) examined the effects of 25 percent reductions in either energy density and/or portion size over the course of two days, with the energy content of all meals exceeding the energy requirements of the subjects (so participants were not limited in the amount of food that they could consume) (Figure 6). Subjects were tested in all four conditions (i.e., no change in either energy density or portion size; reduced energy density; reduced portion size; reduced energy density and reduced portion size). Energy density was reduced in several ways—for example, by incorporating vegetables into mixed dishes, using less cheese on pizza or reducing the fat content of the cheese, reducing the fat content of salad dressing, and using fruit puree instead of fat in baked goods. The researchers reported that reducing energy density by 25 percent led to a 24 percent reduction in energy intake; reducing portion size by 25 percent led to a 10 percent decrease in energy intake; and reducing both energy density and portion size by 25 percent led to a 32 percent reduction in energy intake. So energy density and portion size each independently reduced energy intake, with energy density reduction having the greater
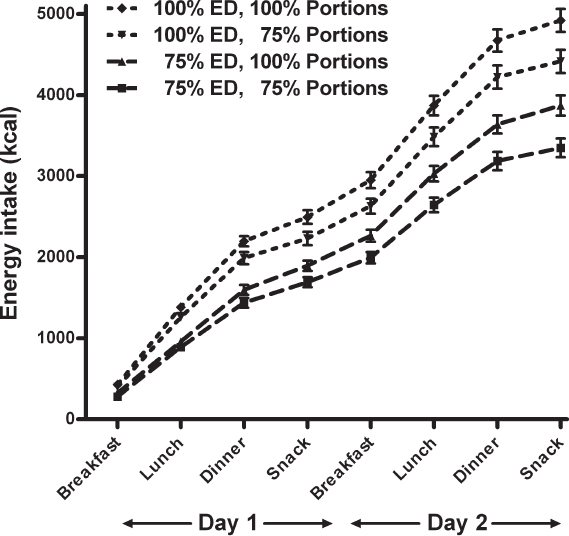
FIGURE 6 Effects of energy density (ED) and portion size on energy intake as measured over two days. Both ED and portion size affected energy intake, with ED having the greater effect. At the end of the two days, mean energy intake differed by as much as 1,600 calories between conditions.
SOURCE: Rolls et al., 2006b.
effect (e.g., serving smaller portions of high-energy-dense food resulted in greater energy intake than serving larger portions of low-energy-dense food). Based on this evidence, Rolls suggested that strategies to reduce energy intake can use energy density and portion size interventions in combination or separately, depending on the food product.
Given that reducing energy density has a clear and sustained effect on short-term energy intake, the question becomes: What is the long-term effect on weight status? Does reducing energy density, by way of reducing energy intake, lead to weight loss? Rolls noted that clinical trials have dem-
onstrated that reductions in energy density were associated with weight loss and maintenance (Ello-Martin et al., 2007; Rolls et al., 2005) and that longitudinal studies have shown associations between increased energy density and greater weight gain over 10-year periods (Bes-Rastrollo et al., 2008). Additionally, self-reported data from population-based studies indicate that normal-weight children and adults consume lower-energy-density diets (Johnson et al., 2008a,b; McCaffrey et al., 2008) than obese individuals do and that lower-energy-density diets tend to be higher in nutrient density (Ledikwe et al., 2006).
Strategies for Reducing Energy Intake by Reducing Energy Density
Although there are several ways to reduce the energy density of foods, Rolls remarked that increasing water content—for example, by increasing the proportion of fruits and vegetables—has demonstrated the greatest effect. Recent studies from Rolls’ research group have shown that vegetables can be hidden in many different types of foods, from carrot bread to macaroni and cheese to chicken rice casserole, as a way to reduce energy density while maintaining palatability (Blatt et al., 2011). In fact, both adults and children (3- to 5-year olds) demonstrated a preference for vegetable-enhanced baked goods. In adults, reducing the energy density of main dishes by 15 percent (relative to standard versions) decreased daily energy intake by 6 percent, and reducing the energy density by 25 percent decreased energy intake by 11 percent. Food intake by weight was the same across all conditions, indicating no evidence of compensation. Vegetable-enhanced entrees did not affect the intake of vegetable side dishes; overall vegetable intake increased 49 percent when adults were served main dishes with the 15 percent reduction in energy density and 80 percent when adults were served main dishes with the 25 percent reduction.
Other ways to reduce energy density include increasing volume via aeration, as was done in some of the satiety studies, and decreasing fat content, as was done in some of the satiation studies. As summarized in a later section, Mohan Rao, research and development (R&D) senior director at Frito-Lay, and Elaine Champagne, ARS Food Processing & Sensory Quality research leader, discussed several innovative fat-reducing technologies (e.g., baking, using rice batter instead of wheat batter for frying) and fat-replacing technologies (e.g., replacing fat with fiber) that have been developed or are currently in development.
Food Properties, Satiety, and Energy Intake
Although high protein content, glycemic index, and certain other food properties can reduce energy intake by increasing satiety,13 speaker Mattes argued that the effects are unpredictable and likely to be only modest at best. He reviewed evidence on the association between four food properties (high protein content, glycemic index, high fiber content, food form), satiety, and energy intake. This section summarizes Mattes’ presentation and the discussion that followed.
Effect of a High-Protein Diet on Satiety and Energy Balance
Despite popular claims that protein has a disproportionate influence on satiety compared to other macronutrients, Mattes said that the evidence is mixed. Mattes questioned conclusions by Gardner and colleagues (2007) that the greater weight loss associated with the high-protein Atkins diet, compared to non-high-protein diets, was a result of the greater satiety value of the higher protein content of the Atkins diet. Mattes argued that the only way that the Gardner and colleagues (2007) satiety claim can be true is if participants on the high-protein diet actually reduced their energy intake. However, the data indicate otherwise, that is, no significant difference in energy intake between the high-protein diet and the other diet groups. Although there are published data indicating an effect of protein on satiety, with a higher-protein diet leaving people feeling especially full and some evidence of lower energy consumption with higher-protein diets, a number of studies have shown either that protein has no effect on satiety or energy intake, that protein has an effect on satiety but no effect on energy intake, or that it has an effect on energy intake but no effect on satiety (Eisenstein et al., 2002). According to Mattes, most of the studies that do show a clear relationship between protein, satiety, and energy intake are very short term studies. Most of the long-term studies show a less robust effect or no effect. More recently than the review by Eisenstein and colleagues (2002), Gately and colleagues (2007) reported that serving children attending a summer camp either a high-protein diet or a normal-protein diet resulted in no difference in either satiety or energy intake.
____________
13 Satiety is the feeling of fullness upon eating. In addition to the various food properties examined here, other factors that contribute to satiety include behavior (e.g., eating patterns, including frequency, size, and timing of meals; exercise) and physiology (e.g., volume and nutrient detectors in the stomach; metabolic signaling in the peripheral tissues).
Why is the relationship between high protein content, satiety, and energy balance so unclear? One plausible explanation, according to Mattes, is that the vehicle for conveying the protein may be playing a role. When the same studies reviewed in Eisenstein et al. (2002) are categorized by food type, those involving proteins embedded in solid foods show much stronger associations between protein, increased satiety, and reduced energy intake compared to studies involving proteins embedded in beverages. It is not clear why. Although it has been argued that the weak associations in beverages are likely due to the fact that only so much protein can be put into a beverage, Mattes observed that beverages can in fact have substantial protein loads and that consumption of high-protein beverages may not moderate energy intake. Rumpler and colleagues (2006) compared high-protein beverages (40 g protein per 750 g), high-carbohydrate beverages (113 g carbohydrates per 750 g), and high-fat beverages (50 g fat per 750 g) and found that the average energy intake associated with drinking high-protein beverages over an eight-week period increased over time.
Another plausible explanation for the mixed evidence on the relationship between high protein content, satiety, and energy balance is that the source of the protein makes a difference. For instance, Hall and colleagues (2003) found that whey protein increased satiety and decreased appetite more than equal amounts of casein. However, Lang and colleagues (1998) reported no significantly different satiety ratings or energy intakes among different protein sources (i.e., egg protein, casein, gelatin, soy protein, pea protein, wheat protein). Bowen and colleagues (2006) also found that although the two milk proteins—casein and whey—were observed to increase satiety more than lactose (a milk sugar), all three had essentially the same effect on appetite and energy intake suppression.
Although it is unclear whether protein really has a greater effect than other macronutrients on energy intake by virtue of its effect on satiety, Mattes explained that protein can impact energy balance in other ways—for example, through thermogenesis (i.e., protein requires energy for digesting, absorbing, etc.) and via the retention of lean body mass (which leads to increased metabolism and greater caloric expenditure).
Effect of High-Fiber Foods on Satiety and Energy Intake
As with high-protein foods, there is widespread belief that high-fiber foods can impact satiety and, as a result, energy intake. Indeed, the 2010 USDA Dietary Guidelines recommend increased fiber consumption partly
because of the purportedly increased satiety value of high-fiber foods (DGAC, 2010). However, again, Mattes argued that the disproportionate effect of high fiber content on satiety and energy balance is unclear. As with protein, the evidence is mixed. As an example of the type of research being cited as showing an association between high-fiber foods and satiety, Tiwary and colleagues (1997) reported significant differences in satiety between individuals served orange juice by itself versus orange juice with pectin, with individuals served the latter reporting higher satiety scores. However, the authors also acknowledged that a number of the participants served the high-fiber orange juice were nauseated and under gastrointestinal distress, which likely explained why they did not want to continue eating. Mattes speculated that results from other studies showing positive effects on satiety and energy intake as a result of high-fiber consumption may similarly be confounded by the fact that very high doses (e.g., the recommended daily allotment: 25–38 g for females and males, respectively) are administered in one meal to participants accustomed to eating a third of this amount in a day to document a proof of principle. This may result in a misleading, non-ecological outcome. As an example of a recent study showing no effect of high fiber content on satiety or energy intake, Willis and colleagues (2010) reported no dose-response difference in satiety or food intake among subjects served 0, 4, 8, or 12 g of mixed-fiber breakfast muffins.
Again, why is the relationship between high fiber content, satiety, and energy balance so unclear? Howarth and colleagues (2001) conducted a literature review of fiber, satiety, and energy intake, categorizing studies by time (shorter or longer than two days) and type of manipulation (mixed fiber, soluble fiber, insoluble fiber) and found about a consistent 10 percent reduction in energy intake. So neither the length of the study nor the type of fiber made a difference. Moreover, Mattes explained, when the studies are categorized by fixed intake (i.e., people were given a fixed amount of food) versus ad libitum intake (i.e., people had some choice about how much they were going to ingest) daily weight loss as a function of added fiber was the same for both, even though studies with a fixed fiber load show a 20 g per day weight loss, on average, compared to a 24 g daily weight loss in the ad libitum intake studies. So regardless of whether individuals were on a fixed- or an ad libitum fiber intake diet, they lost the same amount of weight (2 g per day) for every 1 g of added fiber (average fiber consumption in the fixed load studies was 10 g per day, compared to 12 g per day in the ad libitum studies). Because appetite would be free to exert its effect on intake in the ad libitum trials, but not in the fixed-intake trials, Mattes interpreted this
to mean that there is no benefit in terms of weight loss due to the greater satiety value of increased fiber consumption. People would have to consume significantly more fiber than is feasible in order to see any dramatic difference in weight loss. Again, this does not argue against increased fiber consumption for optimal health, but expectations about the effects on body weight should be realistic according to Mattes.
Effect of Glycemic Index on Satiety and Energy Intake
Like high protein and fiber, glycemic index does not make for a good predictor of satiety either. Jenkins and colleagues (2002) showed that glucose levels quickly peaked but then dropped in individuals served glasses of water with 50 g of glucose per glass. Yet when the same glycemic index load was served to people over the course of 3.5 hours, there was no change in blood glucose levels. So the amount of time that consumers spend eating a product influenced response. In another study (Alfenas and Mattes, 2005), when individuals were served and allowed to eat ad libitum for eight days either all low-glycemic-index or high-glycemic-index foods, no differences were observed in either glycemic or insulinemic response. Nor were any differences in hunger reported. So again, Mattes cautioned that glycemic index is not a useful predictor of energy intake.
Effect of Food Form (i.e., Beverage vs. Solid) on Satiety and Energy Intake
The role of food form in determining energy intake via its impact on satiety is a very controversial topic, with strong views on both sides. Mourao and colleagues (2007) compared identical foods served in either beverage or solid form, with the predominant form of macronutrient being either a carbohydrate (watermelon), a fat (coconut), or a protein (dairy). For all foods, the researchers reported significantly greater energy intake when the foods were consumed as beverages. Thus, Mourao and colleagues concluded that liquid diets pose a greater risk for positive energy balance (e.g., weight gain) because liquids have a lower satiety value than solid foods. In one of the largest randomized controlled trials on food form and energy intake conducted to date, Houchins and colleagues (2011) provided individuals with five servings of fruits and vegetables in either beverage or solid form for eight weeks and reported that although all individuals gained weight over the course of the study (i.e., because adding foods to a diet without displacing other foods increases energy intake), individuals who consumed
their fruits and vegetables in beverage form tended to gain more weight (significantly so in the obese participants), again presumably because of the greater satiety value of the solid foods. Mattes explained that compared to solid foods, beverages have different cognitive effects (i.e., anticipated lower satiety value for a beverage than for a matched solid form, such as apple juice [even correcting for fiber] versus apples), produce different orosensory signals, pass through the gastrointestinal tract faster, elicit different endocrine responses, and are absorbed differently than solid foods, with all of these physiological response(s) to beverages bypassing many of the normal regulatory influences on energy intake.
Consumer Decision Making and Energy Intake
In addition to identifying eating behaviors that serve as good targets for innovative food technology-based obesity prevention and reduction interventions, it is equally important to consider how consumers make decisions about the products that have been altered with those technologies. As speaker David Just, associate professor in applied economics and management and director of graduate studies at Cornell University emphasized, an innovative food technology can be leveraged for obesity prevention and reduction efforts only if (1) a producer actually sells a product that has been improved with the technology, which means that the cost of production needs to be lower than that for comparable products or there has to be some additional value to justify the price premium; (2) consumers actually purchase the product, which means that the product needs to be reasonably priced and similar to or better tasting than comparable products and that consumers need to have a positive perception of the product; and (3) the improvement made possible by the technology is not immiserizing (i.e., does not have unintended consequences), which means that consumers need to understand the improvement in a way that leads to a preference for the product and in a way that does not lead to compensatory behavior.
Deciding what food to purchase or eat is not an individual-level decision. It is part of a game between the manufacturer and the consumer, wherein consumers are not fully aware of their behavior (e.g., they often misunderstand information or misperceive the consequences of consumption) but manufacturers are (as a result of market research, etc.). When new foods are introduced to the marketplace, marketers make the decision about whether to differentiate the new product from other products already on the market. Consumers simply respond to the new product landscape.
Consumers do not always react to prices and nutritional or other information about new products in rational ways; rather than weighing the various consequences of their actions and giving appropriate weight to vague information, most people fall back on habits and heuristic decision making. Just explained that when marketers differentiate between an improved product and the original product that it is replacing by drawing attention to the fact that the new product has certain health benefits, unpredictable behaviors can offset the intended health benefit of the new product. Health-conscious consumers are likely to overemphasize the health benefit of the new product and be willing to pay more than the innovation is really worth. It is also very likely that consumers that purchase the product would exhibit compensatory behavior, depending on the health claim. Narrow health claims (e.g., low fat, low calorie, low sugar) tend to be more distracting than broader health claims, with individuals often eating more than they intend (Wansink et al., 2004). For example, someone may eat more of something that is claimed to be “low fat” or may decide to eat dessert later because she or he ate a low-fat main course earlier. Unlike health-conscious consumers, consumers who associate health with bad taste or otherwise do not recognize the true health benefits of a new product would be much less willing to pay for the improved product and probably would continue to purchase the lower-priced product. Just remarked that many consumers believe that when changes are made to a food—for example, when sugar is reduced or fat removed—the food will not taste as good as the original product. Even when told otherwise, people expect the food to taste different. Wansink and Park (2002) have shown that just the appearance of the word “soy” can lead some consumers to believe that there is a huge difference in taste between soy-based products and other products. Consumers that decide not to purchase the new product would not receive any of the advertised health benefits at all. In summary, with differentiation, neither type of consumer would necessarily derive any benefit from the new product.
If, on the other hand, the marketer decides not to differentiate between the new product and comparable products, such that consumers are unaware of any special benefit of the new product, the marketer would be failing to take advantage of health-conscious consumers’ willingness to pay for the higher-priced product and would earn less profit. All consumers, health conscious or not, would choose the lower-priced product, and the new product would end up disappearing from the market. Again, neither type of consumer would derive any benefit from the new product. So, differentiating between new food products that have been improved through
technology leads to anomalous consumer behavior, with people responding irrationally and with health measures often backfiring. On the other hand, not differentiating between products can lead to a situation in which consumers are not aware of the benefits while producers are not able to capture the profits from those benefits. The only exception, Just explained, would be in the event that the cost of production of the new product was low enough to offer only one product, that is, the new product. In that case, all consumers would purchase the product and benefit accordingly.
Given that neither approach leads to optimal consumption, are there other options? Because more people are likely to benefit from non-differentiation (i.e., if only the new product is offered and the old product is removed from the market), is there a way to make a new product the norm without creating product differentiation? Without profit incentive, what other incentives are there? How can firms be rewarded for innovation? Are there ways to introduce differentiated products without creating these anomalous behavioral responses? Just did not provide answers to these questions.
When asked during the question-and-answer period how convenience impacts consumer behavior, Just replied that even a small change in convenience has a disproportionately large impact on consumer preference. As an extreme example, merely having the lid shut on an ice cream cooler in a store makes a big difference in how much ice cream people purchase. As another example, studies with school children have demonstrated that even a small, 6-inch difference in where milk versus chocolate milk is placed results in 20–30 percent of the children changing their minds about which type of milk to buy.
LESSONS LEARNED AND BEST PRACTICES
Workshop participants described several different types of technologies that have been developed and commercialized for the purpose of providing consumers with foods that can be used for weight loss or maintenance. These include reduced energy dense foods with lower fat or sugar content (see previous section for a summary of the workshop dialogue on the relationship between energy density, energy intake, and obesity); foods that are packaged to make it easy for consumers to control portion size (again, see previous section for a summary of the workshop dialogue on the relationship between portion size, energy intake, and obesity); foods that increase fruit and vegetable intake (Tara McHugh, ARS research leader of the Pro-
cessed Foods Research Unit, mentioned that low fruit and vegetable intake is a key risk factor for several chronic diseases); and foods with increased micronutrient density (as McHugh mentioned, biochemist Bruce Ames has hypothesized that insufficient micronutrient intake may drive overeating). This section summarizes the presentations and discussions that revolved around each of these various categories of technology.
Reducing Calories by Reducing Fat
Although removing or reducing fat content of food products is technologically challenging, it is possible. The challenge is not the actual removal of the fat, rather it is maintaining taste. Food manufacturers and scientists have leveraged several different technologies for removing fat without sacrificing taste. For instance, Rao described Frito-Lay’s development of new mixing, cooking, and frying technologies that led to a 30 percent fat reduction in SunChips (compared to regular potato chips) and the company’s novel heat transfer technology, which led to the creation and commercialization of Baked Lay’s, while Champagne described USDA scientists’ several generations of grain-based technologies for reducing fat (i.e., by replacing fat with fiber and through an innovative low-oil-uptake rice batter). This subsection summarizes their presentations.
Frito-Lay Fat Reduction Strategies for Snack Foods
Initiated in the late 1970s by Frito-Lay’s Lawrence Wisdom, the drive behind SunChips was to reduce fat by at least 25 percent and provide consumers with a snack product that was less energy dense than potato chips and other snack products on the market. It was a lengthy and difficult challenge, one that required new mixing, cooking, and frying technologies. As Rao explained, blending and cooking the four grains that comprise SunChips—whole wheat, whole milled corn, whole oat flour, and rice flour—required a new manufacturing process, which in turn required significant investment and represented substantial risk. Frito-Lay had to invent a new process for making and cooking the multiple-grain dough in such a way that the end product was homogeneous with respect to both composition (of ingredients) and dough properties (e.g., same thickness and crunchiness throughout). This required designing a new type of extruder technology that could mix four different grains, with different properties, and cook them all to the same degree by integrating computa-
tional fluid dynamics modeling into the extrusion process. This ensured that the flow of the food product through the extruder was exactly the same across its entire width so the extruded product had uniform quality in terms of texture, density, etc. Additionally, company scientists had to figure out how to control the fryer to ensure that the end product had, at a minimum, 25 percent less fat than regular potato chips, which required developing a novel type of dynamics matrix control technology—a system for measuring various output variables (e.g., amount of fat, color of chips) and using the information to change relevant input variables (e.g., temperature, length of frying) accordingly. The company ended up exceeding its goal of 25 percent less fat: SunChips contain 30 percent less fat than regular potato chips.
The fat content of Baked Lay’s was reduced through a different set of innovative technologies, all baking-related, not frying-related. Rao remarked that, again, development of the technologies required overcoming significant technological challenges, this time related to heat transfer. He explained that producing a baked potato chip that tastes good (not like cardboard) requires more than just slicing the potatoes and popping them in an oven. During “normal” processing of a potato chip, that is, via frying, heat transfer occurs quickly such that the center of the potato slice rapidly heats up while there is still water present, which makes for a nicely expanded, swollen, puffy chip. In the oven, where heat transfer is much slower, the starch inside the cells in the middle of the slices does not expand in the same way—in fact, it partially gelatinizes. Along with some other changes to the manufacturing process, Frito-Lay had to design an extremely high heat transfer rate oven in order to create a crispy-textured chip.
USDA Grain-Based Technologies for Fat Reduction
Outside of the food industry, USDA scientists have been involved in developing a range of innovative grain-based technologies for fat reduction, including several types of soluble and insoluble fiber fat replacers and a reduced-fat-uptake rice batter.
The Trim soluble fiber fat replacement products, OATrim, Nutrim, and C-Trim, and the insoluble fiber fat replacer Z-Trim, were developed by USDA researcher George Inglett. As Champagne explained, all four products are tasteless white powders, which makes them easy to incorporate into food products; additionally, all are heat stable and therefore suitable for a wide range of cooked or baked foods.
The process for the first-generation fiber-based fat replacer, OATrim, involved alpha-amylase hydrolyzing the starch in oat, barley flour, or bran into a combination of amylodextrins and beta-glucan. The amylodextrins are the actual fat replacers; they create a smooth mouthfeel. The beta-glucan provides beneficial physiological effects, namely a reduction of blood cholesterol. As a dry powder, OATrim contains 4.5 cal/g, compared to 9 cal/g for fat. As a fat-like gel, OATrim contains only 1 cal/g. When OATrim is used as a fat replacer in ice cream, calories of a 4-ounce serving are reduced from 298 to 135, fat is reduced from 22 g to less than 1 g, and cholesterol is reduced from 85 mg to 4 mg. Studies (i.e., the OATrim TRIALS) conducted by ARS researchers Judith Hallfrisch and Kay Behall have demonstrated that in middle-aged men and women with high cholesterol levels, five weeks of an OATrim-enhanced diet (a total of 50 g, or 0.5 cup, per day, added to various foods throughout the day, amounting to one-quarter of all fat in foods being replaced by the OATrim) led to decreased LDL (low-density lipoprotein) cholesterol levels (but not HDL [high-density lipoprotein] cholesterol), an improvement in glucose tolerance (reduced insulin, glucagon, and blood glucose levels), weight loss (4.5 pounds on average), and increased satiety (Hallfrisch and Behall, 1997; Hallfrisch et al., 1995; Scholfield et al., 1993). It took five years for OATrim to move from the lab to the market, where it is now labeled as “hydrolyzed oat bran.” Hydrolyzed oat bran is used in a wide range of food products, including pasteurized cheeses, baked products (breads, cookies, and muffins), processed meats, extra lean ground beef, and nutrition bars.
Manufacture of the second-generation product, Nutrim, relies on jet-cooking, instead of alpha-amylase, to produce the same two end products, that is, amylodextrins (the actual fat replacer) and beta-glucan. Like OATrim, Nutrim contains only 4 cal/g, compared to fat’s 9 cal/g. Nutrim has some unique properties that give it a creamy texture and make it a good replacer for dairy and coconut cream. It is used in soups, spreads, and salad dressings and is also sold as a nutraceutical.
The manufacturing process for C-Trim, the most recent soluble fat replacer, relies on a specific sequence of aqueous extraction and jet-cooking steps to produce the same end products, the amylodextrins and beta-glucan, as well as a high proportion of proteins and some bioactive phenolics. C-Trim has some unique properties that give it a very high viscosity and make it a good fat replacer in yogurt, smoothies, baked goods, and chocolates (replacing as much as 25 percent of cocoa butter). It is also sold as a nutraceutical. At 2.5–3.5 cal/g, C-Trim is also less energy dense than either
of the other two (powdered) products. A 4 percent addition of C-Trim to wheat batter can lead to a low-oil-uptake batter (a 40 percent reduction in oil uptake compared to traditional wheat batter).
Insoluble fiber fat replacers are manufactured via a multistage jet-cooking process that chews up the insoluble fiber in the bran or hulls of various grains (oats, corn, rice, wheat, soy) and produces a cellular debris that can have any of a range of textures, from a particle-like structure to a creaminess to a gel. If a 75 kg individual were to consume Z-Trim, a zero-calorie insoluble fiber fat replacer, at the daily recommended amount of fiber and as a one-to-one replacement for fat, he or she would consume 225 fewer calories per day. Champagne suggested that, like C-Trim, insoluble fiber fat replacers not only reduce fat content, but may also increase satiety by virtue of their high viscosity, in this case absorbing 24 times their weight in water. However, insoluble fiber fat replacers are not as effective as soluble fiber fat replacers in improving glucose tolerance.
Reducing fat content through use of a novel low-oil-uptake rice batter represents a very different approach but one with multiple applications, like the TRIM technologies. As Champagne explained, not only does the small starch granule size of rice (3–5 microns) simulate a fat mouthfeel effect, but also its white color and bland taste, combined with the fact that it is hypoallergenic and gluten-free, make it a naturally good fat replacer. Initially, using a traditional wheat flour recipe, USDA chemists developed a rice batter that, because of its gluten-free composition, absorbed only 50 percent of the oil that traditional wheat flour batter absorbs. Gluten’s hydrophobic nature gives it a greater affinity for oil; gluten also has a leavening effect that makes wheat batter more porous, leading to greater moisture release and greater oil uptake. However the initial rice batter, while less absorbent, was also brittle and hard to chew because of its low viscosity. So the scientists tested ways to improve the properties of rice batter by increasing its viscosity; they eventually determined that incorporation of either 3–7 percent phosphorylated rice starch or 3–7 percent pre-gelatinized rice flour into the untreated rice flour enhanced the batter’s water-holding capacity enough to make a batter that not only absorbs 50 percent less oil, or fat, than a wheat-based batter but also is more viscous and easier to chew. In fact, the viscosity of the improved rice batter was even greater than that of wheat batter.
Patented in 2001, the rice batter technology languished for a few years, until a class at Howard County Community College, Columbia, Maryland, adopted the technology in 2006 as part of a class project to determine the feasibility of commercialization. Two years later, a group of students from
the class founded CrispTek, LLC, and licensed the rice batter from USDA. In 2009, CrispTek released its first product, ChoiceBatter, with start-up funding from the Maryland Technology Development Corporation. Initially, ChoiceBatter was sold over the Internet. Today, it is sold in more than 400 grocery stores. A recent economic impact study predicts that sales will increase to $4.7 million by 2014, with 95 new jobs being created as a result of increased production. The batter can be used on chicken, fish, vegetables, etc., and it can also be used to make soups, sauces, and other foods for people on gluten-free diets. Through a Cooperative Research and Development Agreement (CRADA) with CrispTek, ARS is conducting research to expand application of the technology to pre-breaded frozen food products. As discussed later in this report, CRADA is one of two mechanisms through which manufacturers can partner with ARS to commercialize new food technologies developed by ARS scientists.
Reducing Calories by Reducing Sugar
Although removing fat may seem like the most obvious way to reduce the energy density of foods, given that fat contains more calories per gram (9 cal/g) than any other macronutrient and that fiber, for example, contains only 1.5–2.5 cal/g, energy density can also be reduced by removing or reducing sugar. Removing or reducing the sugar content of beverages provides an especially excellent opportunity, given the increased consumption of sugar-containing beverages over the past several decades (a trend that keynote speaker Foster identified) and given that, as Leahy noted, beverages are essentially the only foods besides chewing gums and some mints that can be calorie-free. The food industry has developed numerous reduced-calorie beverages over the years by reducing or replacing sucrose with no- or low-calorie sweeteners. As a result, Leahy said, the overall mix of beverage products in the marketplace has changed over the past 20 years, with the average caloric density of beverages (calories per ounce) having decreased by 24.4 percent. Most of the change in caloric density (21 percent) has occurred over the past 10 years (Storey, 2010). When the Coca-Cola Company’s first zero-calorie soft drink, TaB, which is sweetened with saccharine, was introduced in 1963, only 1 percent of the company’s trademark product volume was zero-calorie products. When the company’s second zero-calorie soft drink, Diet Coke, sweetened with aspartame, was introduced in 1982, 32 percent of the Coca-Cola trademark product volume was zero- or reduced-calorie products. Finally, when Coke Zero, sweetened with aspartame and
acesulfame K, was introduced in 2005, as much as 41 percent of the Coca-Cola trademark product volume was zero- or low-calorie. Leahy referred to research showing that using low-calorie sweeteners can aid in weight loss and maintenance (Blackburn et al., 1997; de la Hunty et al., 2006; Phelan et al., 2009).
Leahy identified three general types of caloric sweeteners: (1) isolated refined sugars, including sucrose, high-fructose corn syrup, glucose, fructose, and maltose; (2) fruit, including apple, grape, pear, and LoHanGuo (monk fruit) concentrate; and (3) other plant parts or products, such as honey, agave, and grain syrups. She identified two general types of no- or low-calorie sweeteners: (1) new and “natural” sweeteners made possible by technological advances, including Reb A (rebaudioside A or rebiana, an extract of Stevia that is based on the purity of one particular glycoside), other Stevia leaf extracts with greater numbers of glycosides, LoHanGuo extract, monatin (from a South African plant), brazzein (a sweet protein from a West African plant), and so forth; and (2) established sweeteners such as aspartame, acesulfame K, saccharine, and sucralose.
While sweetened beverages provide an important opportunity for sugar reduction technologies to be leveraged for obesity prevention and control efforts, other foods stand to be improved as well. For example, Lydia Midness, vice president of R&D at General Mills, Inc., remarked that General Mills has been working toward reducing the sugar content to less than 12 g of sugar per serving for ready-to-eat cereals being advertised to children. She noted that reducing sugar poses enormous formulation challenges because sugar acts as a bulking agent; when sugar is removed, aeration or other tools need to be used to increase volume.
Using Portion-Controlled Frozen Meals to Reduce Calorie Intake
Reducing the energy density of foods by removing or reducing fats and sugars is by no means the only way to reduce calorie intake. Bolles highlighted key evidence indicating that portion-controlled frozen meals are another effective means of reducing calorie intake. As previously summarized, Foster opined that one of the most promising obesity treatments is portion control, with several studies showing that providing patients with portion-controlled meals is a more effective weight loss strategy than telling patients to keep track of calories. Bolles effectively concurred, stating that the weight loss benefits of including portion-controlled meals as a regular part of one’s diet can be immediate. McCarron and colleagues (1997)
showed that adult males and females who consumed a reduced-calorie diet for 10 weeks centered around frozen meals for breakfast, lunch, and dinner (N = 272) lost significantly more weight (–10.3 vs. –6.8 pounds, p = 0.03) compared to a control group on a reduced-calorie diet without frozen meals (N = 270). More recently, Hannum and colleagues (2004) showed that adult females who consumed a reduced-calorie diet for eight weeks with frozen meals for lunch and dinner (N = 26) lost significantly more weight (–12.3 vs. –7.9 pounds, p < 0.05) than a control group on a reduced-calorie diet without frozen meals (N = 27). Using an identical protocol, Hannum and colleagues (2006) demonstrated similar results for men, with weight loss significantly greater (p < 0.05) in the group consuming frozen meals (N = 25, –16.3 pounds) compared to the control group without frozen meals (N = 26, –11.2 pounds). A longer-term study by Metz and colleagues (2000) also demonstrated that individuals who consumed a reduced-calorie diet utilizing frozen meals for 12 months (N = 120, –12.8 pounds) lost significantly more weight (p < 0.001) than the reduced-calorie diet control group without frozen meals (N = 130, –3.7 pounds).
In 2010, the Dietary Guidelines Advisory Committee conducted a Nutrition Evidence Library-based assessment of the relationship between weight loss and use of portion-controlled frozen meals (DGAC, 2010). A grading system was applied that considered research quality, quantity, consistency, magnitude of effect, and whether the observations could be generalized to the population of interest. These data were ranked as strong, the highest grade within the systematic review process. Recently, ConAgra Foods offered a weight loss program to employees in which 172 participants consumed two portion-controlled frozen or ready-to-eat meals daily from the ConAgra Foods portfolio over the course of four weeks and self-selected for additional foods. Mean weight loss was 7.5 pounds, and a follow-up survey conducted two months later found that 55 percent of the participants had maintained their weight loss and that 26 percent had continued to lose weight. The follow-up success was attributed to lessons learned during the initial program, with 83 percent of participants reporting that the use of frozen meals taught them the principle of portion control. Bolles interpreted these results to mean that not only can portion-controlled, frozen, ready-to-eat meals help people lose weight, but they can also help people to change their behavior by increasing awareness of portion size.
Additionally, Bolles said, portion-controlled frozen meals are an effective way to reduce energy density. ConAgra Food’s frozen meals across the Healthy Choice, Banquet, and Marie Callender’s brands have an energy
density (calories per gram) in the lower quartile of energy density for the entire diet based on data from NHANES (Kant et al., 2008; Mendoza et al., 2007). Furthermore, these meals contain substantially less saturated fat, sodium, and sugar than typical self-selected lunches and dinners as reported in NHANES (ARS, 2010b).
Increasing Fruit and Vegetable Intake
The World Health Organization (WHO) and the Food and Agriculture Organization (FAO) have identified low fruit and vegetable intake as a key risk factor for several chronic diseases (FAO-WHO, 2004). Additionally, the Economic Research Service (ERS) of USDA has found that people who eat more fruit servings per day have lower BMIs (the same is not true of vegetables because of the inclusion of French fries as a vegetable) (Biing-Hwan and Mentzer Morrison, 2002). Yet less than 30 percent of Americans eat the recommended daily servings of fruits and vegetables (Morales, 2010). In an effort to reduce the risk of obesity by increasing fruit and vegetable intake, in addition to the fat-reducing technologies described by Champagne (and summarized previously), ARS scientists have also been developing a variety of fruit- and vegetable-based technologies designed to make fruit and vegetable consumption more convenient. McHugh provided an overview of the types of products being developed with four of those technologies: forming, extrusion, casting, and coating. (As summarized below, McHugh also discussed a fifth technology, ultraviolet [UV] treatment, and its use in enhancing the micronutrient content of mushrooms and other vegetables.)
Forming Technology and Fruit Bars
ARS scientists developed a novel forming technology to create a 100 percent fruit bar, which Gorge Delights sells as the JustFruit bar, with each bar equivalent to two servings of fruit. Gorge Delights also produces a one-serving bar for school lunch and other programs, as well as organic and fortified versions of the bar. The bar was the product of a partnership between ARS and pear and apple growers who had been having trouble competing in the Oregon and Washington fresh fruit market; the partnership was formed to develop value-added technologies so that growers could continue to sell their fruit. Gorge Delights sold 500,000 bars the first year. The total number of bars sold to date amounts to about 550,000,000. (The
same forming technology is also being used to develop a micronutrient-rich bar. See below.)
Extrusion Technology and Legume-Based Cereals and Snacks
As with fruit, the USDA ERS has found that people who eat more fiber have lower BMIs. In addition to having more fiber, legume-based products also have higher protein content than other extruded snack foods. As a way to increase legume intake, Jose Berrios of ARS and collaborators from Washington State University have been using a novel extrusion technology to develop legume-based breakfast cereals and snack food products.
Casting Technology and Fruit- and Vegetable-Based Films and Sheets
ARS scientists used casting technology to develop films or thin sheets containing 85–90 percent fruits and vegetables, and the service partnered with NewGem Foods (formerly Origami Foods) to transfer the technology into commercialization of a variety of fruit- and vegetable-based nori (sushi wraps) and other products. In 2010, after only 1.5 years of production, the company reported having sold a total of $400,000 worth of wraps, amounting to about 131,555 pounds of fruits and vegetables. According to McHugh, it expects to increase sales to greater than $1 million in 2011.
In collaboration with Mantrose-Haeuser, Dominic Wang and other ARS scientists developed a fruit-based liquid coating technology that contains antioxidants and other compounds for extending the shelf life of fresh-cut produce. Mantrose-Haeuser has commercialized the technology through production of a range of products, including McDonald’s Apple Dippers. McDonald’s sold 54 million pounds of apples during 2005, the first year of production.
Increasing Micronutrient Density
Biochemist Bruce Ames has proposed that overconsumption of macronutrient-rich foods (i.e., high-sugar and high-fat foods)—that is, overeating—may be driven by dietary deficiencies in essential micronutrients and that eliminating these deficiencies could reduce or eliminate overconsumption (Ames, 2006). In collaboration with the Ames research group at Children’s Hospital Oakland Research Institute (CHORI) in Oakland, California, the ARS is applying the forming technology mentioned above
to develop a novel, micronutrient-rich “obesity prevention” bar. Phase II clinical trials are under way.
In a separate effort to increase micronutrient intake, McHugh and other ARS scientists developed a way to treat mushrooms with UV-B light in such a way that one of the mushroom’s naturally existing compounds, ergosterol, is converted into vitamin D, with 15 seconds of UV-B treatment producing 100 times the current Recommended Daily Allowance (RDA) in a single serving of mushrooms. McHugh remarked that application of UV-B technology to mushrooms represents a convenient way to increase vitamin D intake and that the process is being used nationwide by the number one mushroom producer, Monterey Mushrooms, on all of its mushroom varieties. ARS has also partnered with the USDA Western Human Nutrition Research Center to study the bioavailability of vitamin D from these mushrooms (compared to bioavailability from capsules) and is using USDA National Institute of Food and Agriculture funds to evaluate how the same technology can be used to enhance antioxidant content of carrots and other vegetables.
According to Leahy, food scientists in industry are developing other innovative technologies to enhance vitamin D and micronutrient content and bioavailability in various beverages, including milk. These new technologies include new bioconversion or bioprocessing technologies for adding soluble fibers and increasing nutrient levels; new separation technologies for removing bitter and other undesirable compounds; and new emulsification technologies for improving solubility, stability, and bioavailability of targeted components.
All of the technologies described in the previous section—and the many food products that have been commercialized or are currently being developed using these technologies—reflect significant progress toward providing consumers with tools to reduce energy intake and help control weight. Yet, as Rao, Leahy, and others remarked, innovation is a difficult, time-consuming process. For example, it took about 10 years of research and development before SunChips entered the market. Leahy mentioned that each of the new generations of zero-calorie sweetened Coca-Cola soft drinks (TaB, Diet Coke, and Coke Zero) took a significant amount of time to introduce into the marketplace; the development period varied among sweeteners because of differences in product development and
regulatory issues. According to Bolles, ConAgra Food’s steaming technology took about 18 months to develop. Midness commented that the same is often true of using innovative technologies to alter existing products, because significant technological challenges must be overcome when reformulating for reduced fat, sugar, or other components. Sponsors must have long-term strategies in place and must be dedicated to developing the necessary technologies. Arguably the most significant technological challenge is taste. If “improved” foods do not taste as good as or better than the foods they are replacing, consumers will not eat them. This section summarizes what workshop participants identified as the most difficult and important challenges to developing and commercializing innovative food technologies aimed at providing consumers with new tools to reduce energy intake and control weight. In addition to taste, workshop participants discussed affordability, reformulation, and price challenges of leveraging innovative technologies to alter existing products, regulatory hurdles to commercializing new or altered food products, and the challenge of consumer trust.
The challenge of taste was a major cross-cutting theme among nearly all of the discussions that took place during the course of workshop. No matter how nutritious or affordable a food product is, if it doesn’t taste good, consumers will not purchase it. Several speakers mentioned that any new food products aimed at reducing or preventing obesity must provide as much or more sensory pleasure than the foods they are replacing. Whether the goal is to develop a reduced-fat food, a reduced-calorie sweetened beverage, or a portion-controlled frozen meal, if the new food doesn’t taste good, people won’t eat it. Rolls stated that the number one reason people choose the foods that they do is taste. She referred to a survey (Condrasky et al., 2007) showing that most chefs could reduce the calorie content of their foods by 10 to 25 percent but do not because of lack of customer demand; the factor ranked as the most influential in determining the success of reduced-calorie foods was taste. Mattes commented that all foods have sensory properties and that it is impossible to separate food from hedonics. Everyone perceives something when eating and has an effective response to the information. In Mattes’ opinion, if it is true that the obesity problem is due not to a dysfunctional appetitive system, but rather to a nonregulated hedonic system that trumps the appetitive system (see earlier discussion around homeostatic
versus non-homeostatic regulation of eating behavior), then that is where the food industry should be focusing its attention: hedonics.
Rao remarked that poor taste is the downfall of many low-fat foods, because removing fat changes both flavor and texture. He remarked that Frito-Lay’s experience with SunChips and Baked Lay’s demonstrates that it is possible to create low-fat snack products that taste good and that consumers can still enjoy the taste experience of eating a full-fat potato chip. Frito-Lay would like to develop snacks that do not involve frying, which will require the development of new heat transfer technology—quite a challenge. Frito-Lay scientists are exploring new modes of heat transfer in an effort to meet that challenge.
Leahy remarked that taste is also the greatest challenge to developing zero-calorie or reduced-calorie sweetened beverages. She explained that different sweeteners have different taste profiles. For example, with sucrose, as concentration increases, sweetness intensity increases linearly. However, with Reb A, as concentration increases, sweetness intensity eventually levels off. Different sweeteners also have different temporal profiles, with some sweeteners having lingering effects. For example, the sweetness perception of sucrose disappears fairly quickly over time. The licorice derivative glycyrrhizic acid, on the other hand, leaves a long, lingering perception of sweetness. Additionally, sweetness is just one of several flavor attributes that impact taste; sweeteners can also impart bitter, sour, or licorice-type notes or leave sweet or bitter aftertastes. Finally, different people perceive sweeteners differently. The challenge with any no- or low-calorie sweetener is to mix and match various sweetener building blocks to match the taste and aftertaste of sucrose as closely possible.
Likewise, Bolles identified taste as the greatest challenge to developing portion-controlled frozen meals, but this is a challenge, he said, that can be met. In a paired comparison blind test (N = 41), 49 percent of participants preferred Healthy Choice Café Steamers over freshly cooked meals, suggesting that the steamers taste as good as freshly prepared meals. As Bolles explained, ConAgra Foods utilizes an innovative steaming technology that results in less moisture loss (2.1 percent compared to 8 percent for traditional frozen meals). The technology separates the meal components from the sauce such that the steam from the sauce is used to cook the meal components. This results in faster, more consistent heat transfer to cook the meal components and yields greater tenderness of meat and crispness of vegetables as indicated by peak force measurements during compression analysis.
On a more theoretical note, during the final discussion, David Allison, professor and head of the Section on Statistical Genetics in the Department of Biostatistics at the University of Alabama at Birmingham, speculated that the sensory aspects of food may be inseparable from the energy-containing aspects of foods and questioned whether it is possible to create the same taste experience with altered foods. He pointed to work by Scott Pletcher showing that while animals exposed to dietary restriction (i.e., fed less than average) lived longer than animals fed an average diet, Drosophila exposed to dietary restriction and to a rich yeast media (an odor representing the presence of plentiful food) died earlier than animals not exposed to the odor (Pletcher, 2009). In Allison’s opinion, the fact that exposure to the rich yeast media makes such a dramatic difference in lifespan even in the presence of dietary restriction, which normally prolongs life in the same animal model (as well as in other animal models), suggests that olfaction has a major impact on health and longevity. Allison’s comments stirred up a brief dialogue around whether food that provides a more pleasurable sensory experience necessarily leads to a shorter lifespan. Mattes remarked that the sensory properties of food elicit physiological responses that mimic everything that happens when a food is actually consumed. So, for example, putting fat into the mouth alters the release of digestive enzymes in the gastrointestinal tract within seconds, leading to a cascade of physiological responses (lipid absorption, lipid trafficking, storage of lipid in the intestine, triglyceride levels in the blood, lipoprotein lipase activity, etc.). So the idea that olfaction is related to longevity is not far-fetched, Mattes concluded.
As important as taste is, it is not the only factor to consider when developing and commercializing improved food products. As previously summarized, Just explained that not all consumers are willing to pay more for improved products. Midness described what she called the “new product development trifecta” of (1) taste, (2) health, and (3) the right price. Manufacturers must deliver products that not only have meaningful consumer health benefits with no taste trade-off but also are affordable to consumers. She pointed to Nature Valley Fruit Crisps as a product that was unable to successfully meet all three demands of the new product development trifecta. Developed for the purpose of providing consumers with more fruit in their diets, with each crisp providing one 50-calorie serving
of fruit, the crisps failed because the company was unable to provide the product that met the taste hurdle at a price that consumers were willing to pay. The right price requires finding low-cost ingredients and developing a low-cost manufacturing process. Rao pointed to TrueNorth as an example of a “healthy” snack product (not necessarily an obesity-related snack but a healthful nut-based snack food with 5 g protein per serving) that tasted great but has a high cost of ingredients. As another example, Flat Earth, a fruit- and vegetable-based snack launched by Frito-Lay in 2008, was discontinued because of low volume of sales.
Product Formulation and Ingredient Costs
Although many of the technologies described during the workshop were developed for the purpose of commercializing new food products or new types of food products, Midness emphasized that innovative technologies can also be leveraged to reformulate or otherwise improve existing products. The reformulation challenges of improving existing products can be significant: often when one component or ingredient is changed, others must be changed as well. The same is true for the ingredient cost challenges; sugar, for example, is an age-old and relatively cost-effective ingredient compared to some of the more expensive new technologies that serve as the basis for various sugar replacements. Still, it can be done. Existing products can be altered. In fact, Midness said, almost two-thirds of General Mills’ existing products, which amount to more than 500, have been reformulated, slimmed down with fewer calories, fortified, or otherwise improved to meet company health metric standards.
Of all the changes to existing products that General Mills has made, Midness identified the whole grain ready-to-eat cereals as the one that has most likely made the greatest impact on energy intake and weight. General Mills began increasing the whole grain-fiber content of its ready-to-eat cereals in 2005. The challenges have been significant, given that adding whole grain to a product impacts not just texture and taste but also processing and shelf life, but the effort has paid off. Consumption of ready-to-eat cereals, which has been shown to be associated with lower BMI (Good et al., 2008; Koh-Banerjee et al., 2004; Liu et al., 2003), has increased. Ready-to-eat cereals are now a leading whole grain source for Americans and the top source of whole grains in children’s diets (Bachman et al., 2008; Cleveland et al., 2000; Harnack et al., 2003). General Mills is also in the process of removing trans fats from its baked good products. Again, the reformulation
challenges are significant because different fats have different effects on dough quality and characteristics, texture, and mouthfeel.
Claims about the health benefits of an improved product can be made only if the reduction is 25 percent or more relative to the last formulation. Demonstrating that manufacturers have in fact made a 25 percent reduction poses a significant challenge because, as Rao said, meeting the minimum standards necessary for such a reduction requires precise control of multiple factors during the manufacturing process. For example, as previously mentioned, Frito-Lay had to develop a novel dynamic matrix controller technology for controlling the frying of SunChips in order to ensure that the product met the health claims of at least 25 percent less fat and the labeling claims of 30 percent less fat (i.e., compared to regular potato chips). Use of the technology has since expanded to other products as well.
Another significant regulatory challenge is the approval of new food ingredients, such as reduced-calorie or zero-calorie sweeteners. For example, earning GRAS (Generally Recognized As Safe) status requires collecting a large amount of data on the identity of the ingredient (which requires precise analytical characterization), conditions of proposed use (i.e., the types of products in which the ingredient will be used), intended technical effect (e.g., for sweetening), manufacturing methods, estimated daily intake, acceptable daily intake, and safety study data. Leahy pointed to Truvia, a zero-calorie stevial leaf extract developed jointly by the Coca-Cola Company and Cargill as a sweetener that has proven very successful despite having been met by regulatory hurdles. The actual sweetening component in Truvia, rebiana, was granted GRAS status by the U.S. Food and Drug Administration in 2008. Internationally, the Joint FAO-WHO Expert Committee on Food Additives also deemed Stevia extracts, including rebiana, safe. Now, Truvia is in a variety of products such as Sprite Green (50 calories per 8 fluid ounces), VitaminWater Zero (0 calories per 8 fluid ounces), and Odwalla Quencher (50 calories per 8 fluid ounces).
An overarching theme of the workshop discussion was that the food industry has been “demonized” by much of the American public, with modern food processing technologies being widely perceived as unhealthy at
best and dangerous at worst. Unless public perception of the food industry changes, there will come a day when it will be socially unacceptable to eat processed foods. As Fergus Clydesdale, distinguished professor and director of the Food Science Policy Alliance at the University of Massachusetts Amherst, opined, food technology certainly does not have all the answers to America’s obesity problem, but “it might have some answers.” Yet many consumer groups do not believe that the food industry can and should be part of the solution. In fact, many believe that the food industry is perpetuating the problem. Reaching consumers who are already philosophically opposed to the very concept of food processing, or food technology, creates a tremendous challenge, adding to the many technological and economic challenges of reducing energy density or otherwise altering foods in order to provide consumers with more healthful foods.
POTENTIAL FOR INNOVATION: NEXT STEPS
At the end of the workshop, participants engaged in a discussion of strategies for moving forward in an effort to leverage innovative technologies for obesity reduction and prevention efforts. This section summarizes that discussion. Participants spoke of the need to increase consumer awareness of the benefits of food technology; opportunities for industry to collaborate with government in efforts to develop and commercialize novel food technologies; the reality that there is no ideal or “magic bullet” product and the implications for prioritizing; the need for more consumer education on eating behavior norms; whether anything can be done to change consumer decision making in a way that encourages more healthful choices; the need to conduct more systematic analyses of energy intake, energy consumption, and obesity in order to get a better grasp on what the food industry can do—and what it cannot do—to prevent and reduce obesity; the role of prevention (versus the leveraging of technology) in the response to the obesity crisis; and the need to collect rigorous evidence on the long-term effectiveness of implemented interventions in order to inform future obesity reduction and prevention efforts. The suggestions summarized here represent individuals’ beliefs; they do not represent the findings, conclusions, or recommendations of a consensus committee process.
Bridge Building with Consumers
How can consumer groups and others who are generally not interested in a conversation with the food industry be entered into a dialogue with
the food industry? Foster suggested that perhaps there is a way to conduct a pilot conversation or dialogue of sorts around a single issue, perhaps with some of the more moderate consumer voices. He suggested starting small and with a particular focus so that the conversation is actually a conversation. A question was raised about whether there was any sector besides the food industry in a position to make a compelling case that processed foods can make a positive contribution to people’s diets. Ned Groth, a retired scientific expert at the Consumers Union, agreed that bridges need to be built between consumer organizations and the food industry and emphasized that the food industry is the one that needs to do the building because it has the resources. He suggested that the food industry send scientists, not public relations folks, across the bridge. For example, food industry scientists could put on a traveling road show of sorts to discuss the latest in low-calorie, high-quality packaged foods, with Consumers Union testing the foods and publishing its results in Consumer Reports. Food industry scientists could participate in a panel discussion with consumer groups at the Consumer Federation of America annual meeting (e.g., on “what are we doing about obesity?”). Alternatively, the food industry could approach the Center for Science in the Public Interest, or similar organizations, and ask how industry could do a better job of synergizing efforts with consumer groups. No matter what course of action is decided upon, he reiterated that industry needs to take the initiative.
Allison cautioned that even scientists need to consider their own sense of “righteous indignation” and perceived license to distort data when it comes to dealing with issues of concern to the food industry. He pointed to a meta-analysis of the association between sugar-sweetened beverages and energy intake or weight, in which Vartanian and colleagues (2007) found that the average overall effect was stronger in non-industry-funded studies compared to industry-funded studies, with the implication being that industry is somehow distorting evidence or reality. However, upon closer examination of the data, Cope and Allison (2010) found that in fact it was the non-industry-funded studies that showed evidence of distortion, with studies showing a significant relationship between sweetened beverage consumption and obesity more likely to be published than those not showing a significant relationship. Among industry-funded studies, on the other hand, there was no such “publication bias,” with all studies published regardless of statistical significance. So the smaller association reported by Vartanian and colleagues (2007), Allison explained, may be due to the fact that industry-funded studies without statistically significant results are nonetheless still being published. As another example of how scientists
distort data, he pointed to a 2004 study in the British Medical Journal on the relationship between sugar-sweetened beverage consumption and obesity; the authors showed that the statistical significance of the relationship between the two variables depends on how the data are analyzed (i.e., if BMI is treated as a continuous variable vs. a categorical variable). Of 115 studies that cite James and colleagues, 64 percent were at least moderately misleading in their interpretation of the results, citing only the evidence or analysis indicating a significant association between sugar-sweetened beverage consumption and obesity.
Boyle emphasized that having an understanding of what kind of experience consumers want is a key factor to keep in mind when considering what the industry can do to combat obesity and what types of novel technologies and products can be developed as part of that effort. Boyle agreed that early dialogue with consumers is key to understanding not only what consumers want and need but also what the medical community wants and needs and, therefore, what the possibilities are in terms of leveraging existing technologies or developing new technologies to aid in the reduction and prevention of overweight and obesity.
Government-Industry Collaboration
ARS is just one example of how partnering with government can serve the food industry well with respect to leveraging innovative new technologies in obesity prevention and reduction efforts. The ARS has proven to be a robust resource for innovation over the past several decades (Box 1), with research readily transferable to the private sector. Frank Flora, USDA ARS senior national program leader for product quality, new products and processes, described the focus of the ARS as mission-driven technology development, not profit-driven product development, with research priorities based on periodic (five-year) assessments of ARS capabilities, congressional mandates, and industry and academic stakeholder input.
Richard Brenner, assistant administrator at ARS for technology transfer, described two ways to partner with ARS:
- Licensing available technologies for commercial production. ARS researchers often develop background inventions and then seek private-sector interest for commercialization. When a company expresses interest, it must submit a license for the technology and ARS must post a Federal Register notice of intent to license. If, after
30 days, there are no legitimate objections to the submission for an exclusive license, the company is granted the license. About 90 percent of submissions are granted exclusive or co-exclusive licenses. In 2009, there were 301 active licenses, including 129 with commercial products in the market. Most of the licenses were with universities (118, or 39 percent), followed by small businesses (105, or 35 percent), large businesses including foreign multinationals with a major U.S. presence (54, or 18 percent), nonprofits (17, or 6 percent), and foreign businesses with no U.S. presence (7, or 2 percent). OATrim, NUtrim, C-Trim, Z-Trim, and the other fiber-based fat replacement technologies are examples of technologies that were developed by ARS and later licensed to private firms.
2 Establishing research partnerships through CRADAs. Unlike licensing, which is a somewhat passive process, Brenner explained that CRADAs involve more deliberate interaction between ARS and interested private firm partners. The partnerships between ARS and Mantrose-Hauser (e.g., McDonald’s Apple Dipper technology mentioned earlier), Gorge Delights (the JustFruit bars), and NewGem Foods (the fruit and vegetable films) were all CRADAs. Any invention that develops as a result of a CRADA is considered a subject invention, whereby USDA receives a patent on behalf of the CRADA partner and the CRADA partner negotiates an exclusive license without a Federal Register notice. In 2009, there were 233 active CRADAs, most of which were domestic (217, or 93 percent), and most of those being with small businesses (62 percent). The majority (167, or 72 percent) of CRADAs are with companies outside the state in which the ARS research is being performed, and most (133, or 57 percent) are with companies outside the geographic area where the ARS research is being performed. So there is a lot of cross-geographical area collaboration, Brenner remarked.
Whether through licensing or a CRADA, ARS provides only technical expertise. Collaborators must have the structural assets (i.e., intellectual and human capital); financial resources; and the manufacturing, marketing, and distribution capacity to commercialize the technology. Recognizing the challenge that this creates for small businesses in particular, in 2007 ARS established a program called the Agricultural Technology Innovation Partnership (ATIP) to manage intermediary agreements with economic development entities that provide the necessary complementary assets. The
BOX 1
The Organization, History, and Role of the Agricultural
Research Service
The ARS is one of four agencies within the Research, Education, and Economics mission area of the USDA (USDA is organized into eight mission areas). It is the in-house research arm of the USDA. While the ARS has 100 locations nationwide, with 21 national research programs and approximately 1,000 research projects covering the entire spectrum of farm-to-table topics, the majority of the post-harvest value-added research is conducted in four locations: the National Center for Agricultural Utilization Research, Peoria, Illinois; the Eastern Regional Research Center, Wyndmoor, Pennsylvania; the Southern Regional Research Center, New Orleans, Louisiana; and the Western Regional Research Center, Albany, California. In addition to housing chemical, microbiology, and engineering laboratories, all four regional centers maintain pilot plants for scale-up work to enable commercialization.
The ARS is credited with conceiving and developing countless innovations in food technology over the past half-century and longer, beginning in the 1940s:
- Developed palatable dehydrated eggs (1943)
- Conducted research on the creation of fruit essences, which led to the development of concentrated frozen apple and grape juices (1943)
- Developed a cutback technique to produce high-quality frozen orange juice concentrate (1946)
- Began a time-temperature tolerance project that ultimately led to the development of nine principles for freezing vegetables that remain the industry standard (1948)
first ATIP agreement was between the Maryland Development Technology Corporation and CrispTek, LLC, to support commercialization of Choice Batter. Although the technology was developed in New Orleans and licensed for commercialization in Maryland, Brenner noted that, interestingly, the greatest economic beneficiary is Iowa where the product is mixed and sold. ARS has since established seven additional economic development entities across the country, creating a nationwide Agricultural Technology Innovation Partnership Network.
- Developed methods to remove the off-taste of soybean oil, which included deactivating trace metal contamination and reducing rancidity-causing linolenic acid (1949)
- Developed xanthan gum, an edible food gum fermented from glucose by a microorganism (1950)
- Developed a process for making instant potato flakes (1954)
- Developed a method to prevent gelling in canned evaporated milk (1961)
- Discovered that the addition of vitamins C and E during processing reduced nitrosamine levels in fried bacon and other nitrite-cured products, which led to the food industry’s changing processing methods to minimize exposure to cancer-causing nitrosamines (1965)
- Developed the enzyme technology that provided the basis for lactose-reduced dairy products (1980)
- Developed OATrim fat replacer from soluble oat fiber and natural enzymes (1990)
- Developed reduced-fat mozzarella cheese (1995)
- Developed and patented Nutrim, obtained from the thermomechanical processing of oats, as a commercial soluble oat fiber nutraceutical (2000)
- Made Sunbutter, a sunflower seed spread and peanut butter alternative (2003)
- Developed an edible coating to keep sliced apples fresh; the coating was commercialized by Mantrose-Haeuser Co., Inc., and is being used by restaurants, stores, and the School Lunch Program (2005)
SOURCE: Flora presentation (November 2, 2010).
Innovation: There Is No Magic Bullet
Clydesdale asked if there is a way to involve the food industry in a dialogue with the public health community and relevant government agencies in an effort to make products that satisfy specific recommendations around obesity prevention and reduction. Boyle advised starting small: pick one industry partner and see if it works. If not, learn from it. Either way, once the product has some buzz, others will want to make the same effort. Instead of trying to roll obesity prevention and reduction efforts out on a
massive scale with respect to developing new food products, he suggested that it be done in small steps. Clydesdale’s question led to a brief discussion about whether or not there is an “optimal” food design that would lead consumers to not overeat but still be physiologically and psychologically satisfied. Midness replied, “There really is no magic bullet, [it is all about calories in and calories out] and I think that is what we all need to come to terms with.” Allison agreed and stated that there is no particular food or type of food that is going to leave people without excessive energy and with zero feeling of deprivation and that people have to learn to be okay with feeling a little bit of deprivation. Anecdotally, he said, “Every person I know who has a little tendency to gain weight and manages to keep it down says, ‘Some of the time I just push something away even when I am not completely satisfied. I feel a little deprived, but that is okay. That is life.’”
Allison remarked that in fact the food industry has engaged in the type of dialogue that Clydesdale proposed and has been developing such products, but are these products addressing the obesity issue? Are people eating fewer calories because they are eating, for example, baked potato chips, all-fruit snack bars, or any of the other products mentioned during the course of the workshop? He suggested that rather than developing new food products one by one, perhaps the real challenge is to encourage people to consume fewer calories. Foster agreed that such products are already available but perhaps are not being used appropriately. He pointed to 100-calorie packs, which he said could make a real difference if used in fixed eating situations. For example, if a child takes a 100-calorie pack instead of a 180-calorie pack to school every day, and if there is no opportunity to take two (or to get another one later), then cumulative energy intake would be reduced over time (unless the child compensated).
Given that there is no magic bullet, what should the priorities be in terms of developing and commercializing innovative technologies for consumers to use as tools for managing weight? Rolls asked whether it is preferable to make small changes to many foods or large changes to a few foods. Should efforts be broadly focused on reducing energy density or portion size in small increments over time, or would it be more effective to make major changes to a select group of key foods? Her concern is that unsuccessfully doing too much with a few foods could “poison the well” for other foods that really could stand to be improved by small amounts. She remarked that evaluating the potential benefits of small versus large alterations in energy density, portion size, or other parameters is an important research question in need of both scientific and economic data.
There was some discussion around whether changes should be made silently, without engaging in dialogue with consumers. It was pointed out that the food industry makes changes all the time without having a dialogue with consumers. For example, General Mills’ ongoing silent improvements include a 45 percent reduction of sodium in Cheerios; 10 percent reduction of sugar in Frosted Cheerios; 10 percent reduction of sodium in Green Giant Niblets; 66 percent reduction of fat and 25 percent reduction of sugar in Trix; 75 percent reduction of fat in GoGurt; and 10 percent reduction of fat in Grands! (biscuits). Plus, restaurant chefs are constantly changing their recipes without informing customers.
Chor-San Khoo, vice president of global nutrition and health at Campbell Soup Company, framed the question about prioritizing in a slightly different way. She asked what the number one priority should be when developing food products aimed at reducing or preventing obesity, given the large number of demands placed on the food industry by competing public policy interests (i.e., competing health interests, such as heart disease, diabetes, pediatrics, etc.) and the very long time it would take to meet all of those demands in a single product. Should the focus be calories? Should it be portion control? Should it be something pertaining to the sensory component(s) of foods? Allison referred to Foster’s earlier plea for simplicity. During his keynote presentation, Foster emphasized the importance of keeping the focus of obesity reduction and prevention efforts on calories when developing new technologies. He said, “If you chase sugar in the absence of calories, you won’t affect obesity. If you chase sodium in the absence of calories, you won’t affect obesity. Obesity is a calorie issue.”
Allison suggested that it might be easier to eat less than it would be to count calories and suggested that perhaps some sort of technology could be developed such that people know, at the checkout, how much food they are purchasing relative to what they had purchased the previous week. Boyle suggested that the issue may not be one of product development, given that some great products are already being manufactured by the food industry, but rather of product distribution. The challenge, he said, is to distribute products to where they are needed most (e.g., in neighborhoods without grocery stores, where people are buying food from liquor stores). He asked if there is a way to reinvent distribution so that these products are making it to the places where access to healthful food and obesity are most problematic.
Several participants emphasized the importance of providing consumers with simple messages, easier-to-read nutrition labels, and other tools
that enable easier decision making around energy balance. Boyle pointed to Nike+ (nikeplus.com) as an example of a product that provides consumers with immediate feedback about calories burned, distance, and so forth during workouts and suggested that similar products be developed that provide consumers with immediate feedback about calorie intake. Mattes mentioned a colleague who is developing a cell phone-based technology that will enable consumers to take a photograph of a food and immediately receive a nutrient analysis of the photographed food. Just mentioned how school food service directors are relying on various technologies to plan meals and also track the impact of nutritional changes. Rolls commented on the popularity of social network sites, such as SparkPeople, and the opportunities for getting children involved in similar programs given how easily children are influenced by their peers and role models.
Need for More Consumer Education on Eating Behavior Norms
The reality that there is no single magic food product fueled some discussion on education and the importance of sending simple messages around energy balance. Foster opined that “the sugar message” in particular is distracting. If the primary focus is tooth decay, then it makes sense to lead with sugar messaging, but if the primary focus is obesity, then it makes sense to lead with calories. While there may be some unintended consequences of posting calorie content on the front of a package or in a restaurant, educating people about calories in some form or another seems to be a reasonable starting strategy—the more people hear about calorie intake and portion size, the more likely it is that appropriate calorie intake will become a social norm, in much the same way that the wearing of seatbelts is today. Boyle suggested starting with children. He told an anecdotal story about driving a van-load of second graders on a field trip. One child immediately yelled “Stop!” as soon as Boyle started to back up the van. When Boyle asked what was wrong, the child replied that he did not have his seatbelt on yet. Boyle remarked that something needs to be done so that children that age are having similar reactions around food—so that, for example, a child says “stop” when he or she notices a server or someone else putting too much food on his or her plate. Boyle suggested that if the younger ages can be reached in some way so that they have this knowledge early on, a societal movement to eat less can be started. While some people will not pay any attention to the information, others will. It is like putting the prices on a menu. Some people are cost-conscious, others are not. It will not reverse what has hap-
pened over the past 30 years, but it might set a framework for future work. However if nothing is done, nothing will be accomplished.
An audience member cautioned that any public education on calories that is initiated not be too number-focused. Not only do people tend to get easily frustrated by or overly fixated on numbers in a way that could create a backlash, but also determining the number of calories that a person needs on a daily basis requires an individual-level approach. What works for one person in terms of appropriate calorie intake does not necessarily work for another person. It was pointed out that the individual-level nature of determining appropriate energy intake highlights the need to empower individuals by educating them and giving them the tools to make their own informed decisions about the foods they purchase and eat (e.g., handheld electronic devices that provide immediate feedback about calorie intake).
Molly Kretsch, deputy administrator for nutrition, food safety, and quality at ARS, suggested that “emotional eating” (eating for reasons other than hunger, such as stress) needs to be part of this conversation. Much of the discussion has centered on biological factors underlying eating behaviors and educational approaches for curbing those behaviors. Educational approaches are certainly important, but emotional eating and the many other reasons people consume excess calories are not likely to be responsive to educational messaging alone. Some segments of the population are not thinking about nutrition and health; they are thinking about how to get through the stress of the day. It is not clear that sending the message to “eat less” would have an impact on those populations, which raises the question: What can be done with technology to change the food supply in a way that addresses obesity in populations not as reachable through messaging? Kretsch mentioned “silent changers,” that is, changes to the food supply that could improve its healthfulness without any effort by the individual. For example, the calories in a serving of French fries, a widely consumed food in the United States, could be reduced by using the new ARS technology discussed at this meeting to reduce oil uptake during frying and hence calories per serving. This is only one example but others could be cited as well. Some participants remarked that while there are situations in which silent changes may be helpful, the use of technologies to improve the food supply, whether done silently or not, does not eliminate the need for public education on healthy eating behavior. Not only could public education, whether through front-of-package labeling or other means, contribute toward changing maladaptive eating behaviors, it also could be used to raise awareness about the health benefits of food technology.
The educational challenges extend beyond consumers to educators themselves. According to unpublished ConAgra Foods company data that was shared by Bolles, a 2010 study of 160 registered dietitians and diabetes educators showed that while more than 95 percent of health professionals discuss portion control with their clients, only about 15 percent mention frozen single-serve meals as a portion control strategy. Bolles said that frozen meals as a portion control strategy are left out of many weight management publications and guidelines from public health organizations including the CDC, the National Institutes of Health (NIH), and the Department of Health and Human Services.
Possibilities for Influencing Consumer Decision Making
Participants revisited some of the findings that Just discussed during his presentation about the unpredictable nature of consumer behavior, with behavioral economic evidence having yielded disappointing results about health claims. The question raised was: What can be done? Would including calories and other nutritional information on the front of packages influence consumer decision making? Just replied that there have been about 10 studies in chain restaurants in New York City on the impact of calorie labeling on consumer behavior, with the evidence indicating that calorie labeling does not prevent consumers from purchasing whatever food item they want to purchase. However, it does prompt people to select an item with fewer calories, if given a choice. In fact, some people actually feel good about their purchase, knowing that they are not purchasing the highest-calorie item. Allison cited a study showing that people will choose a smaller size if it is available, as long as it is not the smallest size. Given a 12-ounce beverage option at McDonald’s, people were willing to change from 21 ounces to 16 ounces (Sharpe et al., 2008). This suggests that behavioral insights, such as those identified during this workshop, can be used in a positive way without imposing restrictions on individual freedom.
How about taxes (e.g., tax on soda or junk food)? Could taxes on less healthful foods change consumer behavior? Just explained that there has been quite a debate among economists around the taxing of various foods, particularly sodas. Although raising the price would have an impact on consumption, the question is: How great would the impact be? Much of the evidence suggests that the impact would be minor. Also, people react in strange ways—they react differently to taxes than they do to an increase in price. Laboratory studies show that people do not like the fact that
attempts are being made to manipulate what they eat and will strengthen their preference for the food being taxed. In the field, while people initially exhibit similar behavior, eventually the cumulative cost of the tax adds up to a point where many people respond by eating less.
Another suggestion was put forth that perhaps tax deductions for weight loss and maintenance might impact obesity on a larger scale. In response, Allison mentioned a 16-week study showing that financial incentives for losing weight do not work (Volpp et al., 2008). A follow-up, longer study (32 weeks) showed the same (John et al., 2011). In both studies, although incentives led to significant weight loss, the weight was regained after the intervention ended.
A member of the audience asked whether primary prevention might be the best approach to responding to the obesity epidemic, especially given all the unintended consequences related to unpredictable behavior around food and eating (e.g., the way people react when a food is marketed as being lower calorie). It is not clear what such a primary prevention approach would encompass. As just one example, it could include a focus on prenatal education (e.g., educating obstetricians to educate pregnant women; incorporating prevention education into the Special Supplemental Nutrition Program for Women, Infants, and Children, popularly known as WIC). Indeed, during his presentation earlier in the workshop, Foster remarked that with the majority of obesity treatments, the most frequent outcome is weight regain (LaGrotte and Foster, forthcoming), a reality that points to the importance of prevention. Unless the cause of the behavior that leads to obesity is addressed, people who lose weight through structured weight loss programs will eventually regain the extra weight. In order to prevent weight regain, the behavioral factor(s) driving weight gain in the first place needs to be identified and addressed. Either people are eating too much, or they are too sedentary. In Foster’s opinion, both behaviors pose enormous challenges given that they are so readily reinforced in today’s society. Inexpensive, palatable, energy-dense foods are available at rest stops, gas stations, and in all sorts of places where they were not available 30 years ago. The more that people are exposed to inexpensive, palatable, and energy-dense foods, the more difficult it is to break the habit of eating them.
Foster replied that the downside of a primary prevention strategy is that
it would take a long time to see any benefit and that it would be difficult to know how to even measure benefit (e.g., prevalence of obesity, new cases of obesity). This does not mean that it is not worth doing, only that it would probably not involve conducting a randomized controlled trial and that it would be difficult to documents the benefits. Allison remarked that the type of longitudinal studies needed to evaluate outcome take too long. It would take an entire human generation to see certain effects, such as how growing up under certain environmental conditions impacts energy balance later in life. He mentioned a rodent study demonstrating that early-onset exercise (i.e., exercise during the first few weeks of life) can reduce obesity in obesity-prone rodents: even if the rats stop exercising later in life, they maintain lower body weights (Patterson et al., 2008). It is much more challenging to show similar effects in humans.
Eric Decker, professor and chair of the Department of Food Science at the University of Massachusetts Amherst, mentioned that there has been a large amount of government funding directed toward nutrition education, especially in the area of obesity, but it is not clear how effective those educational efforts have been in terms of reducing obesity. He observed that part of the challenge is the lack of tools available to people who want to change their eating behavior as a result of having been educated. If people want to change their eating behavior, how do they do it? They do not know which foods to eat. The products are not there. Decker made a call for more funds to be directed toward improving and developing food products that people can use to implement the desired change.
Need for a More Systematic Analysis of Obesity
A member of the audience remarked that there needs to be a more systematic analysis of obesity in America, one that considers energy expenditure as well as energy intake. For example, some educational policies that emphasize academic performance have resulted in the elimination of recess in favor of additional classroom time. The absence of exercise at school, combined with increased time at home spent in front of the television or computer, is just one example of the type of social pressure existing today that impacts energy balance. The audience member noted that a systematic analysis would help manage expectations around what the food industry can do—and what it cannot do—by leveraging technology to change foods or eating behaviors.
Several speakers and workshop participants commented on the need for more long-term data on the various interventions aimed at overweight and obesity reduction and prevention. For example, while there is plentiful evidence indicating that portion-controlled frozen meals effectively reduce calorie intake and increase short-term weight loss, there are no data on the impact of portion-controlled frozen meals on weight loss maintenance beyond one year. Bolles said that now is the time to begin collecting those data.
Similarly, although data indicate that 100-calorie snack packs reduce short-term energy intake, the long-term consequences are less certain. Allison cited a crossover study showing that people served 100-calorie packs consumed fewer snack calories per gram than people who received standard size packs but that the effects disappeared when study participants who had previously received 100-calorie packs were administered standard size packs instead and vice versa (Stroebele et al., 2009). Results such as these underscore the potential differences between short-term versus long-term studies and controlled versus real-world settings. What really happens when people are out in the real world consuming these food products over long periods of time? What are the real-world effects of 100-calorie snack packs? Rolls mentioned research showing that people who diet with prepackaged 100-calorie packs may end up eating more than when eating ad libitum. She wondered whether people who eat the restricted-portion size packs are receiving some type of message, such as “it’s a ‘diet food’” that makes them feel so good about eating it that they want to eat more.
The importance of rigorous long-term, real-world data cannot be underestimated. As Rolls said, “Eating behavior is complicated, and the studies are pulling up mixed results.… We may have good intentions with some of these things that we are trying to do, but they may backfire on us if we do not really get good thorough data.”
Role of Compensation
Allison identified compensation as an important phenomenon that often does not manifest in short-term laboratory studies. It makes sense, he said, that serving a child a 100-calorie pack instead of a 180-calorie serving on a daily basis should make a difference over time in terms of BMI—but only if there is no compensatory response. As he said, “We know that
biological systems are exquisitely adaptive, and yet we have only a modest understanding [of that propensity for adaptation].” He showed data demonstrating a large difference between theoretically projected weight gain and actual observed weight gain as a result of consuming an extra 150–250 calories a day in the form of sugar-sweetened beverages over the course of a year, with actual weight gain as a result of consuming extra calories being much less than expected—because of compensation (reviewed in Mattes et al., 2011).
Mattes identified compensation as “the central question” for both children and adults. He mentioned Leann Birch’s research on compensatory behavior in children and stated that McKiernan and colleagues (2008) have shown similar effects in adults. Mattes also emphasized the importance of eating frequency, a factor that was not addressed much during the workshop. He explained that total energy intake is determined not only by portion size but also by portion size plus eating frequency and that one cannot assume that manipulating portion size without accounting for eating frequency will have the desired outcome. In fact, Continuing Survey of Food Intakes by Individuals (CSFII) data indicate that eating frequency accounts for a greater proportion of variance in energy intake than does portion size, mostly likely because of a compensatory response.
Rolls mentioned a study showing that over 11 days, people did not compensate when served larger portions (Rolls et al., 2007). However, other studies show the opposite among people served smaller portions. In general, she said, the literature seems to suggest that people tend to compensate more for underconsumption than for overconsumption. Allison conceded that compensation does not occur under some circumstances but reiterated that it can have a significant impact under other circumstances. He cited CSFII data analyzed by Michael Anderson and David Matsa showing that even though people consume about 225 calories more when they eat restaurant meals compared to non-restaurant meals, their entire day’s food intake reflects a much smaller 25-calorie difference because of compensation. That is, people who eat a big lunch at a restaurant tend to eat a smaller dinner at home and vice versa (Anderson and Matsa, 2007). As another example of how biological systems “adapt” to situations in unexpected ways, Allison pointed to a study by Li and colleagues (2010) showing that mild caloric restriction (5 percent) in mice actually increased body fat mass; presumably, the mice anticipated a lean energy environment and the need to store energy, so they cut muscle (lean body mass) and kept the fat. Allison concluded that the evidence is mixed on whether compensation makes a
significant difference with respect to energy intake and weight gain or loss and that more research needs to be conducted in order to better understand the circumstances under which compensation matters.
Foster agreed that compensation is interesting but mostly from an academic point of view. He questioned whether understanding compensatory behavior is helpful from a public health point of view. Although compensatory behavior clearly occurs and has a significant impact, can it really explain the dramatic increase in the prevalence of obesity that has occurred over the past 30 years? He said, “The bottom line is that people are eating a lot more and burning a lot less than they were 30 years ago.… I am not sure if [compensation] gives us any particular leverage on the issue.”
Compensation and Increasing Fruit and Vegetable Intake
The issue of compensation came up again when Carol Kellar, senior director of quality, scientific, and regulatory affairs at Kraft Foods North America, suggested the promotion of fruits and vegetables as a first step toward responding to the obesity crisis while continuing to develop the broad range of new technologies currently being explored. Mattes replied that evidence on the potential benefit of increased fruit and vegetable intake is mixed. There are as many studies showing that increased fruit and vegetable intake leads to no change in body weight, or even increased body weight, as there are studies showing that increased fruit and vegetable intake leads to weight loss.14 For example, Allison pointed to a study by Whybrow and colleagues (2006) that showed no significant difference in weight change between individuals who ate more fruits and vegetables over the course of eight weeks compared to individuals who ate a standard diet. Svendsen and colleagues (2007), on the other hand, showed a slight benefit in adding more fruits and vegetables to the diet. Generally, Allison explained, it seems that eating carrots, for example, is helpful from a weight point of view only if the carrots replace something else more energetically dense and only if there is no compensation over time. Because fruits and vegetables do have calories, Mattes said that the message should be to increase fruits and vegetables but only as part of a weight-control regimen.
____________
14 The precise contributions of fruit and vegetable intake are an active research area. For example, since the workshop, a review of experimental and longitudinal studies in adults and children found that the relationship between fruit and vegetable intake and reduced adiposity is weak among overweight adults and is unclear in children (Ledoux et al., 2011).
Foster agreed that substituting fruits and vegetables for something else that is more calorically dense would work in fixed eating situations. However, usually fruits and vegetables are pushed such that they are simply piled up on top of everything else.
Promotion of “Good” Science by the Food Industry
Allison remarked that despite reduced-calorie and zero-calorie beverages and other new products having been introduced into the marketplace over the past several decades, the prevalence of obesity has continued to increase over time. At first glance, one might infer that none of these new products are making an impact. Allison explained, however, that there are many factors at play and that the research conducted to date is not “probative” in the same way that pharmaceutical research is. In fact, pharmaceutical companies do not have a choice with respect to whether or not they want to assess the impact of their products on human health. An enormous share of pharmaceutical industry expenditure is dedicated to R&D. In the food industry, on the other hand, most R&D money is spent on product development or market research, not on assessing the human health effects of consumption. Allison observed that there has been a tremendous amount of discussion around taxation, sugar-sweetened beverages, labeling, and so forth, and yet very little randomized experimentation in the field.
Decker pointed to federal funding as a major challenge, noting the low profit margin of the food industry and the lack of federal subsidization of food research. He noted a lack of recognition at the federal level that food impacts health and that food is part of preventive medicine. Decker observed that most USDA-funded research is related to production agriculture, not value-added food. Brenner agreed that federal funding of food research and development represents a very small portion of the federal R&D investment and encouraged more collaborative basic research (e.g., more collaboration between NIH, USDA, and the food industry).
Although the food industry does not engage in R&D to the extent that it probably should, Allison commented that it does do “good science.” He mentioned past research with trans fatty acids and how the food industry and USDA partnered to fund research that eventually showed the negative health consequences of trans fatty acids (Judd et al., 1994). Allison said, “That wasn’t the answer we hoped for…. I think the industry needs to get credit for those kinds of things.” Susan Crockett, vice president and senior technology officer for health and nutrition at General Mills, added that General Mills has spent millions of dollars on research on the impact
of ready-to-eat cereal consumption on weight and other health parameters (General Mills, 2009), with solid evidence showing that ready-to-eat breakfast cereal is the lowest-calorie common breakfast choice15 and that its consumption is associated with lower body weight (Barton et al., 2005). Brenner suggested that the i6 Challenge grant program be considered as a way to get funding to demonstrate how food technologies can be used to benefit communities in terms of reducing or preventing obesity.
To conclude, Allison made a call for high-quality “probative” research that continues over time and evaluates the impact of any given intervention on not only attitudes and beliefs, or purchasing and consumption, but also obesity prevalence. That is, does the intervention actually impact obesity? The vast majority of labeling studies, for example, evaluate purchasing but not long-term weight change or obesity prevalence. He stated that reaching those types of big-picture conclusions about implemented interventions will require cooperation and participation among government, academia, and the food industry. Allison emphasized the urgency of moving forward now, even with imperfect knowledge. He said, “We cannot wait for the best available evidence.” At the same time, we must conduct the type of rigorous experiments that are needed to evaluate the impact of what is being implemented.
In November 2010, the IOM convened experts from industry, academia, and government to discuss how food technologies can be leveraged to alter eating behaviors associated with excess energy intake. Participants explored progress that behavioral scientists have made over the past 10 to 20 years in teasing apart the inordinate complexity of human eating behavior; how food scientists have been using this growing evidence base to develop novel technologies in an effort to reduce the obesity burden on the American public; and strategies for moving forward.
Workshop participants explored four general categories of eating behavioral challenges. First, a growing body of evidence shows a strong association between increased portion size and increased energy intake. Although a handful of studies have shown correlations between increased portion size and obesity, Fisher explained that it is unclear whether increased
____________
15 2005–2006 NHANES data available online: http://cdc.gov/nchs/nhanes.htm (accessed April 13, 2011).
portion sizes are driving obesity or vice versa. Nonetheless, Foster opined that portion size control is arguably one of the promising obesity treatments. Second, another growing body of evidence suggests that energy density arguably has an even greater effect than portion control, with studies showing that reducing energy density—for example, by increasing the water content of foods—reduces energy intake (e.g., Rolls et al., 1999). However, as with portion size control, Rolls stated that the long-term effect of reduced energy density on weight status is unclear. Third, although there are many popular claims that high protein content, glycemic index, and various other food properties can reduce energy intake by increasing satiety, Mattes concluded that the evidence is mixed and that the effects of increased satiety on energy intake are moderate at best. Finally, Just made the case that consumers behave unpredictably toward “improved” food products (e.g., foods with health claims) and often in ways that defeat the purpose of the improvements, creating a quandary for the food industry. By differentiating between improved and existing products, there is a good chance that consumers will not benefit from the improvements. Yet by not differentiating, producers are unable to capture the profits from those value-added benefits.
Food scientists have been using this behavioral science evidence base as a guide for developing products to help reduce energy intake. Most notably, Rao and Champagne described the considerable efforts to develop lower-energy-density foods by reducing fat content. Although removing fat may seem like the most obvious way to reduce the energy density of foods, given that fat contains more calories per gram (9 cal/g) than any other macronutrient, energy density can also be reduced by removing or reducing sugar, as discussed by Leahy and Midness. Bolles described how some food manufacturers are tackling portion size instead of or in addition to reducing energy density. Finally, although there was little discussion of the evidence for an association between increased fruit and vegetable intake and increased risk of obesity, McHugh shared several technologies that USDA scientists have developed in an effort to provide consumers with novel means for increasing fruit and vegetable intake. McHugh also described technologies being developed by USDA scientists for the purpose of increasing micronutrient intake.
Although the many examples of technological successes shared during the workshop suggest that in fact the food industry is already providing consumers with tools for reducing or preventing obesity, none of these achievements have been easy. Workshop participants identified taste as arguably the greatest challenge. Whether the goal is to develop a reduced-
fat food or a portion-controlled frozen meal, or something else entirely, if it does not taste good, consumers will not eat it. Moreover, improved products must be affordable to consumers; otherwise, people will not buy them. Participants identified several examples of improved food products that failed or were discontinued because of price problems. Expense is a challenge not only for new products but also when reformulating existing products. Sugar, for example, is relatively cost-effective compared to some of the newer technologies being used to produce sugar replacements. Cost aside, reformulation itself poses a significant challenge; often when one component is changed, others must be changed as well. Manufacturers also face various regulatory challenges, such as health claim qualifications, when leveraging new technologies. Finally, on top of all the technical, economic, and regulatory challenges, is the reality that some consumers are philosophically opposed to the very concept of food technology, or food processing, regardless of any potential health benefits.
Based on lessons learned from past experience about what works and what does not work, workshop participants discussed several strategies for moving forward when leveraging technology in the effort to prevent and reduce obesity. Several participants asserted that there is no “magic bullet” food product, or type of product, to serve as an obesity prevention or reduction tool. Nor is it clear whether any of the products identified during the workshop that are currently on the market, such as the various reduced-fat snack products, have impacted either short-term energy intake or long-term weight status. That there is no magic bullet raises questions about what to prioritize when developing new products. For example, is it more effective to make small changes to many products or large changes to a few products? Should changes be made silently, without consumer awareness? Should more effort be focused on developing technologies to help consumers keep better track of calories consumed? There was also a great deal of discussion around the need to engage with consumers about the health benefits of food technologies and the need to educate consumers about eating behavior norms.
Suggestions from the participants for moving forward included keeping the focus on calories, recognizing that some segments of the population are not reachable through conventional public education and that alternative strategies need to be developed, educating children about portion sizes and other eating behavior norms, and educating educators themselves. Additionally, there was quite a bit of discussion around the potential for fruitful collaborations between industry and government to develop novel
food products for commercialization. For example, Brenner explained that ARS provides two mechanisms for partnering: licensing USDA-developed technologies for commercial production and establishing research partnerships through CRADAs. Finally, an overarching theme expressed by many participants during the two-day dialogue was the lack of research, particularly long-term research. For example, Allison pointed to the need for “probative” research aimed at evaluating whether interventions actually impact obesity. Too often, studies stop at short-term purchasing or eating behaviors or energy intake. There was also a call by participants for a more systematic analysis of obesity in America—that is, research aimed at teasing apart not only behaviors that lead to excess energy consumption but also behaviors that lead to insufficient energy expenditure. An audience member remarked that a systematic analysis would help to manage expectations of the role and responsibilities of the private sector. These next steps suggested by workshop participants helped to establish a greater understanding of how food technology can be incorporated into the multifaceted response to the complex interplay of environmental, social, economic, and behavior factors that influence the prevention and reduction of obesity.
Alfenas, R. C., and R. D. Mattes. 2005. Influence of glycemic index/load on glycemic response, appetite, and food intake in healthy humans. Diabetes Care 28(9):2123-2129.
Ames, B. N. 2006. Low micronutrient intake may accelerate the degenerative diseases of aging through allocation of scarce micronutrients by triage. Proceedings of the National Academy of Sciences of the United States of America 103(47):17589-17594.
Anderson, M., and D. Matsa. 2007. Are restaurants really supersizing America? http://are.berkeley.edu/Papers/anderson08.pdf (accessed April 5, 2011).
ARS (Agricultural Research Service). 2010a. Snacking patterns of U.S. adolescents: What we eat in America, NHANES, 2005–2006. Food Surveys Research Group dietary data brief. http://ars.usda.gov/Services/docs.htm?docid=19476 (accessed May 13, 2011).
ARS. 2010b. What we eat in America. NHANES, 2007–2008. http://www.ars.usda.gov/SP2UserFiles/Place/12355000/pdf/0708 (accessed May 13, 2011).
Bachman, J. L., J. Reedy, A. F. Subar, and S. M. Krebs-Smith. 2008. Sources of food group intakes among the U.S. population, 2001–2002. Journal of the American Dietetic Association 108(5):804-814.
Baker, S., S. Barlow, W. Cochran, G. Fuchs, W. Klish, N. Krebs, R. Strauss, A. Tershakovec, and J. Udall. 2005. Overweight children and adolescents: A clinical report of the North American Society for Pediatric Gastroenterology, Hepatology, and Nutrition. Journal of Pediatric Gastroenterology and Nutrition 40(5):533-543.
Ball, G. D., and A. Friedman. 2010. Dice, golf balls, and CDs: Assumptions about portion size measurement aids. Canadian Journal of Dietetic Practice and Research 71(3):146-149.
Barton, B. A., A. L. Eldridge, D. Thompson, S. G. Affenito, R. H. Striegel-Moore, D. L. Franko, A. M. Albertson, and S. J. Crockett. 2005. The relationship of breakfast and cereal consumption to nutrient intake and body mass index: The National Heart, Lung, and Blood Institute Growth and Health Study. Journal of the American Dietetic Association 105(9):1383-1389.
Bell, E. A., V. H. Castellanos, C. L. Pelkman, M. L. Thorwart, and B. J. Rolls. 1998. Energy density of foods affects energy intake in normal-weight women. American Journal of Clinical Nutrition 67(3):412-420.
Bell, E. A., L. S. Roe, and B. J. Rolls. 2003. Sensory-specific satiety is affected more by volume than by energy content of a liquid food. Physiology & Behavior 78(4-5):593-600.
Berg, C., G. Lappas, A. Wolk, E. Strandhagen, K. Toren, A. Rosengren, D. Thelle, and L. Lissner. 2009. Eating patterns and portion size associated with obesity in a Swedish population. Appetite 52(1):21-26.
Bes-Rastrollo, M., R. M. van Dam, M. A. Martinez-Gonzalez, T. Y. Li, L. L. Sampson, and F. B. Hu. 2008. Prospective study of dietary energy density and weight gain in women. American Journal of Clinical Nutrition 88(3):769-777.
Biing-Hwan, L., and R. Mentzer Morrison. 2002. Higher fruit consumption linked with lower body mass index. FoodReview 25(3):28-32.
Blackburn, G. L., B. S. Kanders, P. T. Lavin, S. D. Keller, and J. Whatley. 1997. The effect of aspartame as part of a multidisciplinary weight-control program on short- and long-term control of body weight. American Journal of Clinical Nutrition 65(2):409-418.
Blatt, A. D., L. S. Roe, and B. J. Rolls. 2011. Hidden vegetables: An effective strategy to reduce energy intake and increase vegetable intake in adults. American Journal of Clinical Nutrition 93(4):756-763.
Bowen, J., M. Noakes, C. Trenerry, and P. M. Clifton. 2006. Energy intake, ghrelin, and cholecystokinin after different carbohydrate and protein preloads in overweight men. Journal of Clinical Endocrinology and Metabolism 91(4):1477-1483.
Bruton, Y., E. L. Hanna, K. I. DiSantis, L. L. Birch, E. Serrano, and J. O. Fisher. 2010. In the eye of the beholder—Effects of eating implement and portion size on young children’s intake. Paper presented at Food and Nutrition program of the 138th APHA Annual Meeting, Denver, CO.
Bua, J., L. W. Olsen, and T. I. Sorensen. 2007. Secular trends in childhood obesity in Denmark during 50 years in relation to economic growth. Obesity (Silver Spring) 15(4):977-985.
Burger, K. S., M. Kern, and K. J. Coleman. 2007. Characteristics of self-selected portion size in young adults. Journal of the American Dietetic Association 107(4):611-618.
Burger, K. S., J. O. Fisher, and S. L. Johnson. 2011. Mechanisms behind the portion size effect: Visibility and bite size. Obesity (Silver Spring) 19(3):546-551.
Burke, M. A., F. W. Heiland, and C. M. Nadler. 2010. From “overweight” to “about right”: Evidence of a generational shift in body weight norms. Obesity (Silver Spring) 18(6):1226-1234.
Byrd-Bredbenner, C., and J. Schwartz. 2004. The effect of practical portion size measurement aids on the accuracy of portion size estimates made by young adults. Journal of Human Nutrition and Dietetics 17(4):351-357.
Cleveland, L. E., A. J. Moshfegh, A. M. Albertson, and J. D. Goldman. 2000. Dietary intake of whole grains. Journal of the American College of Nutrition 19(3 Suppl):331S-338S.
Condrasky, M., J. H. Ledikwe, J. E. Flood, and B. J. Rolls. 2007. Chefs’ opinions of restaurant portion sizes. Obesity (Silver Spring) 15(8):2086-2094.
Cope, M. B., and D. B. Allison. 2010. White hat bias: Examples of its presence in obesity research and a call for renewed commitment to faithfulness in research reporting. International Journal of Obesity 34(1):84-88.
Corvalan, C., R. Uauy, R. Flores, D. Kleinbaum, and R. Martorell. 2008. Reductions in the energy content of meals served in the Chilean National Nursery School Council Program did not consistently decrease obesity among beneficiaries. Journal of Nutrition 138(11):2237-2243.
Costa, D., and R. H. Steckel. 1997. Long-term trends in health, welfare, and economic growth in the United States. In The National Bureau of Economic Research: Health and welfare during industrialization, edited by R. H. Steckel and R. Floud. Chicago, IL: University of Chicago Press. p. 466. de la Hunty, A., S. Gibson, and M. Ashwell. 2006. A review of the effectiveness of aspartame in helping with weight control. British Nutrition Foundation Nutrition Bulletin 31:115-128.
DGAC (Dietary Guidelines Advisory Committee). 2010. Report of the Dietary Guidelines Advisory Committee on the Dietary Guidelines for Americans. Washington, DC.
Diliberti, N., P. L. Bordi, M. T. Conklin, L. S. Roe, and B. J. Rolls. 2004. Increased portion size leads to increased energy intake in a restaurant meal. Obesity Research 12(3):562-568.
Ditschuneit, H. H., M. Flechtner-Mors, T. D. Johnson, and G. Adler. 1999. Metabolic and weight-loss effects of a long-term dietary intervention in obese patients. American Journal of Clinical Nutrition 69(2):198-204.
Dugdale, A. E., and P. R. Payne. 1987. A model of seasonal-changes in energy-balance. Ecology of Food and Nutrition 19(3):231-245.
Eisenstein, J., S. B. Roberts, G. Dallal, and E. Saltzman. 2002. High-protein weight-loss diets: Are they safe and do they work? A review of the experimental and epidemiologic data. Nutrition Reviews 60(7 Pt 1):189-200.
Ello-Martin, J. A., L. S. Roe, J. H. Ledikwe, A. M. Beach, and B. J. Rolls. 2007. Dietary energy density in the treatment of obesity: A year-long trial comparing 2 weight-loss diets. American Journal of Clinical Nutrition 85(6):1465-1477.
FAO-WHO (Food and Agriculture Organization-World Health Organization). 2004. Fruit and vegetables for health: Report of a joint FAO/WHO workshop. http://www.who.int/dietphysicalactivity/publications/fruit_vegetables_report.pdf (accessed April 5, 2011).
Finkelstein, E. A., J. G. Trogdon, J. W. Cohen, and W. Dietz. 2009. Annual medical spending attributable to obesity: Payer- and service-specific estimates. Health Affairs (Millwood) 28(5):w822-w831.
Fisher, J. O. 2007. Effects of age on children’s intake of large and self-selected food portions. Obesity (Silver Spring) 15(2):403-412.
Fisher, J. O., B. J. Rolls, and L. L. Birch. 2003. Children’s bite size and intake of an entree are greater with large portions than with age-appropriate or self-selected portions. American Journal of Clinical Nutrition 77(5):1164-1170.
Fisher, J. O., A. Arreola, L. L. Birch, and B. J. Rolls. 2007a. Portion size effects on daily energy intake in low-income Hispanic and African American children and their mothers. American Journal of Clinical Nutrition 86(6):1709-1716.
Fisher, J. O., G. Cai, S. J. Jaramillo, S. A. Cole, A. G. Comuzzie, and N. F. Butte. 2007b. Heritability of hyperphagic eating behavior and appetite-related hormones among Hispanic children. Obesity (Silver Spring) 15(6):1484-1495.
Fisher, J. O., Y. Liu, L. L. Birch, and B. J. Rolls. 2007c. Effects of portion size and energy density on young children’s intake at a meal. American Journal of Clinical Nutrition 86(1):174-179.
Flechtner-Mors, M., H. H. Ditschuneit, T. D. Johnson, M. A. Suchard, and G. Adler. 2000. Metabolic and weight loss effects of long-term dietary intervention in obese patients: Four-year results. Obesity Research 8(5):399-402.
Flegal, K. M., M. D. Carroll, R. J. Kuczmarski, and C. L. Johnson. 1998. Overweight and obesity in the United States: Prevalence and trends, 1960–1994. International Journal of Obesity and Related Metabolic Disorders 22(1):39-47.
Flegal, K. M., M. D. Carroll, C. L. Ogden, and L. R. Curtin. 2010. Prevalence and trends in obesity among U.S. adults, 1999–2008. Journal of the American Medical Association 303(3):235-241.
Flood, J. E., L. S. Roe, and B. J. Rolls. 2006. The effect of increased beverage portion size on energy intake at a meal. Journal of the American Dietetic Association 106(12):1984-1990.
Fogel, R. W. 1994. Economic-growth, population theory, and physiology—The bearing of long-term processes on the making of economic-policy. American Economic Review 84(3):369-395.
Gardner, C. D., A. Kiazand, S. Alhassan, S. Kim, R. S. Stafford, R. R. Balise, H. C. Kraemer, and A. C. King. 2007. Comparison of the Atkins, Zone, Ornish, and LEARN diets for change in weight and related risk factors among overweight premenopausal women: The A to Z Weight Loss Study: A randomized trial. Journal of the American Medical Association 297(9):969-977.
Gately, P. J., N. A. King, H. C. Greatwood, L. C. Humphrey, D. Radley, C. B. Cooke, and A. J. Hill. 2007. Does a high-protein diet improve weight loss in overweight and obese children? Obesity (Silver Spring) 15(6):1527-1534.
Geier, A. B., P. Rozin, and G. Doros. 2006. Unit bias. A new heuristic that helps explain the effect of portion size on food intake. Psychological Science 17(6):521-525.
General Mills. 2009. Benefits of cereal. Minneapolis, MN.
Good, C. K., N. Holsehuh, A. M. Albertson, and A. L. Eldridge. 2008. Whole grain consumption and body mass index in adult women: An analysis of NHANES 1999–2000 and the USDA pyramid servings database. Journal of the American College of Nutrition 27(1):80-87.
Hall, W. L., D. J. Millward, S. J. Long, and L. M. Morgan. 2003. Casein and whey exert different effects on plasma amino acid profiles, gastrointestinal hormone secretion and appetite. British Journal of Nutrition 89(2):239-248.
Hallfrisch, J., and K. M. Behall. 1997. Evaluation of foods and physiological responses to menus in which fat content was lowered by replacement with OATrim. Cereal Foods World 42(2):100-103.
Hallfrisch, J., D. J. Scholfield, and K. M. Behall. 1995. Diets containing soluble oat extracts improve glucose and insulin responses of moderately hypercholesterolemic men and women. American Journal of Clinical Nutrition 61(2):379-384.
Hannum, S. M., L. Carson, E. M. Evans, K. A. Canene, E. L. Petr, L. Bui, and J. W. Erdman, Jr. 2004. Use of portion-controlled entrees enhances weight loss in women. Obesity Research 12(3):538-546.
Hannum, S. M., L. A. Carson, E. M. Evans, E. L. Petr, C. M. Wharton, L. Bui, and J. W. Erdman, Jr. 2006. Use of packaged entrees as part of a weight-loss diet in overweight men: An 8-week randomized clinical trial. Diabetes, Obesity, & Metabolism 8(2):146-155.
Harnack, L., S. A. H. Walters, and D. R. Jacobs. 2003. Dietary intake and food sources of whole grains among U.S. children and adolescents: Data from the 1994-1996 Continuing Survey of Food Intakes by Individuals. Journal of the American Dietetic Association 103(8):1015-1019.
Heymsfield, S. B., C. A. van Mierlo, H. C. van der Knaap, M. Heo, and H. I. Frier. 2003. Weight management using a meal replacement strategy: Meta and pooling analysis from six studies. International Journal of Obesity and Related Metabolic Disorders 27(5):537-549.
Hiza, H. A. B., and L. Bente. 2007. Nutrient content of the U.S. food supply, 1909-2004. A summary report. Home Economics Research Report 57. http://www.cnpp.usda.gov/publications/foodsupply/foodsupply1909-2004report.pdf (accessed April 5, 2011).
Houchins, J. A., J. R. Burgess, W. W. Campbell, J. R. Daniel, M. G. Ferruzzi, G. P. McGabe, and R. D. Mattes. 2011. Beverage vs. soild fruits and vegetables: Effects on energy intake and body weight. Obesity (Silver Spring). Published electronically June 30, 2011. doi: 10.1038/oby.2011.192.
Howarth, N. C., E. Saltzman, and S. B. Roberts. 2001. Dietary fiber and weight regulation. Nutrition Reviews 59(5):129-139.
Jae, H., and D. Delvecchio. 2004. Decision making by low-literacy consumers in the presence of point-of-purchase information. Journal of Consumer Affairs 38(2):342-354.
James, J., P. Thomas, D. Cavan, and D. Kerr. 2004. Preventing childhood obesity by reducing consumption of carbonated drinks: Cluster randomised controlled trial. British Medical Journal 328(7450):1237.
Jeffery, R. W., R. R. Wing, C. Thorson, L. R. Burton, C. Raether, J. Harvey, and M. Mullen. 1993. Strengthening behavioral interventions for weight loss: A randomized trial of food provision and monetary incentives. Journal of Consulting and Clinical Psychology 61(6):1038-1045.
Jenkins, D. J., C. W. Kendall, L. S. Augustin, S. Franceschi, M. Hamidi, A. Marchie, A. L. Jenkins, and M. Axelsen. 2002. Glycemic index: Overview of implications in health and disease. American Journal of Clinical Nutrition 76(1):266S-273S.
John, L. K., G. Loewenstein, A. B. Troxel, L. Norton, J. E. Fassbender, and K. G. Volpp. 2011. Financial incentives for extended weight loss: A randomized, controlled trial. Journal of General Internal Medicine 26(6):621-626.
Johnson, L., A. P. Mander, L. R. Jones, P. M. Emmett, and S. A. Jebb. 2008a. Energy-dense, low-fiber, high-fat dietary pattern is associated with increased fatness in childhood. American Journal of Clinical Nutrition 87(4):846-854.
Johnson, L., A. P. Mander, L. R. Jones, P. M. Emmett, and S. A. Jebb. 2008b. A prospective analysis of dietary energy density at age 5 and 7 years and fatness at 9 years among UK children. International Journal of Obesity 32(4):586-593.
Johnson, S. L. 2000. Improving preschoolers’ self-regulation of energy intake. Pediatrics 106(6):1429-1435.
Judd, J. T., B. A. Clevidence, R. A. Muesing, J. Wittes, M. E. Sunkin, and J. J. Podczasy. 1994. Dietary trans fatty acids: Effects on plasma lipids and lipoproteins of healthy men and women. American Journal of Clinical Nutrition 59(4):861-868.
Kant, A. K., and B. I. Graubard. 2004. Eating out in America, 1987–2000: Trends and nutritional correlates. Preventive Medicine 38(2):243-249.
Kant, A. K., M. B. Andon, T. J. Angelopoulos, and J. M. Rippe. 2008. Association of breakfast energy density with diet quality and body mass index in American adults: National Health and Nutrition Examination Surveys, 1999–2004. American Journal of Clinical Nutrition 88(5):1396-1404.
Kessler, D. A., J. R. Mande, F. E. Scarbrough, R. Schapiro, and K. Feiden. 2003. Developing the “nutrition facts” food label. Harvard Health Policy Review 4(2):13-24.
Koh-Banerjee, P., M. V. Franz, L. Sampson, S. M. Liu, D. R. Jacobs, D. Spiegelman, W. Willett, and E. Rimm. 2004. Changes in whole-grain, bran, and cereal fiber consumption in relation to 8-y weight gain among men. American Journal of Clinical Nutrition 80(5):1237-1245.
Kral, T. V., A. C. Kabay, L. S. Roe, and B. J. Rolls. 2010. Effects of doubling the portion size of fruit and vegetable side dishes on children’s intake at a meal. Obesity (Silver Spring) 18(3):521-527.
LaGrotte, C. A., and G. D. Foster. Forthcoming. Behavioral treatments for obesity. In Handbook of food and addiction, edited by K. D. Brownell and M. S. Gold. New York: Oxford University Press.
Lang, V., F. Bellisle, J. M. Oppert, C. Craplet, F. R. Bornet, G. Slama, and B. Guy-Grand. 1998. Satiating effect of proteins in healthy subjects: A comparison of egg albumin, casein, gelatin, soy protein, pea protein, and wheat gluten. American Journal of Clinical Nutrition 67(6):1197-1204.
Leahy, K. E., L. L. Birch, and B. J. Rolls. 2008. Reducing the energy density of multiple meals decreases the energy intake of preschool-age children. American Journal of Clinical Nutrition 88(6):1459-1468.
Ledikwe, J. H., H. M. Blanck, L. K. Khan, M. K. Serdula, J. D. Seymour, B. C. Tohill, and B. J. Rolls. 2006. Low-energy-density diets are associated with high diet quality in adults in the United States. Journal of the American Dietetic Association 106(8):1172-1180.
Ledoux, T. A., M. D. Hingle, and T. Baranowski. 2011. Relationship of fruit and vegetable intake with adiposity: A systematic review. Obesity Reviews 12:e143-e150.
Li, X., M. B. Cope, M. S. Johnson, D. L. Smith, Jr., and T. R. Nagy. 2010. Mild calorie restriction induces fat accumulation in female C57BL/6J mice. Obesity (Silver Spring) 18(3):456-462.
Liu, S. M., W. C. Willett, J. E. Manson, F. B. Hu, B. Rosner, and G. Colditz. 2003. Relation between changes in intakes of dietary fiber and grain products and changes in weight and development of obesity among middle-aged women. American Journal of Clinical Nutrition 78(5):920-927.
Lowe, M. R. 2003. Self-regulation of energy intake in the prevention and treatment of obesity: Is it feasible? Obesity Research 11(Suppl):44S-59S.
Lupton, J. R., D. A. Balentine, R. M. Black, R. Hildwine, B. J. Ivens, E. T. Kennedy, P. T. Packard, B. R. Sperber, D. Steffen, and M. Story. 2010. The Smart Choices front-of-package nutrition labeling program: Rationale and development of the nutrition criteria. American Journal of Clinical Nutrition 91(4):1078S-1089S.
Mathias, K. C., B. J. Rolls, L. L. Birch, T. V. E. Kral, and J. O. Fisher. 2009. Does serving children larger portions of fruit affect vegetable intake? Obesity 17:S90-S90.
Mattes, R. D., J. M. Shikany, K. A. Kaiser, and D. B. Allison. 2011. Nutritively sweetened beverage consumption and body weight: A systematic review and meta-analysis of randomized experiments. Obesity Reviews 12(5):346-365.
McCaffrey, T. A., K. L. Rennie, M. A. Kerr, J. M. Wallace, M. P. Hannon-Fletcher, W. A. Coward, S. A. Jebb, and M. B. E. Livingstone. 2008. Energy density of the diet and change in body fatness from childhood to adolescence: Is there a relation? American Journal of Clinical Nutrition 87(5):1230-1237.
McCarron, D. A., S. Oparil, A. Chait, R. B. Haynes, P. Kris-Etherton, J. S. Stern, L. M. Resnick, S. Clark, C. D. Morris, D. C. Hatton, J. A. Metz, M. McMahon, S. Holcomb, G. W. Snyder, and F. X. Pi-Sunyer. 1997. Nutritional management of cardiovascular risk factors. A randomized clinical trial. Archives of Internal Medicine 157(2):169-177.
McConahy, K. L., H. Smiciklas-Wright, L. L. Birch, D. C. Mitchell, and M. F. Picciano. 2002. Food portions are positively related to energy intake and body weight in early childhood. Journal of Pediatrics 140(3):340-347.
McKiernan, F., J. H. Hollis, and R. D. Mattes. 2008. Short-term dietary compensation in free-living adults. Physiology & Behavior 93(4-5):975-983.
Mendoza, J. A., A. Drewnowski, and D. A. Christakis. 2007. Dietary energy density is associated with obesity and the metabolic syndrome in U.S. adults. Diabetes Care 30(4):974-979.
Metz, J. A., J. S. Stern, P. Kris-Etherton, M. E. Reusser, C. D. Morris, D. C. Hatton, S. Oparil, R. B. Haynes, L. M. Resnick, F. X. Pi-Sunyer, S. Clark, L. Chester, M. McMahon, G. W. Snyder, and D. A. McCarron. 2000. A randomized trial of improved weight loss with a prepared meal plan in overweight and obese patients: Impact on cardiovascular risk reduction. Archives of Internal Medicine 160(14):2150-2158.
Morales, L. 2010. In U.S., consumption of fruits and vegetables trails access. Gallup, September 22.
Mourao, D. M., J. Bressan, W. W. Campbell, and R. D. Mattes. 2007. Effects of food form on appetite and energy intake in lean and obese young adults. International Journal of Obesity (London) 31(11):1688-1695.
Must, A., and S. E. Anderson. 2003. Effects of obesity on morbidity in children and adolescents. Nutrition in Clinical Care 6(1):4-12.
NHLBI (National Heart, Lung, and Blood Institute). 2000. The practical guide: identification, evaluation, and treatment of overweight and obesity in adults. NIH Publication No. 00-4084. http://www.nhlbi.nih.gov/guidelines/obesity/prctgd_c.pdf (accessed June 14, 2011).
National Restaurant Association. 2010. 2010 Restaurant industry pocket factbook. http://www.restaurant.org/pdfs/research/2010Forecast_PFB.pdf (accessed April 5, 2011).
Nielsen, S. J., and B. M. Popkin. 2003. Patterns and trends in food portion sizes, 1977–1998. Journal of the American Medical Association 289(4):450-453.
Ogden, C., and M. Carroll. 2010. Prevalence of obesity among children and adolescents: United States, trends 1963–1965 through 2007–2008. NHANES (National Health and Nutrition Examination Survey). http://www.cdc.gov/nchs/data/hestat/obesity_child_07_08/obesity_child_07_08.pdf (accessed April 5, 2011).
Ogden, C. L., M. D. Carroll, L. R. Curtin, M. A. McDowell, C. J. Tabak, and K. M. Flegal. 2006. Prevalence of overweight and obesity in the United States, 1999–2004. Journal of the American Medical Association 295(13):1549-1555.
Ollberding, N. J., R. L. Wolf, and I. Contento. 2010. Food label use and its relation to dietary intake among U.S. adults. Journal of the American Dietetic Association 110(8):1233-1237.
Patterson, C. M., A. A. Dunn-Meynell, and B. E. Levin. 2008. Three weeks of early-onset exercise prolongs obesity resistance in DIO rats after exercise cessation. American Journal of Physiology-Regulatory, Integrative, and Comparative Physiology 294(2):R290-R301.
Phelan, S., W. Lang, D. Jordan, and R. R. Wing. 2009. Use of artificial sweeteners and fat-modified foods in weight loss maintainers and always-normal weight individuals. International Journal of Obesity 33(10):1183-1190.
Piernas, C., and B. M. Popkin. 2010a. Snacking increased among U.S. adults between 1977 and 2006. Journal of Nutrition 140(2):325-332.
Piernas, C., and B. M. Popkin. 2010b. Trends in snacking among U.S. children. Health Affairs (Millwood) 29(3):398-404.
Pletcher, S. D. 2009. The modulation of lifespan by perceptual systems. Annals of the New York Academy of Sciences 1170:693-697.
Popkin, B. M., and K. J. Duffey. 2010. Does hunger and satiety drive eating anymore? Increasing eating occasions and decreasing time between eating occasions in the United States. American Journal of Clinical Nutrition 91(5):1342-1347.
Prentice, A., and S. Jebb. 2004. Energy intake/physical activity interactions in the homeostasis of body weight regulation. Nutrition Reviews 62(7 Pt 2):S98-S104.
Racette, S. B., D. A. Schoeller, R. F. Kushner, and K. M. Neil. 1995. Exercise enhances dietary compliance during moderate energy restriction in obese women. American Journal of Clinical Nutrition 62(2):345-349.
Raynor, H. A., and R. R. Wing. 2007. Package unit size and amount of food: Do both influence intake? Obesity (Silver Spring) 15(9):2311-2319.
Raynor, H. A., E. L. Van Walleghen, H. Niemeier, M. L. Butryn, and R. R. Wing. 2009. Do food provisions packaged in single-servings reduce energy intake at breakfast during a brief behavioral weight-loss intervention? Journal of the American Dietetic Association 109(11):1922-1925.
Rolls, B. J., E. A. Bell, and M. L. Thorwart. 1999. Water incorporated into a food but not served with a food decreases energy intake in lean women. American Journal of Clinical Nutrition 70(4):448-455.
Rolls, B. J., D. Engell, and L. L. Birch. 2000. Serving portion size influences 5-year-old but not 3-year-old children’s food intakes. Journal of the American Dietetic Association 100(2):232-234.
Rolls, B. J., E. L. Morris, and L. S. Roe. 2002. Portion size of food affects energy intake in normal-weight and overweight men and women. American Journal of Clinical Nutrition 76(6):1207-1213.
Rolls, B. J., L. S. Roe, T. V. Kral, J. S. Meengs, and D. E. Wall. 2004a. Increasing the portion size of a packaged snack increases energy intake in men and women. Appetite 42(1):63-69.
Rolls, B. J., L. S. Roe, and J. S. Meengs. 2004b. Salad and satiety: Energy density and portion size of a first-course salad affect energy intake at lunch. Journal of the American Dietetic Association 104(10):1570-1576.
Rolls, B. J., L. S. Roe, J. S. Meengs, and D. E. Wall. 2004c. Increasing the portion size of a sandwich increases energy intake. Journal of the American Dietetic Association 104(3):367-372.
Rolls, B. J., L. S. Roe, A. M. Beach, and P. V. M. Kris-Etherton. 2005. Provision of foods differing in energy density affects long-term weight loss. Obesity Research 13(6):1052-1060.
Rolls, B. J., L. S. Roe, and J. S. Meengs. 2006a. Larger portion sizes lead to a sustained increase in energy intake over 2 days. Journal of the American Dietetic Association 106(4):543-549.
Rolls, B. J., L. S. Roe, and J. S. Meengs. 2006b. Reductions in portion size and energy density of foods are additive and lead to sustained decreases in energy intake.American Journal of Clinical Nutrition 83(1):11-17.
Rolls, B. J., L. S. Roe, and J. S. Meengs. 2007. The effect of large portion sizes on energy intake is sustained for 11 days. Obesity (Silver Spring) 15(6):1535-1543.
Rolls, B. J., L. S. Roe, and J. S. Meengs. 2010. Portion size can be used strategically to increase vegetable consumption in adults. American Journal of Clinical Nutrition 91(4):913-922.
Rothman, R. L., R. Housam, H. Weiss, D. Davis, R. Gregory, T. Gebretsadik, A. Shintani, and T. A. Elasy. 2006. Patient understanding of food labels: The role of literacy and numeracy. American Journal of Preventive Medicine 31(5):391-398.
Rumpler, W. V., M. Kramer, D. G. Rhodes, and D. R. Paul. 2006. The impact of the covert manipulation of macronutrient intake on energy intake and the variability in daily food intake in nonobese men. International Journal of Obesity (London) 30(5):774-781.
Scholfield, D. J., K. M. Behall, E. C. Armero, W. M. Clark, and J. W. Hallfrisch. 1993. Long-term consumption of soluble beta glucan by hyperlipidemic subjects—Evaluation of blood-pressure, pulse, body-weight, urea nitrogen and creatinine. Federation of American Societies for Experimental Biology Journal 7(4):A738-A738.
Sharpe, K. M., R. Staelin, and J. Huber. 2008. Using extremeness aversion to fight obesity: Policy implications of context dependent demand. Journal of Consumer Research 35(3):406-422.
Steenhuis, I. H., and W. M. Vermeer. 2009. Portion size: Review and framework for interventions. International Journal of Behavioral Nutrition and Physical Activity 6:58.
Storey, M. 2010. The shifting beverage landscape. Physiology & Behavior 100(1):10-14.
Stroebele, N., L. G. Ogden, and J. O. Hill. 2009. Do calorie-controlled portion sizes of snacks reduce energy intake? Appetite 52(3):793-796.
Svendsen, M., R. Blomhoff, I. Holme, and S. Tonstad. 2007. The effect of an increased intake of vegetables and fruit on weight loss, blood pressure and antioxidant defense in subjects with sleep related breathing disorders. European Journal of Clinical Nutrition 61(11):1301-1311.
Tiwary, C. M., J. A. Ward, and B. A. Jackson. 1997. Effect of pectin on satiety in healthy U.S. Army adults. Journal of the American College of Nutrition 16(5):423-428.
Vartanian, L. R., M. B. Schwartz, and K. D. Brownell. 2007. Effects of soft drink consumption on nutrition and health: A systematic review and meta-analysis. American Journal of Public Health 97(4):667-675.
Veerman, J. L., J. J. Barendregt, E. F. van Beeck, J. C. Seidell, and J. P. Mackenbach. 2007. Stemming the obesity epidemic: A tantalizing prospect. Obesity (Silver Spring) 15(9):2365-2370.
Vermeer, W. M., I. H. Steenhuis, and J. C. Seidell. 2009. From the point-of-purchase perspective: A qualitative study of the feasibility of interventions aimed at portion-size. Health Policy 90(1):73-80.
Vermeer, W. M., B. Bruins, and I. H. Steenhuis. 2010a. Two pack king size chocolate bars. Can we manage our consumption? Appetite 54(2):414-417.
Vermeer, W. M., I. H. Steenhuis, and J. C. Seidell. 2010b. Portion size: A qualitative study of consumers’ attitudes toward point-of-purchase interventions aimed at portion size. Health Education Research 25(1):109-120.
Volpp, K. G., L. K. John, A. B. Troxel, L. Norton, J. Fassbender, and G. Loewenstein. 2008. Financial incentive-based approaches for weight loss: A randomized trial. Journal of the American Medical Association 300(22):2631-2637.
Wansink, B. 2004. Environmental factors that increase the food intake and consumption volume of unknowing consumers. Annual Reviews in Nutrition 24:455-479.
Wansink, B., and J. Kim. 2005. Bad popcorn in big buckets: Portion size can influence intake as much as taste. Journal of Nutrition Education and Behavior 37(5):242-245.
Wansink, B., and S. B. Park. 2002. Sensory suggestiveness and labeling: Do soy labels bias taste? Journal of Sensory Studies 17(5):483-491.
Wansink, B., and J. Sobal. 2007. Mindless eating—The 200 daily food decisions we overlook. Environment and Behavior 39(1):106-123.
Wansink, B., K. van Ittersum, and J. E. Painter. 2004. How diet and health labels influence taste and satiation. Journal of Food Science 69(9):S340-S346.
Wansink, B., K. van Ittersum, and J. E. Painter. 2006. Ice cream illusions bowls, spoons, and self-served portion sizes. American Journal of Preventive Medicine 31(3):240-243.
Wansink, B., C. Payne, and C. Werle. 2008. Consequences of belonging to the “clean plate club.” Archives of Pediatrics and Adolescent Medicine 162(10):994-995.
Wearing, S. C., E. M. Hennig, N. M. Byrne, J. R. Steele, and A. P. Hills. 2006. The impact of childhood obesity on musculoskeletal form. Obesity Reviews 7(2):209-218.
Whybrow, S., C. L. Harrison, C. Mayer, and R. James Stubbs. 2006. Effects of added fruits and vegetables on dietary intakes and body weight in Scottish adults. British Journal of Nutrition 95(3):496-503.
Willis, H. J., W. Thomas, A. L. Eldridge, L. Harkness, H. Green, and J. L. Slavin. 2010. Increasing doses of fiber do not influence short-term satiety or food intake and are inconsistently linked to gut hormone levels. Food & Nutrition Research 54. doi: 10.3402/ fnr.v54i0.5135.
Yanovski, J. A., S. Z. Yanovski, K. N. Sovik, T. T. Nguyen, P. M. O’Neil, and N. G. Sebring. 2000. A prospective study of holiday weight gain. New England Journal of Medicine 342(12):861-867.
Young, L. R., and M. Nestle. 2002. The contribution of expanding portion sizes to the U.S. obesity epidemic. American Journal of Public Health 92(2):246-249.
Young, L. R., and M. Nestle. 2007. Portion sizes and obesity: Responses of fast-food companies. Journal of Public Health Policy 28(2):238-248.
Zheng, H., N. R. Lenard, A. C. Shin, and H. R. Berthoud. 2009. Appetite control and energy balance regulation in the modern world: Reward-driven brain overrides repletion signals. International Journal of Obesity (London) 33(Suppl 2):S8-S13.


