
Appendix E
Mainline Airlines Departures by City
This appendix presents the committee’s analysis of changes in the number of aircraft departures discussed in Chapter 2 for mainline airlines. Figures E-1 through E-24, ordered alphabetically by airline, show total departures by airport code (refer to Table E-1 for corresponding cities) and by airline, in the cities most frequently served by that airline and thus in the cities most likely to serve as domiciles for pilots. The data used for this analysis were scheduled aircraft departures taken from Air Carrier Summary: T3: U.S. Air Carrier Airport Activity Statistics provided by the Bureau of Transportation Statistics (n.d.-a) of the U.S. Department of Transportation. The data were from the third quarter of 2000, 2005, and 2010. All carriers that reported more than 20,000 aircraft departures in the third quarter of 2010 were examined. This group consisted of 12 mainline airlines. Two of the airlines were all-cargo airlines, FedEx and UPS, and the rest were passenger airlines.
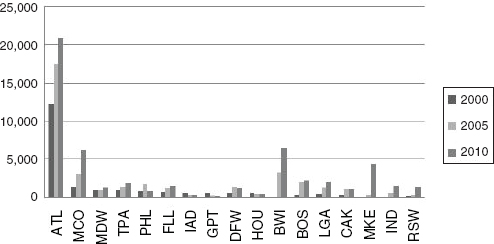
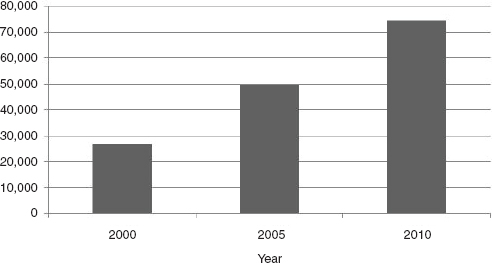
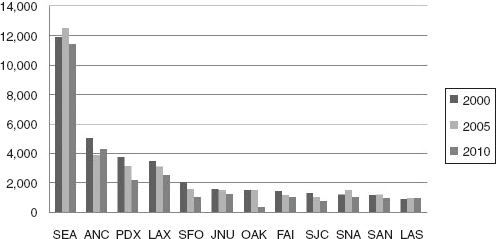
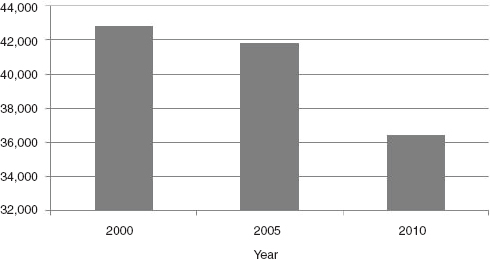
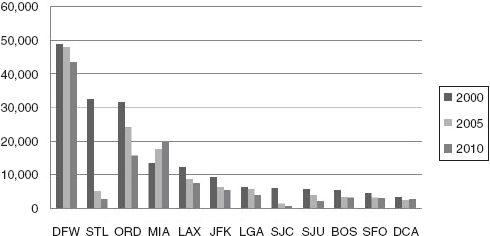
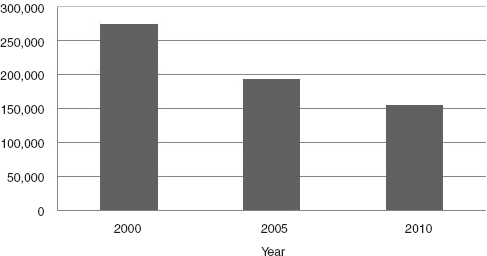
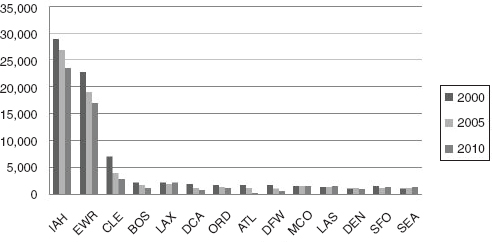
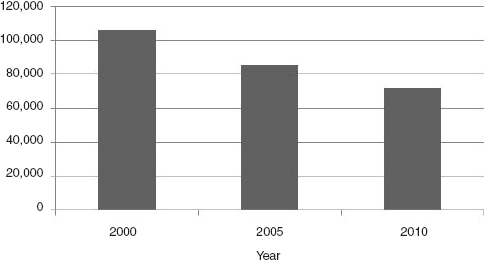
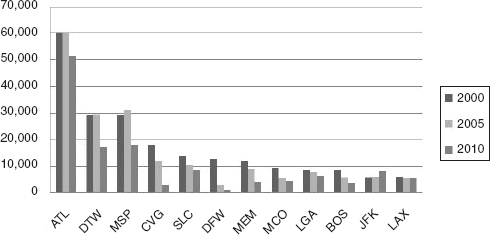
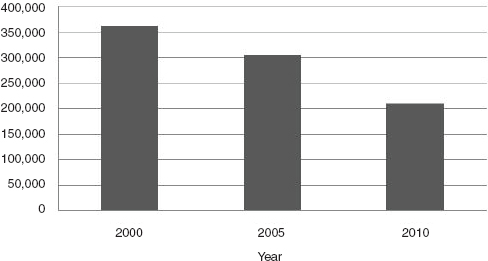
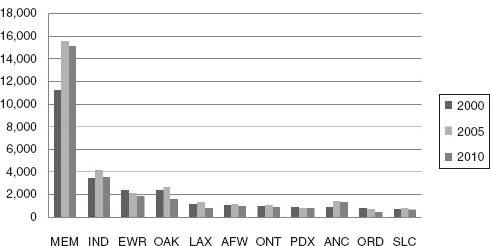
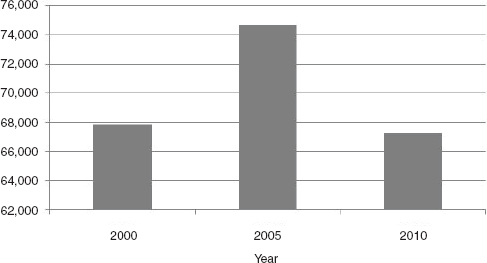
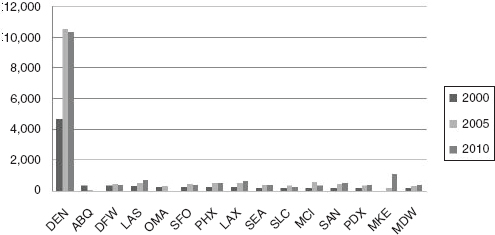
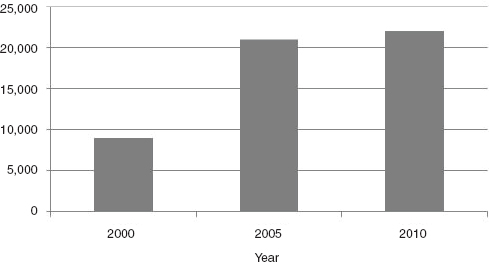
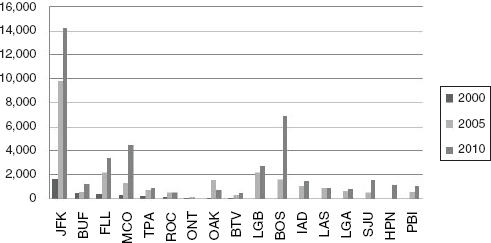
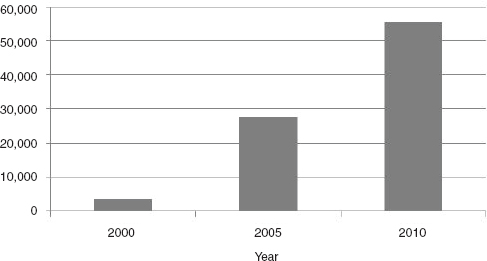
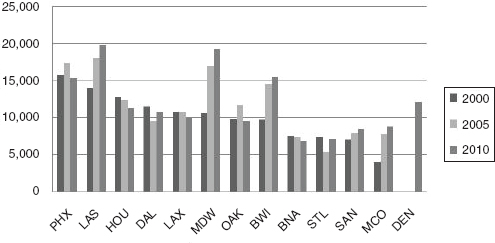
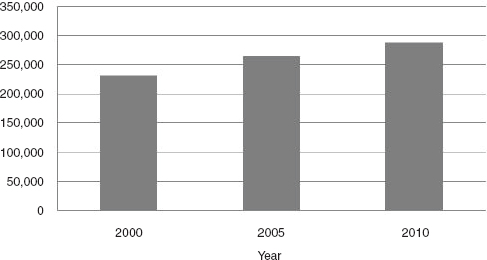
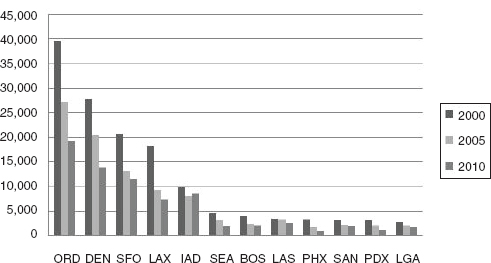
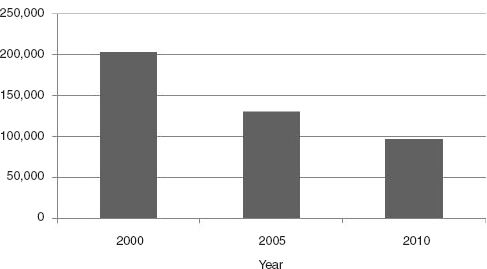
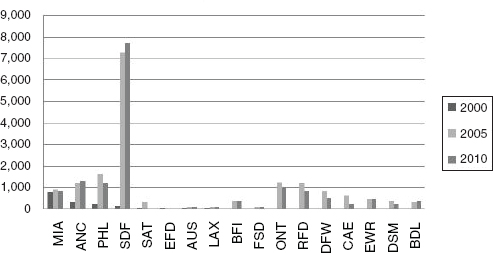
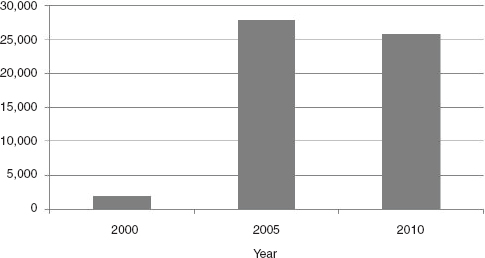
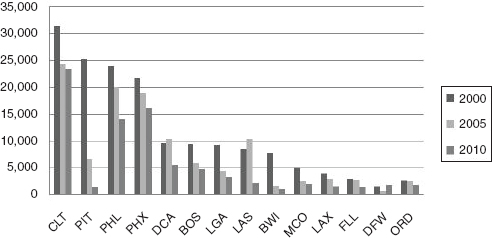
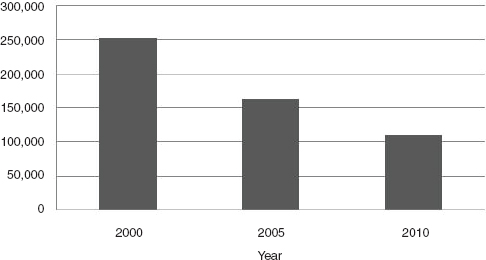
TABLE E-1 Airport Codes for Airline Departure Analysis
| Codes | Airport | City | State |
| ABE | Lehigh Valley International | Allentown | PA |
| ABQ | Albuquerque International | Albuquerque | NM |
| ABR | Municipal | Aberdeen | SD |
| ACK | Nantucket Memorial | Nantucket | MA |
| AFW | Fort Worth Alliance | Fort Worth | TX |
| ALS | Municipal | Alamosa | CO |
| ANC | Ted Stevens Anchorage International | Anchorage | AK |
| ASE | Aspen | Aspen | CO |
| ATL | Hartsfield-Jackson Atlanta International | Atlanta | GA |
| ATW | Outagamie County | Appleton | WI |
| AUS | Austin-Bergstrom International | Austin | TX |
| AVL | Asheville Regional | Fletcher | NC |
| AZO | Kalamazoo/Battle Creek International | Kalamazoo | MI |
| BDL | Bradley International | Windsor Locks | CT |
| BFI | Boeing Field/King County International | Seattle | WA |
| BHM | Birmingham | Birmingham | AL |
| BIL | Billings | Billings | MT |
| BJI | Bemidji | Bemidji | MN |
| BNA | Nashville International | Nashville | TN |
| BOI | Boise Air Terminal/Gowen Field | Boise | ID |
| BOS | Logan International | Boston | MA |
| BRD | Brainerd Lakes Regional | Brainerd | MN |
| BTR | Ryan | Baton Rouge | LA |
| BTV | Burlington International | Burlington | VT |
| BUF | Buffalo Niagara International | Buffalo | NY |
| BWI | Baltimore/Washington International Thurgood Marshall | Baltimore | MD |
| CAE | Metropolitan | Columbia | SC |
| CAK | Akron/Canton Regional | Akron/Canton | OH |
| CHA | Lovell Field | Chattanooga | TN |
| CHO | Albemarle | Charlottesville | VA |
| CHS | Charleston International | Charleston | SC |
| CLE | Hopkins International | Cleveland | OH |
| CLT | Charlotte Douglas | Charlotte | NC |
| CMH | Port Columbus International | Columbus | OH |
| COS | Colorado Springs | Colorado Springs | CO |
| CRP | Corpus Christi International | Corpus Christi | TX |
| CRW | Yeager | Charleston | WV |
| Codes | Airport | City | State |
| CVG | Cincinnati/Northern Kentucky | Covington | KY |
| CWA | Central Wisconsin | Wausau | WI |
| DAL | Love Field | Dallas | TX |
| DAY | James Cox Dayton International | Dayton | OH |
| DCA | Ronald Reagan Washington National | Washington | DC |
| DDC | Dodge City Municipal | Dodge City | KS |
| DEN | Denver International | Denver | CO |
| DFW | Dallas/Fort Worth International | Dallas | TX |
| DIK | Dickinson | Dickinson | ND |
| DSM | Des Moines International | Des Moines | IA |
| DTW | Detroit Metropolitan Wayne County | Detroit | MI |
| EFD | Ellington Field | Houston | TX |
| EUG | Eugene | Eugene | OR |
| EWB | New Bedford | New Bedford | CT |
| EWR | Newark Liberty International | Newark | NJ |
| FAI | Fairbanks International | Fairbanks | AK |
| FAT | Fresno Air Terminal | Fresno | CA |
| FLL | Fort Lauderdale/Hollywood International Fort Lauderdale | FL | |
| FMN | Municipal | Farmington | NM |
| FSD | Joe Foss Field | Sioux Falls | SD |
| GCC | Campbell County | Gillette | WY |
| GEG | Spokane International | Spokane | WA |
| GJT | Walker Field | Grand Junction | CO |
| GNV | Gainesville Regional | Gainesville | FL |
| GPT | Gulfport-Biloxi International | Gulfport | MS |
| GRR | Gerald R. Ford International | Grand Rapids | MI |
| GSO | Piedmont Triad International | Greensboro | NC |
| GSP | Greenville-Spartanburg International | Greenville-Spartanburg | SC |
| GTR | Golden Triangle Regional | Columbus | OH |
| HHH | Hilton Head | Hilton Head | SC |
| HOU | William P. Hobby | Houston | TX |
| HPN | Westchester County | White Plains | NY |
| HSV | Huntsville International-Carl T. Jones Field | Huntsville | AL |
| HYA | Barnstable | Hyannis | MA |
| IAD | Washington Dulles International | Washington | DC |
| IAH | George Bush Intercontinental | Houston | TX |
| Codes | Airport | City | State |
| IND | Indianapolis International | Indianapolis | IN |
| ITH | Tompkins County | Ithaca | NY |
| JAX | Jacksonville | Jacksonville | FL |
| JFK | John F Kennedy International | New York | NY |
| JNU | Boundary Bay | Juneau | AK |
| LAR | General Brees Field | Laramie | WY |
| LAS | McCarran International | Las Vegas | NV |
| LAX | Los Angeles International | Los Angeles | CA |
| LBL | Municipal | Liberal | KS |
| LGA | LaGuardia | New York | NY |
| LGB | Long Beach Municipal | Long Beach | CA |
| LIH | Lihue | Kauai Island | HI |
| LNK | Lincoln | Lincoln | NE |
| LWS | Nez Perce County Regional | Lewiston | ID |
| MBS | MBS International | Saginaw | MI |
| MCI | Kansas City International | Kansas City | KS |
| MCO | Orlando International | Orlando | FL |
| MDT | Harrisburg International | Harrisburg | PA |
| MDW | Midway | Chicago | IL |
| MEM | Memphis International | Memphis | TN |
| MFR | Rogue Valley International-Medford | Medford | OR |
| MGM | Dannelly Field | Montgomery | AL |
| MHT | Manchester-Boston Regional | Manchester | NH |
| MIA | Miami International | Miami | FL |
| MKE | General Mitchell International | Milwaukee | WI |
| MLI | Quad-City | Moline | IL |
| MSN | Dane County Regional | Madison | WI |
| MSP | Minneapolis-St. Paul International | Minneapolis | MN |
| MVY | Martha’s Vineyard | Vineyard Haven | MA |
| MYR | Myrtle Beach International | Myrtle Beach | SC |
| OAK | Oakland International | Oakland | CA |
| OGG | Kahului | Maui | HI |
| OKC | Will Rogers World | Oklahoma City | OK |
| OMA | Eppley Airfield | Omaha | NE |
| ONT | Ontario International | Ontario | CA |
| ORD | Chicago O’Hare International | Chicago | IL |
| Codes | Airport | City | State |
| ORF | Norfolk International | Norfolk | VA |
| PBI | Palm Beach International | West Palm Beach | FL |
| PDX | Portland International | Portland | OR |
| PFN | Bay County | Panama City | FL |
| PHL | Philadelphia International | Philadelphia | PA |
| PHX | Sky Harbor International | Phoenix | AZ |
| PIT | Pittsburgh International | Pittsburgh | PA |
| PLN | Emmet County | Pellston | MI |
| PRC | Prescott | Prescott | AZ |
| PSC | Tri-Cities | Pasco | WA |
| PVC | Provincetown | Provincetown | MA |
| PVD | T.F. Green | Providence | RI |
| PWM | International Jetport | Portland | ME |
| RAP | Regional | Rapid City | SD |
| RDM | Roberts Field | Redmond | OR |
| RDU | Raleigh-Durham International | Raleigh-Durham | NC |
| RFD | Greater Rockford | Rockford | IL |
| RIC | Richmond International | Richmond | VA |
| RKD | Knox County Regional | Rockland | ME |
| RKS | Sweetwater County | Rock Springs | WY |
| RNO | Reno-Tahoe International | Reno | NV |
| ROA | Roanoke Regional | Roanoke | VA |
| ROC | Greater Rochester International | Rochester | NY |
| RSW | Southwest Florida International | Fort Myers | FL |
| SAN | San Diego International | San Diego | CA |
| SAT | San Antonio International | San Antonio | TX |
| SBA | Municipal | Santa Barbara | CA |
| SBN | South Bend Regional | South Bend | IN |
| SBY | Wicomico Regional | Salisbury-Ocean City | MD |
| SCE | University Park | State College | PA |
| SDF | Louisville International (Standiford Field) | Louisville | KY |
| SEA | Seattle-Tacoma International | Seattle | WA |
| SFO | San Francisco International | San Francisco | CA |
| SHR | Sheridan | Sheridan | WY |
| SHV | Regional | Shreveport | LA |
| SJC | Mineta San Jose International | San Jose | CA |
| Codes | Airport | City | State |
| SJU | Luis Munoz Marin International | San Juan | PR |
| SLC | Salt Lake City International | Salt Lake City | UT |
| SMF | Sacramento International | Sacramento | CA |
| SNA | John Wayne | Santa Ana | CA |
| STL | Lambert-St. Louis International | St Louis | MO |
| STT | Cyril E. King | Charlotte Amalie, St. Thomas | VI |
| STX | Henry E. Rohlsen | Christiansted, St Croix | VI |
| SYR | Syracuse Hancock International | Syracuse | NY |
| TEX | Telluride Regional | Telluride | CO |
| TLH | Tallahassee Regional | Tallahassee | FL |
| TPA | Tampa International | Tampa | FL |
| TUL | Tulsa International | Tulsa | OK |
| TUS | Tucson International | Tucson | AZ |
| TYS | McGhee Tyson | Knoxville | TN |
| VPS | Eglin AFB | Valparaiso | FL |
| XNA | Northwest Arkansas Regional | Fayetteville | AR |
| YKM | Yakima Air Terminal | Yakima | WA |


