Appendix F
Regional Airlines Departures by City
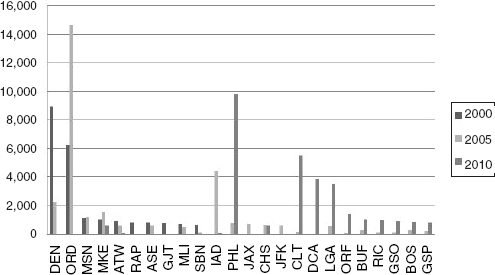
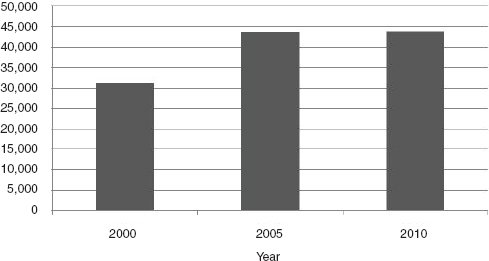
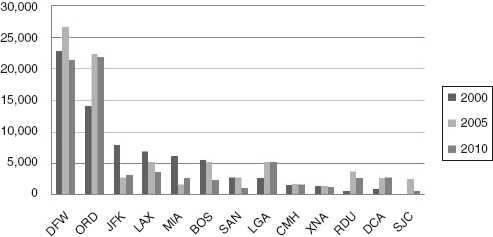
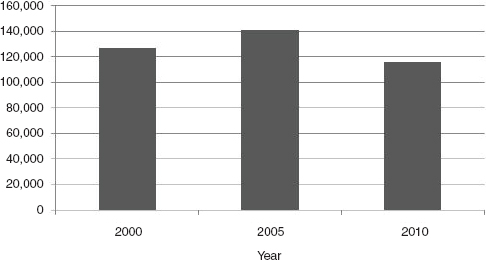
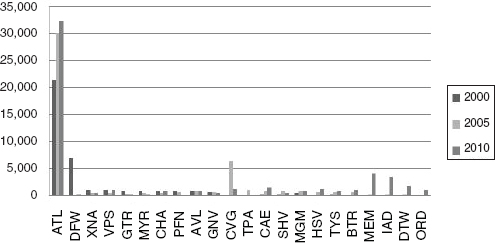
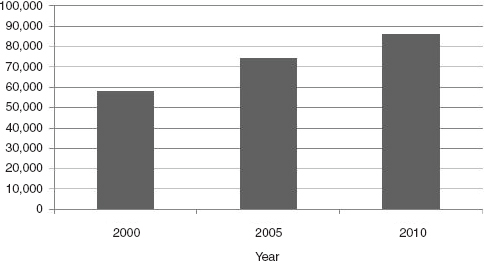
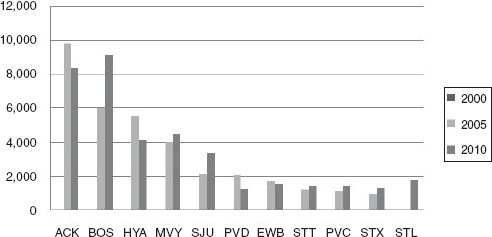
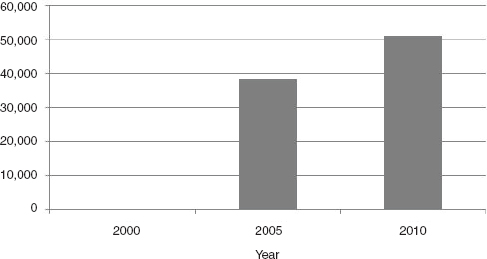
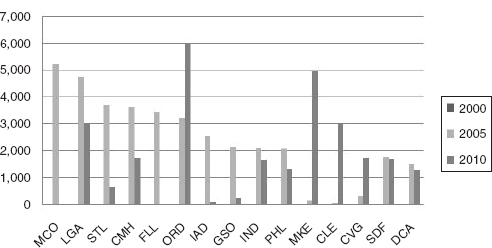
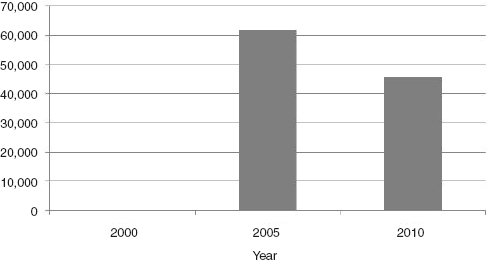
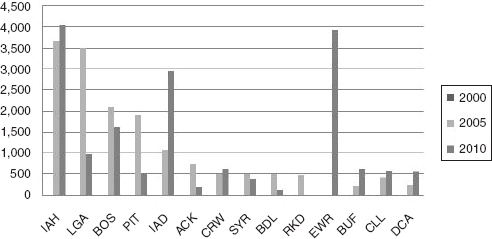
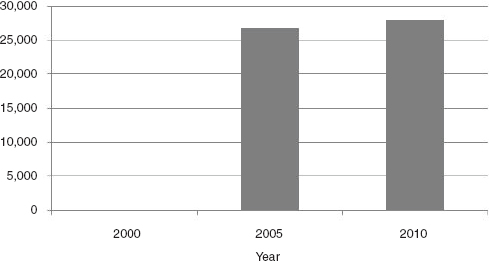
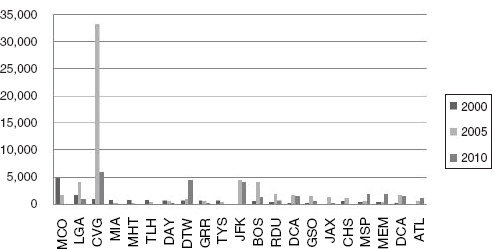
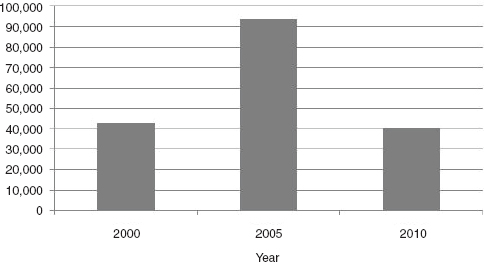
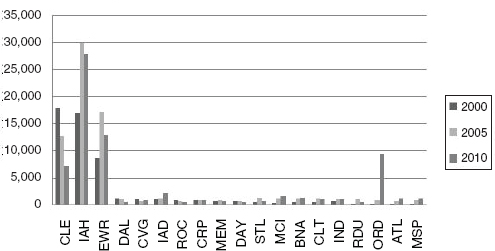
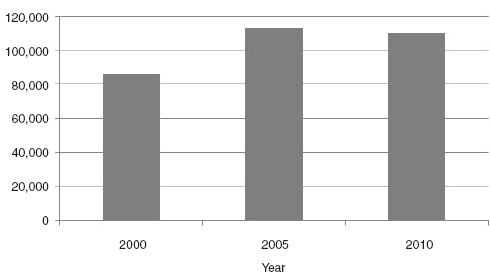
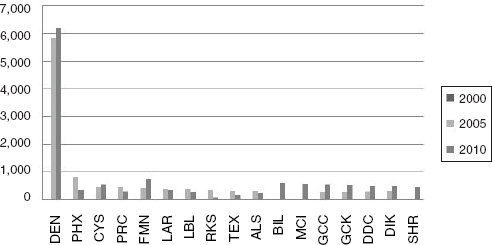
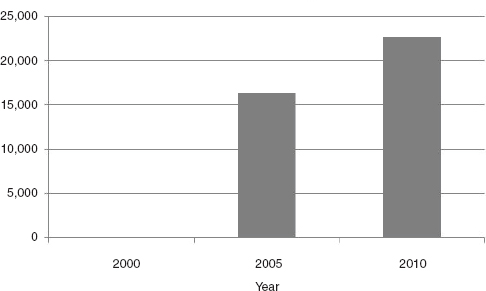
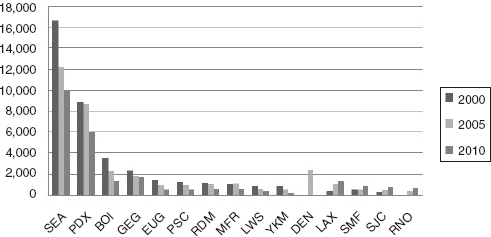
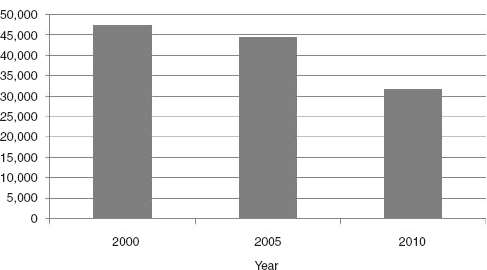
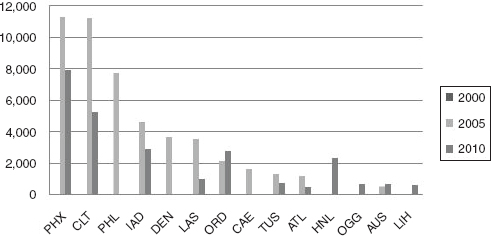
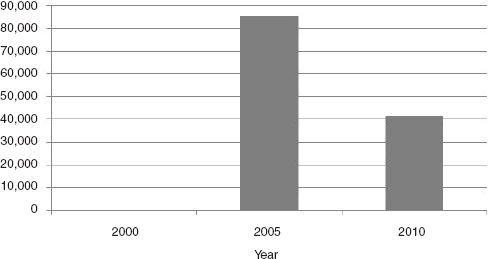
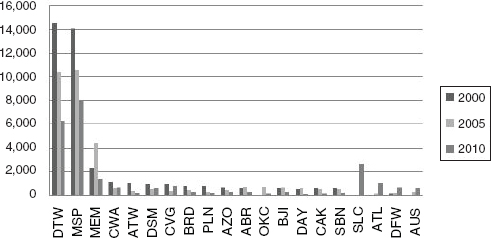
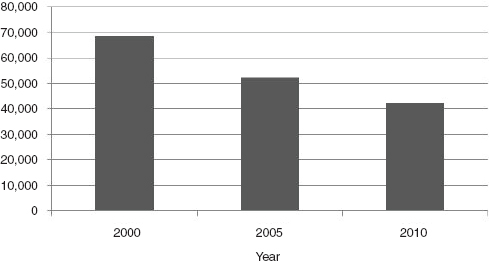
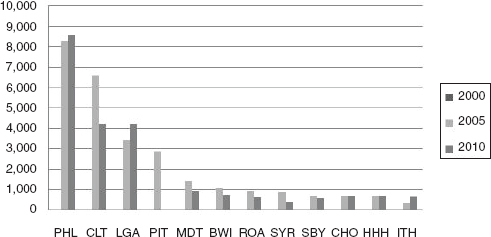
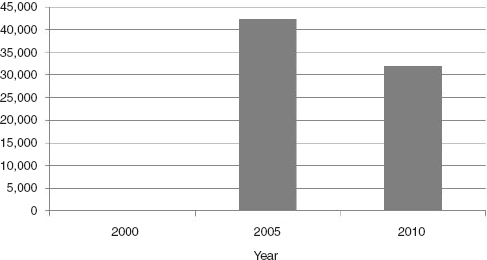
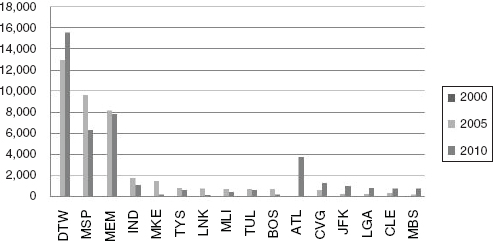
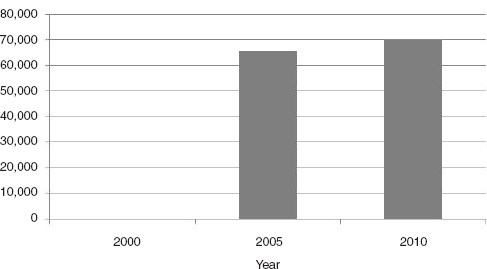
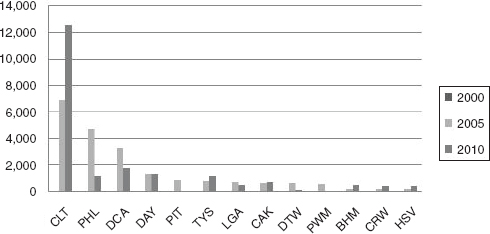
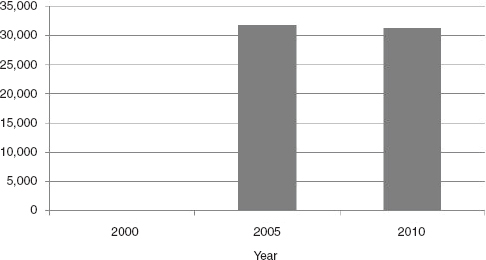
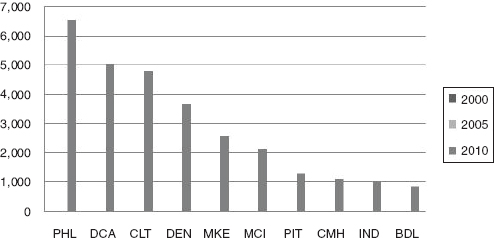
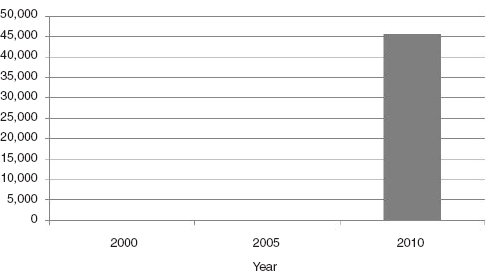
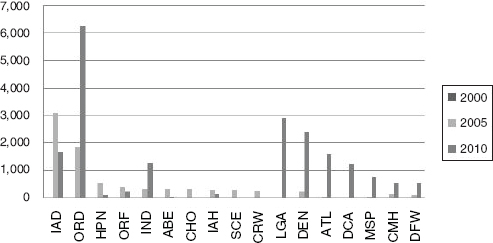
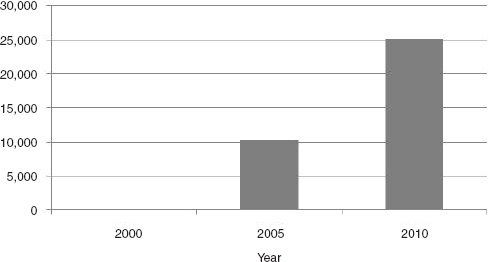
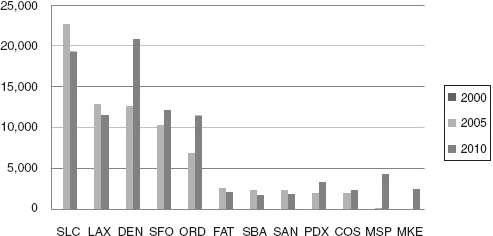
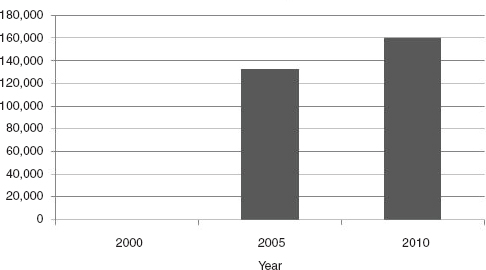
This appendix presents the committee’s analysis of changes in the number of aircraft departures discussed in Chapter 2 for regional airlines. Figures F-1 through F-36, ordered alphabetically by airline, show total departures by airport code (refer to Table E-1 in Appendix E for corresponding cities) and by airline, in the cities most frequently served by that airline and thus in the cities most likely to serve as domiciles for pilots. The data used for this analysis were scheduled aircraft departures taken from Air Carrier Summary: T3: U.S. Air Carrier Airport Activity Statistics provided by the Bureau of Transportation Statistics (n.d.-a) of the U.S. Department of Transportation. The data were from the third quarter of 2000, 2005, and 2010. All carriers that reported more than 20,000 aircraft departures in the third quarter of 2010 were examined. This group consisted of 18 regional airlines.