
3
Economic Perspectives on the Early Childhood Care and Education Workforce
Market forces shape the availability, quality, and price of early childhood care and education (ECCE). Economic analyses illuminate the way this market operates and provides a context for evaluating policies and interventions designed to improve and support the workforce and improve the quality of care. Caregivers, teachers, parents, and providers all respond to numerous interrelated market forces, as well as other influences. Consequently, as policy makers decide whether and how to intervene to achieve important goals—such as improving school readiness, closing achievement gaps, reducing school failure, reducing crime, and increasing graduation rates—economic analyses can point to both intended and unintended consequences, and provide empirical evidence to demonstrate the potential value gained from particular types of investments in early childhood care and education. David Blau, professor of economics at Ohio State University, provided an overview of the way economists think about this market and identified some lessons for policy makers. Lynn Karoly, senior economist at the RAND Corporation, described economists’ efforts to measure the short- and long-term costs and benefits of investing in ECCE.
THE EARLY CHILDHOOD LABOR MARKET
The ECCE workforce has special importance in American society, Blau noted, because policy makers, parents, and researchers care about the development and well-being of young children. Compensation for the
ECCE workforce, as well as benefits, working conditions, training, education, and opportunities for advancement, are important for this group—as they are for workers in any occupation or industry. Blau observed that although these workers have special importance because of the influence they have on children, in the United States our society relies largely on market forces to determine the quantity in which care is available, its quality, and its price. As the ECCE field considers how to craft policies that improve access, availability, and quality of care, researchers need to understand the market factors that affect how parents select or change their care arrangements.
Demand in the early childhood market is a function of how parents select their child care arrangements. Many factors affect these decisions. Parents’ beliefs, preferences, income levels, and constraints (e.g., working hours or transportation) all influence their willingness and ability to purchase child care at alternative prices. Parents will consider the type of care arrangement (e.g., center, family child care, nanny); the developmental quality of the care arrangement; and its convenience and reliability. From an economic perspective, the key point is their willingness to substitute different types and quality of care arrangements in response to different prices. Thus, supply of education and care encompasses the full range of types of care available, even if these types are regulated, funded, or viewed separately by those in the field. Evidence suggests, Blau explained, that parents have a “moderate willingness to substitute” (Blau and Hagy, 1998). In other words, parents are not ready to abandon a care arrangement in response to a small increase in price, but as the price of developmentally appropriate and stimulating care increases relative to alternatives, they are willing to make trade-offs.
The supply of child care, in turn, is influenced by what economists call the “technology” of producing the care and the prices of the inputs—primarily the cost of employing staff with particular levels of skill and qualifications. These factors affect providers’ willingness to offer child care at alternative prices according to quality, type, and location. A key aspect of supply is the degree of flexibility of the technology: Is there more than one way to produce a given level of quality of child care? Blau indicated that considerable flexibility exists in this field: “Must you have, for example, a director with a master’s degree in early childhood education, a lead teacher with a bachelor’s degree, an assistant with a certain level of education and training, a group size of a defined level, and a child/ staff ratio” in order to provide child care of high developmental quality? Observational studies that compare child care centers that all meet certain defined levels of quality have shown that they meet these levels in a variety of ways, Blau explained (Blau, 1997, 2000). International comparisons reinforce this point. In France, for example, the child care system is
very well-regarded, though group sizes and staff-to-child ratios would violate regulations in most U.S. states (Richardson and Marx, 1989). For example, group sizes of 3- to 6-year old children in France’s universal preschool program averaged 25.5 students per class with 1 teacher and 1 assistant, as of 2001–2002 (OECD, 2006). French policy pays close attention to teacher training, however, which may be a less expensive way to meet quality goals.
Another key determinant of supply is what economists call the degree of input specialization—in this case the degree to which the skills of ECCE workers are useful and in demand in other occupations. Here the evidence suggests that the skills needed in early child care and education are not highly specialized, and are valued in other occupations. As a consequence, the labor supply in the child care sector has relatively high elasticity because the wages available are low compared with wages in other sectors that require similar skills. For example, early childhood teachers who possess the required qualifications may choose to leave a preschool position for higher wages in a K–12 teaching position.
Together, the supply of and demand for child care interact to determine the market equilibrium—the prices at which child care of alternative types and quality can be purchased. Thus, consumers’ willingness to substitute one care arrangement for another and the flexibility of the technology jointly determine the outcomes observed in the market. However, other forces may impinge on the child care market. Government policy, in particular, may influence the demand for different types of child care or levels of quality by imposing standards and regulations or by providing subsidized care.
Labor is the main input in the production of child care, Blau observed, and the demand by providers for child care workers with different skill levels derives from the demand by parents for child care of different types and quality. Empirical analyses of the labor market for child care show that:
-
High-quality (developmentally stimulating) care is costly, and consumers are moderately sensitive to price. Many consumers feel “priced out” of the market for high-quality care, which limits the demand for skilled staff (Blau and Mocan, 2002);
-
The supply of child care workers is relatively elastic, so an increase in demand for child care does not exert much upward pressure on wages for child care workers (Blau, 1993, 2001); and
-
Skilled staff have good opportunities in other occupations and sectors, so turnover is high (Blau, 1992, 2001).
Blau considered whether these findings show evidence of market failure and thus provide a rationale for the government to intervene in the market to improve outcomes. He defined market failure as a situation in which the quantity of a service (or product) that is available based on the equilibrium between supply and demand is not equal to the quantity society would deem optimal—in this case the market would have failed if the supply of high-quality child care was not sufficient to meet the needs of children and families. Unfortunately, economists cannot identify the socially optimal amount of high-quality child care. First, strong evidence of the long-term benefits of child care is relatively scarce—even though many studies exist (see Costs and Benefits of Investing in Early Childhood Education in this chapter). In Blau’s view they do not yield sufficient empirical support for firm or precise conclusions. Second, the socially optimal level is determined in part by value judgments.
Data on outcomes could provide further insight into the issue of market failure, Blau observed. Figure 3-1 shows trends in families’ expenditures on child care, drawn from a household survey (the Survey of Income and Program Participation [SIPP]). These data indicate that the real (inflation-adjusted) average weekly expenditure on child care per family that pays for care has increased by about 3.3 percent per year over 20 years. The total number of families paying for care has also increased, by about 2.9 percent per year on average. Together, those two changes imply an average annual growth rate of 6.3 percent per year in total child care expenditures over a 20-year period.
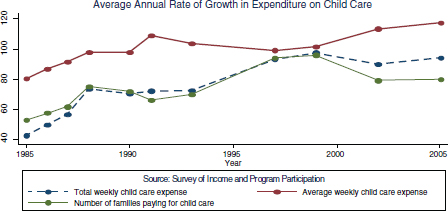
FIGURE 3-1 Trends in family child care expenditure.
NOTE: Total weekly child care expense in units of $10M; average weekly child care expense in real inflation-adjusted dollars; number of families paying for child care in units of 100,000; all dollar amounts in 2009 dollars.
SOURCE: Blau, 2011.
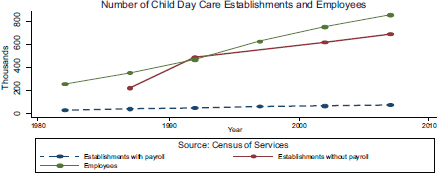
FIGURE 3-2 Trends in the number of establishments and employees.
SOURCE: Blau, 2011.
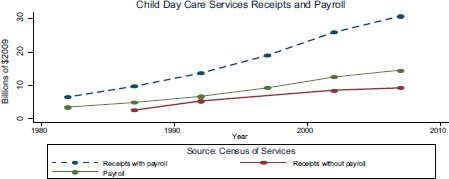
FIGURE 3-3 Trends in receipts and payroll.
SOURCE: Blau, 2011.
At the same time, data from the U.S. Census Bureau’s Census of Service Industries for a recent 25-year period show that the number of child care establishments with payrolls has increased at an average annual rate of 3.6 percent; the number of employees has increased 4.8 percent per year; and the number of establishments without payrolls (individuals caring for children at home) has grown by 9 percent per year (see Figure 3-2). Figure 3-3 shows rapid growth in the receipts taken in by these establishments and in their payroll expenditures.
The Occupational Employment Statistics (OES) published by the Bureau of Labor Statistics (BLS) show that the number of child care workers grew at an average rate of 4.6 percent annually during a recent 10-year period, compared to a lower (1.4 percent) annual growth rate among the number of preschool teachers. Total employment in all occu-
pations grew by just 0.3 percent per year on average during that same period. In contrast to rapid growth in the size of the child care sector, hourly wages for child care workers have grown by just 0.5 percent per year on average (0.8 percent for preschool teachers, as compared with wages for all workers, which have grown by 0.7 percent).1
These data paint a consistent and surprising picture, Blau explained. Why did the sharp increase in demand for child care not result in larger increases in wages for the ECCE workforce? Blau suggested that the primary reason is the highly elastic supply of labor for child care work. For example, he noted, many female immigrants from developing countries have few good employment options in the United States and are willing to work in child care for relatively low wages. Thus an increase in the supply of these workers is likely to depress wages. One might expect that this would apply mainly to the relatively low-quality segment of the child care market, but because parents are moderately sensitive to price, it is likely that more highly skilled child care workers’ wages would also be depressed, as researchers Hock and Furtado (2009) found. They report that low-skilled immigrants grew from 6.1 percent of the working population in the United States in 1980 to 10.1 percent in 2000. This trend contributed to the decline in child care wage rate, compared with what might have occurred in the absence of an increase in immigration. The decline affected child care workers throughout the skill distribution.
While frustrating to many, these trends alone do not imply market failure, Blau explained. But he sees other significant problems in the child care market. In his view, the failure is not on the supply side of the equation, but on the demand side. Parents do not have sufficient willingness (or capacity) to pay for high-quality child care. High-quality care benefits not only individual children, but also society in general (this point is discussed further below), yet parents tend not to consider the social benefit. In response to participant comments, Blau acknowledged practical limits to what some parents can pay. Although parents could take out loans to pay for child care and education, for example, as they do for college, few are likely to take that step, at least without substantial evidence that doing so would be critical to their own children’s development.
Evidence of the benefits of high-quality preschool for disadvantaged children provides strong reasons to suggest that society should pay the cost of improving their access to high-quality care and education. The case for supporting children and families who are not disadvantaged is more difficult, Blau explained. The empirical evidence for the long-term
![]()
1 A participant suggested that the constraints of child care subsidies or the inclusion of paid relatives in the analysis could potentially distort the nature of the overall picture.
benefits of high-quality child care, as compared with mediocre child care, for typical middle-class children is more limited.
Making the case for specific types of public intervention is difficult without strong empirical evidence, Blau noted. An issue from the K–12 education context illustrates the point. Abundant evidence exists that effective teachers have a significant impact on student learning, Blau explained. However, little evidence exists that specific qualifications, such as degrees earned, training, and certification can identify the successful teachers. Thus, proponents of the social benefit of increasing spending to improve teacher effectiveness in schools encounter persistent skepticism (Hanushek, 2011; Hanushek and Rivkin, 2007).
Blau’s conclusion is that market intervention will be most successful if it targets the source of the failure, which he views as the relatively low demand for high-quality care. Interventions such as subsidies for high-quality care and public awareness campaigns could increase demand, which could, in turn, raise wages for skilled staff. Addressing the supply side by, for example, imposing more stringent education and training requirements, or providing subsidies to encourage training and boost wages, is less likely to be successful, he argued. Regulations that do not come with financial support for improving quality often have unintended negative consequences. For example, if a center is faced with the requirement to have smaller groups and more staff, it may only be able to achieve that result by reducing wages. Wage or training subsidies do not work well when the labor supply is very elastic, he explained, because workers still have higher paying alternatives.
The realities of the marketplace, Blau concluded, show that the choices that parents, caregivers and teachers, and employers make, as well as the choices policy makers make by allocating public funding or imposing regulations, all affect the child care market in both positive and negative ways. While the market may not have failed, in a technical sense, he suggested, the problems with available child care options could be more easily resolved if all actors in the system had a better understanding of the nature and benefits of high-quality care.
COSTS AND BENEFITS OF INVESTING IN EARLY CHILDHOOD EDUCATION
Interest in the empirical evidence of the short- and long-term returns to investments made in early childhood care and education is increasing, Karoly explained. Resources are scarce, both for foundations and other private entities that could contribute in this area, as well as for public agencies. Funders in all categories are increasingly emphasizing results-based accountability. Thus, these groups benefit from data that not only
demonstrate immediate program benefits, but also show how long-term benefits translate into specific savings to governments, including data that estimate the dollar value of benefits to society. Data that indicate that a $1 investment will yield a return of $X can be very powerful in providing a basis for choosing one program over another or making decisions about current or future program spending in general, she noted.2
Karoly described several different analytic approaches to this challenge:
-
Cost analysis, which measures only costs, not outcomes;
-
Cost-effectiveness analysis, in which the impact for one outcome is measured, in natural units, relative to costs;
-
Cost–savings analysis, in which the benefits (and costs) to the government of all outcomes are valued in dollars and compared with costs; and
-
Benefit–cost analysis, in which the benefits (and costs) for society—for both program participants and nonparticipants—of all outcomes are valued in dollars and compared with costs.
Each approach begins with careful calculation of program costs, relative to the status quo or to some other option. The next step, cost-effectiveness analysis, asks what it costs to achieve a particular degree of change in one particular outcome. This could be done separately for more than one outcome, but it does not involve assigning a dollar value to the outcomes. Cost–savings analysis and benefit–cost analysis both entail assigning a dollar value to the full range of program outcomes, which is a more difficult challenge (see NRC and IOM, 2009).
These tools have been used only to a limited degree in the early childhood context, Karoly explained. Recently, however, researchers have begun to use them to examine the economic returns on investments in specific programs for children from birth to age 5. A 2005 RAND Corporation study (Karoly et al., 2005) examined 20 interventions for this age group and found that 19 of them showed favorable outcomes for participating children or their parents. These programs are listed in Table 3-1, where they are arranged to distinguish between programs that focused on home visiting and parental education and those that provided early childhood education.
Karoly presented the results of benefit–cost analyses for six of these programs (Karoly, 2011a). The ratios of benefits to costs shown in Figure 3-4, some based on short-term follow-up data and some on long-term
![]()
2 Karoly noted several sources of further detail on these issues: Karoly (2011a); Karoly et al. (2005); Kilburn and Karoly (2008).
TABLE 3-1 Early Childhood Interventions with Demonstrated Favorable Outcomes
| Six Effective Programs Have Associated Benefit–Cost Analysis (BCA) | ||
| Home Visiting/Parent Education | Early Childhood Education/Combination | |
| Dare to Be You | Abecedarian Program* | |
| Developmental Supporting Care: Newborn Individualized Developmental Care and Assessment Program (DSC/NIDCAP) | Chicago Child-Parent Centers (CPC)* | |
| Home Instruction for Parents of Preschool Youngsters (HIPPY USA)* | Comprehensive Child Development Program (CCDP) | |
| Incredible Years | Early Head Start | |
| Nurse Family Partnership (NFP)* | Early Training Program | |
| Parents as Teacher | Head Start | |
| Project CARE (Carolina Approach to Responsive Education) | Houston Parent-Child Development Center (PCDC) | |
| Reach Out and Read | Infant Health and Development Program (IHDP)* Oklahoma Universal Preschool |
|
| Perry Preschool Project* | ||
| Syracuse Family Development Research Program | ||
* Programs for which benefit–cost analysis has been conducted.
SOURCE: Karoly, 2011b. Based on Karoly et al., 2005.
results, range from no positive economic returns (Infant Health and Development Program [IHDP]) to 16.1:1 (Perry Preschool Project at the age 40 follow-up). Karoly drew several conclusions from these data. First, regarding the IHDP, the one program in the analysis that did not show positive economic returns, she cautioned that such results can occur for several reasons. “Many of the benefits that come out of these programs, particularly when you’re looking at the early stages of the follow-up … are harder to quantify in economic terms,” she observed. Longer term benefits to which the analyst did not assign a dollar value may emerge later. She also noted that it was not just the small-scale demonstration
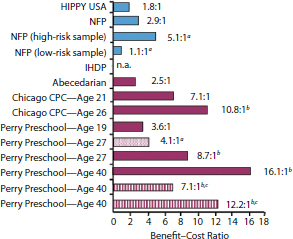
FIGURE 3-4 Results of benefit–cost analyses for six programs. NOTE: A benefit–cost ratio is the ratio of the present discounted value of total benefits to society as a whole (participants and the rest of society) divided by present discounted value of program costs. The discount rate is 3 percent unless otherwise noted. The value of reducing intangible crime victim costs are excluded unless otherwise noted. CPC: child-parent centers; HIPPY USA: Home Instruction for Parents of Preschool Youngsters; IHDP: Infant Health and Development Program; NFP: Nurse-Family Partnership.
a Discount rate is 4 percent.
b Includes value of reduced intangible crime victim costs.
c Reported range of estimates under alternative assumptions regarding the economic cost of crime.
SOURCE: Karoly, 2011b. Based on Karoly, 2011a.
programs that generated positive economic returns. Critics sometimes dismiss the economic benefits shown by the Perry Preschool Project, for example, on the grounds that it would be difficult to replicate. The results for HIPPY USA: Home Instruction for Parents of Preschool Youngsters (1.8:1) and the Chicago Child-Parent Centers program (7.1:1 at age 21 and 10.8:1 at age 26) counter that point, however. Moreover, it is not just the most expensive, intensive programs that show favorable benefit–cost ratios, as HIPPY USA also demonstrates. On the other hand, it may be that programs that target children with the greatest needs show larger returns compared with those that serve more advantaged children. Perhaps most important, she noted, is that effective programs with longer term follow-up tend to show larger returns than those that only had shorter term follow-up results. That is, the more data that are accumulated, and the
greater the time for benefits to emerge, the greater the quantifiable value of the return on investment.
Karoly cautioned that these results cannot be used to compare the programs directly because they include a mix of types of interventions, as well as of lengths of follow-up, outcomes measured, target populations, and analytic methods. These results are important, she noted, because they demonstrate that investments in early childhood programs that are of high quality and are implemented well provide concrete benefits. Indeed, she observed that the researchers were conservative in their long-term estimates of benefits, and that it is probable that the economic value of a number of these programs is greater than the analyses indicate at this point.
Karoly enumerated significant challenges to this type of analysis, however. First, it requires rigorous analysis of the incremental costs, in comparison to a baseline, and programs do not always keep careful records of all of the costs of implementing a new program. The costs of the alternative approaches that would have been used in the absence of the new program may also be difficult to capture. Second, rigorous evaluations—either experimental or rigorous quasi-experimental studies—are needed to establish program effects.3
The benefits of these types of programs may include effects for both parents and children and for society at large in a broad range of domains (e.g., education, employment, mental and emotional health, involvement with the justice system), some of which are easier to measure than others. Placing a dollar value on benefits in these areas poses challenges as well. The field is just beginning to develop standardized methods that will make comparisons more valid, she added.
Despite these challenges, Karoly advocates greater use of benefit–cost analysis and cost-effectiveness analysis in the early childhood sphere, and she highlighted areas where this approach could be especially valuable. Cost-effectiveness or benefit–cost analysis of marginal changes in program features, policy alternatives, and specific interventions could all be very useful. For example, if a state legislature wishes to improve early learning and considers increasing spending by $500 per child, one could use cost-effectiveness analysis to determine whether a particular outcome for children could be produced for that price. Alternatively, one could assess a variety of interventions—such as changing group sizes or ratios, or increasing education requirements for teachers—to determine which approach would provide the most valuable benefit. Another pos-
![]()
3 Quasi-experimental designs are those used where randomized controlled designs are not possible, practical, or ethical. They use alternate statistical procedures to isolate causal effects.
sibility would be to compare several possible approaches to improving professional development for teachers to see which would produce the largest gains, either in terms of child development or quantified dollar benefits. Producing this type of information for supporting policy decisions, Karoly believes, will require that cost-effectiveness and benefit–cost analysis be incorporated into the next generation of research on early childhood program design and interventions.
SUMMARY
In summary, Blau indicated that despite the tremendous increase in the demand for child care, wages for workers have remained relatively flat, due in part to the elastic supply of people willing to work in ECCE for relatively low wages, as well as their high rates of turnover. These factors coupled with relatively low demand for high-quality care make increasing wages difficult. This dilemma has led some to consider whether and how government might play a role in addressing the cycle of low compensation and high turnover. As Karoly’s presentation showed, one reason that governments might elect to play a role in addressing these problems is because of the demonstrated positive economic returns of high-quality care and education, particularly for disadvantaged children. Effective care and education depends in large part on having a workforce with the right combination of skills, attitudes, behaviors, and characteristics that functions within supportive workplaces (topics examined in further detail in Chapter 4). According to Karoly, new approaches to calculating the costs and benefits of child care are promising and may prove particularly useful for policy makers in weighing the most effective investments in the early childhood care and education workforce.


